Embed Size (px)
Citation preview
Using the Semantic Web and Web Apps to Connect Radiologists and Oncologists
Kleberson A. Serique Department of Computer Science
University of São Paulo São Carlos SP, Brazil
e-mail: [email protected]
Alan Snyder, Debra Willrett, Daniel L. Rubin
Department of Radiology Stanford University Palo Alto CA, USA
e-mail: [email protected]
Dilvan A. Moreira Department. of Computer Science
University of São Paulo São Carlos SP, Brazil
e-mail: [email protected]
Abstract— Medical imaging plays an important role in the diagnosis, prognosis and treatment of cancer. Quantitative and qualitative data about medical images are vital components of a radiological report and are very important to the oncologist that requests the radiological exams. However, traditional methods to register these data are inefficient and error prone. The use of unstructured free text in radiology reports makes it impossible to perform even simple calculations, such as changes in lesion dimensions. It also makes the aggregated analysis of many reports difficult. Free text reports lack a reference to the image regions of the finds they refer to and are not machine-computable. This paper proposes a method to provide support for collaborative work among radiologists and oncologists (providing care or taking part in clinical trials) using an imaging web tool, ePAD, to generate structured radiology reports that can be machine-computable. It also shows how ePAD uses RadLex ontology terms and the Annotation and Image Markup (AIM) language (and templates) to generate the reports.
Keywords-component; radiology imaging; semantic web; ontology; web app; AJAX; Java; oncology; biomedical informatics; medical collaboration; DICOM; AIM
I. INTRODUCTION Radiographic images play an important role in the
diagnosis, prognosis and treatment of cancer. They are used by health care providers and during research trials of new drugs. Images are used to identify location, extent and features of tumor lesions in qualitative (e.g. lesion density) or quantitative (e.g. lesion dimensions) ways. The interpretations of these images will inform the disease state, again in qualitative, "partial response to treatment", or quantitative, "50% decrease in tumor burden" ways. Oncologists use images to determine clinical stage and guide initial treatment decisions. They also use them to monitor response to treatment; duration and changes in therapy; and recurrence or progression of lesions [1].
During the last decades, there was a significant advance in the imaging tools available to physicians. Most modern radiology departments have digital image acquisition equipment, such as Computed Tomography (CT) and Magnetic Resonance Imaging (MRI) machines. Radiograph images are saved and distributed by Picture Archiving and Distribution Systems (PACS) [2] using the Digital Imaging and Communications in Medicine (DICOM) [3] standard.
DICOM image viewers are now available as Web applications that can be integrated into electronic health records. Oncologists are now able to view, not only the radiologist report, but also the images in their clinic and make treatment decisions based on them.
Despite this informatics advances, gaps remain in supporting the communication needs of radiologists and oncologists in the interpretation of image findings for cancer care. In the current workflow [1]:
• Oncologists create radiology requisitions, in paper or electronically, which communicate the indication, timing, modality, and body part to be evaluated by the requested study.
• After the images are taken, the radiologist reviews the images and creates a radiology report with his findings.
• The oncologist receives and reviews the report and images to inform his diagnostic and treatment decision.
The workflow execution is repeated throughout the patient treatment and, in each cycle, a different radiologist may be in charge. Oncologists (or someone else) have to make sure that radiologists have enough information about the patient and access to older images to prepare precise reports. This workflow has several limitations. A survey by Jaffe et al [4] found a significant discordance between the radiologist's practice patterns and the opinions and expectations of oncologists [5] on the types of finds that should be reported. Beyond communication failures and incomplete quantitative data collection, there are several limitations for quantitative assessment of tumor response in clinical trials. In another study, only 26% of radiology reports of clinical trial patients had enough information recorded to perform quantitative Response Evaluation Criteria in Solid Tumors (RECIST) [22] measurements at follow-up studies [6].
A key problem in this whole process is that radiology reports are recorded as non-structured free texts, what makes it impossible to perform even simple calculations of changes in lesion dimensions over time or estimates of tumor burden (those estimates are based upon lesion measurements). Free text reports also lack a reference to the image region of the finds they refer to and are not machine-computable. That is a really big problem in clinical trials, where data about patient
lesions, such as tumor burden, have to be consistent to be integrated and statistically analyzed.
On the oncologist's side, there is no current technology to enable him/her to directly access the image regions corresponding to each abnormality described in the radiology report. The oncologist must use the textual descriptions and the image number references, in the report, as a guide to re-identify the lesions of interest, a slow and error prone process. Some image viewing systems allow all images with image markup to be viewed together as key images, decreasing the search space, but radiologists do not mark all regions of interest.
II. EXISTING ANNOTATION TOOLS As described in the last section, there are many
limitations in the current clinical workflow for oncology imaging. There are several efforts in medical informatics trying to address some of the issues.
For the radiology requisition stage, work is ongoing to transform the American College of Radiology (ACR) Appropriateness Criteria, a set of evidence-based guidelines to assist physicians make the most appropriate use of imaging studies for specific clinical conditions, into a computable format to be included into order entry systems [7][8]. Another effort, led by the RSNA, is the development of the RadLex Playbook [9] ontology to provide a standard, comprehensive lexicon of radiology orderables and imaging procedure step names. This could improve the consistency of imaging procedure names across institutions, a vital step for image data exchange across institutions both for clinical care and research.
A. Ontology and Annotation Standards For radiology reports, the current approach for managing
lesion feature information is to record these image metadata on paper or electronically, using Case Report Forms (CRFs), in free text. The main limitations here are the inability to have the reports in a structured form and link the image metadata to the regions they refer to in the source image.
To produce reports that are structured and machine-computable constrained values, chosen from ontologies or controlled terminologies, have to be used. The RSNA has developed the RadLex [10] ontology describing more than 30,000 radiology-related concepts and relationships. Early applications of RadLex include radiology decision support, reporting tools, and search applications for radiology research and education [10]. The RSNA reporting templates use RadLex terms to encode the content of their image findings [11]. Other ontologies, like the Fundational Model of Anatomy (FMA) [12] can also be used.
To link the image metadata to image regions, first we have to distinguish between image markup and image annotation: Image markup refers to the graphical display of information describing a region on an image; Image annotation refers to the information conveyed by the markup (meta-data) that describes the region content.
DICOM Structured Reporting (DICOM-SR) [13] is the industry standard for representing image meta-data generically. DICOM-SR specifies the classes used for
transmission and storage of clinical documents including free text reports and structured information [14].
The Annotation and Image Markup (AIM) is another standard being developed as part of the NCI Cancer Biomedical Informatics Grid (caBIG) program [15]. The caBIG is a program created in 2004 by the National Cancer Institute (NCI) with the goal of helping sharing IT infrastructure, data and applications among the more than 50 cancer centers in the US [18].
AIM provides an information model for storing the key information about lesions needed to describe lesions and apply quantitative criteria of response assessment, such as lesion identification, location, size measurements, method of measurement, and other quantitative features. The AIM files also convey information about the image markup including the source image file, image coordinates, quantitative features such as measurements, and qualitative observations. The image observations are encoded using an ontology, such as RadLex [10] which contains radiology-specific terms. So AIM is capable of producing structured machine-computable reports with links to the image regions of interest. It can also be used with DICOM-SR.
B. Image Annotation Tools Image annotation tools that implement the AIM standard
for creating image metadata in a structured format are being developed [16]. They are crucial to the success of AIM because the language has a complex data structure to represent the information collected by radiologist and cannot be used directly by users.
Image annotation templates (AIM templates) are incorporated into image annotation tools to facilitate structured capture. They combine data elements for use in a specific context. For example, there are templates for annotation of liver lesions on abdominal CT scans and to perform quantitative RECIST measurements.
In 2005, the caBIG, created the In Vivo Imaging Workspace to promote the use of medical images in cancer research. Its main goal is to promote advances in the field of Radiology Informatics through the development, optimization and validation of computational tools to extract knowledge from medical images in vivo and improve, in this way, the cancer patient outcomes [18].
Recently, two projects created tools for semantic annotation of medical images using AIM: AIM ClearCanvas Workstation [19] and Osirix-iPad [20] (recently renamed to Osirix-ePad). Those are the only two tools we found in the literature that supported the creation and edition of AIM files.
C. AIM ClearCanvas Workspace ClearCanvas is an open source solution package that
includes an image server (PACS), a RIS and a workstation client program to visualize medical images, compatible with the Windows operating system [19]. The AIM ClearCanvas Workspace project was developed using the ClearCanvas Workspace program. This tool allows the search of images and medical studies in the National Biomedical Imaging Archive, an open service to provide users, in a safe way, with
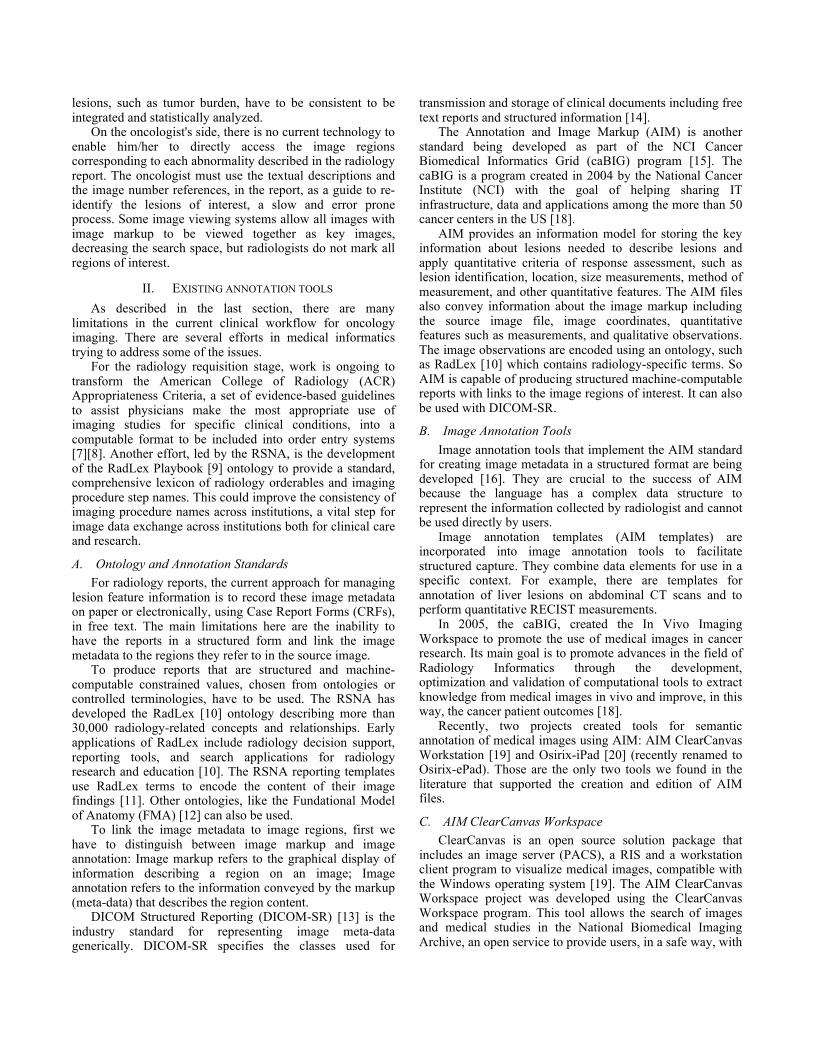
storage, search and identification of images. It also included a set of annotation functionalities:
• AIM TCGA (The Cancer Genome Atlas) template tool, allows annotations based on questions and answers captured using a template.
• AIM object locator, lists all AIM objects in a study (set of images), without having to go through all images in it.
• AIM Details tool, allows the detailed visualization of the anatomic entity information and image observations when a user selects a graphical markup for an annotation already existent.
• Line measurement tool, allows the user to measure the biggest lesion diameter and calculate its approximate size.
In Figure 6, the tool is showing an annotation form. Label 1 shows the tool activation button, label 2 fixes the popup form to the main window and label 3 shows the AIM TCGA template based form.
Figure 1. Semantic annotation and image markup in the AIM
ClearCanvas Workstation
When the user fills up the form with his/her annotations, the system saves them in AIM/XML format. The annotated image remains unchanged, however the annotation files have a set of pointers to the images that have been annotated.
D. OsiriX-iPad The OsiriX-iPad is a plug-in for OsiriX, which is open
source software to navigate and visualize medical images capable of exploring big datasets of multidimensional modalities [21]. OsiriX is a stand-alone application for the MacOS X operating systems. It was developed using an architecture based on open source components, including an image database.
OsiriX modular architecture facilitates the creation of plug-ins. For that reason, it was chosen to be the base application for Osirix-iPad [16].
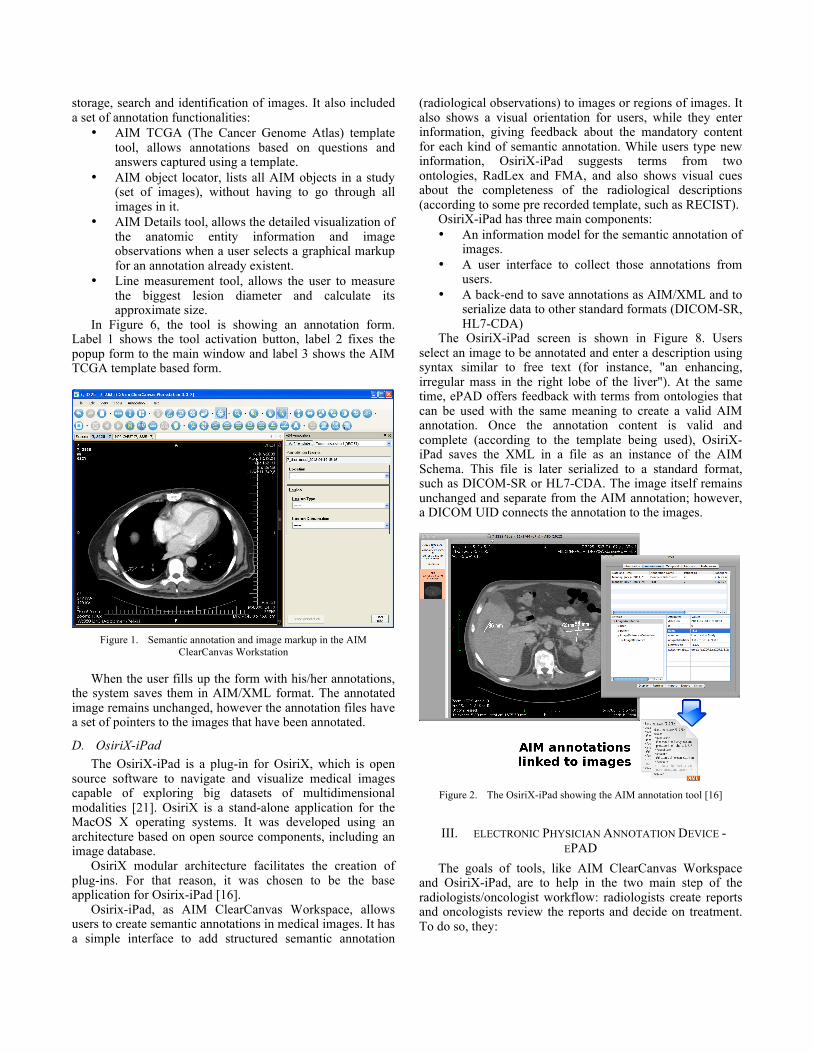
Osirix-iPad, as AIM ClearCanvas Workspace, allows users to create semantic annotations in medical images. It has a simple interface to add structured semantic annotation
(radiological observations) to images or regions of images. It also shows a visual orientation for users, while they enter information, giving feedback about the mandatory content for each kind of semantic annotation. While users type new information, OsiriX-iPad suggests terms from two ontologies, RadLex and FMA, and also shows visual cues about the completeness of the radiological descriptions (according to some pre recorded template, such as RECIST).
OsiriX-iPad has three main components: • An information model for the semantic annotation of
images. • A user interface to collect those annotations from
users. • A back-end to save annotations as AIM/XML and to
serialize data to other standard formats (DICOM-SR, HL7-CDA)
The OsiriX-iPad screen is shown in Figure 8. Users select an image to be annotated and enter a description using syntax similar to free text (for instance, "an enhancing, irregular mass in the right lobe of the liver"). At the same time, ePAD offers feedback with terms from ontologies that can be used with the same meaning to create a valid AIM annotation. Once the annotation content is valid and complete (according to the template being used), OsiriX-iPad saves the XML in a file as an instance of the AIM Schema. This file is later serialized to a standard format, such as DICOM-SR or HL7-CDA. The image itself remains unchanged and separate from the AIM annotation; however, a DICOM UID connects the annotation to the images.
Figure 2. The OsiriX-iPad showing the AIM annotation tool [16]
III. ELECTRONIC PHYSICIAN ANNOTATION DEVICE - EPAD
The goals of tools, like AIM ClearCanvas Workspace and OsiriX-iPad, are to help in the two main step of the radiologists/oncologist workflow: radiologists create reports and oncologists review the reports and decide on treatment. To do so, they:
• Help radiologists create structured semantic rich reports that are guaranteed to be complete, following some pre-agreed standard template (like RECIST).
• Help oncologists review the reports, as they can easily retrieve the reports and the associated images linked to the finds in the report. Because the reports are complete, oncologists will have all the information they need in a format they expect.
• Help radiologists doing follow up work on patients, as they can easily retrieve older image studies from a central server with all the relevant information.
• Help oncologist follow patient treatment progress, as the semantic information about the patient lesions can be used by other tools to plot graphics and suggest treatment regimens.
But AIM ClearCanvas Workstation and OsiriX-iPad are desktop applications, one for Windows another for Mac OS running in desktop computers. That situation creates a lot of problems for users. They have to install those applications in their computers and keep them up to date, what can be a difficult task for physicians without much computer knowledge. That can be even more difficult for people working in corporative environments, like hospitals, where any software has to go through a TI department and be managed by them. Users also expect applications to run in multiple devices, like mobile devices (some radiology applications are already available for the Apple iPad).
All tools for AIM are, right now, at an early development stage, so we decided to address this problems creating the ePAD tool (electronic Physician Annotation Device) [22]. It aims to enable radiologists and oncologists to collect and assess quantitative and qualitative information aspects of lesions (location, measurements, and observations about the measurable disease) while performing their routine work in the clinical and research workflow using only a default web browser. This information is stored in AIM format in a server. Because ePAD is a web application, there are no installation or update issues for physicians, IT can still manage it centrally (if they wish) but that entails managing just a web server, it can be integrated more easily into any workflow. As a bonus, it will run in any new devices such as tablets or Microsoft Surface (interactive table surface) that have web support.
In this paper, we present the ePAD and discuss its shortcomings and future directions. The main goal of this version was to be a proof of concept piece of software.
ePAD was developed using only HTML and Ajax standard, most of the code was written using Google Web Toolkit (GWT). Communication between ePAD and the PACS servers occurs via a proxy server. We are also developing some vendor-specific API calls, whenever necessary, to make the integration even more seamless.
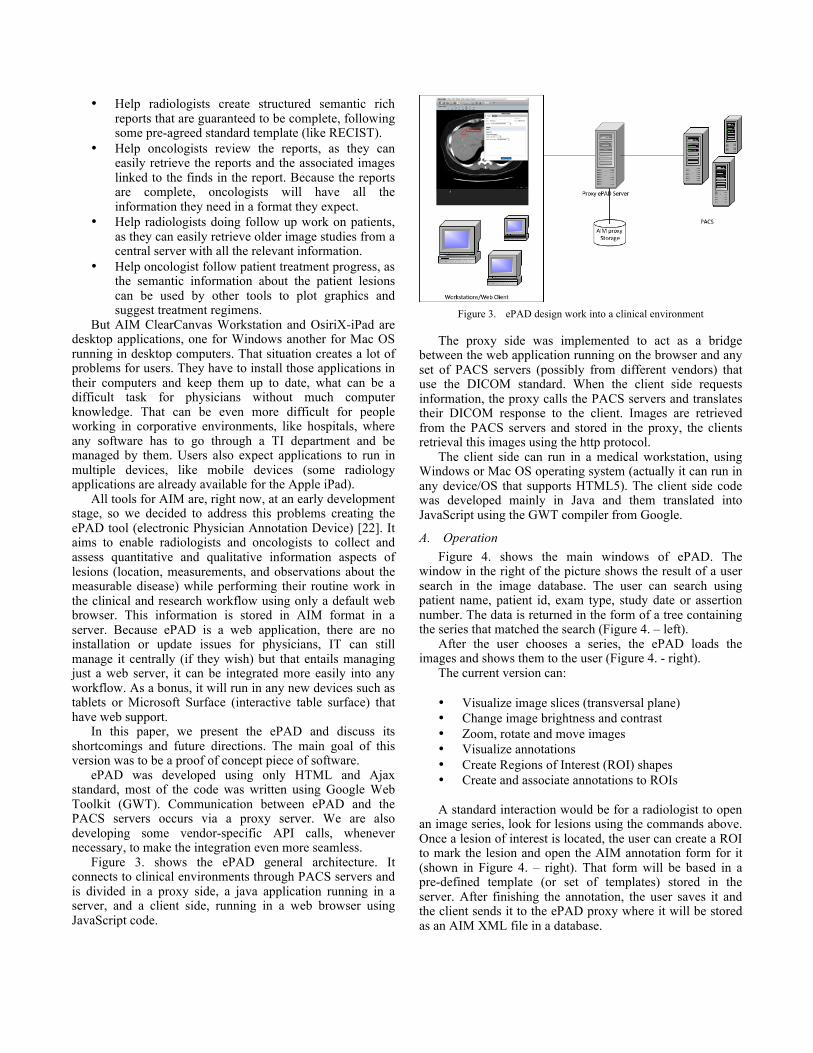
Figure 3. shows the ePAD general architecture. It connects to clinical environments through PACS servers and is divided in a proxy side, a java application running in a server, and a client side, running in a web browser using JavaScript code.
Figure 3. ePAD design work into a clinical environment
The proxy side was implemented to act as a bridge between the web application running on the browser and any set of PACS servers (possibly from different vendors) that use the DICOM standard. When the client side requests information, the proxy calls the PACS servers and translates their DICOM response to the client. Images are retrieved from the PACS servers and stored in the proxy, the clients retrieval this images using the http protocol.
The client side can run in a medical workstation, using Windows or Mac OS operating system (actually it can run in any device/OS that supports HTML5). The client side code was developed mainly in Java and them translated into JavaScript using the GWT compiler from Google.
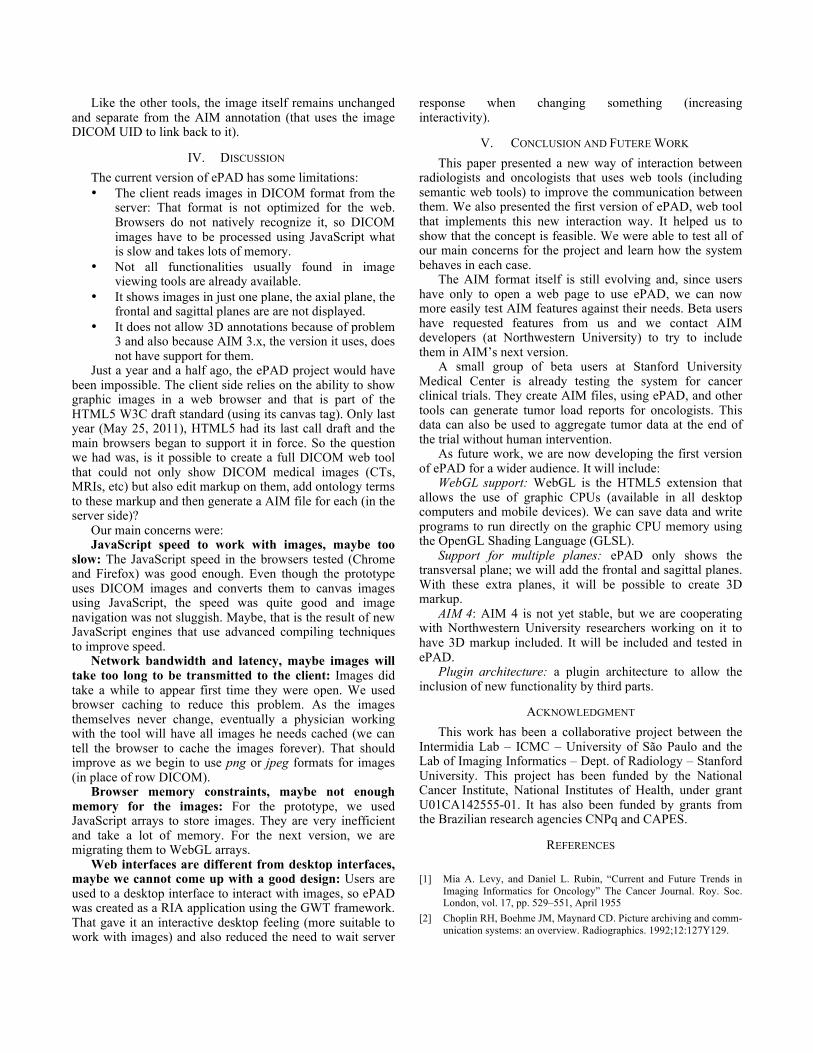
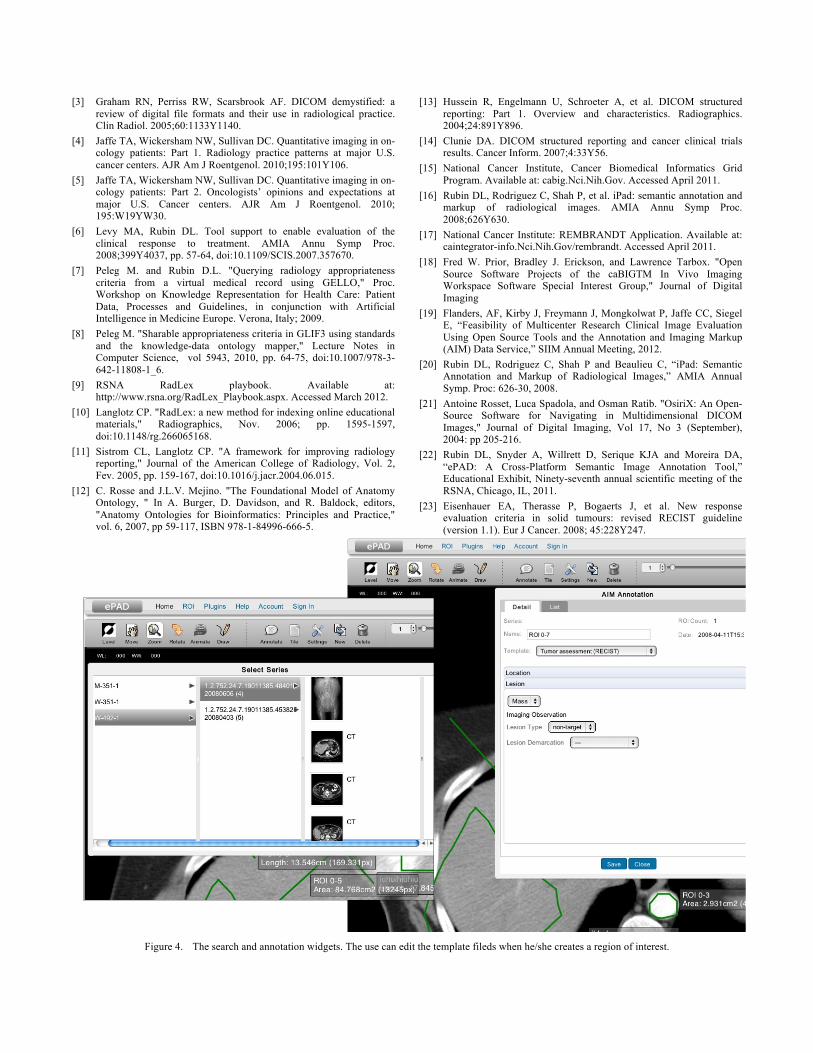
A. Operation Figure 4. shows the main windows of ePAD. The
window in the right of the picture shows the result of a user search in the image database. The user can search using patient name, patient id, exam type, study date or assertion number. The data is returned in the form of a tree containing the series that matched the search (Figure 4. – left).
After the user chooses a series, the ePAD loads the images and shows them to the user (Figure 4. - right).
The current version can: • Visualize image slices (transversal plane) • Change image brightness and contrast • Zoom, rotate and move images • Visualize annotations • Create Regions of Interest (ROI) shapes • Create and associate annotations to ROIs A standard interaction would be for a radiologist to open
an image series, look for lesions using the commands above. Once a lesion of interest is located, the user can create a ROI to mark the lesion and open the AIM annotation form for it (shown in Figure 4. – right). That form will be based in a pre-defined template (or set of templates) stored in the server. After finishing the annotation, the user saves it and the client sends it to the ePAD proxy where it will be stored as an AIM XML file in a database.
Like the other tools, the image itself remains unchanged and separate from the AIM annotation (that uses the image DICOM UID to link back to it).
IV. DISCUSSION The current version of ePAD has some limitations: • The client reads images in DICOM format from the
server: That format is not optimized for the web. Browsers do not natively recognize it, so DICOM images have to be processed using JavaScript what is slow and takes lots of memory.
• Not all functionalities usually found in image viewing tools are already available.
• It shows images in just one plane, the axial plane, the frontal and sagittal planes are are not displayed.
• It does not allow 3D annotations because of problem 3 and also because AIM 3.x, the version it uses, does not have support for them.
Just a year and a half ago, the ePAD project would have been impossible. The client side relies on the ability to show graphic images in a web browser and that is part of the HTML5 W3C draft standard (using its canvas tag). Only last year (May 25, 2011), HTML5 had its last call draft and the main browsers began to support it in force. So the question we had was, is it possible to create a full DICOM web tool that could not only show DICOM medical images (CTs, MRIs, etc) but also edit markup on them, add ontology terms to these markup and then generate a AIM file for each (in the server side)?
Our main concerns were: JavaScript speed to work with images, maybe too
slow: The JavaScript speed in the browsers tested (Chrome and Firefox) was good enough. Even though the prototype uses DICOM images and converts them to canvas images using JavaScript, the speed was quite good and image navigation was not sluggish. Maybe, that is the result of new JavaScript engines that use advanced compiling techniques to improve speed.
Network bandwidth and latency, maybe images will take too long to be transmitted to the client: Images did take a while to appear first time they were open. We used browser caching to reduce this problem. As the images themselves never change, eventually a physician working with the tool will have all images he needs cached (we can tell the browser to cache the images forever). That should improve as we begin to use png or jpeg formats for images (in place of row DICOM).
Browser memory constraints, maybe not enough memory for the images: For the prototype, we used JavaScript arrays to store images. They are very inefficient and take a lot of memory. For the next version, we are migrating them to WebGL arrays.
Web interfaces are different from desktop interfaces, maybe we cannot come up with a good design: Users are used to a desktop interface to interact with images, so ePAD was created as a RIA application using the GWT framework. That gave it an interactive desktop feeling (more suitable to work with images) and also reduced the need to wait server
response when changing something (increasing interactivity).
V. CONCLUSION AND FUTERE WORK This paper presented a new way of interaction between
radiologists and oncologists that uses web tools (including semantic web tools) to improve the communication between them. We also presented the first version of ePAD, web tool that implements this new interaction way. It helped us to show that the concept is feasible. We were able to test all of our main concerns for the project and learn how the system behaves in each case.
The AIM format itself is still evolving and, since users have only to open a web page to use ePAD, we can now more easily test AIM features against their needs. Beta users have requested features from us and we contact AIM developers (at Northwestern University) to try to include them in AIM’s next version.
A small group of beta users at Stanford University Medical Center is already testing the system for cancer clinical trials. They create AIM files, using ePAD, and other tools can generate tumor load reports for oncologists. This data can also be used to aggregate tumor data at the end of the trial without human intervention.
As future work, we are now developing the first version of ePAD for a wider audience. It will include:
WebGL support: WebGL is the HTML5 extension that allows the use of graphic CPUs (available in all desktop computers and mobile devices). We can save data and write programs to run directly on the graphic CPU memory using the OpenGL Shading Language (GLSL).
Support for multiple planes: ePAD only shows the transversal plane; we will add the frontal and sagittal planes. With these extra planes, it will be possible to create 3D markup.
AIM 4: AIM 4 is not yet stable, but we are cooperating with Northwestern University researchers working on it to have 3D markup included. It will be included and tested in ePAD.
Plugin architecture: a plugin architecture to allow the inclusion of new functionality by third parts.
ACKNOWLEDGMENT This work has been a collaborative project between the
Intermidia Lab – ICMC – University of São Paulo and the Lab of Imaging Informatics – Dept. of Radiology – Stanford University. This project has been funded by the National Cancer Institute, National Institutes of Health, under grant U01CA142555-01. It has also been funded by grants from the Brazilian research agencies CNPq and CAPES.
REFERENCES
[1] Mia A. Levy, and Daniel L. Rubin, “Current and Future Trends in Imaging Informatics for Oncology” The Cancer Journal. Roy. Soc. London, vol. 17, pp. 529–551, April 1955
[2] Choplin RH, Boehme JM, Maynard CD. Picture archiving and comm- unication systems: an overview. Radiographics. 1992;12:127Y129.
[3] Graham RN, Perriss RW, Scarsbrook AF. DICOM demystified: a review of digital file formats and their use in radiological practice. Clin Radiol. 2005;60:1133Y1140.
[4] Jaffe TA, Wickersham NW, Sullivan DC. Quantitative imaging in on-cology patients: Part 1. Radiology practice patterns at major U.S. cancer centers. AJR Am J Roentgenol. 2010;195:101Y106.
[5] Jaffe TA, Wickersham NW, Sullivan DC. Quantitative imaging in on-cology patients: Part 2. Oncologists’ opinions and expectations at major U.S. Cancer centers. AJR Am J Roentgenol. 2010; 195:W19YW30.
[6] Levy MA, Rubin DL. Tool support to enable evaluation of the clinical response to treatment. AMIA Annu Symp Proc. 2008;399Y4037, pp. 57-64, doi:10.1109/SCIS.2007.357670.
[7] Peleg M. and Rubin D.L. "Querying radiology appropriateness criteria from a virtual medical record using GELLO," Proc. Workshop on Knowledge Representation for Health Care: Patient Data, Processes and Guidelines, in conjunction with Artificial Intelligence in Medicine Europe. Verona, Italy; 2009.
[8] Peleg M. "Sharable appropriateness criteria in GLIF3 using standards and the knowledge-data ontology mapper," Lecture Notes in Computer Science, vol 5943, 2010, pp. 64-75, doi:10.1007/978-3-642-11808-1_6.
[9] RSNA RadLex playbook. Available at: http://www.rsna.org/RadLex_Playbook.aspx. Accessed March 2012.
[10] Langlotz CP. "RadLex: a new method for indexing online educational materials," Radiographics, Nov. 2006; pp. 1595-1597, doi:10.1148/rg.266065168.
[11] Sistrom CL, Langlotz CP. "A framework for improving radiology reporting," Journal of the American College of Radiology, Vol. 2, Fev. 2005, pp. 159-167, doi:10.1016/j.jacr.2004.06.015.
[12] C. Rosse and J.L.V. Mejino. "The Foundational Model of Anatomy Ontology, " In A. Burger, D. Davidson, and R. Baldock, editors, "Anatomy Ontologies for Bioinformatics: Principles and Practice," vol. 6, 2007, pp 59-117, ISBN 978-1-84996-666-5.
[13] Hussein R, Engelmann U, Schroeter A, et al. DICOM structured reporting: Part 1. Overview and characteristics. Radiographics. 2004;24:891Y896.
[14] Clunie DA. DICOM structured reporting and cancer clinical trials results. Cancer Inform. 2007;4:33Y56.
[15] National Cancer Institute, Cancer Biomedical Informatics Grid Program. Available at: cabig.Nci.Nih.Gov. Accessed April 2011.
[16] Rubin DL, Rodriguez C, Shah P, et al. iPad: semantic annotation and markup of radiological images. AMIA Annu Symp Proc. 2008;626Y630.
[17] National Cancer Institute: REMBRANDT Application. Available at: caintegrator-info.Nci.Nih.Gov/rembrandt. Accessed April 2011.
[18] Fred W. Prior, Bradley J. Erickson, and Lawrence Tarbox. "Open Source Software Projects of the caBIGTM In Vivo Imaging Workspace Software Special Interest Group," Journal of Digital Imaging
[19] Flanders, AF, Kirby J, Freymann J, Mongkolwat P, Jaffe CC, Siegel E, “Feasibility of Multicenter Research Clinical Image Evaluation Using Open Source Tools and the Annotation and Imaging Markup (AIM) Data Service,” SIIM Annual Meeting, 2012.
[20] Rubin DL, Rodriguez C, Shah P and Beaulieu C, “iPad: Semantic Annotation and Markup of Radiological Images,” AMIA Annual Symp. Proc: 626-30, 2008.
[21] Antoine Rosset, Luca Spadola, and Osman Ratib. "OsiriX: An Open-Source Software for Navigating in Multidimensional DICOM Images," Journal of Digital Imaging, Vol 17, No 3 (September), 2004: pp 205-216.
[22] Rubin DL, Snyder A, Willrett D, Serique KJA and Moreira DA, “ePAD: A Cross-Platform Semantic Image Annotation Tool,” Educational Exhibit, Ninety-seventh annual scientific meeting of the RSNA, Chicago, IL, 2011.
[23] Eisenhauer EA, Therasse P, Bogaerts J, et al. New response evaluation criteria in solid tumours: revised RECIST guideline (version 1.1). Eur J Cancer. 2008; 45:228Y247.
Figure 4. The search and annotation widgets. The use can edit the template fileds when he/she creates a region of interest.