Embed Size (px)
Citation preview

Using Process Modeling toImprove Lime Kiln Operations
Process Simulations Ltd.2386 East Mall, Suite 206
Vancouver, B.C.,V6T 1Z3, Canada

Using Process Modeling to Improve Lime Kiln Operations
2
Abstract
A CFD-based process model to predict the flow, heat transfer and combustion in
a lime kiln was developed by Process Simulations Ltd. (PSL) and presented in
this paper. Results of flow field, temperature, and species concentration in a
generic kiln are given to show the capability of process modeling for optimizing
lime kiln operations. Examples are provided to show how the modeling is used
to evaluate “what if” scenarios. New technology for a lime kiln simulator is also
introduced.

Using Process Modeling to Improve Lime Kiln Operations
3
Content
Abstract…………………………………………………………………………………..2
Content…………………………………………………………………………………...3
List of figures…………………………………………………………………………….4
1 Introduction…………………………………………………………………………….5
2 Mathematical model ………….………………………………………………………6
3 Model application
3.1 Kiln geometry and setup conditions……….…………………………………….7
3.2 Modeling results …………………………………………………………………..9
3.3 Buoyancy effects ………………………………………………………………..13
3.4 Avoiding high refractory temperatures ………………………………………..13
3.5 Flame shape …………………………………………………………………….14
3.6 Burning NCG …………………………………………………………………….15
3.7 Firing alternative fuels ………………………………………………………….15
4 Simulator technology ..……………………………………………………………..17
5 Conclusions………………………………………………………………………….21

Using Process Modeling to Improve Lime Kiln Operations
4
List of Figures
Figure 1 Heat transfer in lime kiln …………………………………………………….6
Figure 2 Generic lime kiln ……………………………………………………………..8
Figure 3 Gas burner …………………………………….……………………………..8
Figure 4 Distributions of axial velocity, gas temperature, and fuel (CH4) mass
fraction ………………………………………….……………………………9
Figure 5 Distributions of axial velocity and velocity vector ……………….………10
Figure 6 Distributions of fuel (CH4) mass fraction and flame shape ……….……10
Figure 7 Distribution of refractory temperature ………………………………….…11
Figure 8 Axial profile in the kiln ………………………..…………………………….12
Figure 9 Buoyancy effect …………………………………….………………………12
Figure 10 Effect of burner angle …………………………………………………….13
Figure 11 Effect of reduced air split on flame length ………………………….….14
Figure 12 NCG incineration .…………………………………………………………15
Figure 13 Gas temperature when firing oil …………….…………………………..16
Figure 14 Gas temperature when firing petroleum coke …..…………………….16
Figure 15 Advanced simulation and training ………………………………………18
Figure 16 The virtual data camera ………………………………………………….18
Figure 17 A sample DCS panel .……………………………………………………19
Figure 18 HTML based training …………………………………………………….20
Figure 19 Control interface ………………………………………………………….21
Using Process Modeling to Improve Lime Kiln Operations
5
Using Process Modeling to Improve Lime Kiln Operations
1 Introduction
The primary function of the lime kiln is to convert CaCO3 to CaO for reuse in the
causticizing process. The process involves heat and mass transfer between the
kiln, fuel, primary and secondary air, drying of lime mud, and calcining of CaCO3.
It is important to have a comprehensive understanding of these processes in
order to:
• Diagnose operational problems
• Improve energy consumption
• Increase production
• Reduce emissions
• Increase refractory life
• Reduce process instabilities
• Improve the product quality
• Optimize kiln operations
A lime kiln process model has been developed by Process Simulations Ltd.
Associated simulator technology is also under development. By modeling with
sufficient accuracy the physical processes occurring in the kiln and effectively
visualizing and analyzing the results, it is possible to diagnose operational
problems, improve kiln efficiency, extend refractory life, improve operation, and
produce a controlled flame shape. Modeling information can be used by process
engineers to evaluate “what if” scenarios, by operators to supplement their
knowledge of lime kiln operations, by mill managers to make informed decisions
regarding kiln retrofits, and to address environmental issues. In this report we
present a brief introduction of the lime kiln process model and illustrate an
application of the model to a lime kiln.
2 Mathematical Models

Using Process Modeling to Improve Lime Kiln Operations
6
The CFD based process model of kiln uses block-structure body-fitted
coordinates with domain segmentation to model flow, heat transfer, and
combustion. The turbulent reacting flow in the lime kiln is simulated by solving
the fully three-dimensional Reynolds-averaged transport equations of mass,
momentum energy, and chemical species. A two-equation turbulence model is
used, in which equations for the turbulent kinetic energy “k” and its dissipation
rate “ε” are solved.
Gas Combustion Model The gas phase combustion of CH4, H2, and CO is
modeled by the Magnussen model, in which the chemical reactions are
controlled by the turbulent diffusion rate. When heavy oil is burned in the kiln, the
evaporated hydrocarbon is represented by CmHn and the combustion of CmHn is
also modeled by the Magnussen model.
Radiation Heat Transfer Model The ray tracing method is adopted to simulate
the radiation heat transfer. Rays are emitted in prescribed directions from points
distributed over the domain boundary. A ray is defined by its point of origin, its
direction and the band of the wavelength spectrum that it represents. An energy
equation is solved along each ray, accounting for the energy emission from the
gas and the absorption and scattering by fine particulate and by H2O and CO2 in
the gas.
Refractory Heat Transfer
Model A multi-layer refractory
wall model is developed to
account for the heat transfer
from the combustion flue gas to
the refractory, the thermal
conduction through the
refractory, and the convection
cooling of the kiln shell by the
ambient air, as shown in Figure
Radiation
Radiation
Conduction
Convection
Convection
Figure 1 Heat transfer in lime kiln

Using Process Modeling to Improve Lime Kiln Operations
7
1.
Mud Calcination Model A mud calcination model has been developed in this
project to simulate the lime recovery process. The feed lime receives heat from
flue gas and flame via convection and radiation and also from rotating refractory
wall. After being dried, lime is heated and then undergoes calcination when
reaching the calcination temperature. The endothermic calcination reaction is as
following and is controlled by the heat transfer.
KkgMJCOCaOCaCO 1089@/679.123 −+=
When the calcination is finished, lime reaches the discharge end and is cooled by
coming air.
Liquor and Solid Fuel Combustion Model Oil and petroleum coke are often
burned in lime kiln as alternative fuels. The combustion models for oil and
petroleum coke have been developed respectively. The oil combustion includes
three sub-processes, i.e. evaporation, formation and oxidation of cenosphere,
and hydrocarbon combustion. The petroleum coke undergoes drying,
devolatilization, and char combustion during its combustion process.
NOx Formation Model A NOx formation model is also coupled into the process
model to predict NOx emission from natural gas combustion. Two types of NOx
are accounted for in the model, thermal NOx and prompt NOx.
3 Model Application
The developed lime kiln process model was applied to a generic lime kiln to
illustrate its capabilities as an advanced modeling technology.
3.1 Kiln Geometry and Setup Conditions
Using Process Modeling to Improve Lime Kiln Operations
8
X
ZY
HoodKiln
NCG Pipe
X
ZY
Gas Gun
Dam
Mud
Secondary Air
Secondary Air
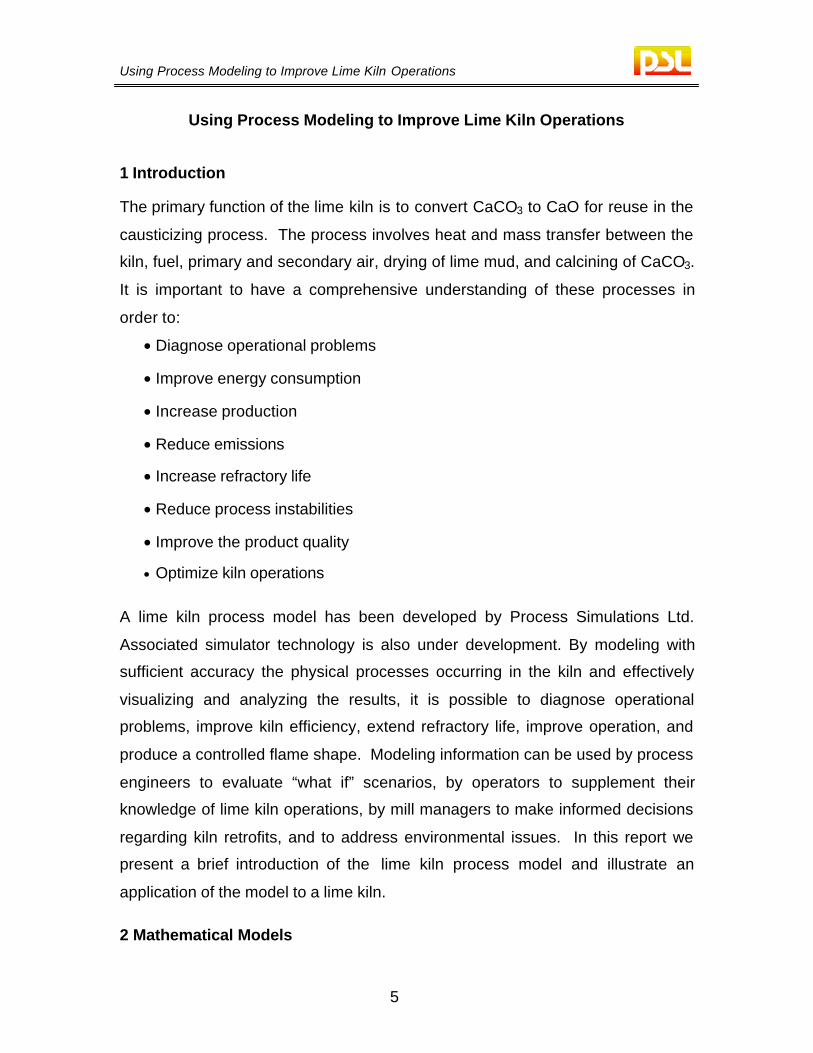
Figure 2 Generic lime kiln
Figure 2 shows the discharge part of the modeled generic lime kiln including the
hood and a part of the kiln barrel. The kiln has an inner diameter of 3.81m. The
entire length of the kiln is 110 m, however the modeled part covers only the first
one third of this length. The kiln is slightly inclined from the horizontal and slowly
rotated in clockwise direction. The kiln wall is lined by a layer of 60% alumina
brick and a layer of insulating brick and is covered by a steel tube. A dam is built
at the discharge end of the kiln. A
portion of the combustion air
called secondary air, enters the
hood through an annular air
heater outside of the kiln and an
annular gap between the hood
and the kiln at the downstream
end of the hood. The kiln fires
natural gas through a multi-
annular swirling burner as shown
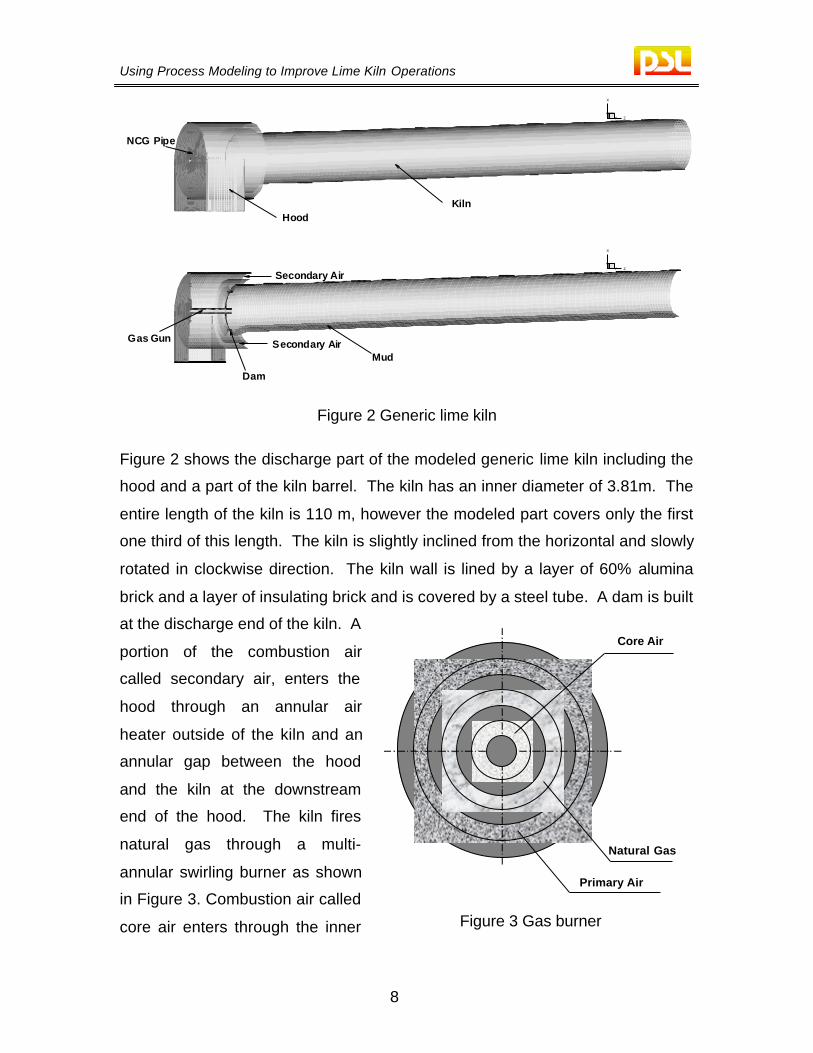
in Figure 3. Combustion air called
core air enters through the inner
Core Air
Natural Gas
Primary Air
Figure 3 Gas burner

Using Process Modeling to Improve Lime Kiln Operations
9
annulus while more air, called primary air, enters through the outer annulus.
Natural gas is injected through the center annulus. The two air jets and the gas
jet are swirling in the same direction but at different swirling angles. The kiln also
fires alternative fuels, like oil and petroleum coke. Non-Condensable Gas (NCG)
is injected through a pipe in the hood parallel to the gas gun.
3.2 Modeling Results
A typical operational case of the kiln is modeled to show the process inside the
kiln and the capability of the process modeling. The kiln is fuelled by natural gas
in a rate of 2024 kg/hr. A total of 40,490 kg/hr combustion air is provided, which
works out to about 15% excess air. 80% of the total combustion air is secondary
air, and the rest goes into the kiln through the gas burner. No NCG is injected
into the kiln in this case. The process modeling results are illustrated in Figures
4 and 5 by the distributions of axial velocity, gas temperature and fuel (CH4)
mass fraction on a vertical cross section.
-4 -2 0 2 4 6 8 10 12 14 16 18 20 22 24 26 28 30 32 34 36 38 40 42 44 46 48 50
Axialvelocity(m/s)
0 0. 025 0.05 0.075 0.1 0.125 0.15 0.175 0. 2 0.225 0.25 0.275 0.3 0. 325 0.35 0. 375 0.4 0.425 0. 45 0.475 0.5
CH4 massfraction
400 500 600 700 800 900 1000 1100 1200 1300 1400 1500 1600 1700 1800 1900 2000
Gastemp. [K]
Figure 4 Distributions of axial velocity, gas temperature and fuel(CH4) mass fraction

Using Process Modeling to Improve Lime Kiln Operations
10
Figure 5 Distributions of axial velocity and velocity vector
Figure 6 Distributions of fuel (CH4) mass fraction and flame shape
Using Process Modeling to Improve Lime Kiln Operations
11
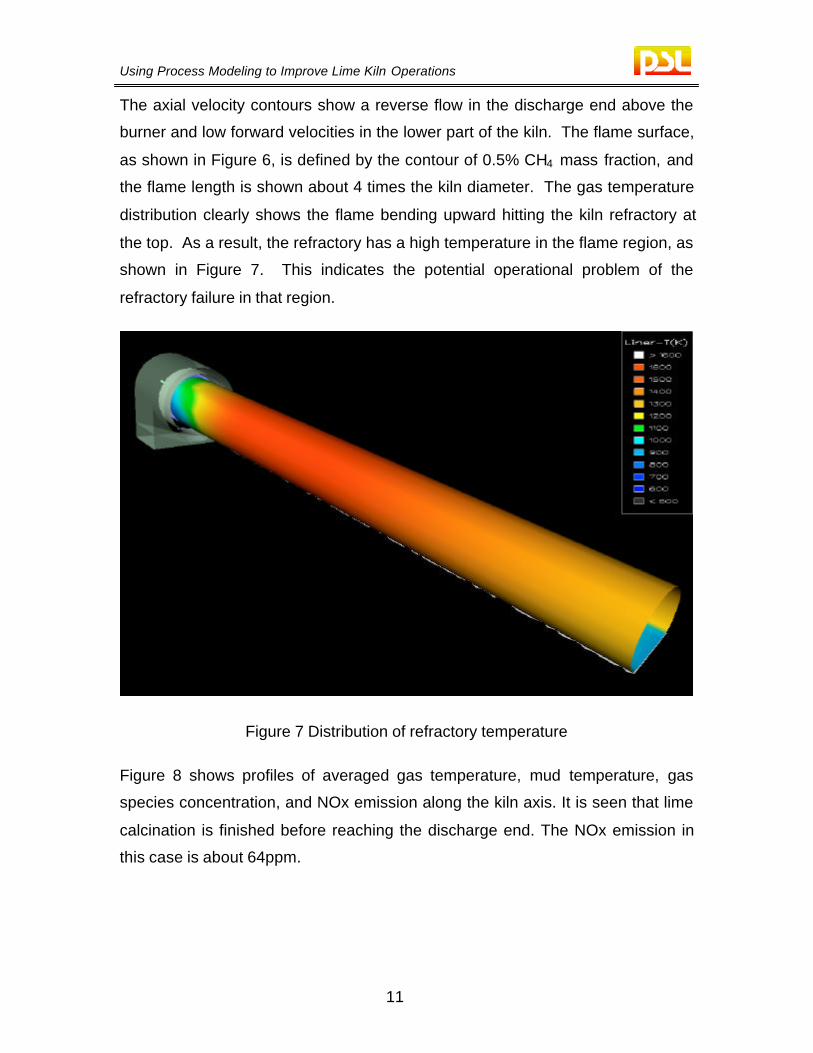
The axial velocity contours show a reverse flow in the discharge end above the
burner and low forward velocities in the lower part of the kiln. The flame surface,
as shown in Figure 6, is defined by the contour of 0.5% CH4 mass fraction, and
the flame length is shown about 4 times the kiln diameter. The gas temperature
distribution clearly shows the flame bending upward hitting the kiln refractory at
the top. As a result, the refractory has a high temperature in the flame region, as
shown in Figure 7. This indicates the potential operational problem of the
refractory failure in that region.
Figure 7 Distribution of refractory temperature
Figure 8 shows profiles of averaged gas temperature, mud temperature, gas
species concentration, and NOx emission along the kiln axis. It is seen that lime
calcination is finished before reaching the discharge end. The NOx emission in
this case is about 64ppm.

Using Process Modeling to Improve Lime Kiln Operations
12
Z(m)0 10 20 30 40
0
200
400
600
800
1000
1200
1400
1600
1800
2000
0
5
10
15
20
25
30
-0.05
0
0.05
0.1
0.15
0.2
0.25
0.3
0
10
20
30
40
50
60
70
80
90
100
O2, CO2
(%)NO
(ppm)Qmud
(MW/m2)Tgas, Tmud
(K)
Bur
ner
Pos
ition
NO
Tgas
Tmud
O2
CO2Qmud
Figure 8 Axial profile in the kiln
Buoyancy Forces
No Buoyancy Forces
Figure 9 Buoyancy effect

Using Process Modeling to Improve Lime Kiln Operations
13
3.3 Buoyancy Effects
Further process modeling is done without including the effects of buoyancy in the
model. The flame shape is shown in Figure 9 using the 3D viewer simulator
technology. Results show that there is significant upward bending of the flame
when buoyancy effects are included. This reveals that cold flow modeling
(numerical or experimental) will not adequately predict the kiln processes as no
buoyancy effects would be included.
3.4 Avoiding High Refractory Temperatures
To maximize refractory life, it is essential to avoid flame impingement on the
refractory lining. Process modeling supports the practice that tilting the gas gun
downward is an effective method. Figure 10 illustrates that, for the generic kiln
modeled here, tilting five degrees downward appears to avoid impingement,
however slightly less tilt may be required to avoid overheating the product. The
optimal tilt angle will be different for different kilns, and for the same kiln with
different operational conditions. Process modeling and simulator technology can
be used to fine-tune the tilt angle based on current operational conditions.
0º
-5º
Figure 10 Effect of burner angle

Using Process Modeling to Improve Lime Kiln Operations
14
3.5 Flame Shape
The burner and flame play a key role in determining the kiln production capacity,
efficiency, product quality and service life of the refractory. Tilting the burner is
not the only method of adjusting the flame. For persistent, flame shape related
operational problems, different burners can be installed. Generally, however,
ratios of primary, secondary, and other combustion air are adjusted by operators
to modify the flame shape. Short, hot flames are better for kiln efficiency and
production than long, lazy flames. While heat rates are better with short flames,
refractory temperatures can be substantially higher. Using this type of flame may
shorten the refractory service time. Different burner designs can produce
different flame length. Changing the combustion air split between the primary
and the secondary also produce different flame shapes. The flame becomes
longer when the primary air is reduced by 20%, as shown in Figure 11. Process
modeling also shows that when the primary air ratio is larger than a certain value,
further increasing of primary air ratio will not shorten the flame length. The
requirement of even shorter flame can only obtained by using different design of
the burner or using an adjustable burner.
Figure 11 Effect of reduced air split on flame length

Using Process Modeling to Improve Lime Kiln Operations
15
3.6 NCG Burning
In many pulp and paper mills, lime kilns are used to incinerate NCG. The oxygen
and small amount of combustible gases in NCG may influence the flow and gas
combustion process in the kiln, so care must be taken to inject the NCG so as
not to affect kiln operations. NCG can be injected into the kiln through a
separate pipe or by premixing with primary air. Separate injection of NCG is
modeled here as an illustration.
No NCG
With NCG
ReducedHeat
Figure 12 NCG incineration
The NCG injection pipe is parallel to the gas gun on its right upper side. The
predicted temperature distributions show that the NCG forms a layer between the
flame and the refractory and reduces heat flux to the refractory in that area. In
this case, the NCG injection does not bring any negative effect on the kiln
performance. However, it may not be always the case. The gas combustion
process and the heat flux to the refractory could be worse if the NCG injection is
not appropriate.
3.7 Firing alternative fuels
Oil and petroleum coke are often alternative fuels for many lime kilns. Because of
different fuel properties, the process in the kiln appears different when firing

Using Process Modeling to Improve Lime Kiln Operations
16
different fuels. Figures 13 and 14 show predicted gas temperature in the kiln
when firing oil and petroleum coke respectively. Since oil contains more
hydrogen than natural gas, the flame temperature is much higher than that when
firing gas even the total heat input is the same. Petroleum coke is harder to be
ignited comparing with gas and oil, and as a result, the combustion is delayed.
Figure 13 Gas temperature when firing oil
Figure 14 Gas temperature when firing petroleum coke

Using Process Modeling to Improve Lime Kiln Operations
17
4 Simulator Technology
Process modeling is an effective and economical method of analyzing and
diagnosing process operations. The highly informative and detailed information
provided by modeling cannot be achieved by any other means. Environments
within process equipment, such as lime kilns, is either inaccessible or too volatile
to derive sufficiently detailed measurements to gain a thorough understanding of
the process. Even if it were possible, comprehensive measurements over
different operating conditions would be prohibitively expensive.
Process modeling provides effective, safe, and economical ways of creating a
detailed database of information about a process. Data includes detailed three
dimensional fields of velocity, temperature, gas species concentration (O2, CO,
CH4 NOx, TRS…), heat transfer, fuel combustion, and a host of other important
information.
Despite the successes of modeling, it still remains a tool used by engineers who
usually have more than a decade of theory, training, and experience in this area.
The intensive amount of work necessary to set up, compute, and display results
for a process model, plus the knowledge required, makes it an ineffective tool for
mill personnel to use directly.
This issue has been addressed and new technologies have been developed to
package the results of process modeling into an interactive, intuitive, easy to use
software.
Figure 15 shows a schematic of the simulation system. To start, a lime kiln is
analyzed to map out the range of input control parameters of interest. Next, a
matrix of input conditions is developed. Each unique set of input conditions (i.e.,
primary air flowrate, fuel flowrate, burner angle) is termed a ‘case’. The process
model is applied to each case, and the results are stored in a database. Next,
the results are fed into a proprietary neural network system that learns the
relationship between the input data and complex three-dimensional field data that

Using Process Modeling to Improve Lime Kiln Operations
18
is generated by the model. Once properly trained, the network can rapidly
reproduce the training data to a specified accuracy. The most important aspect
of the network lies in the ability to generate accurate results for a case not
included in the training set. This allows the operator to adjust control settings
much like operating a real kiln, and to nearly instantaneously view the results.
VariableInput
Conditions
NeuralNetworkSystem
ProcessModeling
InteractiveGraphicalInterface
ProcessAnalysis
ProcessKnowledge
OperatorTraining
Figure 15 Advanced simulation and training
New technology for interactive display of results has also been developed. The
core of this system consists of four main components:
1. A virtual data camera that allows users to interactively view complex 3D data
in any perspective.
2. An iconic-based (DCS-like) viewer for displaying integrated and summarized
process information.
3. An HTML-based system for displaying instructional information.
4. An ergonomic control interface for setting process control input data.
Figures 16-19 show examples of these components.

Using Process Modeling to Improve Lime Kiln Operations
19
Figure 16 The virtual data camera
O2
TRS
TAVE
3.7%
24 ppm
820 KPrimary Air 0.974 kg/s
Secondary Air 3.507 kg/sFuel (Ch4) 0.265 kg/s
Input Excess Air 2.9%
Burner Angle -2.5 degrees
Average Wall TemperatureAverage Heat Flux to Mud
Figure 17 A sample DCS panel
The system allows users to interactively view process data in a
three-dimensional virtual environment. Using proprietary neural network
technology, a user can vary input control parameters and instantly view

Using Process Modeling to Improve Lime Kiln Operations
20
corresponding results. Results can be visualized in terms of flow animations and
streamlines, scalar and vector fields, scalar isosurfaces, and particulate
animations and distributions. Integrated and summarized process information is
shown on organized DCS-like screens. The system has an HTML based module
that can be used for classroom and web based training.
The software can be used to rapidly analyze and rectify process problems, or to
create virtual equipment for operator training. If equipment modifications are
made, new data from process modeling can easily be added.
Users can compare and contrast different operating conditions, making “what if”
scenarios a snap. HTML based lesson training, integrated into the system, can
guide users through a details series of lesson with ease. The learning curve for
new operators is dramatically shortened. Common insight into what used to be
guesswork means less shift to shift operating variation and ultimately more
effective operations. Dangerous operating conditions, useful for training, can
safely and easily be explored.
Figure 18 HTML based training
Using Process Modeling to Improve Lime Kiln Operations
21
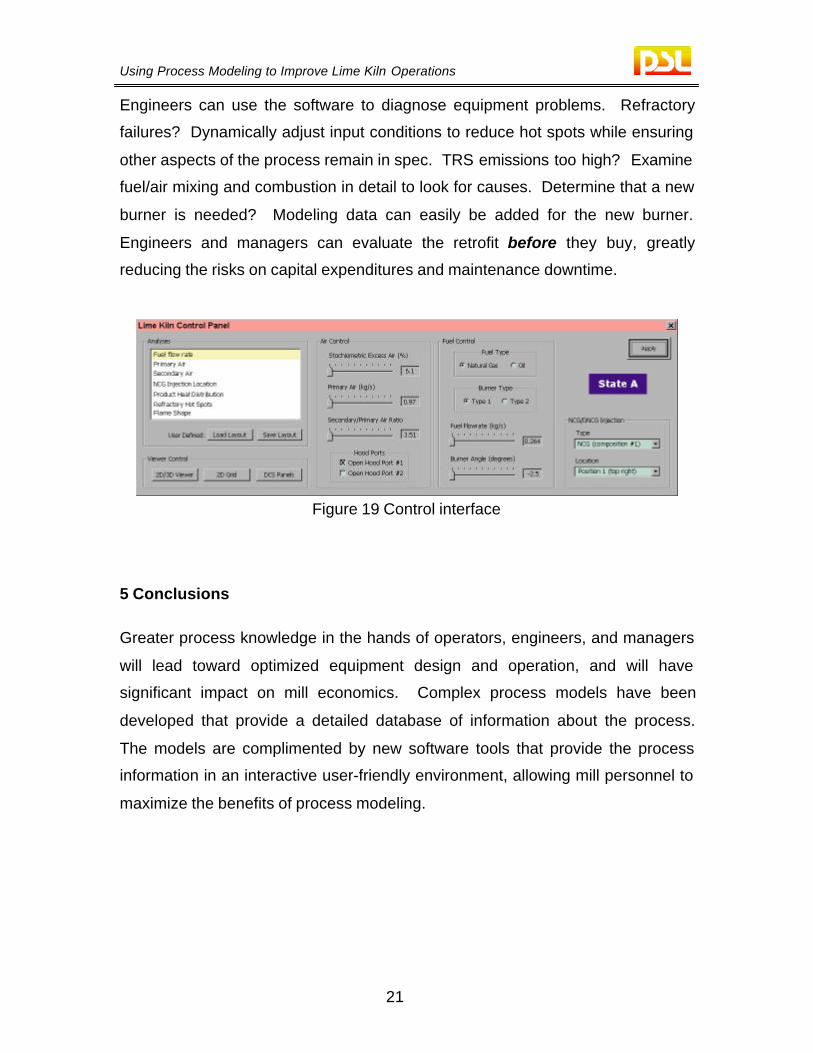
Engineers can use the software to diagnose equipment problems. Refractory
failures? Dynamically adjust input conditions to reduce hot spots while ensuring
other aspects of the process remain in spec. TRS emissions too high? Examine
fuel/air mixing and combustion in detail to look for causes. Determine that a new
burner is needed? Modeling data can easily be added for the new burner.
Engineers and managers can evaluate the retrofit before they buy, greatly
reducing the risks on capital expenditures and maintenance downtime.
Figure 19 Control interface
5 Conclusions
Greater process knowledge in the hands of operators, engineers, and managers
will lead toward optimized equipment design and operation, and will have
significant impact on mill economics. Complex process models have been
developed that provide a detailed database of information about the process.
The models are complimented by new software tools that provide the process
information in an interactive user-friendly environment, allowing mill personnel to
maximize the benefits of process modeling.


![H.C. Meisingset and Jens G. Balchen, 'Mathematical ... kiln calciner. variables ihqdust generation in a are kiln rotafiona' speed (2] gas density, ... Mathematical modeling of a rotary](https://img.dokumen.tips/doc/110x75/5ad847d47f8b9a865b8d33ac/hc-meisingset-and-jens-g-balchen-mathematical-kiln-calciner-variables.jpg)