Embed Size (px)
Citation preview

© The McGraw-Hill Companies, Inc., 2000Irwin/McGraw-Hill
2-1
Using Lead and LagMeasures to Communicate,
Motivate, and Evaluate
Student Tutorial
2
© The McGraw-Hill Companies, Inc., 2000Irwin/McGraw-Hill
2-2
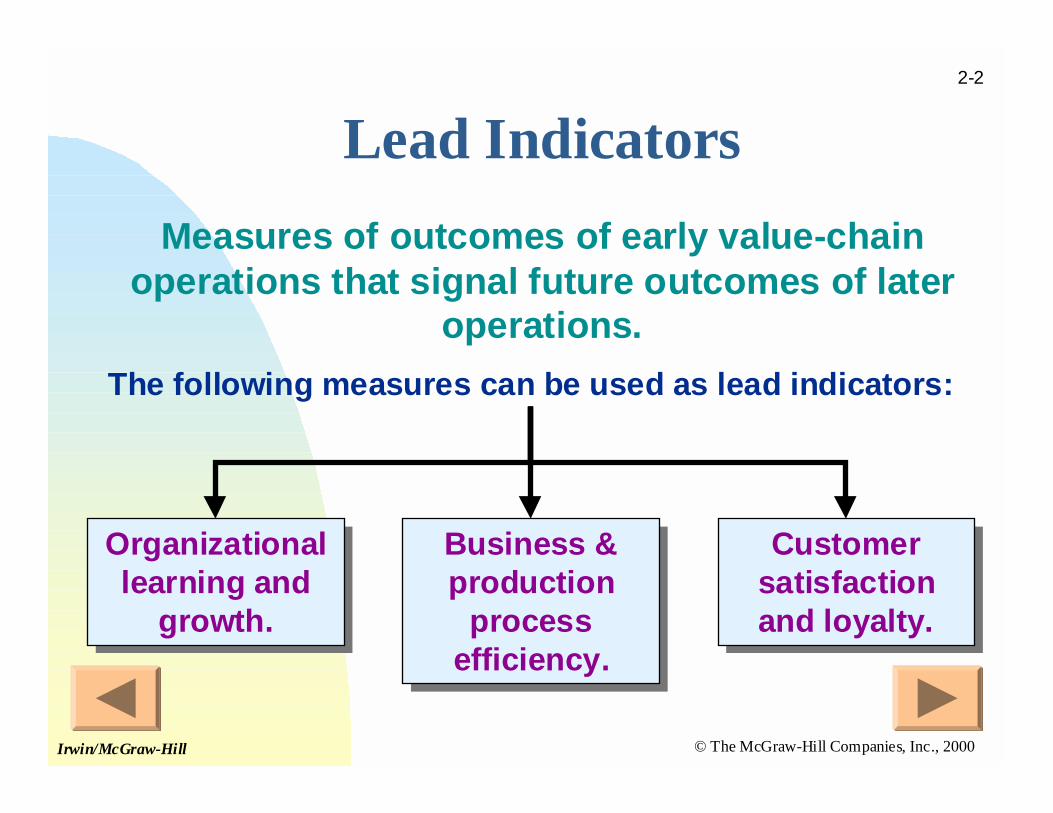
Lead Indicators
Measures of outcomes of early value-chainoperations that signal future outcomes of later
operations.
The following measures can be used as lead indicators:
Business &production
processefficiency.
Business &production
processefficiency.
Organizationallearning and
growth.
Organizationallearning and
growth.
Customersatisfactionand loyalty.
Customersatisfactionand loyalty.

© The McGraw-Hill Companies, Inc., 2000Irwin/McGraw-Hill
2-3
Lead Indicators
Can you think of some examples of leadindicators that you might use in business?

© The McGraw-Hill Companies, Inc., 2000Irwin/McGraw-Hill
2-4
Lead Indicators
Can you think of some examples of leadindicators that you might use in business?
! A decrease in new home starts may indicate afuture decrease in demand for appliances such asrefrigerators or ovens.
! An increase in quality measures, may indicate afuture increase in customer satisfaction.
! News of unrest in the Middle East may foretell anincrease in the price of fuel and petroleum-basedproducts.

© The McGraw-Hill Companies, Inc., 2000Irwin/McGraw-Hill
2-5
Lag Indicators
Measures of final outcomes of managementplans and their execution.
Measures of final outcomes of managementplans and their execution.
Lead and Lag relations among Indicators ofPerformance:
Business &productionprocesses
Business &productionprocesses
Customervalue
Customervalue
Organizationallearning and
growth
Organizationallearning and
growth
Financialperformance
Financialperformance

© The McGraw-Hill Companies, Inc., 2000Irwin/McGraw-Hill
2-6
Lag Indicators
Can you think of some examples of lagindicators that you might use in business?

© The McGraw-Hill Companies, Inc., 2000Irwin/McGraw-Hill
2-7
Lag Indicators
Can you think of some examples of lagindicators that you might use in business?
! Improved employee morale might indicate that arecent employee seminar was successful.
! Increased productivity might be a signal that arecent training course was successful.
! Improved quality can be a sign that using a highergrade material reduces defects.
© The McGraw-Hill Companies, Inc., 2000Irwin/McGraw-Hill
2-8
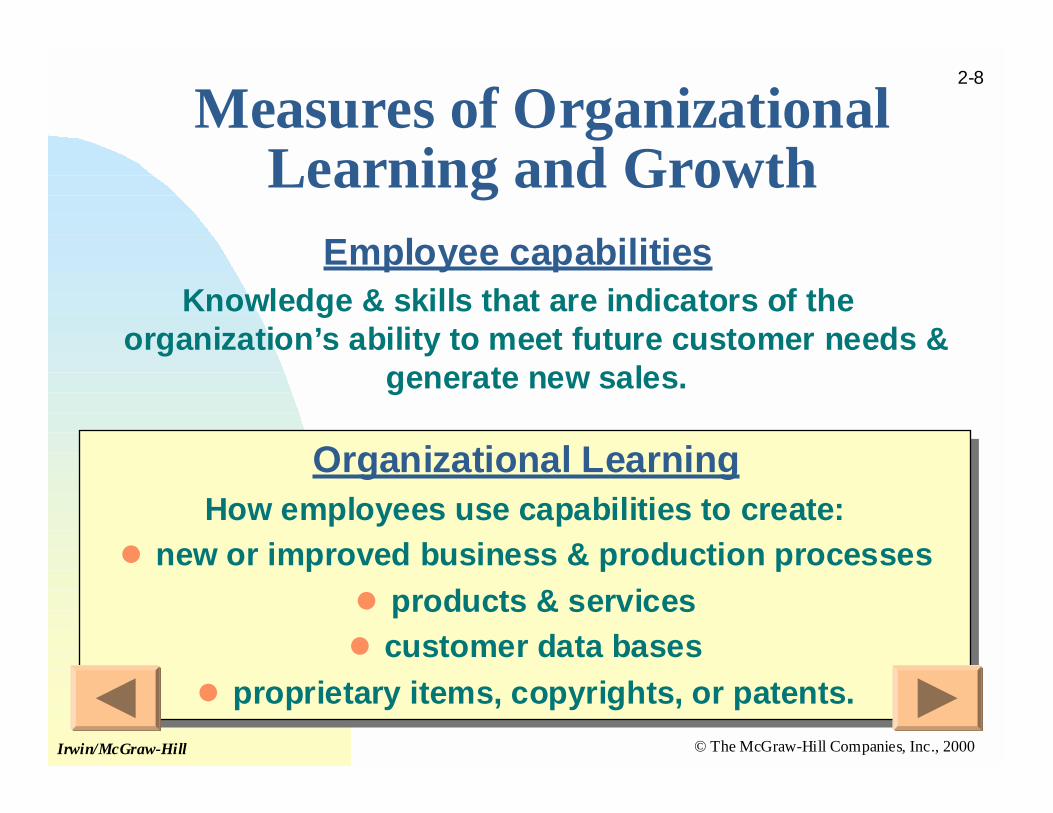
Measures of OrganizationalLearning and Growth
Employee capabilitiesKnowledge & skills that are indicators of the
organization’s ability to meet future customer needs &generate new sales.
Organizational LearningHow employees use capabilities to create:
! new or improved business & production processes
! products & services
! customer data bases
! proprietary items, copyrights, or patents.
Organizational LearningHow employees use capabilities to create:
! new or improved business & production processes
! products & services
! customer data bases
! proprietary items, copyrights, or patents.

© The McGraw-Hill Companies, Inc., 2000Irwin/McGraw-Hill
2-9
Opportunitiesfor
improvement
Opportunitiesfor
improvement
Productdevelopment
time.
Productdevelopment
time.
Employee training& education
Employee training& education
InnovativenessInnovativeness
Measures of OrganizationalLearning and Growth
Measuresinclude:
Measuresinclude:

© The McGraw-Hill Companies, Inc., 2000Irwin/McGraw-Hill
2-10
Measuring Results: ProcessEfficiency
Process efficiency! The ability to transform inputs into
outputs at lowest cost.
Process efficiency! The ability to transform inputs into
outputs at lowest cost.
Production processes! Result directly in the production of
products or services provided to externalcustomers.
Production processes! Result directly in the production of
products or services provided to externalcustomers.
Business process! Support or enable production processes.
Business process! Support or enable production processes.

© The McGraw-Hill Companies, Inc., 2000Irwin/McGraw-Hill
2-11
Measuring Results: ProcessEfficiency
Highproductivity
Highproductivity
HighqualityHigh
quality
Low cycletime
Low cycletime
Highthroughput
Highthroughput

© The McGraw-Hill Companies, Inc., 2000Irwin/McGraw-Hill
2-12
Measuring Quality
Internal Customers
(Click for definition)
Internal Customers
(Click for definition)
External Customers
(Click for definition)
External Customers
(Click for definition)
If internal customersare satisfied,
profitability of theproduction process is
maximized.
If internal customersare satisfied,
profitability of theproduction process is
maximized.
If internal customersare NOT satisfied,
external customerscannot be profitably
satisfied.
If internal customersare NOT satisfied,
external customerscannot be profitably
satisfied.

© The McGraw-Hill Companies, Inc., 2000Irwin/McGraw-Hill
2-13
Measuring Quality
External Customers
(Click for definition)organization.
External Customers
(Click for definition)organization.
If internal customersare satisfied,
profitability of theproduction process is
maximized.
If internal customersare satisfied,
profitability of theproduction process is
maximized.
If internal customersare NOT satisfied,
external customerscannot be profitably
satisfied.
If internal customersare NOT satisfied,
external customerscannot be profitably
satisfied.
Internal CustomersEmployees involved inthe next “downstream”process.
Internal CustomersEmployees involved inthe next “downstream”process.

© The McGraw-Hill Companies, Inc., 2000Irwin/McGraw-Hill
2-14
Measuring Quality
Internal Customers
(Click for definition)
Internal Customers
(Click for definition)
External CustomersUltimate users ofproducts and servicesthat generate profits forthe organization.
External CustomersUltimate users ofproducts and servicesthat generate profits forthe organization.
If internal customersare satisfied,
profitability of theproduction process is
maximized.
If internal customersare satisfied,
profitability of theproduction process is
maximized.
If internal customersare NOT satisfied,
external customerscannot be profitably
satisfied.
If internal customersare NOT satisfied,
external customerscannot be profitably
satisfied.

© The McGraw-Hill Companies, Inc., 2000Irwin/McGraw-Hill
2-15
Measuring Quality
Internal CustomersEmployees involved inthe next “downstream”process.
Internal CustomersEmployees involved inthe next “downstream”process.
External CustomersUltimate users ofproducts and servicesthat generate profits forthe organization.
External CustomersUltimate users ofproducts and servicesthat generate profits forthe organization.
If internal customersare satisfied,
profitability of theproduction process is
maximized.
If internal customersare satisfied,
profitability of theproduction process is
maximized.
If internal customersare NOT satisfied,
external customerscannot be profitably
satisfied.
If internal customersare NOT satisfied,
external customerscannot be profitably
satisfied.
© The McGraw-Hill Companies, Inc., 2000Irwin/McGraw-Hill
2-16
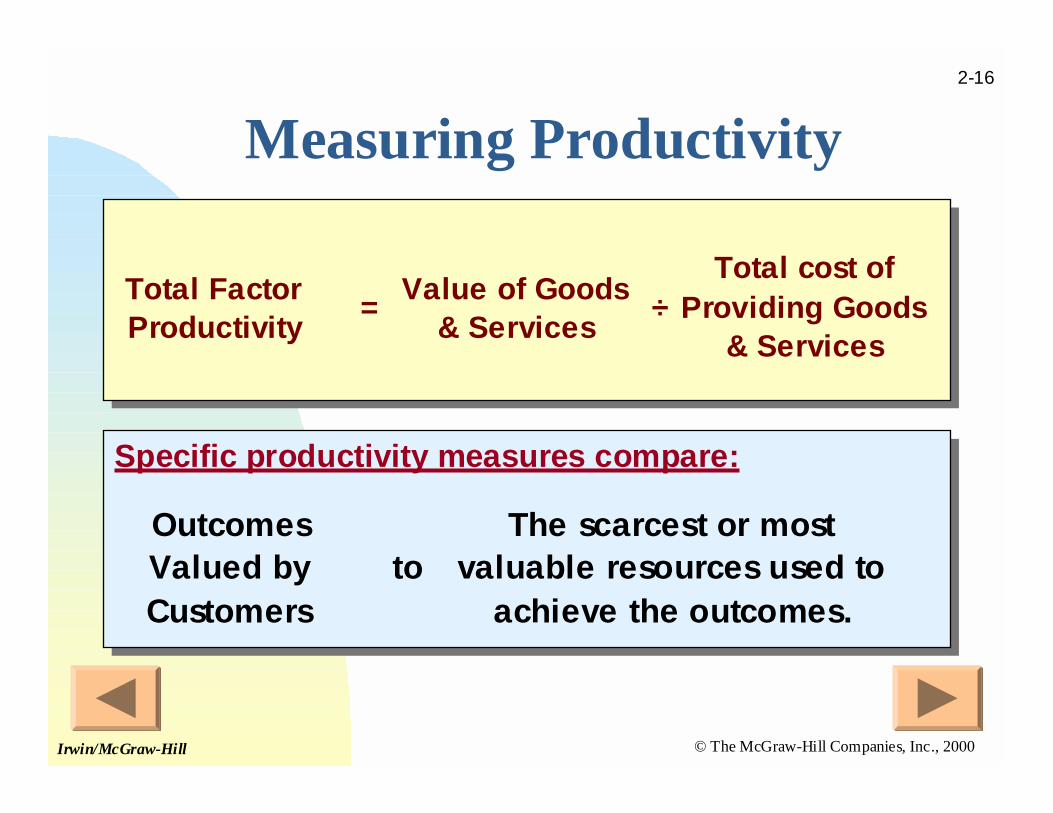
Measuring Productivity
Total Factor Productivity
=Value of Goods
& Services÷
Total cost of Providing Goods
& Services
Specific productivity measures compare:Specific productivity measures compare:
Outcomes Valued by Customers
toThe scarcest or most
valuable resources used to achieve the outcomes.

© The McGraw-Hill Companies, Inc., 2000Irwin/McGraw-Hill
2-17
Measuring Productivity
?
Ure Company, Inc. is in the same industry as MST.Assume sales are $4,600,000 in 2000. Also assumethat the cost of providing the product is $3,680,000.
What would be Ure Company’s total factorproductivity?
Ure Company, Inc. is in the same industry as MST.Assume sales are $4,600,000 in 2000. Also assumethat the cost of providing the product is $3,680,000.
What would be Ure Company’s total factorproductivity?
© The McGraw-Hill Companies, Inc., 2000Irwin/McGraw-Hill
2-18
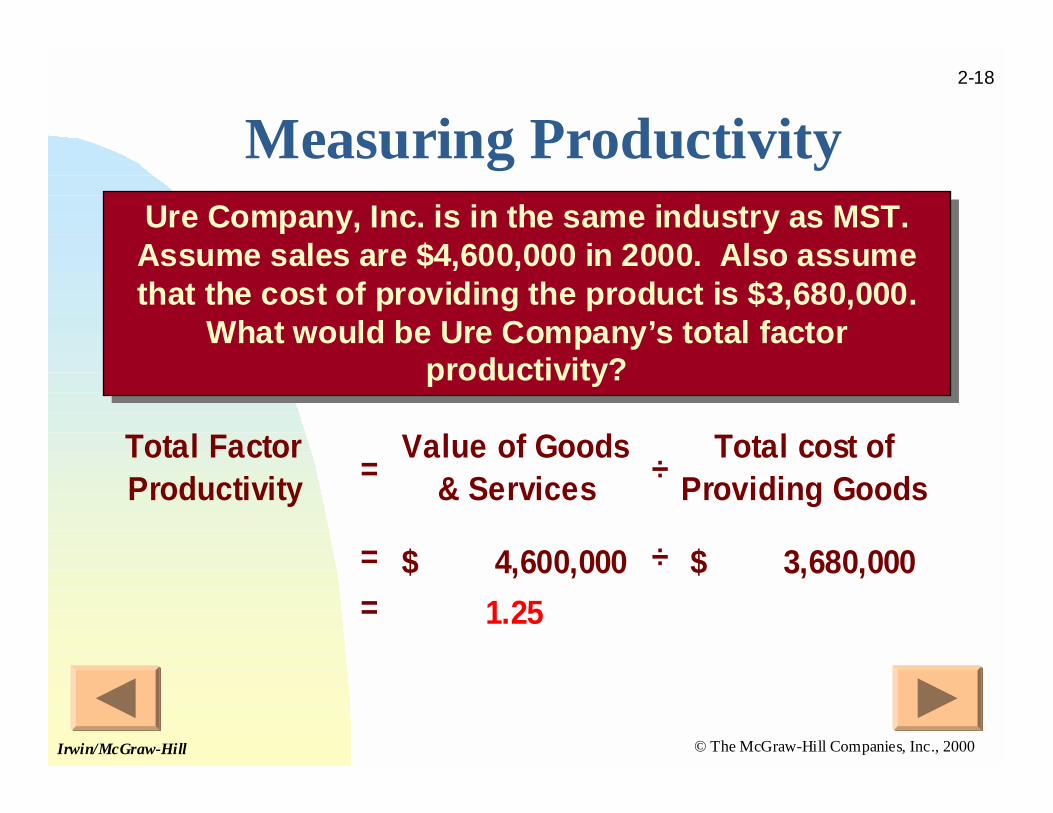
Measuring ProductivityUre Company, Inc. is in the same industry as MST.Assume sales are $4,600,000 in 2000. Also assumethat the cost of providing the product is $3,680,000.
What would be Ure Company’s total factorproductivity?
Ure Company, Inc. is in the same industry as MST.Assume sales are $4,600,000 in 2000. Also assumethat the cost of providing the product is $3,680,000.
What would be Ure Company’s total factorproductivity?
Total Factor Productivity
=Value of Goods
& Services÷
Total cost of Providing Goods
= 4,600,000$ ÷ 3,680,000$ = 1.25

© The McGraw-Hill Companies, Inc., 2000Irwin/McGraw-Hill
2-19
Measuring ThroughputEfficiency
A measure of the amount of time spent addingvalue compared to the total cycle time.
A measure of the amount of time spent addingvalue compared to the total cycle time.
Throughput Ratio
=Value-added
Time÷
Total Processing
Time

© The McGraw-Hill Companies, Inc., 2000Irwin/McGraw-Hill
2-20
Preventing Process Mistakes
" It is easier andless costly to
prevent mistakesthan to fix them.
" It is easier andless costly to
prevent mistakesthan to fix them.
# When mistakes dooccur, lead indicatorscan identify problems
before they become tooserious.
# When mistakes dooccur, lead indicatorscan identify problems
before they become tooserious.
Six-Sigma Programs, such as atMotorola, are designed to resultin nearly error-free production
processes.
Six-Sigma Programs, such as atMotorola, are designed to resultin nearly error-free production
processes.

© The McGraw-Hill Companies, Inc., 2000Irwin/McGraw-Hill
2-21
Preventing Process Mistakes
" It is easier andless costly to
prevent mistakesthan to fix them.
" It is easier andless costly to
prevent mistakesthan to fix them.
# When mistakes dooccur, lead indicatorscan identify problems
before they become tooserious.
# When mistakes dooccur, lead indicatorscan identify problems
before they become tooserious.
Six-Sigma Programs, such as atMotorola, are designed to resultin nearly error-free production
processes.
Six-Sigma Programs, such as atMotorola, are designed to resultin nearly error-free production
processes.
Six Sigma refers to a process thathas a 99.9999998% probability of
being error free. The concept wasoriginally implemented by
Motorola. Typically, Six Sigmaprocesses result in an average of
only 3.4 production defects forevery 1,000,000 units produced.
Six Sigma refers to a process thathas a 99.9999998% probability of
being error free. The concept wasoriginally implemented by
Motorola. Typically, Six Sigmaprocesses result in an average of
only 3.4 production defects forevery 1,000,000 units produced.

© The McGraw-Hill Companies, Inc., 2000Irwin/McGraw-Hill
2-22
Measuring Customer Satisfaction
Customer Satisfaction is the degree to which productsand services meet customers’ needs.
Customer Satisfaction is the degree to which productsand services meet customers’ needs.
Attributes ofcustomer
satisfactioninclude:
•Meeting customer needs.
•Meeting technical requirements.
•Delivering superior service before and afterthe sale.
•A commitment to work with the customer.
•Flexible, competent, and helpful employees.
•Company’s reliability and ability to meetcommitments.
•Meeting customer needs.
•Meeting technical requirements.
•Delivering superior service before and afterthe sale.
•A commitment to work with the customer.
•Flexible, competent, and helpful employees.
•Company’s reliability and ability to meetcommitments.

© The McGraw-Hill Companies, Inc., 2000Irwin/McGraw-Hill
2-23
Measuring Customer Loyalty
Customer Loyalty is the tendency for existingcustomers to continue to obtain products and
services from the same organization.
Customer Loyalty is the tendency for existingcustomers to continue to obtain products and
services from the same organization.
Customerretention rate
Customerretention rate
% of sales torepeat
customers
% of sales torepeat
customers
Measuresinclude:
Measuresinclude:

© The McGraw-Hill Companies, Inc., 2000Irwin/McGraw-Hill
2-24
Target Costing for ProductDesign
An approach for designing products to simultaneouslymeet both customer needs and company profit targets.
An approach for designing products to simultaneouslymeet both customer needs and company profit targets.
"Computetarget price.
"Computetarget price.

© The McGraw-Hill Companies, Inc., 2000Irwin/McGraw-Hill
2-25
Target Costing for ProductDesign
An approach for designing products to simultaneouslymeet both customer needs and company profit targets.
An approach for designing products to simultaneouslymeet both customer needs and company profit targets.
"Computetarget price.
"Computetarget price.
#Computetarget costper unit.
#Computetarget costper unit.
Target Cost per Unit
=Expected market price over the life
of the product -
Required profit per unit
Target Cost per Unit
=Expected market price over the life
of the product -
Required profit per unit

© The McGraw-Hill Companies, Inc., 2000Irwin/McGraw-Hill
2-26
Target Costing for ProductDesign
An approach for designing products to simultaneouslymeet both customer needs and company profit targets.
An approach for designing products to simultaneouslymeet both customer needs and company profit targets.
"Computetarget price.
"Computetarget price.
#Computetarget costper unit.
#Computetarget costper unit.
$Compute thecurrently feasibletotal cost.
$Compute thecurrently feasibletotal cost.

© The McGraw-Hill Companies, Inc., 2000Irwin/McGraw-Hill
2-27
Target Costing for ProductDesign
An approach for designing products to simultaneouslymeet both customer needs and company profit targets.
An approach for designing products to simultaneouslymeet both customer needs and company profit targets.
"Computetarget price.
"Computetarget price.
#Computetarget costper unit.
#Computetarget costper unit.
$Compute thecurrently feasibletotal cost.
$Compute thecurrently feasibletotal cost.
%Compare totaltarget cost tocurrently feasibletotal cost.
%Compare totaltarget cost tocurrently feasibletotal cost.

© The McGraw-Hill Companies, Inc., 2000Irwin/McGraw-Hill
2-28
Target Costing for ProductDesign - Example
Dig Corp. produces titanium shovels. These shovelsdig easier and last longer than traditional steel
shovels. Dig Corp. currently sells 75,000 shovels peryear at a sales price of $125 each. However,
competing products set to hit the market in 6 weekswill drive prices immediately to a unit sales price of
only $70 per shovel.
Dig Corp. must maintain a 30% profit margin. With thenew sales price of $70, they expect sales to increase
to 105,000 shovels per year. The current variable costis $52 per shovel. Fixed costs are $1,200,000.
What is Dig’s cost reduction target?

© The McGraw-Hill Companies, Inc., 2000Irwin/McGraw-Hill
2-29
Target Costing for ProductDesign - Example
"Computetarget price
= ?
"Computetarget price
= ?
In this problem, thisis given. Usually thetarget price must beestimated by carefulstudy of prevailing
and expectedeconomic and
market conditions.
In this problem, thisis given. Usually thetarget price must beestimated by carefulstudy of prevailing
and expectedeconomic and
market conditions.

© The McGraw-Hill Companies, Inc., 2000Irwin/McGraw-Hill
2-30
Target Costing for ProductDesign - Example
"Computetarget price
= $70
"Computetarget price
= $70
In this problem, thisis given. Usually thetarget price must beestimated by carefulstudy of prevailing
and expectedeconomic and
market conditions.
In this problem, thisis given. Usually thetarget price must beestimated by carefulstudy of prevailing
and expectedeconomic and
market conditions.

© The McGraw-Hill Companies, Inc., 2000Irwin/McGraw-Hill
2-31
Target Costing for ProductDesign - Example
#Computetarget costper unit = ?
#Computetarget costper unit = ?
"Computetarget price
= $70
"Computetarget price
= $70

© The McGraw-Hill Companies, Inc., 2000Irwin/McGraw-Hill
2-32
Target Costing for ProductDesign - Example
Target Cost per Unit
= $70 - ( $ 70 × 30% )
= 49$
Target Cost per Unit
= $70 - ( $ 70 × 30% )
= 49$
#Computetarget cost
per unit = $49
#Computetarget cost
per unit = $49
"Computetarget price
= $70
"Computetarget price
= $70

© The McGraw-Hill Companies, Inc., 2000Irwin/McGraw-Hill
2-33
Target Costing for ProductDesign - Example
$Compute thecurrently feasibletotal cost.
$Compute thecurrently feasibletotal cost.
"Computetarget price
= $70
"Computetarget price
= $70
#Computetarget cost
per unit = $49
#Computetarget cost
per unit = $49

© The McGraw-Hill Companies, Inc., 2000Irwin/McGraw-Hill
2-34
Target Costing for ProductDesign - Example
$Compute thecurrently feasibletotal cost.
$Compute thecurrently feasibletotal cost.
Currently Feasible
Cost = ( VC × Est. Sales ) + FC
= ( $52 × 105,000 ) + $1,200,000 = $6,660,000
"Computetarget price
= $70
"Computetarget price
= $70
#Computetarget cost
per unit = $49
#Computetarget cost
per unit = $49

© The McGraw-Hill Companies, Inc., 2000Irwin/McGraw-Hill
2-35
Target Costing for ProductDesign - Example
$Compute thecurrently feasibletotal cost.
$Compute thecurrently feasibletotal cost.
"Computetarget price
= $70
"Computetarget price
= $70
#Computetarget cost
per unit = $49
#Computetarget cost
per unit = $49
%Compare total target costto currently feasible totalcost = $?
%Compare total target costto currently feasible totalcost = $?

© The McGraw-Hill Companies, Inc., 2000Irwin/McGraw-Hill
2-36
Target Costing for ProductDesign - Example
$Compute thecurrently feasibletotal cost.
$Compute thecurrently feasibletotal cost.
"Computetarget price
= $70
"Computetarget price
= $70
#Computetarget cost
per unit = $49
#Computetarget cost
per unit = $49
%Compare total target costto currently feasible totalcost = $1,515,000
%Compare total target costto currently feasible totalcost = $1,515,000
Cost Reduction
Target =
Currently Feasible
Cost - (
Target Unit Cost
× Est. Sales )
= $6,660,000 - ( $49.00 × 105,000 ) = $1,515,000

© The McGraw-Hill Companies, Inc., 2000Irwin/McGraw-Hill
2-37
Balanced Scorecard
A cause-and-effect model of lead and lag indicators ofperformance that demonstrates how changes in one
operation cause or are balanced by changes in others.
A cause-and-effect model of lead and lag indicators ofperformance that demonstrates how changes in one
operation cause or are balanced by changes in others.
Four majorareas of
performance
"Learning and growth.
#Business and productionprocess efficiency.
$Customer value.
%Financial performance.
"Learning and growth.
#Business and productionprocess efficiency.
$Customer value.
%Financial performance.

© The McGraw-Hill Companies, Inc., 2000Irwin/McGraw-Hill
2-38
Avg. employeeeducation level
Avg. employeeeducation level
Hours of job-related training.
Hours of job-related training.
% of defectiveproducts
% of defectiveproducts
Process cycletime
Process cycletime
Retention ofexisting customers
Retention ofexisting customers
% of on-timedeliveries
% of on-timedeliveries
Return on SalesReturn on Sales
Measures of performance
Learning & growth
Business &production process
efficiency
Customer value
Final performance
Dimensions of performance

© The McGraw-Hill Companies, Inc., 2000Irwin/McGraw-Hill
2-39
Quantifying the CausalRelationships
A mathematical model that allows managers toestimate the effects on profitability from changes in
activities.
A mathematical model that allows managers toestimate the effects on profitability from changes in
activities.
The basicrelationship model
is:
δδδδY = b(δδδδX)
The basicrelationship model
is:
δδδδY = b(δδδδX)

© The McGraw-Hill Companies, Inc., 2000Irwin/McGraw-Hill
2-40
Quantifying the CausalRelationships
A mathematical model that allows managers toestimate the effects on profitability from changes in
activities.
A mathematical model that allows managers toestimate the effects on profitability from changes in
activities.
Weightings (b) areassigned to eachrelationship in thecausal BalancedScorecard Model.
The basicrelationship model
is:
δδδδY = b(δδδδX)
The basicrelationship model
is:
δδδδY = b(δδδδX)

© The McGraw-Hill Companies, Inc., 2000Irwin/McGraw-Hill
2-41
Balanced Scorecard - ExampleBennett Industries realizes that
a simple 1% increase in on-time deliveries will lead to a
.8% increase in customersatisfaction. A 1% increase incustomer satisfaction will lead
to a .3% increase in sales.If on-time delivery
improves by 5%, what willbe the effect on sales?
Bennett Industries realizes thata simple 1% increase in on-time deliveries will lead to a
.8% increase in customersatisfaction. A 1% increase incustomer satisfaction will lead
to a .3% increase in sales.If on-time delivery
improves by 5%, what willbe the effect on sales?
Retention ofexisting customers
Retention ofexisting customers
% of on-timedeliveries
% of on-timedeliveries
Sales RevenuesSales Revenues
+ .8 %
+.3 %

© The McGraw-Hill Companies, Inc., 2000Irwin/McGraw-Hill
2-42
Balanced Scorecard - ExampleIf on-time delivery
improves by 5%, what willbe the effect on sales?A 5% increase in on-timedelivery results in a 4%
increase in customer retention.This will lead, in turn, to a 1.2%
increase in sales revenues!
If on-time deliveryimproves by 5%, what will
be the effect on sales?A 5% increase in on-timedelivery results in a 4%
increase in customer retention.This will lead, in turn, to a 1.2%
increase in sales revenues!
Retention ofexisting customers
Retention ofexisting customers
% of on-timedeliveries
% of on-timedeliveries
Sales RevenuesSales Revenues
+ .8 %
+.3 %

© The McGraw-Hill Companies, Inc., 2000Irwin/McGraw-Hill
2-43
End of Chapter 2
I alwaysbalance myscorecards
before anyoneelse sees them!