Embed Size (px)
Citation preview
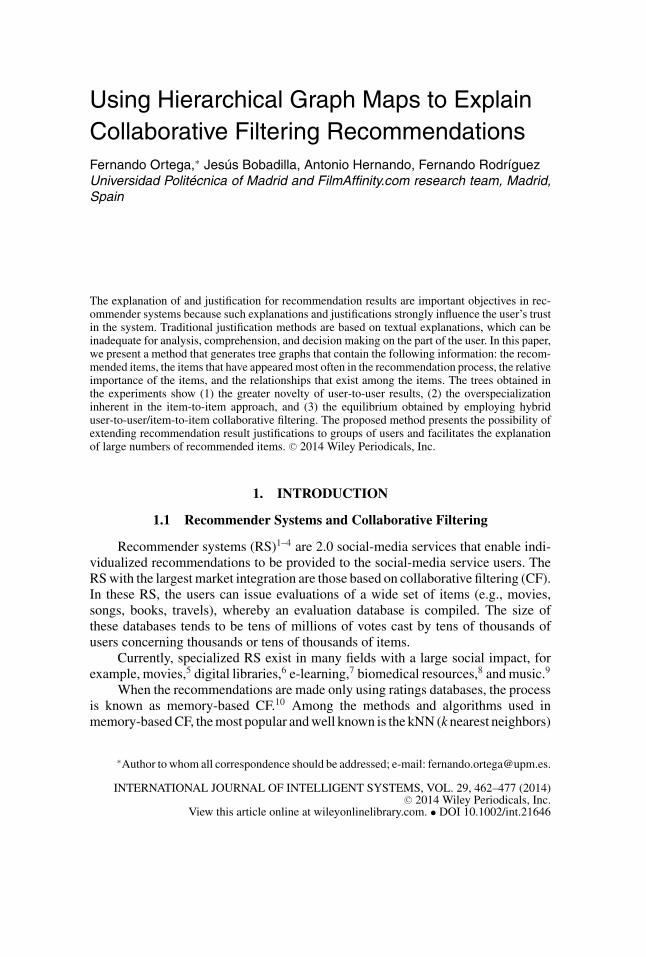
Using Hierarchical Graph Maps to ExplainCollaborative Filtering RecommendationsFernando Ortega,∗ Jesus Bobadilla, Antonio Hernando, Fernando RodrıguezUniversidad Politecnica of Madrid and FilmAffinity.com research team, Madrid,Spain
The explanation of and justification for recommendation results are important objectives in rec-ommender systems because such explanations and justifications strongly influence the user’s trustin the system. Traditional justification methods are based on textual explanations, which can beinadequate for analysis, comprehension, and decision making on the part of the user. In this paper,we present a method that generates tree graphs that contain the following information: the recom-mended items, the items that have appeared most often in the recommendation process, the relativeimportance of the items, and the relationships that exist among the items. The trees obtained inthe experiments show (1) the greater novelty of user-to-user results, (2) the overspecializationinherent in the item-to-item approach, and (3) the equilibrium obtained by employing hybriduser-to-user/item-to-item collaborative filtering. The proposed method presents the possibility ofextending recommendation result justifications to groups of users and facilitates the explanationof large numbers of recommended items. C© 2014 Wiley Periodicals, Inc.
1. INTRODUCTION
1.1 Recommender Systems and Collaborative Filtering
Recommender systems (RS)1–4 are 2.0 social-media services that enable indi-vidualized recommendations to be provided to the social-media service users. TheRS with the largest market integration are those based on collaborative filtering (CF).In these RS, the users can issue evaluations of a wide set of items (e.g., movies,songs, books, travels), whereby an evaluation database is compiled. The size ofthese databases tends to be tens of millions of votes cast by tens of thousands ofusers concerning thousands or tens of thousands of items.
Currently, specialized RS exist in many fields with a large social impact, forexample, movies,5 digital libraries,6 e-learning,7 biomedical resources,8 and music.9
When the recommendations are made only using ratings databases, the processis known as memory-based CF.10 Among the methods and algorithms used inmemory-based CF, the most popular and well known is the kNN (k nearest neighbors)
∗Author to whom all correspondence should be addressed; e-mail: [email protected].
INTERNATIONAL JOURNAL OF INTELLIGENT SYSTEMS, VOL. 29, 462–477 (2014)C© 2014 Wiley Periodicals, Inc.
View this article online at wileyonlinelibrary.com. • DOI 10.1002/int.21646
USING HIERARCHICAL GRAPH MAPS TO EXPLAIN COLLABORATIVE 463
algorithm.1 The conceptual principle of kNN is simple: “Let’s see what the userswith tastes most similar to our own recommend for us”. In the first phase, the userswho are the most similar (i.e., the neighbors) to the active user (i.e., the user towhom a recommendation is made) are determined. In the second phase, the ratingsof the active-user neighbors of those items on which the active user has not voted(and thus, in theory, is unaware of) are combined via an aggregation approach.
In addition to the user-to-user approach described above, there is the item-to-item approach.11 In this approach, using all of the memory-based information, wecan determine the k items that are similar to a given item. In this manner, based onthe items assessed “best” by the active user and the items that are similar to thosebest-assessed ones, we can establish recommendations.
When the kNN algorithm is used, the similarity measure12–14 that is employedto locate the active-user neighborhood determines the quality of the recommendationresults. In this sense, it is necessary to realize that the users who have cast very fewvotes (cold-start users). Ahn15 and Bobadilla et al.16 present an intrinsic difficultywhen attempting to determine their neighborhood because of the scarcity of the datarequired to establish similarities.
1.2 Explaining CF Recommendations: The State of the Art
An important research topic in the RS field is the provision of explanations thatjustify the recommendations that the user receives. This aspect of an RS is importantbecause it helps maintain a high degree of user confidence in the results generatedby the system.
Herlocker et al.17 provide a helpful introduction to the field of RS explana-tions. The study examines the utility of the explanations in CFRS and states threekey research questions: 1. What models and techniques are effective in supportingexplanations? 2. Can explanation facilities increase the acceptance of CFRS? 3. Canexplanation facilities increase the filtering performance of the CFRS users? To an-swer the first question, Herlocker et al.14 propose using rating histograms, indicationsof past performance, comparisons with similarly rated items, and domain-specificcontent features. The results of the experiments conducted with RS users supportan affirmative response to the second question. The third question is unansweredbecause users perform filtering based on many different input channels.
The types of explanations can be classified as follows:18
� Human-style explanations (the user-to-user approach). For example, “we recommendmovie i because it was liked by the users who rated movies j, k, m . . . very positively”(i.e., j, k, m . . . are movies rated highly by the active users).
� Item-style explanations (the item-to-item approach). For example, “we recommend thevacation destination i because you liked the vacation destinations g, c, r . . . ” (i.e., g, c,r . . . are vacation destinations similar to i and rated highly by the active users).
� Feature-style explanations (recommendations based on item features). For example, “werecommend movie i because it was directed by director d, features actors a and b, andbelongs to genre g” (i.e., d, a, b, g are features the active user is interested in).
� Hybrid methods. This category primarily includes the following hybrid explanation styles:human/item, human/feature, feature/item, and human/feature/item.
International Journal of Intelligent Systems DOI 10.1002/int
464 ORTEGA ET AL.
In addition, in geosocial RS (e.g., Foursquare and Google Latitude), location infor-mation exists that must be used in the recommendation-explanation mechanism.19
Geosocial RS typically adopts a hybrid human/item explanation based on social,location, and memory-based information.
A dynamic approach that supports RS-explanation mechanisms includes usingconversational techniques, such as conversational case-based reasoning (CCBR).20
CCBR uses an incremental nearest-neighbor process based on the Pareto case dom-inance approach. In a different study, McCarthy et al.21 adopt a dynamic approachthat employs a different perspective. Instead of attempting to justify a particularrecommendation, these researchers focus on how explanations can help the usersunderstand the recommendation opportunities that remain if the current recommen-dation does not meet their requirements. In this approach, compound critiques aregenerated as explanations; that is, the users have the opportunity to accept or critiquerecommendations. If the users critique a recommendation, the critique acts as a filterfor the remaining recommendations.
In a separate study, Bilgic and Mooney22 differentiate between the conceptspromotion (increasing the acceptance of the recommended item) and satisfaction(user satisfaction with the recommended item). These researchers obtain better re-sults using the keyword-style explanation (based on content data) than with theneighbor-style explanation (human-style explanation). Fahri23 provides a frame-work for organizing the justifications that are used for categorizing explanations.This researcher proposes the following discourse categories: explicative, theoretical,pragmatic, ethical, moral, legal, aesthetic, and personal. Although this theoreticalframework has not been used in the literature, it can be employed to design newexplanation types.
The most important investigations into justifications in RS include a study inwhich the authors designed a new organization interface that groups results accordingto their tradeoff properties.24 The study develops a trust model for recommenderagents based on the Pareto algorithm (excluding dominated categories). Symeonidiset al.25 first construct a feature profile in which the users reveal their favorite features.Next, these authors group the users into biclusters to exploit partial preferencematching between user and item groups. In addition, these researchers propose ametric to measure the quality of the justifications: the explain coverage ratio. In aseparate study, Symeonidis et al.26 use a prototype known as MoviExplain to testthe research presented by Symeonidis et al.25 Hu et al.27 use implicit feedback toderive an estimate of the user preference (the like or dislike for an item) and userconfidence for each user–item pair.
1.3 Motivation
The existing mechanisms for providing explanations of or justifications for theRS recommendations are based on textual information (i.e., “we recommend to youtourist destination i because you liked tourist destinations g, c, r . . . ”). Histogramshave been proposed as an alternative.17 However, their use has been limited becausethey do not provide users with easily understandable and convincing information onthe recommendations that the users receive.
International Journal of Intelligent Systems DOI 10.1002/int
USING HIERARCHICAL GRAPH MAPS TO EXPLAIN COLLABORATIVE 465
The use of phrases to justify or explain recommendations entails the followingproblems:
� They limit the quantity of information that is provided. Attempting to insert too manyexplanations into the phrases complicates their comprehension by the user.
� They are not attractive and motivating in the multimedia environment in which theyoriginate.
� They do not have an associated mechanism that permits the user to thoroughly investigatethe justification for the explanations.
� Upon receiving different textual justifications for each recommendation, it is not simpleto unify the information and opt for one alternative or another.
The recommendations justification model presented in this paper has the fol-lowing advantages compared with the traditional model:
� Instead of phrases, a graph is used. A graph can provide information of much higherquality that is assimilable by the user and is more attractive than a series of texts.
� A single graph facilitates the justification for all of the recommendations that the userreceives. The graph substitutes for the collection of phrases in the traditional model,where each phrase justifies each recommendation.
� The graph displays the recommendations alongside the contextual information requiredto justify the recommendations. The recommendations and the contextual informationprove to be related by their levels of similarity.
� The user can easily visually analyze the grouped justifications and obtain a unified con-clusion. The traditional model requires reading each justification phrase and attemptingto group the information mentally to make a decision.
1.4 Recommendations Visualization
Because of the lack of publications that provide visualization results of thememory-based information contained in RS, the academic starting point must bebased on a classical and general focus, that is, graph visualization28,29. When the sizeof the graphs is not small, as in this case, the approach used for their visualization isto convert the graph into a hierarchical graph map.30 To perform this conversion, anyof the well-known minimum spanning forest algorithms from the weighted graphcan be used.
At present, there are a large number of publications in which hierarchicalgraphs are provided based on a completely different data source from the one usedby RS, which is phylogenetic data. Phylogenomics is the study of the functional andevolutionary aspects of genome biology using the phylogenetic analysis of entiregenomes.31
Although phylogenetic trees share important characteristics with RS-basedtrees, the phylogenetic trees include an inheritance relationship between the nodesof the hierarchical structure. RS-based trees do not include this relationship.
The remainder of the paper is structured as follows: Section 2 describes theproposed recommendations visualization method, Section 3 reports the results, andSection 4 summarizes the study.
International Journal of Intelligent Systems DOI 10.1002/int
466 ORTEGA ET AL.
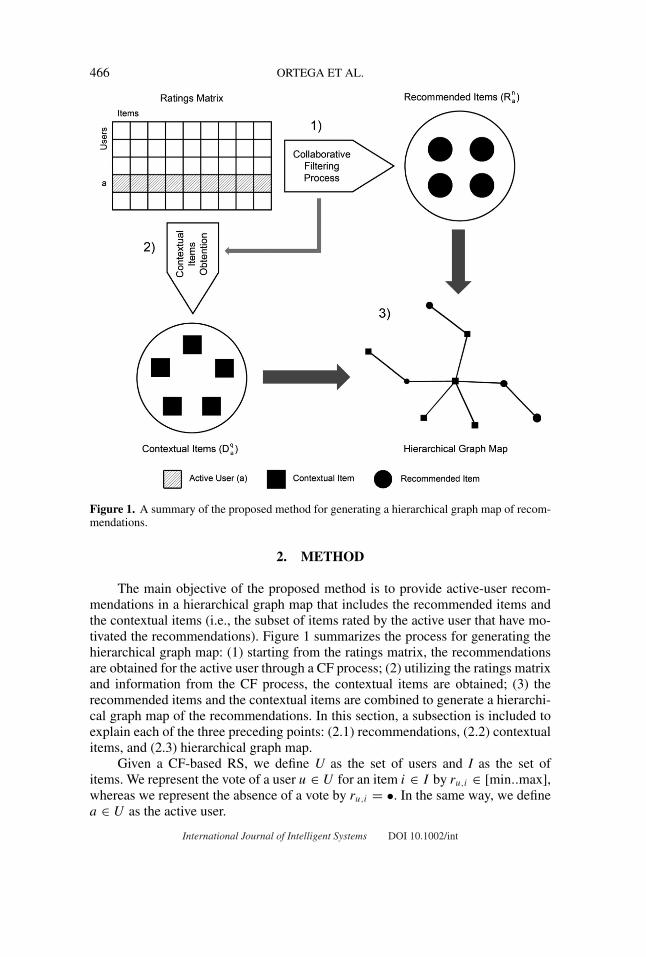
Figure 1. A summary of the proposed method for generating a hierarchical graph map of recom-mendations.
2. METHOD
The main objective of the proposed method is to provide active-user recom-mendations in a hierarchical graph map that includes the recommended items andthe contextual items (i.e., the subset of items rated by the active user that have mo-tivated the recommendations). Figure 1 summarizes the process for generating thehierarchical graph map: (1) starting from the ratings matrix, the recommendationsare obtained for the active user through a CF process; (2) utilizing the ratings matrixand information from the CF process, the contextual items are obtained; (3) therecommended items and the contextual items are combined to generate a hierarchi-cal graph map of the recommendations. In this section, a subsection is included toexplain each of the three preceding points: (2.1) recommendations, (2.2) contextualitems, and (2.3) hierarchical graph map.
Given a CF-based RS, we define U as the set of users and I as the set ofitems. We represent the vote of a user u ∈ U for an item i ∈ I by ru,i ∈ [min..max],whereas we represent the absence of a vote by ru,i = •. In the same way, we definea ∈ U as the active user.
International Journal of Intelligent Systems DOI 10.1002/int
USING HIERARCHICAL GRAPH MAPS TO EXPLAIN COLLABORATIVE 467
The proposed RS is based on the kNN memory-based CF algorithm. The algo-rithm enables one to obtain recommendations employing a user-to-user approach,an item-to-item approach, or a combination of both (an hybrid approach). For theuser-to-user approach, we define sim(u,v) as the similarity between the user u ∈ Uand the user v ∈ U , and we denote with Uk
a the set of k users who are neighbors ofthe active user a. For the item-to-item approach, we define sim*(i,j) as the similaritybetween the item i ∈ I and the item j ∈ I , and we denote with I s
i the set of s itemsthat are neighbors of the item i.
We define the cardinality of a set C as the number of valid elements, and werepresent it as #C = #{x ∈ C|x �= •}. For example, #{i ∈ I |ru,i �= •} indicates thenumber of items voted for by user u.
2.1. Active-User Recommendations
The kNN CF algorithm facilitates three approaches through which the rec-ommendations are obtained: user-to-user, item-to-item, or hybrid. The user-to-user(u2u) approach is the most frequently used, because it provides innovative and high-quality recommendations. The item-to-item (i2i) approach is used to recommenditems similar to those previously voted for by the user. However, this approachpresents the problem of overspecialization. The hybrid approach is used to takeadvantage of the benefits of the other alternatives. The proposed method enablesworking with these three approaches.
Let Ga,i be the set of neighbors of the active user a, who have rated the item i.
Ga,i = {u ∈ Uk
a
∣∣ru,i �= •}(1)
Let pa,i be the prediction of the k neighbors of the active user a about the itemi (user-to-user approach) using the weighted average as the aggregation approach.
pa,i =
⎧⎪⎪⎪⎪⎪⎨⎪⎪⎪⎪⎪⎩
∑u∈Ga,i
sim(a, u)ru,i
∑u∈Ga,i
sim(a, u)⇔ Ga,i �= ∅
• ⇔ Ga,i = ∅
(2)
Let G∗a,i be the set of neighbors of the item i that have been rated by the active
user a.
G∗a,i = {
j ∈ I si
∣∣ra,j �= •}(3)
Let p∗a,i be the prediction of the s neighbor items of the item i to the active user
a (item-to-item approach) using the weighted average as the aggregation approach.
International Journal of Intelligent Systems DOI 10.1002/int
468 ORTEGA ET AL.
p∗a,i =
⎧⎪⎪⎪⎪⎪⎪⎨⎪⎪⎪⎪⎪⎪⎩
∑j∈G∗
a,i
sim∗(i, j )ra,j
∑j∈G∗
a,i
sim∗(i, j )⇔ G∗
a,i �= ∅
• ⇔ G∗a,i = ∅
(4)
The CF suffers from the sparsity problem because each user votes only for asmall percentage of the items of the system32,33. In the prediction phase, this problemleads us to find the predictions that are performed with few neighbors (regardlessof whether they are users or items). The predictions calculated with few votes havelower reliability than those calculated with many votes. For example, a predictionof 4.5 (on a scale of 1 to 5 stars) calculated with 20 votes will have a significantlyhigher reliability than a prediction of 5.0 calculated with 1 vote, and as a result, it ismore logical to recommend the first item.
The reliability concept has been recently studied.34 The proposed methodfundamentally considers the reliability of each prediction based on the number ofvotes used in the aggregation approach phase. We define the parameter θ ∈ [1..∞)that indicates the minimum number of votes required in the aggregation approachfor a user to consider a prediction reliable.
Let ta,i be the reliability of the prediction to the active user a about the item i(pa,i) provided by the k neighbors users to the active user a:
ta,i = min(θ, #Ga,i)
θ, ta,i ∈ [0, 1] (5)
Let t∗a,i be the reliability of the prediction to the active user a about item i (p∗a,i)
provided by the s neighbors items of the item i.
t∗a,i = min(θ, #G∗a,i)
θ, t∗a,i ∈ [0, 1] (6)
In this manner, each user-to-user prediction is defined by the pair 〈pa,i, ta,i〉,and each item-to-item prediction is defined by the pair 〈p∗
a,i , t∗a,i〉.
In the recommendation phase, we search for those items that have a highprediction, and the prediction will be reliable. We define wa,i as the value of theprediction to the active user a about the item i weighted with the reliability offered bythe prediction. According to the type of calculated predictions (u2u, i2i, or hybrid),wa,i will take three possible values, which are as follows:
wu2ua,i =
{ta,ipa,i ⇔ pa,i �= •• ⇔ pa,i = • (7.1)
International Journal of Intelligent Systems DOI 10.1002/int
USING HIERARCHICAL GRAPH MAPS TO EXPLAIN COLLABORATIVE 469
wi2ia,i =
{t∗a,ip
∗a,i ⇔ p∗
a,i �= •• ⇔ p∗
a,i = • (7.2)
whybrida,i =
⎧⎪⎪⎪⎨⎪⎪⎪⎩
αta,ipa,i + (1 − α)t∗a,ip∗a,i ⇔ pa,i �= • ∧ p∗
a,i �= •ta,ipa,i ⇔ pa,i �= • ∧ p∗
a,i = •t∗a,ip
∗a,i ⇔ pa,i = • ∧ p∗
a,i �= •• ⇔ pa,i = • ∧ p∗
a,i = •, (7.3)
where α ∈ [0, 1] is the parameter with which the relative importance of the user-to-user approach is indicated with respect to the item-to-item approach.
Finally, we obtain the n recommendations with the set of n items with a valuehigher than wa,i . Let Rn
a be the set of n items recommended to the active user a. Thefollowing should be fulfilled:
Rna ⊆ {i ∈ I |ra,i = •}, #Rn
a ≤ n, ∀i ∈ Rna , ∀j /∈ Rn
a : wa,i ≥ wa,j (8)
2.2. Active-User Contextual Items
To provide a meaningful context for the recommended items, we select fromthe items voted by the user those items that possess the following characteristics:
� The items should be similarly valued by the active user a and his or her k users neighbors(only for u2u and hybrid).
� The items should be similar to one of the items that have been recommended to the activeuser (only for i2i and hybrid).
� The items should have been valued positively by the active user.
Figure 2 represents the process that is followed to determine whether an itemvoted by the active user is representative with respect to the recommendation thatthe user has received. Starting from the voting of the active user and the voting ofhis or her k neighbors, we calculate the influence of each item on the recommen-dations received according to four factors: (a) the influence of the neighbors on therecommendations (d(u)); (b) the consensus that exists in the valuation of the item onthe part of the active user and the k neighbors (d(i)); (c) the resemblance of the itemto the other recommended items (d*(i)); and (d) the degree to which the valuationof the active user for the item has been positive.
Let d(u) be the influence that the neighbor u ∈ Uka has had on the recommen-
dations performed by the active user a. We calculate d(u) as the proportion of itemsrecommended to the active user a voted for by u with respect to those voted for bythe k neighbors of the active user a.
d(u) = #{j ∈ Rn
a
∣∣ru,j �= •}∑v∈Uk
a
#{j ∈ Rn
a
∣∣rv,j �= •} , d(u) ∈ [0, 1], ∀u ∈ Uka (9)
International Journal of Intelligent Systems DOI 10.1002/int

470 ORTEGA ET AL.
Figure 2. The process followed to calculate the influence of each item voted for by the active useron the recommendation that the user receives.
Let d(i) be the consensus that exists in the valuation of the item i between theactive user a and the set of the k neighbors of the active user a. We calculate d(i) asthe difference between the vote for i of the active user a and the vote for i of his orher neighbors, weighting the importance of each neighbor (d(u)).
d(i) =
∑u∈Ga,i
d(u)(1 − |ra,i − ru,i |)
#Ga,i
, d(i) ∈ [0, 1], ∀i ∈ I |ra,i �= • (10)
Let d*(i) be the average similarity of the item i to the items recommended tothe active user a (Rn
a ), of which i is a neighbor (I si ); that is, the average similarity of
the item i to the set of items Rna ∩ I s
i .
d∗(i) =
∑j∈{Rn
a∩I si }
sim∗(i, j )
#{Rn
a ∩ I si
} ,
d∗(i) ∈ [0, 1] ⇔ sim∗(i, j ) ∈ [0, 1], ∀i ∈ I |ra,i �= • (11)
Finally, we define d(i) as the influence that the item i has had on the setof recommendations. According to the method that is followed to obtain the
International Journal of Intelligent Systems DOI 10.1002/int
USING HIERARCHICAL GRAPH MAPS TO EXPLAIN COLLABORATIVE 471
recommendations (u2u, i2i or hybrid), d(i) can take three different values, whichare as follows:
d(i)u2u = (ra,i/max)d(i) (12.1)
d(i)i2i = (ra,i/max)d∗(i) (12.2)
d(i)hybrid = (ra,i/max)d(i)d∗(i) (12.3)
Let Dqa be the set of q items voted for by the active user a that have a larger
influence on the recommendations that the active user a received. The items thatbest represent the recommendations performed for the active user a will be in D
qa .
Formally,
Dqa ⊆ {i ∈ I |ra,i �= •}, #Dq
a ≤ q, ∀i ∈ Dqa , ∀j /∈ Dq
a : d(i) ≥ d(j ) (13)
2.3. Recommendations Representation
We use hierarchical graph maps to represent the items that are recommendedto the active user and the items most related with them (the contextual items). Thehierarchical graph map is tree shaped and is constructed as follows: (1) a completeundirected graph is constructed in which the nodes are the items to be representedand the edges are the similarity among the items; (2) the maximum spanning treeof the preceding graph is calculated. To calculate the similarity between two items,we use Jaccard Mean Squared Differences.13 To calculate the tree, we use Prim’sclassic maximum spanning forest algorithm.
The edges of the tree generated by the Prim algorithm represent the relationshipsamong the items. These edges have associated complementary information. The sizeof the edge indicates the similarity (obtained by mean squared differences) that twoitems have: short distances signify great similarity; long distances signify littlesimilarity. The color of the edge indicates the reliability of the similarity (obtainedby the Jaccard index) that two items have; warm colors indicate high reliability,whereas cool colors indicate low reliability.
The tree has two node types: contextual and recommended. The contextualnodes represent the items valued by the user that have a larger influence on therecommendations provided. In the tree, each contextual node i has a white square-shaped appearance, and the node’s size depends on the vote that the active userhas given the item i (ra,i). The recommended nodes represent the items that arerecommended to the active user. In the tree, each recommended node i has a circularappearance. The node’s color depends on the reliability of the prediction performed(ta,i), and its size depends on the value of the prediction (pa,i).
The prediction value of the vote of the active user a of item i, pa,i , indicatesthe size of the recommended node i. The items that have a high prediction value are
International Journal of Intelligent Systems DOI 10.1002/int
472 ORTEGA ET AL.
Table I. The main characteristics of the nodes represented in the tree.
Color Size Shape
Items �Dqa White ra,i Square
Items �Rna ta,i pa,i Circle
larger than those with a low prediction value. The value of pa,i depends on whetherwe employ the user-to-user approach (14.1), the item-to-item approach (14.2), orthe hybrid approach (14.3).
pu2ua,i =
{pa,i ⇔ pa,i �= •• ⇔ pa,i = • (14.1)
pi2ia,i =
{p∗
a,i ⇔ p∗a,i �= •
• ⇔ p∗a,i = • (14.2)
phybrida,i =
⎧⎪⎪⎪⎨⎪⎪⎪⎩
αpa,i + (1 − α) p∗a,i ⇔ pa,i �= • ∧ p∗
a,i �= •pa,i ⇔ pa,i �= • ∧ p∗
a,i = •p∗
a,i ⇔ pa,i = • ∧ p∗a,i �= •
• ⇔ pa,i = • ∧ p∗a,i = •
(14.3)
The reliability value of the prediction of the item i to the active user a, ta,i ,determines the color of the recommended node i. The reliable predictions appear inwarm tones, whereas the unreliable predictions appear in cool tones. ta,i acquiresdistinct values according to whether we obtain the recommendations with the user-to-user approach (15.1), the item-to-item approach (15.2), or the hybrid approach(15.3).
t u2ua,i = ta,i , t u2u
a,i ∈ [0, 1] (15.1)
t i2ia,i = t∗
a,i, t i2i
a,i ∈ [0, 1] (15.2)
thybrida,i = αta,i + (1 − α)t∗a,i , t
hybrida,i ∈ [0, 1] (15.3)
Table I summarizes the elements used to represent the nodes of the tree.
3. RESULTS AND DISCUSSION
In this section, the experiments performed to verify the functionality of the pro-posed method are presented. As an example, we have chosen at random a user fromthe MovieLens database (specifically, the user with the identification code 3754) andgenerate this user’s recommendations tree in three different manners: user-to-user
International Journal of Intelligent Systems DOI 10.1002/int
USING HIERARCHICAL GRAPH MAPS TO EXPLAIN COLLABORATIVE 473
Table II. The main parameters used in the experiments.
Parameter Value
Number of contextual items (q) 20Number of recommendations (n) 10Number of user neighbors (k) 50Number of item neighbors (s) 50Reliability threshold for recommendations (θ ) 4Reliability threshold for the representation (θ ) 20Method influence on the hybrid approach (α) 0.5
recommendations, item-to-item recommendations, and hybrid recommendations.Table II displays the main parameters used in the experiments.
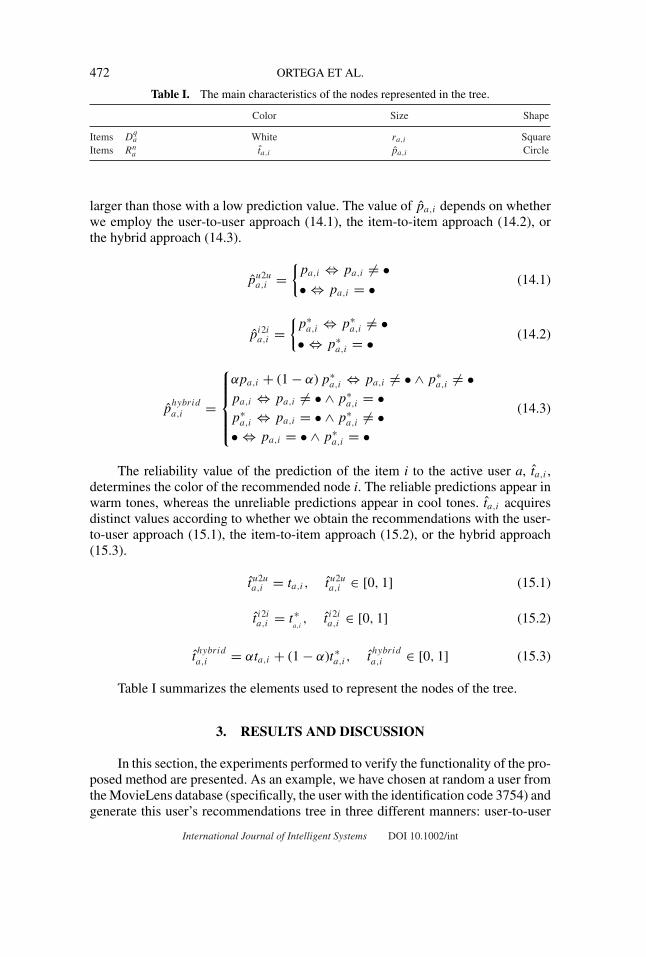
Figure 3 contains the hierarchical graph map obtained by calculating the recom-mendations for the active user via the user-to-user predictions. The tree is composedof primarily cool colors because the recommendations given by the k neighboringusers tend to be highly innovative and not related among themselves. Examining the
Figure 3. The hierarchical graph map that explains the user-to-user CF recommendations forUser 3754 from MovieLens.
International Journal of Intelligent Systems DOI 10.1002/int
474 ORTEGA ET AL.
Figure 4. The hierarchical graph map that explains the item-to-item CF recommendations forUser 3754 from MovieLens.
graph, the user will most likely choose Titanic, The Game, or Boogie Nights becausethe nodes are large, warm in color, and close to those of the preferred films. Theuser will postpone watching The Perfect Storm because it is a smaller node with acooler color.
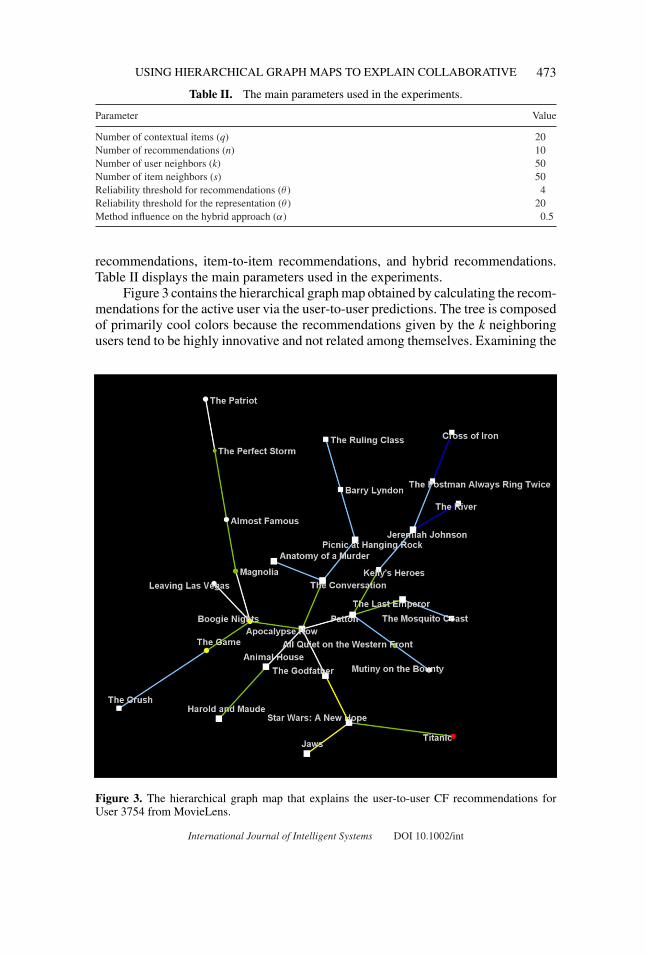
Figure 4 presents the hierarchical graph map obtained by calculating the rec-ommendations for the active user with item-to-item predictions. In this case, thetree displays much warmer colors than that of Figure 3, which indicates that theitems represented are better related. The problem of the recommendations obtaineditem-to-item is their overspecialization; only films similar to those preferred by theuser are recommended. With this graph, the user could choose to watch SavingPrivate Ryan because it is highly related to Star Wars: The Empire Strikes Back orselect The Bridge on the River Kwai because it is represented by red and related toApocalypse Now. However, it is unlikely that the user would opt to watch All Quietin the Western Front or Mr. Smith Goes to Washington because they are representedin cool tones and their nodes are distant from those of the films that the user hasalready watched.
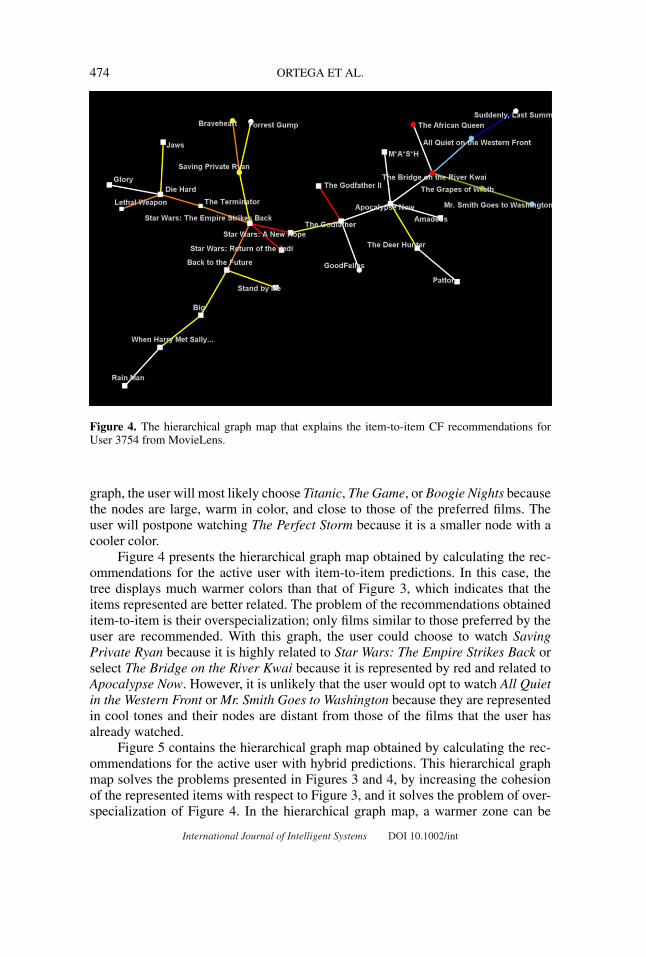
Figure 5 contains the hierarchical graph map obtained by calculating the rec-ommendations for the active user with hybrid predictions. This hierarchical graphmap solves the problems presented in Figures 3 and 4, by increasing the cohesionof the represented items with respect to Figure 3, and it solves the problem of over-specialization of Figure 4. In the hierarchical graph map, a warmer zone can be
International Journal of Intelligent Systems DOI 10.1002/int
USING HIERARCHICAL GRAPH MAPS TO EXPLAIN COLLABORATIVE 475
Figure 5. The hierarchical graph map that explains the hybrid CF recommendations for User3754 from MovieLens.
observed (the left part of the graph) that contains recommendations that are morerelated to the voting of the user. Similarly, a cooler zone can be observed (the rightpart of the graph) that contains novel recommendations less similar to the itemsalready valued. If the user prefers to be certain of liking the selected movie, the userwould opt for Raiders of the Lost Ark or Saving Private Ryan. However, if the userprefers to make an adventurous choice, the user would choose Butch Cassidy andthe Sundance Kid or The Bridge on the River Kwai.
4. CONCLUSIONS
Explaining recommendations is an important research field in the area of CF.Whereas a substantial effort has been made to improve the accuracy of the recom-mendations that are made in RS, the method to explain and justify to the user theresults that are offered has received significantly less attention.
Today, RS that offer an ample collection of services can be more successfulthan those that only focus on providing good recommendations. The explanationof and justification for the recommendations provided to users is a service that candirectly help increase user’s confidence in the RS, thereby promoting the system’suse and improving the quality of the recommendations.
The traditional method to present justifications for recommendation, that is,textual phrases, is inadequate for the analysis, comprehension, and decision making
International Journal of Intelligent Systems DOI 10.1002/int
476 ORTEGA ET AL.
of the users. In this paper, a method was suggested that presents in a single graphthe recommendations and the most relevant contextual information involved in therecommendation process.
The paper explained how to construct a tree that exhibits the recommendeditems, the items that have appeared most frequently in the recommendation process,the relative importance of the items, and the relationships that exist among them.
On the basis of experiments, three alternative recommendation explanationswere presented for a random user from the MovieLens database: (1) user-to-user,(2) item-to-item, and (3) hybrid CF. The trees obtained exhibit: (1) greater noveltyin the user-to-user results, (2) the overspecialization inherent in the item-to-itemapproach, and (3) the equilibrium achieved with hybrid user-to-user/item-to-itemCF.
The proposed method presents the possibility of extending the justificationfor recommendation results to user groups and demographic sectors (i.e., youngmen ranging from 15 to 18 years of age in the San Francisco area). In addition,the method enables experimentation on the effect of providing a large number ofrecommended items and the evaluation of the acceptance and comprehension ofthe recommendations by the users. The large number of recommendations that ourmethod accommodates would exceed the user’s capacity to evaluate the multipleexplanatory texts that are generated by text-based justification.
Acknowledgments
The authors thank the Grouplens Research Group and FilmAffinity.com. In addition, wethankfully acknowledge the computer resources, technical expertise, and assistance providedby the Supercomputing and Visualization Center of Madrid and the Spanish SupercomputingNetwork.
References
1. Adomavicius G, Tuzhilin A. Toward the next generation of recommender systems: a surveyof the state-of-the-art and possible extensions. IEEE Transactions on Knowl Data Eng2005;17(6):734–749.
2. Breese JS, Heckerman D, Kadie C. Empirical analysis of predictive algorithms for collab-orative filtering. 14th Conf on Uncertainty in Artificial Intelligence, San Francisco, CA:Morgan Kaufmann; 1998. pp 43–52.
3. Martınez L, Perez LG, Barranco MJ. A multigranular linguistic content-based recommen-dation model. Int J Intell Syst 2007;22(5):419–434.
4. Shambour Q, Lu J. A hybrid trust-enhanced collaborative filtering recommendation approachfor personalized government-to-business e-services. Int J Intell Syst 2011;26(9):814–843.
5. Antonopoulus N, Salter J. Cinema screen recommender agent: combining collaborative andcontent-based filtering. IEEE Intell Syst 2006;35–41.
6. Porcel C, Herrera-Viedma E. Dealing with incomplete information in a fuzzy linguisticrecommender system to disseminate information in university digital libraries. Knowl-BasedSyst 2010;23(1):32–39.
7. Bobadilla J, Serradilla F, Hernando A. Collaborative filtering adapted to recommendersystems of e-learning. Knowl-Based Syst 2009;22:261–265.
8. Morales JM, Peis E, Ruiz AA, Herrera-Viedma A. Recommending biomedical resources: afuzzy linguistic approach based on semantic Web. Int J Intell Syst 2010;25(12):1143–1157.
International Journal of Intelligent Systems DOI 10.1002/int
USING HIERARCHICAL GRAPH MAPS TO EXPLAIN COLLABORATIVE 477
9. Li Q, Myaeng SH, Kim BM. A probabilistic music recommender considering user opinionsand audio features. Inf Process Manage 2007;43(2):473–487.
10. Herlocker JL, Konstan JA, Riedl JT, Terveen LG. Evaluating collaborative filtering recom-mender Systems. ACM Trans Inf Syst 2004;22(1):5–53.
11. Sarwar B, Karypis G, Konstan J, Riedl J. Item-based collaborative filtering recommendationalgorithms. World Wide Web conference, Hong Kong; May 1–5, 2001. pp 285–295.
12. Bobadilla J, Ortega F, Hernando A. A collaborative filtering similarity measure based onsingularities. Inf Process Manage 2012a;48(2):204–217.
13. Bobadilla J, Serradilla F, Bernal J. A new collaborative filtering metric that improves thebehavior of recommender Systems. Knowl-Based Syst 2010;23(6);520–528.
14. Bobadilla J, Ortega F, Hernando A, Arroyo A. A Balanced Memory-Based CollaborativeFiltering Similarity Measure. Int J Intell Syst 2012;27:939–946.
15. Ahn HJ. A new similarity measure for collaborative filtering to alleviate the new usercold-starting problem. Inf Sci 2008;178(1):37–51.
16. Bobadilla J, Ortega F, Hernando A, Bernal J. A collaborative filtering approach to mitigatethe new user cold start problem. Knowl-Based Syst 2012b;26:225–238.
17. Herlocker JL, Konstan JA, Riedl J. Explaining collaborative filtering recommendations.ACM Conference on Computer Supported Cooperative Work Philadelphia, PA; December02–06, 2000. pp 241–250.
18. Papadimitriou A, Symeonidid P, Manolopoulus Y. A generalized taxonomy of explana-tions styles for traditional and social recommender systems. Data Min Knowl Discovering2012;24(3):555–583.
19. Yang WS, Cheng HCh, Dia JB. A location-aware recommender system for mobile shoppingenvironments. Expert Systems Appl 2008;34(1):437–445.
20. McSherry D. Explanation in Recommender Systems. Artif Intell Rev 2005;24(2):179–197.21. McCarthy K, Reilly J, McGinty L, Smyth B. Thinking positively—Explanatory feedback
for conversational recommender systems. European Conference on Case-based reasoning(ECCBR), Madrid, Spain; August 30–September 2, 2004. pp 115–124.
22. Bilgic M, Mooney R. Explanation for recommender systems: satisfaction vs. promotion.Next Stage of Recommender Systems Research Workshop (IUI conference), San Diego,CA; January 9, 2005. pp 13–18.
23. Fahri Y. A framework for organizing justifications for strategic use in adaptive iterationcontexts. ECIS 2008;250.
24. Pu P, Chen L. Trust-inspiring explanation interfaces for recommender systems. Knowl-Based Syst 2007;20:542–556.
25. Symeonidis P, Nanopoulus A, Manolopoulus Y. Providing justifications in recommendersystems. IEEE Trans Syst Man Cybernet 2008;38(6):1262–1272.
26. Symeonidis P, Nanopoulus A, Manolopoulus Y. MoviExplain: A recommender systemwith explanations. ACM Conference in Recommender Systems (RECSYS), New York, NY;October 23–25, 2009. pp 317–320.
27. Hu Y, Koren Y, Volinsky Ch. Collaborative filtering for implicit feedback datasets. IEEEInt Conf on Data Mining (ICDM), Pisa, Italy; December 15–19, 2008. pp 263–272.
28. Herman I, Melancon G, Marshall S. Graph visualization and navigation in informationvisualization: a survey. IEEE Trans Visualization Comput Graphics 2000;6(1):24–43.
29. Michailidis G. Data visualization through their graph representations. Handbook of datavisualization 2008;103–120.
30. Abello J. Hierarchical graph maps. Comput Graphics 2004;28:345–359.31. Dagan T. Phylogenomic networks. Trends Microbiol 2001;19(10):483–491.32. Papgelis M, Plexousakis D, Kutsuras T. Alleviating the sparsity problem of collaborative
filtering using trust inferences. Lect Notes Comput Sci 2005;3477:224–239.33. Su X, Khoshgoftaar TM. A survey of collaborative filtering techniques. Adv Artif Intell
2009; 4.34. Hernando A, Bobadilla J, Ortega F, Tejedor J. Incorporating reliability measurements into
de predictions of a recommender system. Inf Sci 2012;218:1–16.
International Journal of Intelligent Systems DOI 10.1002/int