Embed Size (px)
Citation preview
land degradation & development
Land Degrad. Develop. 21: 474–479 (2010)
Published online 17 March 2010 in Wiley Online Library (wileyonlinelibrary.com) DOI: 10.1002/ldr.983
USING CS-137 FINGERPRINTING TECHNIQUE TO ESTIMATE SEDIMENTDEPOSITION AND EROSION RATES FROM YONGKANG DEPRESSION
IN THE KARST REGION OF SOUTHWEST CHINA
X.-Y. BAI1,2,4, X.-B. ZHANG1,3*, H. CHEN2 AND Y.-B. HE1,4
1Key Laboratory of Mountain Environment Evolvement and Regulation, Institute of Mountain Hazards and Environment,Chinese Academy of Sciences, Sichuan 610041, PR China
2Institute of South China Karst, Guizhou Normal University, Guizhou 550001, PR China3State Key Laboratory of Environmental Geochemistry, Institute of Geochemistry, Chinese Academy of Sciences, Guizhou 550002, PR China
4Graduate School of Chinese Academy of Sciences, Beijing 100029, PR China
Received 21 October 2009; Revised 21 January 2010; Accepted 21 January 2010
ABSTRACT
Understanding the erosion and deposition rates is very important for designing soil and water conservation measures. However, existingmethods of assessing the rates of soil loss present many limitations and are difficult to apply to in karst areas, and there is still very little data inthis areas. Karst depressions comprise geomorphologically important sources and sinks for sediments and can provide the long-term historyrecords of environmental changes. But there have been few similar studies focused on its sediments in the world. In this paper, the Cs-137technique was employed to estimate the sediment deposition rate of karst depression to assess the surface erosion. The results indicate that theaverage deposition rate, deposition amount and specific deposit yield for the Yongkang catchments since 1963 were estimated to be4�32mmy�1, 3�16 t y�1and 20�53 t km�2 y�1, respectively. The results obtained were consistent with the actual monitoring data of localrunoff plots, and confirm the validity of the overall approach. So it was suggested that the mean specific sediment yields of 20 t km�2 y�1 canbe representative of the soil loss rates in the regions. Copyright # 2010 John Wiley & Sons, Ltd.
key words: sediment production records; karst depression; caesium-137; erosion; PR China
INTRODUCTION
Soil erosion has been a global environmental problem, and
information on rates of soil loss is an important requirement
both for quantifying the problem and for developing
improved land management and soil conservation practices.
However, it is a pity that reliable data on soil erosion rates is
very limited in karst areas (Karst Research Group of the
Institute of Geology, 1987; Cao and Yuan, 2005; Ford and
Williams, 2007). One of the most important reasons is that,
existing traditional methods of assessing rates of soil loss
possess many limitations and are hampered by a range of pro-
blems, because there is a dual structure in karst environment
including ground and underground drainages (Xiong et al.,
2002;Wang et al., 2002, 2004a and 2004b; Ford and
Williams, 2007).
Although 137Cs tracer technique has been widely used in
homogeneous soils over the world (Zhang et al., 1990, 1997,
*Correspondence to: X.-B. Zhang, Institute of Mountain Hazards andEnvironment, Chinese Academy of Sciences, Chengdu, Sichuan, 610041,PR China.E-mail: [email protected]
Copyright # 2010 John Wiley & Sons, Ltd.
1998; Owens et al., 1999;Walling et al., 1999; Zapata, 2003;
Ritchie et al., 2004), it is also difficult to apply to limestone
soil of carbonate rock slopes. Besides the dual structure’
effects, another important reason is that, 137Cs is absorbed
by soil particles instead of stones. Bared bedrock, discon-
tinuous soil covering and various proportions of gravels and
different depth of soil layer result in strong heterogeneity of
the soil in karst slopes. So it will face the great challenge to
apply this technique in karst areas.
As we all know, lake sediments can provide the long-term
history records of environmental changes (Albrecht et al.,
1998; Zapata, 2003). We found that karst depressions are
widespread and numerous in many karst areas (Cao and
Yuan, 2005; Ford and Williams, 2007), as an unique and
marvelous landform, and there have been few similar studies
focused on its sediments by using 137Cs technique in the
world, although it as an excellent tracer has been also com-
monly used for determining sedimentation rates in various
deposition environments such as floodplains, lakes, estu-
aries, reservoirs, and deltas. So it is the core of this paper to
use 137Cs fingerprinting techniques to estimate sediment
deposition and erosion rates from karst depressions.

Figure 2. Geographical environment and sampling site.
ESTIMATING SEDIMENT DEPOSITION AND EROSION RATES 475
STUDY AREA
Yongkang depression is located near Yongkang Town, Libo
County, Guizhou Province, China, which is a typical closed
catchments (Figure 1). The drainage area of the catchments
is 0�154 km2, and the elevations varied between 860 and
1020m. Most of the catchments are underlain by limestone
of Late Carboniferous Datang Group (C1d). The local
climate is subtropical monsoon, with an average annual
rainfall 1470mm, and the average annual temperature is
198C. The rainy season (April–August) precipitation
accounts for 83 per cent of the annual precipitation, and
floods happen frequently in the wet season, while average
monthly precipitation is below 60mm in the dry season from
October toMarch each year. Most soils in the catchments are
clay limestone materials, which are the weathering products
from limestone. The depression with a length of about 420m
and a width of about 280m is entirely cultivated at present
and there is a sinkhole in the western part of the depression.
The natural vegetation of the study area is dominated by
calcicole shrubs and drought tolerant herbs which flourish on
the thin soils covering the slopes.
FIELD SAMPLING AND LABORATORY
MEASUREMENT
Sampling was undertaken at Luoyang Town next to the
Yongkang catchment for the local 137Cs reference inventory
in November, 2007. Ideally the core for the reference
inventory profile, which is used to estimate the total or
reference fallout, should be collected from flat undisturbed
land. However, it is difficult to find flat land which has not
been cultivated since the mid-1950s in the study area,
therefore, the core from a flat cultivated land was selected
for the purpose. The sampling site with an area of about
110m2 (20m� 6m) was a flat paddy terrace covering the
Quaternary red clay soil. 31 soil bulk samples and 1 soil
Figure 1. Geographical position of study area. This figure i
Copyright # 2010 John Wiley & Sons, Ltd.
depth incremental sample were collected by grid sampling
with a spacing of 2m� 1�2m. Bulk samples were collected
using a 6�5 cm diameter core tube, which was propelled into
the ground manually to a depth of 30–40 cm. Sampling to
this depth ensured that the total 137Cs inventory of the profile
was measured. The method for collecting the depth
incremental samples was similar to the one for soil profile
collection in the depression.
In the same time, three incremental samples were
collected at different positions of Yongkang depression
(Figure 2). Angles and distances were measured from an
electronic total station to the boundary points of this
depression under survey, and the coordinates (X, Y, and Z) of
surveyed points relative to the total station position were
calculated using trigonometry. And then the depression area
of 610m2 was also calculated according to the coordinates
of the boundary points.
s available in colour online at wileyonlinelibrary.com
LAND DEGRADATION & DEVELOPMENT, 21: 474–479 (2010)

476 X.-Y. BAI ET AL.
137Cs activity of the soil samples were measured in the
Isotope Laboratory of Department of Physics, Sichuan
University, China. All samples were air-dried, disaggre-
gated, passed through a 2mm sieve and weighed. The137Cs content of the <2mm fraction of each sample was
measured by g spectrometry using a hyper pure coaxial
germanium detector and multichannel analyzer system. The
samples have a weight of �250 g. 137Cs was detected at
662 keV and counting times were more than 3,3000 s,
providing results with an analytical precision of approxi-
mately �5 per cent at the 90 per cent level of confidence.
Particle size distributions of the sediment samples were
measured in the Soil Laboratory of Chengdu Institute of
Mountain Hazards and Environment, Chinese Academy of
Sciences, by a laser particle size analyzer with a measuring
range of 0�1–600mm, accuracy error �5 per cent and
repeatability error �3 per cent, respectively.
RESULTS AND ANALYSIS
137Cs Reference Inventory and the Plough Layer
Among the 32 samples, 137Cs inventories varied from 754�6–1273�8Bqm�2, with a coefficient of variation (CV) of 14�5per cent. The average value of 997�7Bqm�2 was considered
as the 137Cs reference inventory of the study area. The depth
of plough layer could be estimated from the 137Cs depth
distribution of the reference profile due to the similar tillage
method between the 137Cs reference site and the depression
in this study. Depth distribution of 137Cs in reference site was
illustrated in Figure 3. 137Cs was almost evenly distributed
within the 0–15 cm topsoil, while the 137Cs concentrations
Figure 3. Depth distributions of 137Cs in the reference profile.
Copyright # 2010 John Wiley & Sons, Ltd.
ranged between 4�32 and 5�65Bq kg�1, with a mean value of
5�03Bq kg�1, and then 137Cs concentration decreased as the
depth increases from the depth of 15cm. The result of our
actual measurement using the rule was also about 15cm. And
the popular saying of local peasants holds true: the depth
of the plough layer is 15 cm. All these confirmed the depth of
local plough layer is 15 cm. So it is decided that the depth of
plough layer is 15 cm for the study field in this paper.
The Proof of Sediment
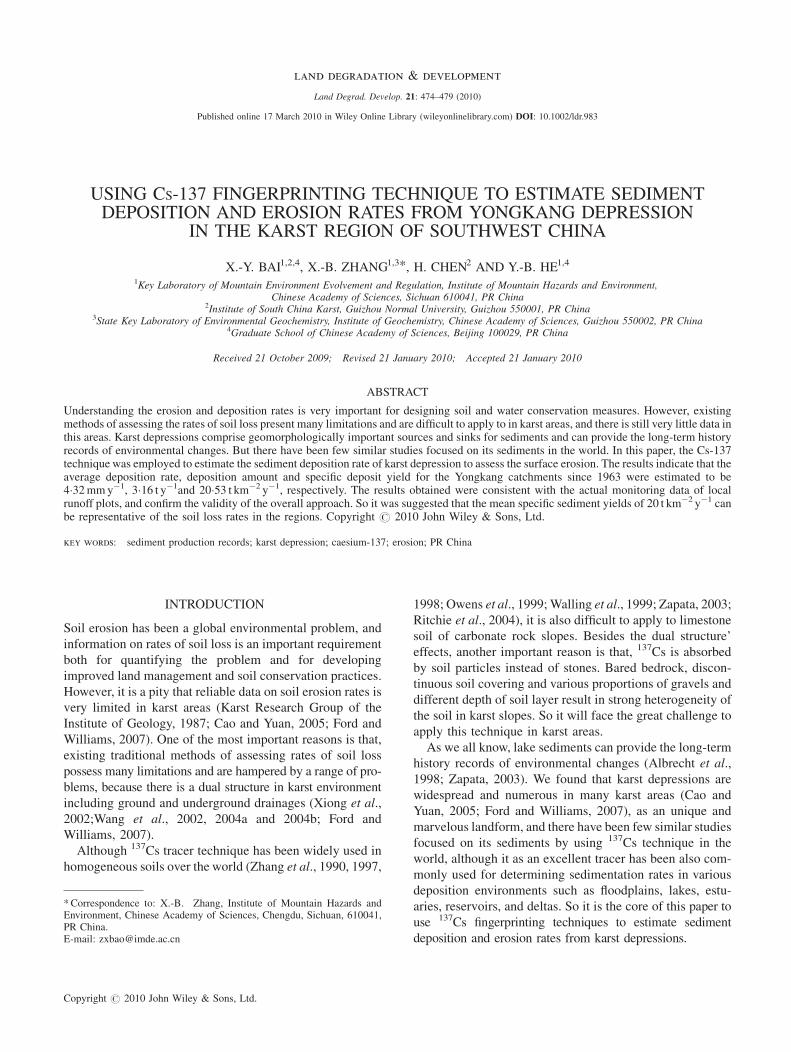
Depth distributions of 137Cs of the three profiles is shown in
Figure 4, and depth distributions of fine particle contents see
Figure 5. Among the three cores collected from the
depression field, 137Cs inventories were respectively
1585�40, 1736�13, and 2888�26Bqm�2, and their mean
was 2069�93Bqm�2. The local 137Cs reference inventory
was 997�70Bqm�2 in the same time. It was indicated that
deposition occurred in the depression because all the137Cs inventories of the three cores were greater than the137Cs reference inventory. In addition, each 137Cs distri-
bution of the three profiles is deeper than local 137Cs
reference depth and the plough layer. All these proved that
the deposition process has happened in the depression.
Calculating the Depth of Deposited Sediment137Cs has been widely used for dating of undisturbed soil
profiles such as lakes and reservoirs deposits (Albrecht et al.,
1998; Owens et al., 1999;Walling et al., 1999; Zapata, 2003;
Ritchie et al., 2004). The expected 137Cs depth profile,
characterized by a single well-defined peak in 137Cs activity
for the year of 1963 (Figure 6a) which the 137Cs maximum
fallout flux occurred and the mean deposition rate since 1963
can be calculated based on the depth of the peak in137Cs activity as following equation:
R ¼ H
n� 1963(1)
where, R is the deposition rate (cm y�1),H is the depth of the
peak in 137Cs activity (cm), and n is the sampling year.
The karst depression bottom land is often cultivated and
the deposited sediments will be mixed into the plough layer
by plough activities. The 137Cs distribution depth at a
deposition site is greater than the depth of the plough layer
and the inventory is usually greater than the local reference
inventory (Figure 6b). Assuming the 137Cs fallout pre-
cipitated totally on the ground in 1963, the sediment
deposition depth was derived from the following equation:
DH ¼ H � Hp (2)
where, DH¼ the sediment deposition depth since 1963
(cm);H¼ the total 137Cs distribution depth in a profile (cm);
Hp¼ the plough layer depth (cm);
LAND DEGRADATION & DEVELOPMENT, 21: 474–479 (2010)
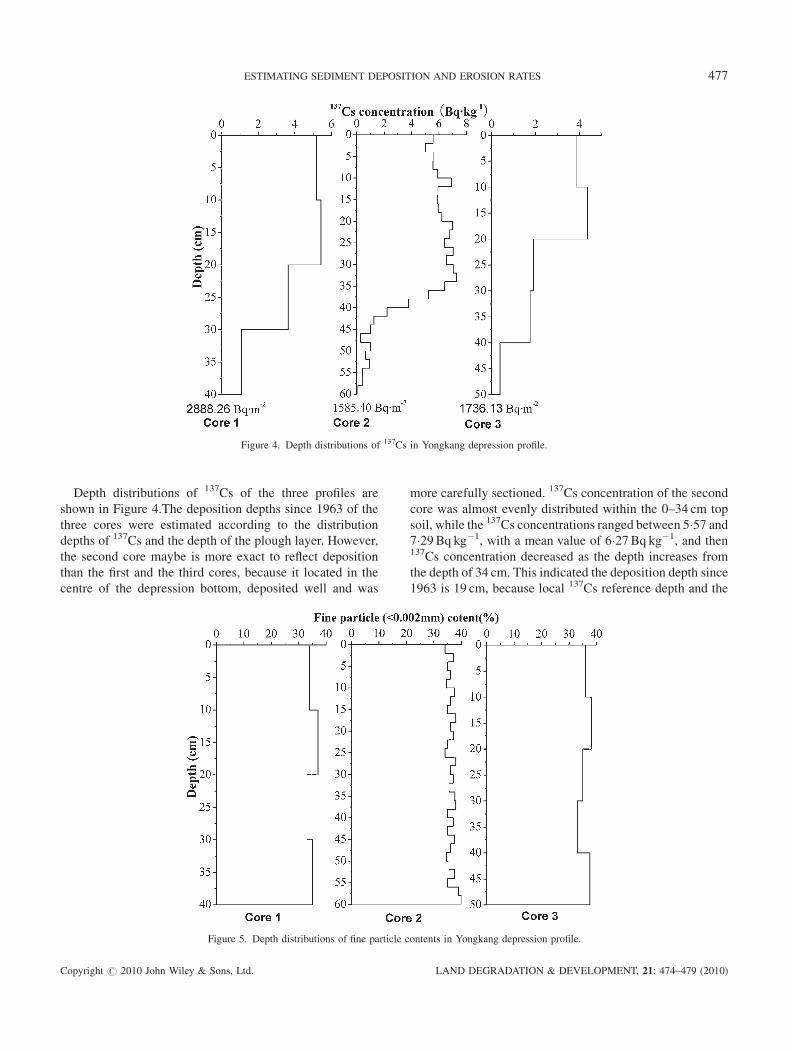
Figure 4. Depth distributions of 137Cs in Yongkang depression profile.
ESTIMATING SEDIMENT DEPOSITION AND EROSION RATES 477
Depth distributions of 137Cs of the three profiles are
shown in Figure 4.The deposition depths since 1963 of the
three cores were estimated according to the distribution
depths of 137Cs and the depth of the plough layer. However,
the second core maybe is more exact to reflect deposition
than the first and the third cores, because it located in the
centre of the depression bottom, deposited well and was
Figure 5. Depth distributions of fine particle c
Copyright # 2010 John Wiley & Sons, Ltd.
more carefully sectioned. 137Cs concentration of the second
core was almost evenly distributed within the 0–34 cm top
soil, while the 137Cs concentrations ranged between 5�57 and7�29Bq kg�1, with a mean value of 6�27Bq kg�1, and then137Cs concentration decreased as the depth increases from
the depth of 34 cm. This indicated the deposition depth since
1963 is 19 cm, because local 137Cs reference depth and the
ontents in Yongkang depression profile.
LAND DEGRADATION & DEVELOPMENT, 21: 474–479 (2010)

Figure 6. Characteristic depth distributions of 137Cs in lakes deposits andcultivated soils. (a) In uncultivated land; (b) in cultivated land.
478 X.-Y. BAI ET AL.
plough layer is 15 cm. So the average deposition rates since
1963 is 4�32mmy�1.
Interpreting Sediment Production Records
Deposition amounts and specific sediment yields were esti-
mated according to the mean deposition depth of the core
since 1963.The area of sediments and the area of the drai-
nage are 610m2 and 0�154 km2, respectively, and depression
sediments had a mean bulk density of 1�2 tm�3. So the
specific deposit yield can be calculated by the following
equation:
R ¼ D � H � SA � ðn� 1963Þ (2)
where R is land surface erosion rate of the catchments
(t km�2 y�1), D is the soil bulk density (t m�3), H is the
sediment deposition depth since 1963 (m), S is the area of the
depression (m2), n is the sampling year (a), A is the area of
catchments (km2).
The mean deposition rate, deposition amount, and specific
deposit yield for the Yongkang catchments since 1963
were estimated to be 4�32mmy�1, 3�16 t y�1, and
20�53 t km�2 y�1, respectively. By the monitoring data of
six runoff plots during the period of July 2007–
February 2008, in the Chenqi Gully, Puding, Guizhou and
specific sediment yields were very low and ranged between
1�0 and 32�4 t km�2 y�1(Peng et al., 2009). The geology and
landscape conditions in the Chenqi Gully are similar to
Yongkang Depression. As above mentioned, it was
suggested that the mean specific sediment yields of
Copyright # 2010 John Wiley & Sons, Ltd.
20 t km�2 y�1 can be representative for the soil loss rates
in the regions.
It is important to note, however, that sinkholes are widely
distributed in karst depressions (Ford andWilliams, 2007; Li
et al., 2008), and a depression usually has at least one
sinkhole. It may be a relative large estimating error due to
excess sediments lost from the sinkhole. However, the
sinkhole of this depression was blocked, and it is flooded
more than twice a year and its waterlogging time is about 7
days. For this frequently flooded depression, where flood
water drains very slowly and most of sediments will deposit
into depressions (Ford and Williams, 2007), except very
little sediments flow out through sinkholes. According to the
study result of detention time (Brune, 1953; Cao and Yuan,
2005), trap efficiency of Yongkang depression is about 78
per cent. But these needs to be further studied and maybe are
the nest research priority what should be done in the future.
CONCLUSIONS
The results presented in this paper indicated that Yongkang
depression of China is a representative and significant sink
of the soils being eroded from the upland slopes, and deposit
rates of sampling sites were estimated by 137Cs technique for
the period from 1963 to 2007. The mean deposition rate,
deposition amount and specific deposit yield for the
Yongkang catchments since 1963 were estimated to be
4�3 2mmy�1, 3�16 t y�1, and 20�53 t km�2 y�1, respectively.
The results obtained were consistent with the actual
monitoring data (Peng et al., 2009) of local runoff plots,
and confirm the validity of the overall approach. So it was
suggested that the mean specific sediment yields of
20 t km�2 y�1 can be representative of the soil loss rates
in the regions. The study reported above appears to offer
valuable potential to understand land surface erosion of
karst landform areas by estimating sediment deposition
rates of karst depressions for using the 137Cs technique,
rather than assessment of complicated soil erosion in stony
soils of carbonate rock slopes. All these conduce to our
understanding of soil loss and sedimentation in karst
environment.
ACKNOWLEDGEMENTS
The authors express their sincere thanks to the three
reviewers for their valuable suggestions and comments that
enabled us to improve the paper substantially. This research
work was jointly supported by the State Key Basic Research
Plan (Grant No. 2006CB403200), the National Key Tech-
nology R&D Programme (Grant No.2006BAC01A09 and
2008BAD98B07), and the National Natural Science
Foundation of China (Grant No. 40721002).
LAND DEGRADATION & DEVELOPMENT, 21: 474–479 (2010)

ESTIMATING SEDIMENT DEPOSITION AND EROSION RATES 479
REFERENCES
Albrecht A, Reise R, Lueck A, Stol JMA, Giger W. 1998. Radiocesiumdating of sediments from lakes and reservoirs of different hydrologicalregimes. Environmental Science and Technology 32: 1882–1887.DOI:10.1007/s11270-008-9961-z
Brune GM. 1953. Trap efficiency of reservoirs. Transactions-AmericanGeophysical Union 34: 407–418.
Cao JH, Yuan DX. 2005. Karst Ecosystem Constrained by GeologicalConditions in Southwest China. Geology Press: Beijing (in Chinese).
Ford DC, Williams P. 2007. Karst Hydrogeology and Geomorphology.Wiley: Chichester.
Karst Research Group of the Institute of Geology, Chinese Academy ofSciences. 1987.Karst Research in China. Science Press: Beijing (in Chinese).
Li YB, Shao JA, Yang H, Bai XY. 2008. The relations between land use andkarst rocky desertification in a typical karst area, China. EnvironmentalGeology 57(3): 621–627. DOI:10.1007/S00254-008-1331-Z
Owens PN,Walling DE, Leeks GJL. 1999. Use of floodplain sediment coresto investigate recent historical changes in overbank sedimentation ratesand sediment sources in the catchment of the River Ouse, Yorkshire, UK.Catena 36: 21–47. DOI: 10.1016/S0341-8162(99)00010-7
Peng T, Yang T, Wang SJ. 2009. Monitoring results of soil loss in karstslopes. Earth and Environment 37: 126–130.
Ritchie JC, Finney VL, Oster KJ, Ritchie CA. 2004. Sediment deposition inthe flood plain of Stemple Creek Watershed, northern California. Geo-morphology 61: 347–360. DOI:10.1016/j.geomorph.2004.01.009
Walling DE, Owens PM, Leeks GJL. 1999. Rates of contemporary overbanksedimentation and sediment storage on the floodplains of the mainchannel systems of the Yorkshire Ouse and River Tweed, UK. Hydro-logical Processes 13: 993–1009. DOI: 10.1002/(SICI)1099-1085(199905)13:7
Copyright # 2010 John Wiley & Sons, Ltd.
Wang SJ, Li RL, Sun CX, Zhang DF, Li FQ, Zhou DQ, Xiong KN, Zhou ZF.2004b. How types of carbonate rock assemblages constrain the distri-bution of karst rocky decertified land in Guizhou Province, PR China:phenomena and mechanisms. Land Degradation & Development 15:123–131. DOI:10.1002/ldr.591
Wang SJ, Liu QM, Zhang DF. 2004a. Karst rock desertification in South-western China: geomorphology, land use, impact and rehabilitation. LandDegradation & Development 15: 115–121. DOI:10.1002/ldr.592
Wang SJ, Zhang DF, Li RL. 2002. Mechanism of rocky desertification in thekarst mountain areas of Guizhou Province, Southwest China. Inter-national Review for Environmental Strategies 3: 123–135.
Xiong KN, Li P, Zhou ZF. 2002. The RS and GIS Representative Study onKarst Rock Desertification: An Example of Guizhou Province. GeologyPress: Beijing (in Chinese).
Zapata F. 2003. The use of environmental radionuclides as tracers in soilerosion and sedimentation investigations: recent advances and futuredevelopments. Soil & Tillage Research 69: 3–13. DOI: 10.1016/S0167-1987(02)00124-1
Zhang X, Higgitt DL, Walling DE. 1990. A preliminary assessment ofpotential for using Caesium-137 to estimate rates of soil erosion in theLoess Plateau of China. Hydrological Sciences 35: 243–252.
Zhang X, Quine TA, Walling DE. 1998. Soil erosion rates on slopingcultivated land on the Loess Plateau near Ansai, Shaanxi Province, China:an investigation using 137Cs and rill measurement. Hydrological Pro-cesses 12: 171–189. DOI:10.1002/(SICI)1099-1085(199801)12:1<171::AID.-HYP570>3.0.CO;2-L
Zhang X, Walling DE, Quine TA, Wen A. 1997. Use of reservoir depositsand Caesium-137measurements to investigate the erosional response of asmall drainage basin in the rolling Loess Plateau region of China. LandDegradation & Development 8: 1–6. DOI:10.1002/(SICI)1099-145X(199703)8:1<1::AID.-LDR240>3.0.CO;2-X
LAND DEGRADATION & DEVELOPMENT, 21: 474–479 (2010)