Embed Size (px)
Citation preview
USHER: Improving Data Quality with Dynamic
Forms
Kuang Chen #1, Harr Chen ∗2, Neil Conway #3, Joseph M. Hellerstein #4, Tapan S. Parikh +5
#Department of Electrical Engineering and Computer Science, University of California, Berkeley
2599 Hearst Ave, Berkeley, CA 94720 [email protected]@cs.berkeley.edu
∗Computer Science and Artificial Intelligence Laboratory, Massachusetts Institute of Technology
32 Vassar St, Cambridge, MA 02139 [email protected]
+School of Information, University of California, Berkeley
102 South Hall, Berkeley, CA 94720 [email protected]
Abstract— Data quality is a critical problem in moderndatabases. Data entry forms present the first and arguably bestopportunity for detecting and mitigating errors, but there hasbeen little research into automatic methods for improving dataquality at entry time. In this paper, we propose USHER, an end-to-end system for form design, entry, and data quality assurance.Using previous form submissions, USHER learns a probabilisticmodel over the questions of the form. USHER then applies thismodel at every step of the data entry process to improve dataquality. Before entry, it induces a form layout that captures themost important data values of a form instance as quickly aspossible. During entry, it dynamically adapts the form to thevalues being entered, and enables real-time feedback to guide thedata enterer toward their intended values. After entry, it re-asksquestions that it deems likely to have been entered incorrectly.We evaluate all three components of USHER using two real-worlddata sets. Our results demonstrate that each component has thepotential to improve data quality considerably, at a reduced costwhen compared to current practice.
I. INTRODUCTION
Organizations and individuals routinely make important
decisions based on inaccurate data stored in supposedly au-
thoritative databases. Data errors in some domains, such as
medicine, may have particularly severe consequences. These
errors can arise at a variety of points in the lifecycle of data,
from data entry, through storage, integration and cleaning to
analysis and decision-making [1]. While each step presents
an opportunity to address data quality, entry-time offers the
earliest opportunity to catch and correct errors. The database
community has focused on data cleaning once data has
been collected into a database, and has paid relatively little
attention to data quality at collection time [1], [2]. Current
best practices for quality during data entry come from the field
of survey methodology, which offers principles that include
manual question orderings and input constraints, and double
entry of paper forms [3]. Although this has long been the
de facto quality assurance standard in data collection and
transformation, we believe this area is ripe for reconsideration.
For both paper forms and direct electronic entry, we posit that a
data-driven and more computationally sophisticated approach
can significantly outperform these decades-old static methods
in both accuracy and efficiency of data entry.
The problem of data quality is magnified in low-resource
data collection settings. Recently, the World Health Organiza-
tion likened the lack of quality health information in develop-
ing regions to a “gathering storm,” saying, “[to] make people
count, we first need to be able to count.” [4]. Indeed, many
health organizations, particularly those operating with limited
resources in developing regions, struggle with collecting high-
quality data. Why is data collection so challenging? First,
many organizations lack expertise in paper and electronic form
design and rely on ad hoc mapping of required data fields
to data entry widgets by intuition [5], [6]. Second, in the
paper form transcription process, double entry is too costly
and takes too long — we witnessed an HIV/AIDS program
running clinical care on paper forms while researchers and
funders receive the output of clean, double-entered digital data
much later. Finally, even organizations in developing regions
are beginning to use mobile devices like smartphones for data
collection, with community health workers doing direct digital
data entry in remote locations. Electronic data entry devices
offer different affordances than those of paper, displacing the
role of traditional form design and double entry [5]. We often
saw that there were no data quality checks at all in these cases;
Patnaik et al. found mobile data entry quality to be ten times
worse than dictation to a human operator [7].
To address this spectrum of data quality challenges, we have
developed USHER, an end-to-end system that can improve
data quality and efficiency at the point of entry by learning
probabilistic models from existing data, which stochastically
relate the questions of a data entry form. These models form
a principled foundation on which we develop information-
theoretic algorithms for form design, dynamic form adaptation
during entry, and question verification after entry:

1) Since form layout is often ad hoc, USHER optimizes
any flexibility for question ordering according to a
probabilistic objective function that aims to maximize
the information content of form answers as early as
possible — we call this the greedy information gain
principle.
2) During entry, the model’s probability estimates are used
to dynamically reorder questions, again to maximize
information gain according to the same principle. This
is appropriate in scenarios where the form is presented
one question at a time, or in small batches.
3) After the submission of a complete form instance, the
model is consulted to predict which responses may be
erroneous, so as to re-ask those questions in order to
verify their correctness — we call this the contextual-
ized error likelihood principle. This focused re-asking
approximates the benefits of double entry at a fraction
of the cost.
In addition, USHER’s approach provides a framework for
reasoning about and organizing feedback mechanisms for
the data-entry user interface. During data entry, USHER can
predict the likelihood of unanswered fields given entered
answers. Using these probabilities, and following the intuition
that multivariate outliers are values warranting reexamination
by the data entry worker, USHER can guide the user with much
more specific and context-aware feedback. In Section VIII, we
offer initial thoughts on design patterns for USHER-inspired
data entry interfaces.
The contributions of this paper are fourfold:
1) We describe our designs for two probabilistic models for
an arbitrary data entry form that model both question
ordering and error likelihood.
2) We describe how USHER uses these models to provide
three forms of guidance: static form design, dynamic
question ordering, and re-asking.
3) We present experiments showing that USHER has the po-
tential to improve data quality at reduced cost. We study
two representative data sets: direct electronic entry of
survey results about political opinion, and transcription
of paper-based patient intake forms from an HIV/AIDS
clinic in Tanzania.
4) Extending our ideas on form dynamics, we propose new
user interface principles for designing contextualized,
intuitive feedback about the likelihood of data as it is en-
tered. This provides a foundation for incorporating data
cleaning visualizations directly into the entry process.
II. RELATED WORK
Our work builds upon several areas of related work. We
provide an overview in this section.
A. Data Cleaning
In the database literature, data quality has typically been
addressed under the rubric of data cleaning [1], [2]. Our work
connects most directly to data cleaning via multivariate outlier
detection; it is based in part on interface ideas first proposed by
Hellerstein [8]. By the time such retrospective data cleaning
is done, the physical source of the data is typically unavailable
— thus, errors often become too difficult or time-consuming to
be rectified. USHER addresses this issue by applying statistical
data quality insights at the time of data entry. Thus, it can catch
errors when they are made, and when ground-truth values may
still be available for verification.
B. User Interfaces
Past research on improving data entry is mostly focused on
adapting the data entry interface for user efficiency improve-
ments. Several such projects have used learning techniques
to automatically fill or predict a top-k set of likely values
[9], [10], [11], [12], [13], [14], [15]. For example, Ali and
Meeks [9] predicted values for combo-boxes in web forms and
measured improvements in the speed of entry; Ecopod [15]
generated type-ahead suggestions that were improved by geo-
graphic information; Hermens et al. [10] automatically filled
leave-of-absence forms using decision trees and measured
predictive accuracy and time savings. In these approaches,
learning techniques are used to predict form values based on
past data, and each measures the time savings of particular
data entry mechanisms and/or the proportion of values their
model was able to correctly predict. USHER’s focus is on
improving data quality, and its probabilistic formalism is based
on learning relationships within the underlying data that guide
the user towards more correct entries. In addition to predicting
question values, we develop and exploit probabilistic models
of user error, and target a broader set of interface adaptations
for improving data quality, including question reordering and
re-asking, and widget customizations that provide feedback to
the user based on the likelihood of their entries. Some of the
enhancements we make for data quality could also be applied
to improve the speed of entry.
C. Clinical Trials
Data quality assurance is a prominent topic in the science
of clinical trials, where the practice of double entry has been
questioned and dissected, but nonetheless remains the gold
standard [16], [17]. In particular, Kleinman takes a probabilis-
tic approach toward choosing which forms to re-enter based
on the individual performance of data entry staff [18]. This
cross-form validation has the same goal as our approach of
reducing the need for complete double entry, but does so
at a much coarser level of granularity. It requires historical
performance records for each data entry worker, and does not
offer dynamic reconfirmation of individual questions. In con-
trast, USHER’s cross-question validation adapts to the actual
data being entered in light of previous form submissions, and
allows for a principled assessment of the tradeoff between cost
(of reconfirming more questions) versus quality (as predicted
by the probabilistic model).
D. Survey Design
The survey design literature includes extensive work on
proper form design for high data quality [3], [19]. This
literature advocates the use of manually specified constraints
on response values. These constraints may be univariate (e.g.,
a maximum value for an age question) or multivariate (e.g.,
disallowing gender to be male and pregnant to be yes). Some
constraints may also be “soft,” and only serve as warnings
regarding unlikely combinations (e.g., age being 60 and preg-
nant being yes).
The manual specification of such constraints requires a
domain expert, which can be prohibitive in many scenarios.
By relying on prior data, USHER learns to automatically infer
many of these same constraints without requiring their explicit
specification. When these constraints are violated during entry,
USHER can then flag the relevant questions, or target them for
re-asking.
However, USHER does not preclude the manual specifica-
tion of constraints. This is critical, because previous research
into the psychological phenomena of survey filling has yielded
common constraints not inherently learnable from prior data
[3]. This work provides heuristics such as “groups of topi-
cally related questions should often be placed together,” and
“questions about race should appear at the end of a survey.”
USHER complements these human-specified constraints, ac-
commodating them while leveraging any remaining flexibility
to optimize question ordering in a data-driven manner.
III. SYSTEM
A. A Data-driven Approach
USHER builds a probabilistic model for an arbitrary data
entry form in two steps: first, by learning the relationships
between form questions via structure learning; and second, by
estimating the parameters of a Bayesian network, which then
allows us to generate predictions and error probabilities for
the form.
After the model is built, USHER uses it to automatically or-
der a form’s questions for greedy information gain. Section V
describes both static and dynamic algorithms, which employ
criteria based on the magnitude of statistical information gain
that is expected in answering a question, given the answers that
have been provided so far. This is a key idea in our approach.
By front-loading predictive potential, we increase the models’
capacity in several ways. First, from an information theoretic
perspective, we improve our ability to do multivariate pre-
diction and outlier detection for subsequent questions. As we
discuss in more detail in Section VIII, the predictive ability can
be applied by parameterizing data entry widgets (type-ahead
suggestions, default values), assessing answers (outlier flags),
and performing in-flight cross-validation (survey design par-
lance for re-asking of questions). Second, from a psychological
perspective, front-loading information gain also addresses the
human issues of user fatigue and limited attention span, which
can result in increasing error rates over time, and unanswered
questions at the end of the form.
Our approach is driven by the same intuition underlying the
practice of curbstoning, which was related to us in discussion
with survey design experts [6]. Curbstoning is a way in which
an unscrupulous door-to-door surveyor shirks work: he or she
MaritalStatus
ReferredFrom
PriorExposure
DateConfirmedHIVPositive
DateFirstPositiveHIVTest
Sex DateOfBirth
DistrictCode
RegionCode
Fig. 1. Bayesian network for the patient dataset, showing probabilisticrelationships between form questions.
asks an interviewee only a few important questions, and then
uses those responses to complete the remainder of a form
while sitting on the curb outside the home. The constructive
insight here is that a well-chosen subset of questions can
often enable an experienced agent to intuitively predict the
remaining answers. USHER’s question ordering algorithms
formalize this intuition via the principle of greedy information
gain, and use them (scrupulously) to improve data entry.
USHER’s learning algorithm relies on training data. In prac-
tice, a data entry backlog can serve as this training set. In the
absence of sufficient training data, USHER can bootstrap itself
on a “uniform prior,” generating a form based on the assump-
tion that all inputs are equally likely. Subsequently, a training
set can gradually be constructed by iteratively capturing data
from designers and potential users in “learning runs.” It is a
common approach to first fit to the available data, and then
evolve a model as new data becomes available. This process
of semi-automated form design can help institutionalize new
forms before they are deployed in production.
USHER adapts to a form and dataset by crafting a custom
model. Of course, as in many learning systems, the model
learned may not translate across contexts. We do not claim
that each learned model would or should fully generalize to
different environments. Instead, each context-specific model
is used to ensure data quality for a particular situation,
where we expect relatively consistent patterns in input data
characteristics. In the remainder of this section, we illustrate
USHER’s functionality with examples. Further details, partic-
ularly regarding the probabilistic model, follow in the ensuing
sections.
B. Examples
We offer two running examples. First, the patient dataset
comes from paper patient-registration forms, transcribed by
data entry workers, from a HIV/AIDS program in Tanzania.1
Second, the survey dataset comes from a phone survey of
political opinion in the San Francisco Bay Area, entered by
survey professionals directly into an electronic form.
In each example, a form designer begins by creating a sim-
ple specification of form questions and their prompts, response
data types, and constraints. The training data set is made up of
prior form responses. By running the learning algorithms we
1We have pruned out questions with identifying information about patients,as well as free-text comment fields.
Spend Military
Spend Urban
Spend Welfare
Political Party
Political Ideology
Education
Income Employed
Age Marital Gender
Race
Spend Crime
Equal Opp
Case ID
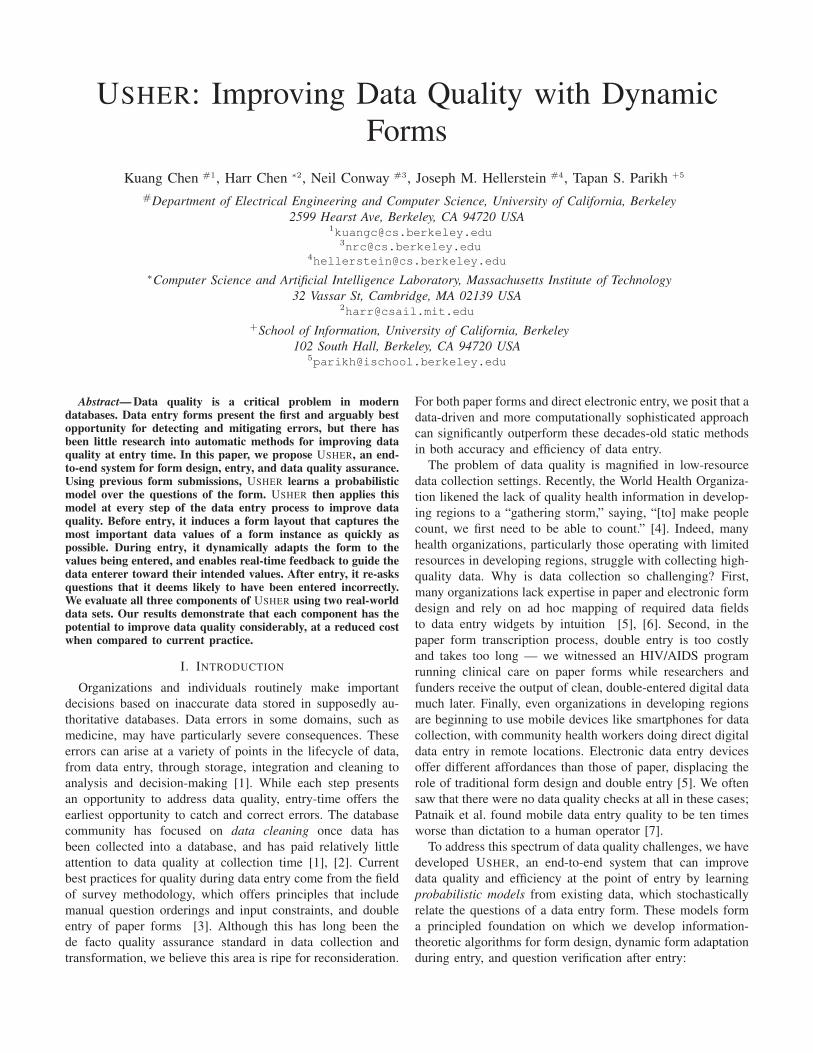
Fig. 2. Bayesian network for the survey dataset. The probabilistic relation-ships are more dense. Some relationships are intuitive (Political Ideology -Political Party), others show patterns incidental to the dataset (race - gender).
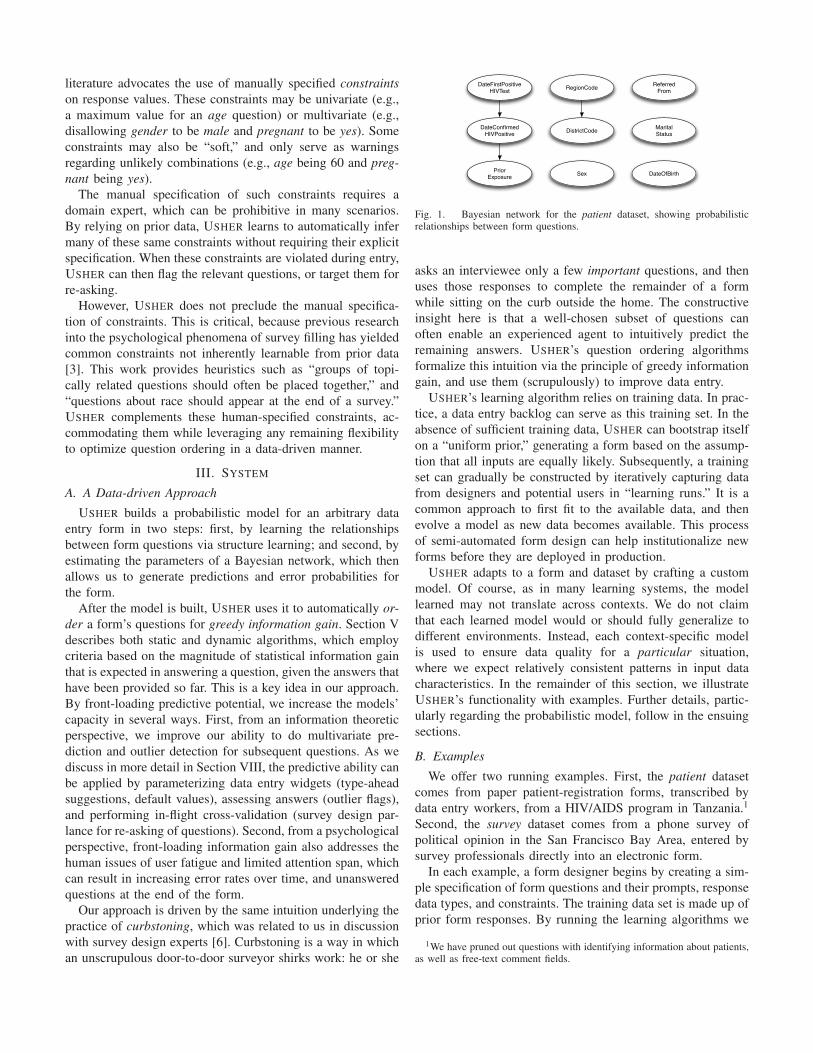
Fig. 3. Example question layout generated by our ordering algorithm. Thearrows reflect the probabilistic dependencies from Figure 1.
present in Section IV, USHER builds a Bayesian network of
probabilistic relationships from the data, as shown in Figures
1 and 2. In this graph, an edge captures a close stochastic
dependency between two random variables (i.e., form ques-
tions). Two questions with no path between them in the graph
are probabilistically independent. Figure 2 illustrates a denser
graph, demonstrating that political survey responses tend to be
highly correlated. Note that a standard joint distribution would
show correlations among all pairs of questions; the sparsity
of these examples reflects conditional independence patterns
learned from the data. Graphically encoding independence is
a now-standard method in machine learning that clarifies the
underlying structure, mitigates data over-fitting, and improves
the efficiency of probabilistic inference.
The learned structure is subject to manual control: a de-
signer can override any learned correlations that are believed to
be spurious, or that make the form more difficult to administer.
For the patient dataset, USHER generated the static or-
dering shown in Figure 3. We can see in Figure 3 that the
structure learner predicted RegionCode to be correlated with
DistrictCode. It happens that our data set comes mostly from
clinics in a single region of Tanzania, so RegionCode has low
information entropy. It is not surprising then, that USHER’s
suggested ordering has DistrictCode early and RegionCode
last — once we observe DistrictCode, RegionCode has very
little additional expected conditional information gain. When it
is time to input the RegionCode, if the user selects an incorrect
value, the model can be more certain that it is unlikely. If the
user stops early and does not fill in RegionCode, the model can
infer the likely value with higher confidence. In general, static
question orderings are appropriate as an offline process for
paper forms where there is latitude for (re-)ordering questions,
within designer-specified constraints.
During data entry, USHER uses the probabilistic machinery
to drive dynamic updates to the form structure. One type of
update is the dynamic selection of the best next question to ask
among questions yet to be answered. This can be appropriate
in several situations, including surveys that do not expect users
to finish all questions, or direct-entry interfaces (e.g. mobile
phones) where one question is asked at a time. We note that
it is still important to respect the form designer’s a priori
specified question-grouping and -ordering constraints when a
form is dynamically updated.
USHER is also used during data entry to provide dynamic
feedback, by calculating the conditional distribution for the
question in focus, and using it to assess the likelihood of
the user’s entry. Continuing the example above, we could,
before entry, use a “split” drop-down menu for RegionCode
that features the most likely answers “above the line,” and after
entry, color the chosen answer red if it is a conditional outlier.
We discuss in Section VIII the design space and potential
impact of data entry feedback that is more specific and context
aware.
At the end of a data entry run, USHER calculates error
probabilities for the whole form and for each question. These
probabilities are dependent on all available values for a single
form instance provided by the data entry worker. For each
form question, USHER predicts how likely that the response
provided is erroneous, by examining whether it is likely to
be a multivariate outlier, i.e., that it is unlikely with respect
to the responses for other fields, If there are responses with
error probabilities exceeding some threshold, USHER re-asks
those questions, ordered by the highest error probability, as
described in Section VI.
C. Implementation
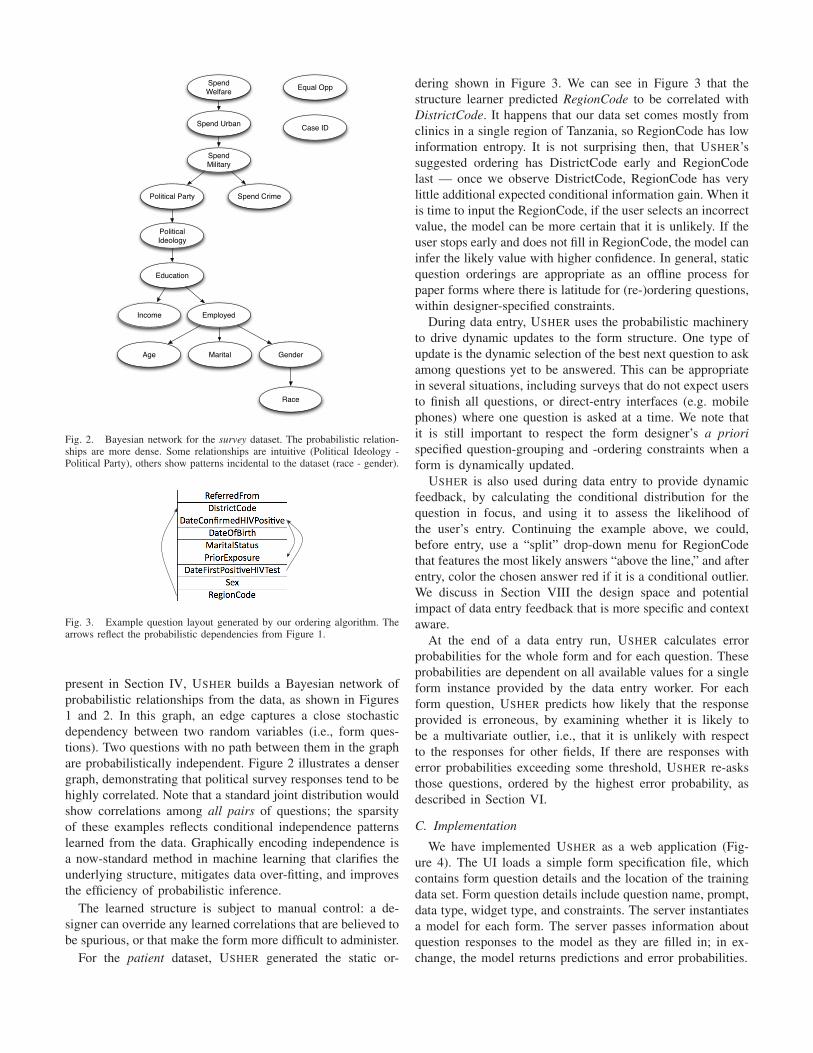
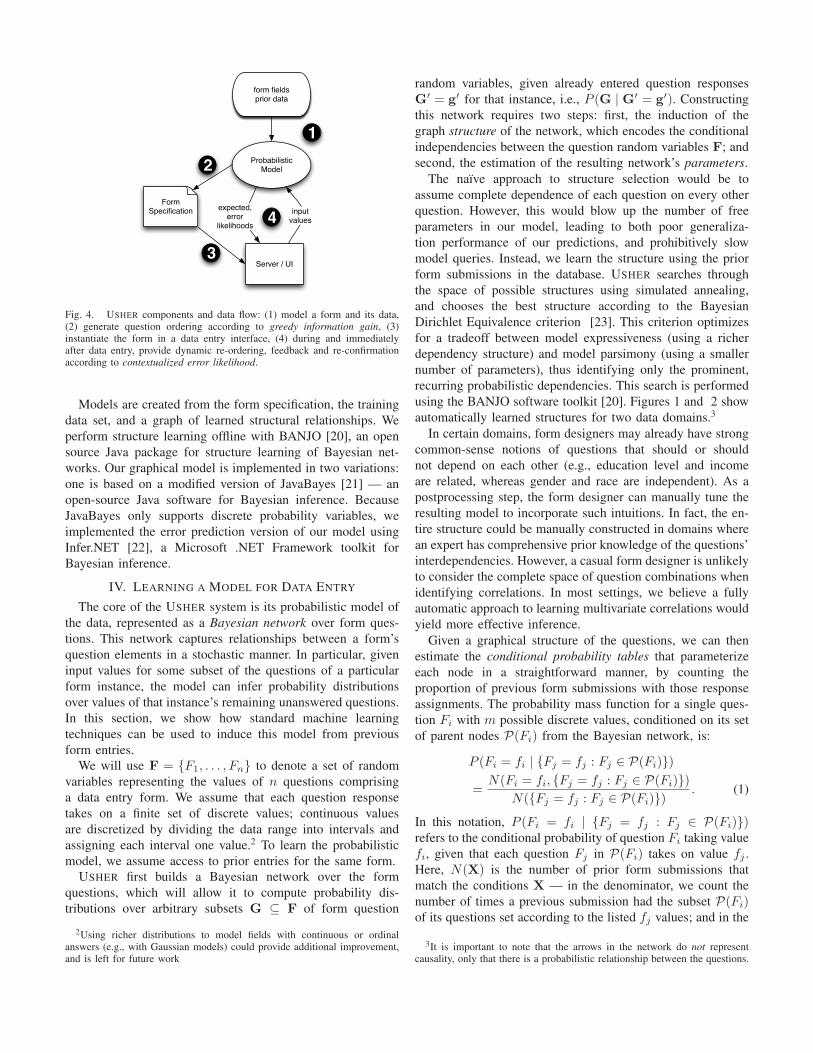
We have implemented USHER as a web application (Fig-
ure 4). The UI loads a simple form specification file, which
contains form question details and the location of the training
data set. Form question details include question name, prompt,
data type, widget type, and constraints. The server instantiates
a model for each form. The server passes information about
question responses to the model as they are filled in; in ex-
change, the model returns predictions and error probabilities.
FormSpecification
ProbabilisticModel
Server / UI
form fieldsprior data
expected, error
likelihoods
input values4
3
2
1
Fig. 4. USHER components and data flow: (1) model a form and its data,(2) generate question ordering according to greedy information gain, (3)instantiate the form in a data entry interface, (4) during and immediatelyafter data entry, provide dynamic re-ordering, feedback and re-confirmationaccording to contextualized error likelihood.
Models are created from the form specification, the training
data set, and a graph of learned structural relationships. We
perform structure learning offline with BANJO [20], an open
source Java package for structure learning of Bayesian net-
works. Our graphical model is implemented in two variations:
one is based on a modified version of JavaBayes [21] — an
open-source Java software for Bayesian inference. Because
JavaBayes only supports discrete probability variables, we
implemented the error prediction version of our model using
Infer.NET [22], a Microsoft .NET Framework toolkit for
Bayesian inference.
IV. LEARNING A MODEL FOR DATA ENTRY
The core of the USHER system is its probabilistic model of
the data, represented as a Bayesian network over form ques-
tions. This network captures relationships between a form’s
question elements in a stochastic manner. In particular, given
input values for some subset of the questions of a particular
form instance, the model can infer probability distributions
over values of that instance’s remaining unanswered questions.
In this section, we show how standard machine learning
techniques can be used to induce this model from previous
form entries.
We will use F = {F1, . . . , Fn} to denote a set of random
variables representing the values of n questions comprising
a data entry form. We assume that each question response
takes on a finite set of discrete values; continuous values
are discretized by dividing the data range into intervals and
assigning each interval one value.2 To learn the probabilistic
model, we assume access to prior entries for the same form.
USHER first builds a Bayesian network over the form
questions, which will allow it to compute probability dis-
tributions over arbitrary subsets G ⊆ F of form question
2Using richer distributions to model fields with continuous or ordinalanswers (e.g., with Gaussian models) could provide additional improvement,and is left for future work
random variables, given already entered question responses
G′ = g′ for that instance, i.e., P (G | G′ = g′). Constructing
this network requires two steps: first, the induction of the
graph structure of the network, which encodes the conditional
independencies between the question random variables F; and
second, the estimation of the resulting network’s parameters.
The naı̈ve approach to structure selection would be to
assume complete dependence of each question on every other
question. However, this would blow up the number of free
parameters in our model, leading to both poor generaliza-
tion performance of our predictions, and prohibitively slow
model queries. Instead, we learn the structure using the prior
form submissions in the database. USHER searches through
the space of possible structures using simulated annealing,
and chooses the best structure according to the Bayesian
Dirichlet Equivalence criterion [23]. This criterion optimizes
for a tradeoff between model expressiveness (using a richer
dependency structure) and model parsimony (using a smaller
number of parameters), thus identifying only the prominent,
recurring probabilistic dependencies. This search is performed
using the BANJO software toolkit [20]. Figures 1 and 2 show
automatically learned structures for two data domains.3
In certain domains, form designers may already have strong
common-sense notions of questions that should or should
not depend on each other (e.g., education level and income
are related, whereas gender and race are independent). As a
postprocessing step, the form designer can manually tune the
resulting model to incorporate such intuitions. In fact, the en-
tire structure could be manually constructed in domains where
an expert has comprehensive prior knowledge of the questions’
interdependencies. However, a casual form designer is unlikely
to consider the complete space of question combinations when
identifying correlations. In most settings, we believe a fully
automatic approach to learning multivariate correlations would
yield more effective inference.
Given a graphical structure of the questions, we can then
estimate the conditional probability tables that parameterize
each node in a straightforward manner, by counting the
proportion of previous form submissions with those response
assignments. The probability mass function for a single ques-
tion Fi with m possible discrete values, conditioned on its set
of parent nodes P(Fi) from the Bayesian network, is:
P (Fi = fi | {Fj = fj : Fj ∈ P(Fi)})
=N(Fi = fi, {Fj = fj : Fj ∈ P(Fi)})
N({Fj = fj : Fj ∈ P(Fi)}). (1)
In this notation, P (Fi = fi | {Fj = fj : Fj ∈ P(Fi)})refers to the conditional probability of question Fi taking value
fi, given that each question Fj in P(Fi) takes on value fj .
Here, N(X) is the number of prior form submissions that
match the conditions X — in the denominator, we count the
number of times a previous submission had the subset P(Fi)of its questions set according to the listed fj values; and in the
3It is important to note that the arrows in the network do not representcausality, only that there is a probabilistic relationship between the questions.
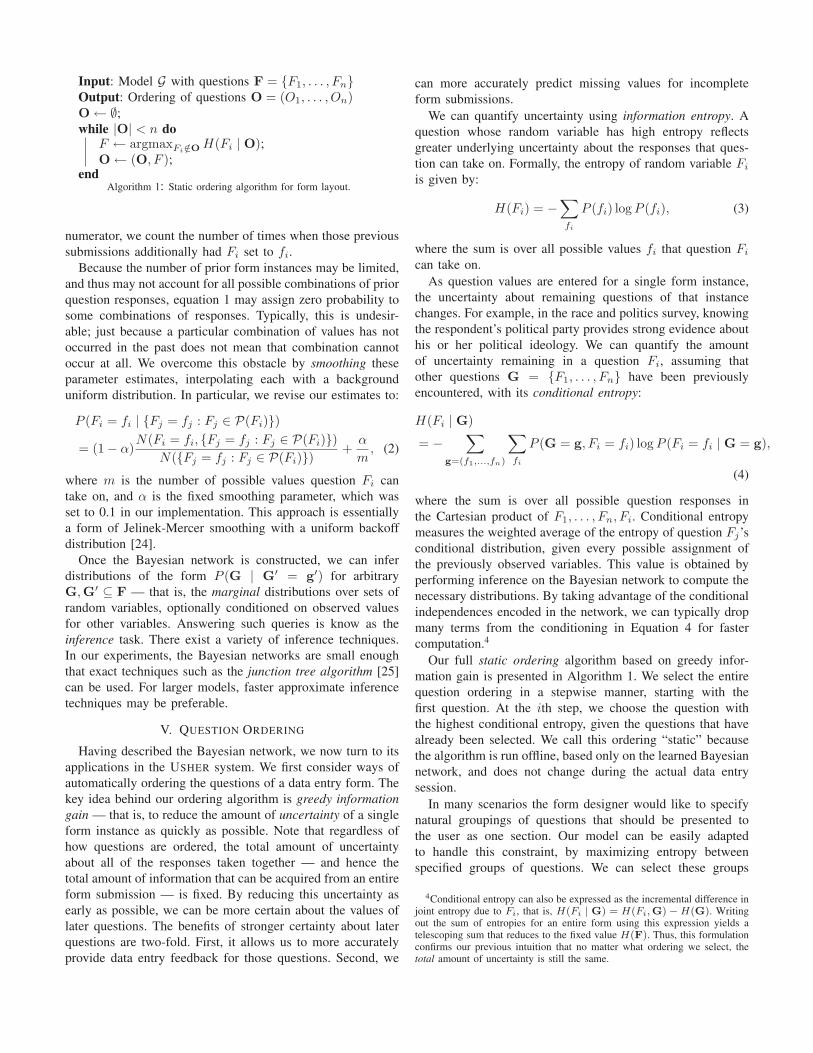
Input: Model G with questions F = {F1, . . . , Fn}Output: Ordering of questions O = (O1, . . . , On)O← ∅;while |O| < n do
F ← argmaxFi /∈O H(Fi | O);O← (O, F );
endAlgorithm 1: Static ordering algorithm for form layout.
numerator, we count the number of times when those previous
submissions additionally had Fi set to fi.
Because the number of prior form instances may be limited,
and thus may not account for all possible combinations of prior
question responses, equation 1 may assign zero probability to
some combinations of responses. Typically, this is undesir-
able; just because a particular combination of values has not
occurred in the past does not mean that combination cannot
occur at all. We overcome this obstacle by smoothing these
parameter estimates, interpolating each with a background
uniform distribution. In particular, we revise our estimates to:
P (Fi = fi | {Fj = fj : Fj ∈ P(Fi)})
= (1− α)N(Fi = fi, {Fj = fj : Fj ∈ P(Fi)})
N({Fj = fj : Fj ∈ P(Fi)})+
α
m, (2)
where m is the number of possible values question Fi can
take on, and α is the fixed smoothing parameter, which was
set to 0.1 in our implementation. This approach is essentially
a form of Jelinek-Mercer smoothing with a uniform backoff
distribution [24].
Once the Bayesian network is constructed, we can infer
distributions of the form P (G | G′ = g′) for arbitrary
G,G′ ⊆ F — that is, the marginal distributions over sets of
random variables, optionally conditioned on observed values
for other variables. Answering such queries is know as the
inference task. There exist a variety of inference techniques.
In our experiments, the Bayesian networks are small enough
that exact techniques such as the junction tree algorithm [25]
can be used. For larger models, faster approximate inference
techniques may be preferable.
V. QUESTION ORDERING
Having described the Bayesian network, we now turn to its
applications in the USHER system. We first consider ways of
automatically ordering the questions of a data entry form. The
key idea behind our ordering algorithm is greedy information
gain — that is, to reduce the amount of uncertainty of a single
form instance as quickly as possible. Note that regardless of
how questions are ordered, the total amount of uncertainty
about all of the responses taken together — and hence the
total amount of information that can be acquired from an entire
form submission — is fixed. By reducing this uncertainty as
early as possible, we can be more certain about the values of
later questions. The benefits of stronger certainty about later
questions are two-fold. First, it allows us to more accurately
provide data entry feedback for those questions. Second, we
can more accurately predict missing values for incomplete
form submissions.
We can quantify uncertainty using information entropy. A
question whose random variable has high entropy reflects
greater underlying uncertainty about the responses that ques-
tion can take on. Formally, the entropy of random variable Fi
is given by:
H(Fi) = −∑
fi
P (fi) log P (fi), (3)
where the sum is over all possible values fi that question Fi
can take on.
As question values are entered for a single form instance,
the uncertainty about remaining questions of that instance
changes. For example, in the race and politics survey, knowing
the respondent’s political party provides strong evidence about
his or her political ideology. We can quantify the amount
of uncertainty remaining in a question Fi, assuming that
other questions G = {F1, . . . , Fn} have been previously
encountered, with its conditional entropy:
H(Fi | G)
= −∑
g=(f1,...,fn)
∑
fi
P (G = g, Fi = fi) log P (Fi = fi | G = g),
(4)
where the sum is over all possible question responses in
the Cartesian product of F1, . . . , Fn, Fi. Conditional entropy
measures the weighted average of the entropy of question Fj’s
conditional distribution, given every possible assignment of
the previously observed variables. This value is obtained by
performing inference on the Bayesian network to compute the
necessary distributions. By taking advantage of the conditional
independences encoded in the network, we can typically drop
many terms from the conditioning in Equation 4 for faster
computation.4
Our full static ordering algorithm based on greedy infor-
mation gain is presented in Algorithm 1. We select the entire
question ordering in a stepwise manner, starting with the
first question. At the ith step, we choose the question with
the highest conditional entropy, given the questions that have
already been selected. We call this ordering “static” because
the algorithm is run offline, based only on the learned Bayesian
network, and does not change during the actual data entry
session.
In many scenarios the form designer would like to specify
natural groupings of questions that should be presented to
the user as one section. Our model can be easily adapted
to handle this constraint, by maximizing entropy between
specified groups of questions. We can select these groups
4Conditional entropy can also be expressed as the incremental difference injoint entropy due to Fi, that is, H(Fi | G) = H(Fi,G) − H(G). Writingout the sum of entropies for an entire form using this expression yields atelescoping sum that reduces to the fixed value H(F). Thus, this formulationconfirms our previous intuition that no matter what ordering we select, thetotal amount of uncertainty is still the same.

according to joint entropy:
arg maxG
H(G | F1, . . . , Fi−1), (5)
where G is over the form designers’ specified groups of ques-
tions. We can then further apply the static ordering algorithm
to order questions within each individual section. In this way,
we capture the highest possible amount of uncertainty while
still conforming to ordering constraints imposed by the form
designer.
Form designers may also want to specify other forms of
constraints on form layout, such as a partial ordering over
the questions that must be respected. The greedy approach
can accommodate such constraints by restricting the choice of
fields at every step to match the partial order.
A. Reordering Questions during Data Entry
In electronic form settings, we can take our ordering notion
a step further, and dynamically reorder questions in a form
as they are entered. This approach can be appropriate for
scenarios when data entry workers input one value at a time,
such as on small mobile devices. We can apply the same
greedy information gain criterion as in Algorithm 1, but update
the calculations with the previous responses in the same form
instance. Assuming questions G = {F1, . . . , Fi} have already
been filled in with values g = {f1, . . . , fn}, the next question
is selected by maximizing:
H(Fi | G = g)
= −∑
fi
P (Fi = fi | G = g) log P (Fi = fi | G = g). (6)
Notice that this objective is the same as Equation 4, except
using the actual responses entered into previous questions,
rather than taking a weighted average over all possible values.
Constraints specified by the form designer, such as topical
grouping, can also be respected in the dynamic framework by
restricting the selection of next questions at every step.
In general, dynamic reordering can be particularly useful in
scenarios where the input of one value determines the value
of another. For example, in a form with questions for gender
and pregnant, a response of male for the former dictates the
value and potential information gain of the latter. However,
dynamic reordering may be confusing to data entry workers
who routinely enter information into the same form, and have
come to expect a specific question order. Determining the
tradeoff between these opposing concerns is a human factors
issue that depends on both the application domain and the user
interface employed.
VI. QUESTION RE-ASKING
After a form instance is entered, the probabilistic model is
again applied for the purpose of identifying errors made during
entry. Because this determination is made immediately after
form submission, USHER can choose to re-ask questions for
which there may be an error. By focusing the re-asking effort
only on questions that were likely to be mis-entered, USHER is
likely to catch mistakes at a small incremental cost to the data
N
θi
α,β Fi
Diλ R
i
Fi
Fj
Z
z ∈ Z
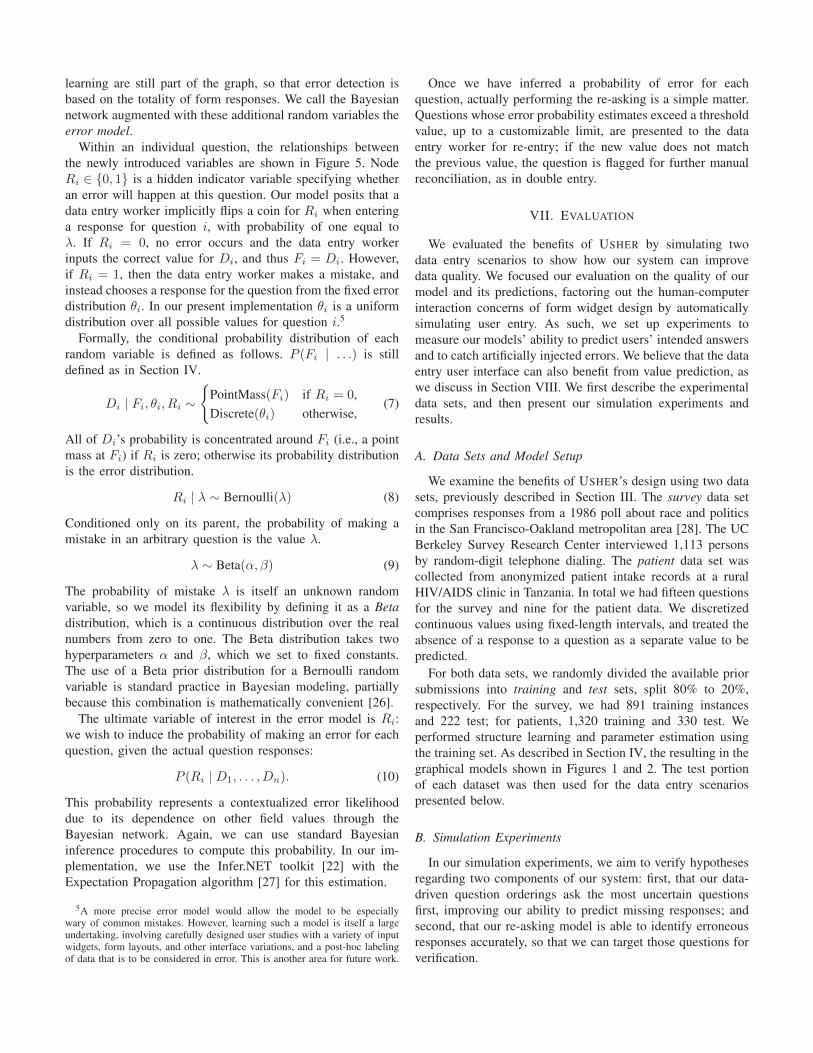
Fig. 5. A graphical model with explicit error modeling. Here, Di representsthe actual input provided by the data entry worker for the ith question, andFi is the true value of that question that we wish to predict. The rectangularplate around the center variables denotes that those variables are repeatedfor each of the N form questions. The F variables are connected by edgesz ∈ Z, representing the relationships discovered in the structure learningprocess; this is the same structure used for the question ordering component.Variable θi represents the “error” distribution, which in our current modelis uniform over all possible values. Variable Ri is a hidden binary indicatorvariable specifying whether the entered data was erroneous; its probability λi
is drawn from a Beta prior with fixed hyperparameters α and β.
entry worker. Our approach is a data-driven alternative to the
expensive practice of double entry, where every question is re-
asked — we focus re-asking effort only on question responses
that are unlikely with respect to the other form responses.
USHER estimates contextualized error likelihood for each
question response, i.e., a probability of error that is dependent
on every other field response. The intuition behind error
detection is straightforward: questions whose responses are
“unexpected,” with respect to the rest of the input responses
are more likely to be incorrect.
To formally incorporate this notion, we extend our Bayesian
network from Section IV using a more sophisticated model
that ties together intended and actual question responses.
Specifically, each question is augmented with additional nodes
capturing a probabilistic view of entry error. Under this
new representation, the ith question is represented with the
following set of random variables:
• Fi: the correct value for the question, which is unknown
to the system, and thus a hidden variable.
• Di: the question response provided by the data entry
worker, an observed variable.
• θi: the probability distribution of values that are entered
as mistakes, which is a single fixed distribution per
question. We call θi the error distribution.
• Ri: a binary variable specifying whether an error was
made in this question.
Additionally, we introduce a random variable λ shared across
all questions, specifying how likely errors are to occur for
a typical question of that form submission. Note that the
relationships between field values discovered during structure
learning are still part of the graph, so that error detection is
based on the totality of form responses. We call the Bayesian
network augmented with these additional random variables the
error model.
Within an individual question, the relationships between
the newly introduced variables are shown in Figure 5. Node
Ri ∈ {0, 1} is a hidden indicator variable specifying whether
an error will happen at this question. Our model posits that a
data entry worker implicitly flips a coin for Ri when entering
a response for question i, with probability of one equal to
λ. If Ri = 0, no error occurs and the data entry worker
inputs the correct value for Di, and thus Fi = Di. However,
if Ri = 1, then the data entry worker makes a mistake, and
instead chooses a response for the question from the fixed error
distribution θi. In our present implementation θi is a uniform
distribution over all possible values for question i.5
Formally, the conditional probability distribution of each
random variable is defined as follows. P (Fi | . . .) is still
defined as in Section IV.
Di | Fi, θi, Ri ∼
{
PointMass(Fi) if Ri = 0,
Discrete(θi) otherwise,(7)
All of Di’s probability is concentrated around Fi (i.e., a point
mass at Fi) if Ri is zero; otherwise its probability distribution
is the error distribution.
Ri | λ ∼ Bernoulli(λ) (8)
Conditioned only on its parent, the probability of making a
mistake in an arbitrary question is the value λ.
λ ∼ Beta(α, β) (9)
The probability of mistake λ is itself an unknown random
variable, so we model its flexibility by defining it as a Beta
distribution, which is a continuous distribution over the real
numbers from zero to one. The Beta distribution takes two
hyperparameters α and β, which we set to fixed constants.
The use of a Beta prior distribution for a Bernoulli random
variable is standard practice in Bayesian modeling, partially
because this combination is mathematically convenient [26].
The ultimate variable of interest in the error model is Ri:
we wish to induce the probability of making an error for each
question, given the actual question responses:
P (Ri | D1, . . . ,Dn). (10)
This probability represents a contextualized error likelihood
due to its dependence on other field values through the
Bayesian network. Again, we can use standard Bayesian
inference procedures to compute this probability. In our im-
plementation, we use the Infer.NET toolkit [22] with the
Expectation Propagation algorithm [27] for this estimation.
5A more precise error model would allow the model to be especiallywary of common mistakes. However, learning such a model is itself a largeundertaking, involving carefully designed user studies with a variety of inputwidgets, form layouts, and other interface variations, and a post-hoc labelingof data that is to be considered in error. This is another area for future work.
Once we have inferred a probability of error for each
question, actually performing the re-asking is a simple matter.
Questions whose error probability estimates exceed a threshold
value, up to a customizable limit, are presented to the data
entry worker for re-entry; if the new value does not match
the previous value, the question is flagged for further manual
reconciliation, as in double entry.
VII. EVALUATION
We evaluated the benefits of USHER by simulating two
data entry scenarios to show how our system can improve
data quality. We focused our evaluation on the quality of our
model and its predictions, factoring out the human-computer
interaction concerns of form widget design by automatically
simulating user entry. As such, we set up experiments to
measure our models’ ability to predict users’ intended answers
and to catch artificially injected errors. We believe that the data
entry user interface can also benefit from value prediction, as
we discuss in Section VIII. We first describe the experimental
data sets, and then present our simulation experiments and
results.
A. Data Sets and Model Setup
We examine the benefits of USHER’s design using two data
sets, previously described in Section III. The survey data set
comprises responses from a 1986 poll about race and politics
in the San Francisco-Oakland metropolitan area [28]. The UC
Berkeley Survey Research Center interviewed 1,113 persons
by random-digit telephone dialing. The patient data set was
collected from anonymized patient intake records at a rural
HIV/AIDS clinic in Tanzania. In total we had fifteen questions
for the survey and nine for the patient data. We discretized
continuous values using fixed-length intervals, and treated the
absence of a response to a question as a separate value to be
predicted.
For both data sets, we randomly divided the available prior
submissions into training and test sets, split 80% to 20%,
respectively. For the survey, we had 891 training instances
and 222 test; for patients, 1,320 training and 330 test. We
performed structure learning and parameter estimation using
the training set. As described in Section IV, the resulting in the
graphical models shown in Figures 1 and 2. The test portion
of each dataset was then used for the data entry scenarios
presented below.
B. Simulation Experiments
In our simulation experiments, we aim to verify hypotheses
regarding two components of our system: first, that our data-
driven question orderings ask the most uncertain questions
first, improving our ability to predict missing responses; and
second, that our re-asking model is able to identify erroneous
responses accurately, so that we can target those questions for
verification.
1 2 3 4 5 6 7 8 9 10 11 12 13 140.2
0.3
0.4
0.5
0.6
0.7
0.8
Number of inputted fields
% r
em
ain
ing fie
lds p
redic
ted Survey Dataset
1 2 3 4 5 6 7 8 9 10 11 12 13 140
0.1
0.2
0.3
0.4
0.5
0.6
0.7
0.8
Number of inputted fields
All
rem
ain
ing fie
lds p
redic
ted
Survey Dataset
1 2 3 4 5 6 7 80.3
0.4
0.5
0.6
0.7
0.8
0.9
1
Number of inputted fields
% r
em
ain
ing fie
lds p
redic
ted Patient Dataset
1 2 3 4 5 6 7 80
0.10.20.30.40.50.60.70.80.9
1
Number of inputted fields
All
rem
ain
ing fie
lds p
redic
ted
Patient Dataset
Dynamic Reordering
Static Ordering
Original Ordering
Random
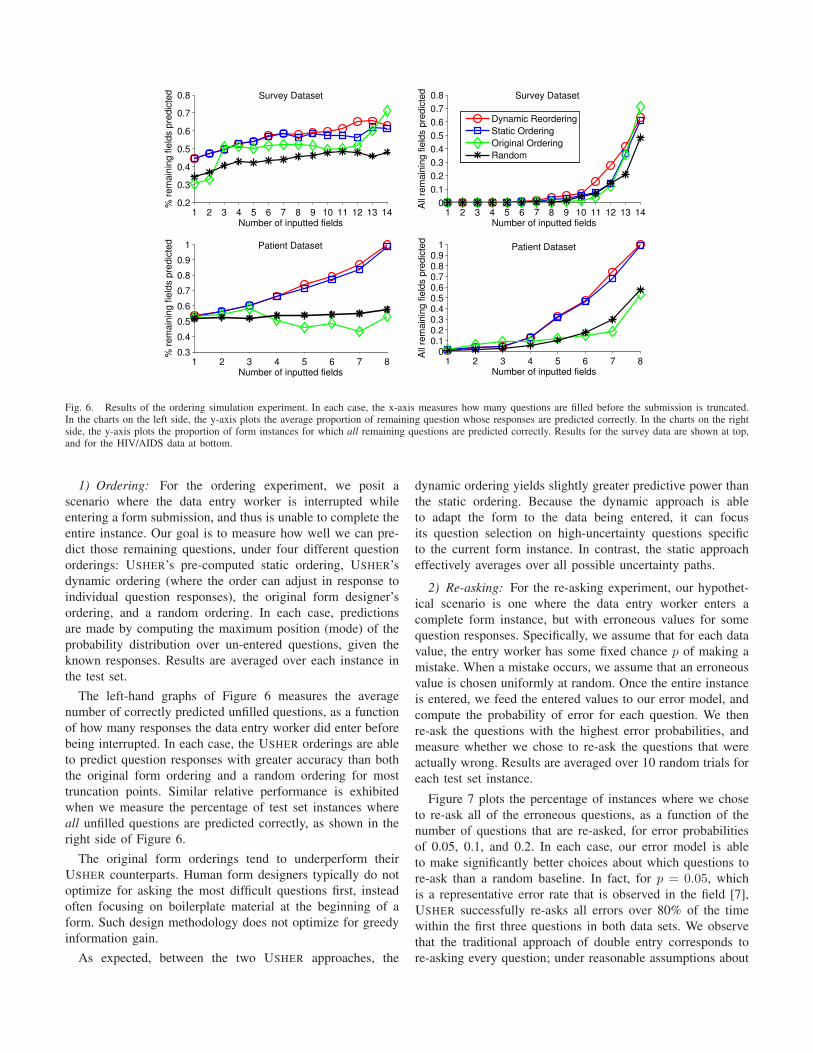
Fig. 6. Results of the ordering simulation experiment. In each case, the x-axis measures how many questions are filled before the submission is truncated.In the charts on the left side, the y-axis plots the average proportion of remaining question whose responses are predicted correctly. In the charts on the rightside, the y-axis plots the proportion of form instances for which all remaining questions are predicted correctly. Results for the survey data are shown at top,and for the HIV/AIDS data at bottom.
1) Ordering: For the ordering experiment, we posit a
scenario where the data entry worker is interrupted while
entering a form submission, and thus is unable to complete the
entire instance. Our goal is to measure how well we can pre-
dict those remaining questions, under four different question
orderings: USHER’s pre-computed static ordering, USHER’s
dynamic ordering (where the order can adjust in response to
individual question responses), the original form designer’s
ordering, and a random ordering. In each case, predictions
are made by computing the maximum position (mode) of the
probability distribution over un-entered questions, given the
known responses. Results are averaged over each instance in
the test set.
The left-hand graphs of Figure 6 measures the average
number of correctly predicted unfilled questions, as a function
of how many responses the data entry worker did enter before
being interrupted. In each case, the USHER orderings are able
to predict question responses with greater accuracy than both
the original form ordering and a random ordering for most
truncation points. Similar relative performance is exhibited
when we measure the percentage of test set instances where
all unfilled questions are predicted correctly, as shown in the
right side of Figure 6.
The original form orderings tend to underperform their
USHER counterparts. Human form designers typically do not
optimize for asking the most difficult questions first, instead
often focusing on boilerplate material at the beginning of a
form. Such design methodology does not optimize for greedy
information gain.
As expected, between the two USHER approaches, the
dynamic ordering yields slightly greater predictive power than
the static ordering. Because the dynamic approach is able
to adapt the form to the data being entered, it can focus
its question selection on high-uncertainty questions specific
to the current form instance. In contrast, the static approach
effectively averages over all possible uncertainty paths.
2) Re-asking: For the re-asking experiment, our hypothet-
ical scenario is one where the data entry worker enters a
complete form instance, but with erroneous values for some
question responses. Specifically, we assume that for each data
value, the entry worker has some fixed chance p of making a
mistake. When a mistake occurs, we assume that an erroneous
value is chosen uniformly at random. Once the entire instance
is entered, we feed the entered values to our error model, and
compute the probability of error for each question. We then
re-ask the questions with the highest error probabilities, and
measure whether we chose to re-ask the questions that were
actually wrong. Results are averaged over 10 random trials for
each test set instance.
Figure 7 plots the percentage of instances where we chose
to re-ask all of the erroneous questions, as a function of the
number of questions that are re-asked, for error probabilities
of 0.05, 0.1, and 0.2. In each case, our error model is able
to make significantly better choices about which questions to
re-ask than a random baseline. In fact, for p = 0.05, which
is a representative error rate that is observed in the field [7],
USHER successfully re-asks all errors over 80% of the time
within the first three questions in both data sets. We observe
that the traditional approach of double entry corresponds to
re-asking every question; under reasonable assumptions about

0 1 2 3 4 5 6 7 8 9 1011121314150
0.1
0.2
0.3
0.4
0.5
0.6
0.7
0.8
0.9
1
Number of questions re−asked
% s
ucce
ssfu
l tr
ials
Survey dataset, error prob = 0.05
0 1 2 3 4 5 6 7 8 9 1011121314150
0.1
0.2
0.3
0.4
0.5
0.6
0.7
0.8
0.9
1
Number of questions re−asked
% s
ucce
ssfu
l tr
ials
Survey dataset, error prob = 0.1
0 1 2 3 4 5 6 7 8 9 1011121314150
0.1
0.2
0.3
0.4
0.5
0.6
0.7
0.8
0.9
1
Number of questions re−asked
% s
ucce
ssfu
l tr
ials
Survey dataset, error prob = 0.2
0 1 2 3 4 5 6 7 8 90
0.1
0.2
0.3
0.4
0.5
0.6
0.7
0.8
0.9
1
Number of questions re−asked
% s
ucce
ssfu
l tr
ials
Patient dataset, error prob = 0.05
0 1 2 3 4 5 6 7 8 90
0.1
0.2
0.3
0.4
0.5
0.6
0.7
0.8
0.9
1
Number of questions re−asked
% s
ucce
ssfu
l tr
ials
Patient dataset, error prob = 0.1
0 1 2 3 4 5 6 7 8 90
0.1
0.2
0.3
0.4
0.5
0.6
0.7
0.8
0.9
1
Number of questions re−asked
% s
ucce
ssfu
l tr
ials
Patient dataset, error prob = 0.2
Usher
Random
Fig. 7. Results of the re-asking simulation experiment. In each case, the x-axis measures how many questions we are allowed to re-ask, and the y-axismeasures whether we correctly identify all erroneous questions within that number of re-asks. The error probability indicates the rate at which we simulateerrors in the original data. Results for the survey data are shown at top, and for the HIV/AIDS data at bottom.
the occurrence of errors, our model is often able to achieve
the same result as double entry of identifying all erroneous
responses at a substantially reduced cost, in terms of number
of questions asked.
VIII. DISCUSSION: DYNAMIC INTERFACES FOR DATA
ENTRY
In the sections above, we described how USHER uses
statistical information traditionally associated with offline data
cleaning to improve interactive data entry via question or-
dering and re-asking. This raises questions about the human-
computer interactions inherent in electronic form-filling, which
are typically device- and application-dependent. For example,
in one of our applications, we are interested in how data
quality interactions play out on mobile devices in developing
countries, as in the Tanzanian patient forms we examined
above. But similar questions arise in traditional online forms
like web surveys. In this section we outline some broad design
considerations that arise from the probabilistic power of the
models and algorithms in USHER. We leave the investigation
of specific interfaces and their evaluation in various contexts
to future work.
While an interactive USHER-based interface is presenting
questions (either one-by-one or in groups), it can infer a
probability for each possible answer to the next question; those
probabilities are “contextualized” (conditioned) by previous
answers. The resulting quantitative probabilities can be ex-
posed to users in different manners and at different times. We
taxonomize some of these design options as follows:
1) Time of exposure: friction and assessment. The prob-
ability of an answer can be exposed in an interface
before the user chooses their answer. This can be done
to improve data entry speed by adjusting the friction of
entering different answers: likely results become easy
or attractive to enter, while unlikely results require
more work. Examples of data-driven variance in friction
include type-ahead mechanisms in textfields, “popular
choice” items repeated at the top of drop-down lists,
and direct decoration (e.g. coloring or font-size) of each
choice in accordance with its probability. A downside
of beforehand exposure of answer probabilities is the
potential to bias answers. Alternatively, probabilities
may be exposed in the interface only after the user
selects an answer. This becomes a form of assessment
— for example, by flagging unlikely choices as potential
outliers. This assessment can be seen as a soft proba-
bilistic version of the constraint violation visualizations
commonly found in web forms (e.g. the red star that
often shows up next to forbidden or missing entries).
Post-hoc assessment arguably has less of a biasing affect
than friction. This is both because users choose initial
answers without knowledge of the model’s predictions,
and because users may be less likely to modify previous
answers than they would be to change their minds before
entry.
2) Explicitness of exposure: Feedback mechanisms in

Fig. 8. Mockups of some simple dynamic data entry widgets illustrating various design options.
adaptive interfaces vary in terms of how explicitly
they intervene in the user’s task. Adaptations can be
considered elective versus mandatory. For instance, a
drop-down menu with items sorted based on likelihood
is mandatory with a high level of friction; whereas, a
“split” drop-down menu, as mentioned above, is elective
— the user can choose to ignore the popular choices.
Another important consideration is the cognitive com-
plexity of the feedback. For instance, when encoding
expected values into a set of radio buttons, we can
directly show the numeric probability of each choice,
forcing a user to interpret numbers. Alternatively, we
can scale the opacity of answer labels — giving the
user an indication of relative salience, without the need
for quantitative interpretation. Even more subtly, we
can dynamically adjust the invisible size of answer
labels’ clickable regions according to its likelihood —
introducing an almost imperceptible form of adaptive
guidance.
3) Contextualization of interface: USHER correctly uses
conditional probabilities to assess the likelihood of
subsequent answers. However, this is not necessarily
intuitive to a user. For example, consider a question
asking for “favorite beverage,” where the most likely
answers shown are “milk” and “apple juice.” This might
be surprising in the abstract, but would be less so in a
case where a previous question had identified the age of
the person in question to be under 5 years. The way that
the interface communicates the context of the current
probabilities is an interesting design consideration. For
example, “type-ahead” text interfaces have this flavor,
showing the likely suffix of a word contextualized by
the previously-entered prefix. More generally, USHER
makes it possible to show a history of the already-
entered answers to questions that correlate highly with
the value at hand.
Note that these design properties are not specifically tied
to any particular interface widgets, nor do they necessarily
motivate new interface technologies. In Figure 8 we show
some crude examples of the ideas of USHER embedded into
traditional widgets: the drop-down menu in part A features first
an elective split-menu adaptation before entry, and a color-
encoded value assessment after entry; the textfield in part
B shows type-ahead suggestions ordered by likelihood, thus
decreasing the physical distance (a form of friction) for more-
likely values; the radio buttons in part C directly communicate
quantitative probabilities to the user.
While these broad design properties help clarify the poten-
tial user experience benefits of USHER’s data-driven philoso-
phy, there are clearly many remaining questions about how to
do this embedding well for different settings and users. Those
questions are beyond the scope of this paper. In future work we
intend to pursue them via a few different scenarios — notably,
in a repetitive data entry program supporting rural health care
in East Africa, and in a web survey — via controlled user
studies.

IX. SUMMARY AND FUTURE WORK
In this paper, we have shown that probabilistic approaches
can be used to design intelligent data entry forms that promote
high data quality. USHER leverages data-driven insights to
automate multiple steps in the data entry pipeline. Before
entry, we find an ordering of form fields that promotes rapid
information capture, driven by a greedy information gain prin-
ciple. During entry, we use the same principle to dynamically
adapt the form based on entered values. After entry, we
automatically identify possibly erroneous inputs, guided by
contextualized error likelihood, and re-ask those questions to
verify their correctness. Our empirical evaluations demonstrate
the data quality benefits of each of these components: question
ordering allows better prediction accuracy and the re-asking
model identifies erroneous responses effectively.
There are a variety of ways in which this work can be ex-
tended. A major piece of future work alluded to in Section VIII
is to study how our probabilistic model can inform effective
adaptations of the user interface during data entry. We intend
to answer this problem in greater depth with user studies and
field deployments of our system.
On the modeling side, our current probabilistic approach
assumes that every question is discrete and takes on a series
of unrelated values. Relaxing these assumptions would make
for a richer and potentially more accurate predictive model for
many domains. Additionally, we want to consider models that
reflect temporal changes in the underlying data. Our present
error model makes strong assumptions both about how errors
are distributed, and what errors look like. On that front, an
interesting line of future work would be to learn a model of
data entry errors and adapt our system to catch them.
Finally, we plan to measure the practical impact of our
system, by piloting USHER with our field partners, the
United Nations Development Program’s Millennium Villages
Project [29] in Uganda, and a community health care program
in Tanzania. These organizations’ data quality concerns were
the original motivation for this work, and thus serve as an
important litmus test for our system.
ACKNOWLEDGMENTS
The authors thank Maneesh Agrawala, Yaw Anokwa,
Michael Bernstein, S.R.K. Branavan, Tyson Condie, Heather
Dolan, Jeff Heer, Max van Kleek, Neal Lesh, Alice Lin, Jamie
Lockwood, Bob McCarthy, Tom Piazza, Christine Robson
and the anonymous reviewers for their helpful comments and
suggestions. We acknowledge the Yahoo Labs Technology for
Good Fellowship, the National Science Foundation Graduate
Fellowship, and NSF Grant 0713661.
REFERENCES
[1] T. Dasu and T. Johnson, Exploratory Data Mining and Data Cleaning.Wiley Series in Probability and Statistics, 2003.
[2] C. Batini and M. Scannapieco, Data Quality: Concepts, Methodologies
and Techniques. Springer, 2006.[3] R. M. Graves, F. J. Fowler, M. P. Couper, J. M. Lepkowski, E. Singer,
and R. Tourangeau, Survey Methodology. Wiley-Interscience, 2004.[4] J. Lee. (2003) Address to WHO staff. [Online]. Available: http:
//www.who.int/dg/lee/speeches/2003/21 07/en[5] J. V. D. Broeck, M. Mackay, N. Mpontshane, A. K. K. Luabeya,
M. Chhagan, and M. L. Bennish, “Maintaining data integrity in a ruralclinical trial,” Controlled Clinical Trials, 2007.
[6] R. McCarthy and T. Piazza, “Personal interview,” University of Califor-nia at Berkeley Survey Research Center, 2009.
[7] S. Patnaik, E. Brunskill, and W. Thies, “Evaluating the accuracy of datacollection on mobile phones: A study of forms, sms, and voice,” inICTD, 2009.
[8] J. M. Hellerstein, “Quantitative data cleaning for large databases,”United Nations Economic Commission for Europe (UNECE), 2008.
[9] A. Ali and C. Meek, “Predictive models of form filling,” MicrosoftResearch, Tech. Rep. MSR-TR-2009-1, Jan. 2009.
[10] L. A. Hermens and J. C. Schlimmer, “A machine-learning apprentice forthe completion of repetitive forms,” IEEE Expert: Intelligent Systems
and Their Applications, vol. 9, no. 1, 1994.[11] D. Lee and C. Tsatsoulis, “Intelligent data entry assistant for xml using
ensemble learning,” in In proc. ACM IUI, 2005.[12] J. C. Schlimmer and P. C. Wells, “Quantitative results comparing
three intelligent interfaces for information capture,” Journal of Artificial
Intelligence Research, vol. 5, 1996.[13] S. S. J.R. Warren, A. Davidovic and P. Bolton, “Mediface: anticipative
data entry interface for general practitioners,” in In proc. of OzCHI,1998.
[14] J. Warren and P. Bolton, “Intelligent split menus for data entry: asimulation study in general practice medicine,” J Amer Med Inform
Assoc, 1999.[15] Y. Yu, J. A. Stamberger, A. Manoharan, and A. Paepcke, “Ecopod: a
mobile tool for community based biodiversity collection building,” inJCDL, 2006.
[16] S. Day, P. Fayers, and D. Harvey, “Double data entry: what value, whatprice?” Controlled Clinical Trials, 1998.
[17] D. W. King and R. Lashley, “A quantifiable alternative to double dataentry,” Controlled Clinical Trials, 2000.
[18] K. Kleinman, “Adaptive double data entry: a probabilistic tool forchoosing which forms to reenter,” Controlled Clinical Trials, 2001.
[19] K. L. Norman. Online survey design guide. [Online]. Available:http://lap.umd.edu/survey design
[20] A. Hartemink. Banjo: Bayesian network inference with java objects.[Online]. Available: http://www.cs.duke.edu/∼amink/software/banjo
[21] F. G. Cozman. JavaBayes - Bayesian Networks in Java. [Online].Available: http://www.cs.cmu.edu/∼javabayes
[22] M. R. Cambridge. Infer.NET. [Online]. Available: http://research.microsoft.com/en-us/um/cambridge/projects/infernet
[23] D. Heckerman, D. Geiger, and D. M. Chickering, “Learning bayesiannetworks: The combination of knowledge and statistical data,” Machine
Learning, vol. 20, no. 3, pp. 197–243, 1995.[24] F. Jelinek and R. L. Mercer, “Interpolated estimation of markov source
parameters from sparse data,” in Proceedings of the Workshop on Pattern
Recognition in Practice, 1980.[25] C. M. Bishop, Pattern Recognition and Machine Learning. Springer,
2007.[26] J. M. Bernardo and A. F. Smith, Bayesian Theory. Wiley Series in
Probability and Statistics, 2000.[27] T. P. Minka, “Expectation propagation for approximate bayesian infer-
ence,” in Proceedings of the Conference in Uncertainty in Artificial
Intelligence, 2001.[28] U. C. Berkeley. Survey documentation and analysis. [Online]. Available:
http://sda.berkeley.edu[29] The millennium villages project. [Online]. Available: http://www.
millenniumvillages.org