Embed Size (px)
Citation preview

J2X1-7661-01ENZ0(01)September 2012
Windows/Solaris/Linux
Systemwalker Service Quality Coordinator
User's Guide (Dashboard Edition)

Preface
Purpose of this manual
This manual explains the use of the Systemwalker Service Quality Coordinator's Dashboard function. The Dashboard function shows anarray of important information, extracted from the great mass of information that Systemwalker Service Quality Coordinator collects,conveniently displayed for use during operations.
Target audience
This manual is intended for users who have a general understanding of the operation and use of Systemwalker Service Quality Coordinatorand are considering installing it.
Readers of this manual should also have a general understanding of basic operating system and GUI operations as well as a workingknowledge of communications protocols such as TCP/IP and SMTP.
Organization of Systemwalker Service Quality Coordinator manuals
The Systemwalker Service Quality Coordinator manuals are organized as follows:
- Systemwalker Service Quality Coordinator Technical Guide
Provides an overview of the functions of Systemwalker Service Quality Coordinator.
- Systemwalker Service Quality Coordinator Installation Guide
Explains how to install and set up Systemwalker Service Quality Coordinator.
- Systemwalker Service Quality Coordinator User's Guide
Explains how to use the functions of Systemwalker Service Quality Coordinator.
- Systemwalker Service Quality Coordinator User's Guide (Console Edition)
Explains how to use those functions related to console windows.
- Systemwalker Service Quality Coordinator User's Guide (Dashboard Edition)
Explains how to use those functions related to dashboard use.
- Systemwalker Service Quality Coordinator Reference Guide
Explains commands, data formats, messages and so on.
- Systemwalker Service Quality Coordinator Troubleshooting Guide
Explains how to handle any problems that may occur.
- Systemwalker Service Quality Coordinator User's Guide (Website Management Functions Edition)
Explains the Systemwalker Service Quality Coordinator functions that relate to analyzing Web usage and monitoring Web contenttampering.
- Systemwalker Service Quality Coordinator User's Guide (Systemwalker User Management and Single Sign-On Edition)
Explains how to install and use the Systemwalker User Management and Systemwalker Single Sign-On functions when SystemwalkerService Quality Coordinator is to be used.
- Systemwalker User's Guide - Systemwalker User Management and Single Sign-On
Explains how to install the Systemwalker User Management function and the Systemwalker Single Sign-On function.
- Systemwalker Service Quality Coordinator Glossary
This manual explains Systemwalker Service Quality Coordinator terminology.
- i -

Positioning of this document
This manual is common to the following Systemwalker Service Quality Coordinator products for Windows, Linux and Oracle Solaris:
- Systemwalker Service Quality Coordinator Enterprise Edition V15.0.0
- Systemwalker Service Quality Coordinator Standard Edition V15.0.0
Abbreviations
- The term "Windows Server 2008" refers to the following products:
- Microsoft(R) Windows Server(R) 2008 R2 Foundation
- Microsoft(R) Windows Server(R) 2008 R2 Standard
- Microsoft(R) Windows Server(R) 2008 R2 Enterprise
- Microsoft(R) Windows Server(R) 2008 R2 Datacenter
- Microsoft(R) Windows Server(R) 2008 Foundation
- Microsoft(R) Windows Server(R) 2008 Standard
- Microsoft(R) Windows Server(R) 2008 Enterprise
- Microsoft(R) Windows Server(R) 2008 Datacenter
- Microsoft(R) Windows Server(R) 2008 Standard without Hyper-V(TM)
- Microsoft(R) Windows Server(R) 2008 Enterprise without Hyper-V(TM)
- Microsoft(R) Windows Server(R) 2008 Datacenter without Hyper-V(TM)
- Microsoft(R) Windows Server(R) 2008 Standard Server Core
- Microsoft(R) Windows Server(R) 2008 Standard without Hyper-V(TM) Server Core
- Microsoft(R) Windows Server(R) 2008 Enterprise Server Core
- Microsoft(R) Windows Server(R) 2008 Enterprise without Hyper-V(TM) Server Core
- Microsoft(R) Windows Server(R) 2008 Datacenter Server Core
- Microsoft(R) Windows Server(R) 2008 Datacenter without Hyper-V(TM) Server Core
- The term "Windows Server 2003" refers to the following products:
- Microsoft(R) Windows Server(R) 2003 R2, Standard Edition
- Microsoft(R) Windows Server(R) 2003 R2, Enterprise Edition
- Microsoft(R) Windows Server(R) 2003 R2, Datacenter Edition
- Microsoft(R) Windows Server(R) 2003, Standard Edition
- Microsoft(R) Windows Server(R) 2003, Enterprise Edition
- Microsoft(R) Windows Server(R) 2003, Datacenter Edition
- The term "Windows 7" refers to the following products:
- Windows(R) 7 Home Premium
- Windows(R) 7 Professional
- Windows(R) 7 Enterprise
- Windows(R) 7 Ultimate
- ii -

- The term "Windows Vista" refers to the following products:
- Windows Vista(R) Home Basic
- Windows Vista(R) Home Premium
- Windows Vista(R) Business
- Windows Vista(R) Enterprise
- Windows Vista(R) Ultimate
- The term "Windows XP" refers to the following products:
- Microsoft(R) Windows(R) XP Home Edition
- Microsoft(R) Windows(R) XP Professional Edition
- Microsoft(R) SQL Server(TM) is abbreviated as "SQL Server".
- Microsoft(R) Cluster Server is abbreviated as "MSCS".
- Oracle Solaris might be described as Solaris, Solaris Operating System, or Solaris OS.
- Oracle WebLogic Server is abbreviated as "WebLogic Server".
- Oracle Database is abbreviated as "Oracle".
- Systemwalker Centric Manager is abbreviated as "Centric Manager".
- Systemwalker Resource Coordinator is abbreviated as "Resource Coordinator".
- Interstage Application Server is abbreviated as "Interstage".
- Symfoware Server is abbreviated as "Symfoware".
- VMware(R) ESX(R) is abbreviated as "VMware ESX" or "ESX".
- VMware(R) ESXi(TM) is abbreviated as "VMware ESXi" or "ESXi".
- VMware(R) vCenter(TM) is abbreviated as "VMware vCenter" or "vCenter".
- VMware vSphere(R) is abbreviated as "VMware vSphere".
- Versions of Systemwalker Service Quality Coordinator that operate under Windows are referred to as "Windows versions".
- Versions of Systemwalker Service Quality Coordinator that operate under Solaris are referred to as "Solaris versions".
- Versions of Systemwalker Service Quality Coordinator that operate under Linux are referred to as "Linux versions".
- Solaris and Linux versions of Systemwalker Service Quality Coordinator are referred to collectively as "UNIX versions".
- The term "Agent" is used to refer to articles common to both Agent for Server and Agent for Business.
Conventions used in this document
- Information specific to Windows or UNIX versions
This document contains information common to both Windows versions and UNIX versions of Systemwalker Service QualityCoordinator. Information specific to only the Windows versions and information specific to only the UNIX versions are distinguishedfrom common information by attaching the following symbols:
[Windows]
This indicates that the article relates specifically to Windows versions.
[UNIX]
This indicates that the article relates specifically to UNIX versions.
- iii -

The symbols [Solaris], [Linux], [AIX], and [HP-UX] are used to distinguish Solaris, Linux, AIX, and HP-UX versions ofSystemwalker Service Quality Coordinator.
Symbols
The symbols used with commands are explained below.
[Entry example]
[PARA={a | b | c |...}]
[Meaning of each symbol]
Symbol Meaning
[] Items enclosed in square brackets are optional.
{} Select one of the items enclosed in braces ( { } ).
__ When all optional items enclosed in square brackets ( [ ] ) are omitted, the default value indicatedby an underscore ( _ ) is used.
| Select one of the items separated by vertical bars.
... The item immediately before the ellipsis (...) can be repeatedly specified.
Export Restriction
If this document is to be exported or provided overseas, confirm the regulations of Foreign Exchange and Foreign Trade Control lawsadhere to all legal requirements according to those laws.
Trademarks
- Adobe, Adobe Reader, and Flash are either registered trademarks or trademarks of Adobe Systems Incorporated in the United Statesand/or other countries.
- Apache and Tomcat are trademarks or registered trademarks of The Apache Software Foundation.
- HP-UX is a registered trademark of the Hewlett-Packard Company.
- IBM, IBM logo, AIX, AIX 5L, HACMP, Power, and PowerHA are trademarks of International Business Machines Corporation inthe United States and other countries.
- Intel and Itanium are trademarks or registered trademarks of Intel Corporation in the U.S. and other countries.
- Linux is a trademark or registered trademark of Mr. Linus Torvalds in the United States and other countries.
- Microsoft, Windows, Windows Server and the titles or names of other Microsoft products are trademarks or registered trademarks ofMicrosoft Corporation in the United States and other countries.
- Oracle and Java are registered trademarks of Oracle and/or its affiliates. Other names may be trademarks of their respective owners.
- Oracle Solaris might be described as Solaris, Solaris Operating System, or Solaris OS.
- Red Hat, RPM, and all the trademarks and logos based on Red Hat are trademarks or registered trademarks of Red Hat, Inc. in theUnited States and other countries.
- UNIX is a registered trademark of The Open Group in the United States and other countries.
- VMware, the VMware logo, Virtual SMP and VMotion are trademarks or registered trademarks of VMware, Inc. in the United Statesand other countries.
- Other company names and product names are trademarks or registered trademarks of respective companies.
- iv -

- The company names, system names, product names and other proprietary names that appear in this document are not alwaysaccompanied by trademark symbols (TM or (R)).
This guide uses screenshots in accordance with Microsoft Corporation's guidelines.
Related manuals
For more information about the products that make up the environment where the dashboard is used, refer to the following manuals:
- Interstage Application Server Installation Guide
- Interstage Business Process Manager Analytics V11.1 Installation Guide
- Interstage Business Process Manager Analytics V11.1 Studio Guide
Acknowledgement
This product includes software developed by the OpenSSL Project for use in the OpenSSL Toolkit. (http://www.openssl.org/)
September 2012
Copyright 2003-2012 FUJITSU LIMITED
Revision History
Details of Revisions Location Manual Code
Revised collecting information of Dashboard template(14:Interstage(detail)).
4.1.3.1 J2X1-7661-01ENZ0(01)J2X1-7661-01ENZ2(01)
- v -

ContentsChapter 1 Overview..................................................................................................................................................................1
1.1 What Is the Dashboard?.......................................................................................................................................................................11.2 System Configuration..........................................................................................................................................................................2
Chapter 2 Design......................................................................................................................................................................42.1 Operating Environments......................................................................................................................................................................4
2.1.1 Dashboard Server Resources........................................................................................................................................................42.1.1.1 Hardware................................................................................................................................................................................42.1.1.2 Software.................................................................................................................................................................................5
2.2 Operation Model..................................................................................................................................................................................8
Chapter 3 Installation................................................................................................................................................................93.1 Installation Procedure..........................................................................................................................................................................93.2 Constructing the Dashboard Server Environment...............................................................................................................................9
3.2.1 Installing Interstage Business Process Manager Analytics...........................................................................................................93.2.1.1 Interstage Business Process Manager Analytics Installation...............................................................................................103.2.1.2 Registering PDB Sensors in Interstage Business Process Manager Analytics....................................................................16
3.2.1.2.1 Registering definition files............................................................................................................................................173.2.1.2.2 Registering integrated modules (jar files).....................................................................................................................17
3.2.1.3 Creating the Built-in database and Users.............................................................................................................................183.2.1.4 Creating Dashboard Users...................................................................................................................................................203.2.1.5 Setting of the IP address of the connection target Manager................................................................................................233.2.1.6 Confirm the Start of the Dashboard Server.........................................................................................................................233.2.1.7 Opening of dashboard template to the users........................................................................................................................23
3.3 Deleting the Dashboard Server Environment....................................................................................................................................24
Chapter 4 Operation...............................................................................................................................................................264.1 Systemwalker Service Quality Coordinator Dashboard Templates..................................................................................................26
4.1.1 Overview.....................................................................................................................................................................................264.1.2 How to Use the Dashboard Templates.......................................................................................................................................30
4.1.2.1 Releasing the Dashboard Templates Using the Analytic Studio.........................................................................................304.1.2.1.1 Logging in to the Analytics Studio...............................................................................................................................304.1.2.1.2 Creating a dashboard group..........................................................................................................................................324.1.2.1.3 Waiting for release of the dashboard group..................................................................................................................334.1.2.1.4 Releasing the dashboard group.....................................................................................................................................33
4.1.2.2 Displaying the Dashboard....................................................................................................................................................344.1.2.2.1 Logging in to the Dashboard........................................................................................................................................34
4.1.3 Customizing Dashboard Templates............................................................................................................................................354.1.3.1 Dashboard templates............................................................................................................................................................354.1.3.2 Setting Agents to be Monitored...........................................................................................................................................384.1.3.3 Changing the Data Collection Interval of the Dashboard Server........................................................................................404.1.3.4 Adding Information to be Monitored to the Dashboard......................................................................................................414.1.3.5 Account Management..........................................................................................................................................................43
4.2 Event Format......................................................................................................................................................................................434.2.1 Event Name.................................................................................................................................................................................43
4.2.1.1 Summary Information..........................................................................................................................................................434.2.1.2 Drilled-Down/Report Information.......................................................................................................................................44
4.2.2 Event Attributes..........................................................................................................................................................................444.3 Changing the IP Addresses of Connected Managers.........................................................................................................................454.4 Setting Dashboard Server Data Retention Periods............................................................................................................................454.5 Backup and Restore of the Dashboard Server Environment.............................................................................................................46
4.5.1 Backup and Restore of Interstage Business Process Manager Analytics/Symfoware Server....................................................46
Appendix A Starting and Stopping..........................................................................................................................................47A.1 Starting and Stopping the Dashboard Server....................................................................................................................................47
- vi -

A.1.1 Starting the Dashboard Server...................................................................................................................................................47A.1.2 Stopping the Dashboard Server.................................................................................................................................................47
A.2 Starting and Stopping the Built-in database......................................................................................................................................48A.2.1 Starting the Built-in database.....................................................................................................................................................48A.2.2 Stopping the Built-in database...................................................................................................................................................48
A.3 Starting and Stopping the Built-in Application Server.....................................................................................................................48A.3.1 Starting the Built-in Application Server....................................................................................................................................48A.3.2 Stopping the Built-in Application Server..................................................................................................................................49
Appendix B Migration.............................................................................................................................................................50B.1 Advance Preparation.........................................................................................................................................................................50
B.1.1 Changing settings of connection information............................................................................................................................50B.1.2 Changing Parameters of the Database........................................................................................................................................50B.1.3 Backup Resources......................................................................................................................................................................52B.1.4 Uninstallation of the Interstage Business Process Manager Analytics......................................................................................52
B.2 Migration Procedure..........................................................................................................................................................................52B.2.1 Installation of the Interstage Business Process Manager Analytics V12...................................................................................52B.2.2 Stopping the work unit...............................................................................................................................................................53B.2.3 Replacement of configuration file..............................................................................................................................................53B.2.4 Executing Migration Command.................................................................................................................................................53B.2.5 Starting Work Unit.....................................................................................................................................................................54B.2.6 Setting of Connection Information.............................................................................................................................................55
B.3 Points of Concern..............................................................................................................................................................................55B.3.1 About the data handling when executing migration..................................................................................................................55
- vii -

Chapter 1 OverviewThis chapter provides an overview of the Systemwalker Service Quality Coordinator dashboard.
1.1 What Is the Dashboard?The dashboard provides a customizable display of important information extracted from an array of data collected by the SystemwalkerService Quality Coordinator, making the information readily available for day-to-day operations and review. While the console providesa standard fixed view for Systemwalker Service Quality Coordinator data, the display of the dashboard is highly customizable, so you cancreate a presentation of data that is most appropriate for your needs. The console and dashboard have different roles, as below:
Console
The system administrator uses the console to easily see and analyze operations occurring across the entire system.
Dashboard
Managers use the console to easily see the status of areas of the system they are responsible for.
Individual users use the Analytics Studio (provided with Systemwalker Service Quality Coordinator) to create their own dashboards whichcontain only the information they need, in the exact layout they want, showing graphs in the format they choose. These customizeddashboards can be viewed with a Web browser.
- 1 -

1.2 System ConfigurationThis section explains the system configuration required by the dashboard.
The dashboard consists of the Dashboard Server.
Only Windows can be used as the operation platform.
Dashboard Server
The Dashboard Server contains the functions such as the Management Console, Analytics Studio, dashboard, Built-in Applicationserver, Built-in database, and PDB sensors. Systemwalker Service Quality Coordinator bundles the Application Server and databaserequired for operation, which are called the "Built-in Application server" and "Built-in database", respectively.
Management Console
This provides functions for setting up the Dashboard Server environment and for management after operation starts, and thesefunctions can be used on a Web browser.
Analytics Studio
This provides functions for creating and customizing dashboards, and these functions can be used on a Web browser.
Dashboard
Dashboards that have been created using the Analytics Studio can be viewed on a Web browser.
Built-in Application server
This handles the Application Server required for operating the Dashboard Server.
Built-in database
This handles the Database Server required for operating the Dashboard Server.
PDB sensors
These collect performance information from the Manager PDB on a regular basis and store the information in the Built-in database.
- 2 -

The dashboard server consists of the following product, which is included with Systemwalker Service Quality Coordinator:
- Interstage Business Process Manager Analytics V12.0
The following Web browsers can be used to view the dashboard:
- Microsoft(R) Internet Explorer 8/9
The following Web browser can be used to view the Analytics Studio.
- Microsoft(R) Internet Explorer 9
Note
Adobe(R) Flash Player 10.3 or later must be installed on the machine used to view the dashboard.
- 3 -

Chapter 2 DesignThis chapter explains the design of the dashboard.
2.1 Operating EnvironmentsThis section explains the operating environments required in order to install the Systemwalker Service Quality Coordinator dashboard.
2.1.1 Dashboard Server ResourcesThis section explains the resources required for the Systemwalker Service Quality Coordinator Dashboard Server.
2.1.1.1 Hardware
Recommended hardware
Hardware type Conditions
CPU Intel(R) Xeon(R) 3GHz or higher
Memory 4GB or more
Static disk space: Installation area
The following disk space is required in order to install the Dashboard Server:
Used space Conditions
Installation directory 200 MB
Work area directory 1800 MB
Dynamic disk space: Dashboard Server database area
To operate the Dashboard Server, in addition to the space used by the Manager, space will be required for the database for the DashboardServer.
The space required for the database will depend on the number of resource instances to be managed by the Dashboard Server and thenumber of Agent/Proxy Managers.
To estimate the space required, first determine the types of records that the dashboard is to manage. Refer to "Data Formats" in theReference Guide for information about records.
Note
The Dashboard Server can manage approximately 100 types of records.
The method for estimating the data volume for managing the records uses the same calculations as those used for the Manager, so estimateby referring to "Estimating the size of the performance database/archive file" in the Installation Guide. The Dashboard Server can processapproximately 100 records per minute.
Note
The data retention period must be set separately from the Manager on the Dashboard Server. Set the retention period for each record thatis to be managed by the dashboard.
- 4 -

To set the data retention periods after installing the dashboard, refer to "4.4 Setting Dashboard Server Data Retention Periods".
Note
The disk space required for the Built-in Database is 25 GB or more.
Dynamic disk space: Dashboard Server work area
The work area is used to temporarily store performance information transmitted from the Manager to the Dashboard Server and to saveset up information.
To estimate the amount of disk space required for the work area, first estimate the data volume if the retention period is 1 day.
Next, use this estimate in the following formula to calculate the size of the work area:
Work area = data volume estimate result / 1440 * collection interval (minutes) * safety factor (1.5)
Point
The default collection interval for the Dashboard Server is 10 minutes.
To change the collection interval, refer to "4.1.3.3 Changing the Data Collection Interval of the Dashboard Server".
If the Dashboard Server needs to be stopped for maintenance or any other reason, multiply the result of the above formula by the lengthof time that the server will be stopped (in minutes) to estimate the work area.
2.1.1.2 Software
Operating Systems
Dashboard Server operates under the following operating systems:
Item Requirement Remarks
Operatingsystem
Microsoft(R) Windows Server(R) 2003 R2, Standard Edition Service Pack 2
Microsoft(R) Windows Server(R) 2003 R2, Enterprise Edition Service Pack 2
Microsoft(R) Windows Server(R) 2003 R2, Standard x64 Edition Service Pack 2
Microsoft(R) Windows Server(R) 2003 R2, Enterprise x64 Edition Service Pack 2
Microsoft(R) Windows Server(R) 2008 Standard (x86) Service Pack 2
Microsoft(R) Windows Server(R) 2008 Standard (x64) Service Pack 2
Microsoft(R) Windows Server(R) 2008 R2 Standard (x64) Service Pack: None/1
Microsoft(R) Windows Server(R) 2008 Enterprise (x86) Service Pack 2
Microsoft(R) Windows Server(R) 2008 Enterprise (x64) Service Pack 2
Microsoft(R) Windows Server(R) 2008 R2 Enterprise (x64) Service Pack: None/1
Products that cannot be installed
The Dashboard Server cannot coexist with the following software:
Product V/L Remarks
Symfoware Server All versions
- 5 -

Product V/L Remarks
Symfoware Server (Client Function) All versions
Symfoware Server Advanced Backup Controller V10.0.0 or earlier
Symfoware Server Mirroring Controller 9.x or earlier
Symfoware Server Connection Manager All versions
Systemwalker Centric Manager (*1) V5.0L10 or later Cannot be installed if itis installed as an"Operation ManagementServer" server type
Systemwalker Desktop Monitor V10.0L20 or later
Systemwalker Desktop Keeper V13.0.0 or later
Systemwalker Desktop Log Analyzer V12.0L10 or later
Systemwalker Desktop Rights Master V13.0.0 or later
Systemwalker Desktop Patrol V13.0.0 or later
Systemwalker/StorageMGR (*2) All versions
Softek AdvancedCopy Manager V10.0L20 or later Cannot be installed onlyif the Manager function(Storage ManagementServer) ofAdvancedCopyManager is installed
ETERNUS SF AdvancedCopy Manager V13.0 or later Cannot be installed onlyif the Manager function(Storage ManagementServer) ofAdvancedCopyManager is installed
Systemwalker/Getaccess All versions
Systemwalker/PerfMGR V10.0L10 or later
SUCCESS SERVER V1.0 or later
SUCCESS SERVER Development Set V2.0 or later
SUCCESS SERVER J/COBOL Development Tool for Partners V2.0 or later
INTERSTAGE SUCCESS SERVER V3.0 or later
Meridio V1.1L10 or later
Interstage CollaborationRing series (*3) All versions
Interstage Information Integrator V10.0.0
Interstage Solution Suite Commerce Enterprise Edition V5.0 or later
Interstage Data Collector V6.0L10 or later
InterAPLINK V2.0L10 or later
Interstage List Manager (*4) V7.0L10 or later
Interstage List Works V7.0L10 or later
Internet Navigware Server Enterprise Edition V8.0L10/V8.0L11
TRADEMASTER All versions
Interstage Business Application Server Standard Edition All versions
- 6 -

Product V/L Remarks
Interstage XML Business Activity Recorder V10.0.0
Interstage Service Integrator Enterprise Edition All versions
Systemwalker IT Process Master All versions
Systemwalker IT Change Manager V14.0.0
Systemwalker IT Transition Manager All versions
Systemwalker Service Catalog Manager V14.1.0 or earlier Cannot be installed if itis installed as a"Management Server"server type
Cloud infrastructure management software All versions Cannot be installed if itis installed as a"Management Server"server type
ServerView Resource Orchestrator Cloud Edition V3.0 or later Cannot be installed if itis installed as a"Management Server"server type
Interstage Business Process Manager Analytics All versions
*1: Systemwalker Centric Manager includes the following products:
- Systemwalker/CentricMGR -M GEE- Systemwalker/CentricMGR -M EE- Systemwalker/CentricMGR -M SE- Systemwalker Centric Manager Global Enterprise Edition- Systemwalker Centric Manager Enterprise Edition- Systemwalker Centric Manager Standard Edition
*2: Systemwalker/StorageMGR includes the following products:
- Systemwalker/StorageMGR -M EE- Systemwalker/StorageMGR -M SE
*3: The Interstage CollaborationRing series includes the following products:
- Interstage CollaborationRing PM- Interstage CollaborationRing PM Enterprise Edition- Interstage CollaborationRing PM Standard Edition- Interstage CollaborationRing TPM- Interstage CollaborationRing TPM Connector- Interstage CollaborationRing FTI- Interstage CollaborationRing Process Manager- Interstage CollaborationRing Flow Controller- Interstage CollaborationRing Business Connector- Interstage CollaborationRing Trading Server- Interstage CollaborationRing File Transfer Integrator- Interstage CollaborationRing Interaction Server
*4: Interstage List Works includes the following products:
- Interstage List Works Enterprise Edition- Interstage List Works Standard Edition
- 7 -

2.2 Operation ModelThis model shows a basic configuration for the Dashboard Server:
In the diagram above, the Dashboard Server and the Manager are located on separate servers, but they can be installed and configured onthe same server when on the Windows versions. However, from a performance viewpoint, it is recommended that the Dashboard Serverand the Manager are run on separate servers to avoid competition for access to data.
Note
- If the Manager is operating in a cluster system, the Manager and the Dashboard Server cannot be installed on the same server. In thissituation, install the Dashboard Server on a completely separate server.
- If the Manager and the Operation Management Server of Systemwalker Centric Manager are installed on the same server, you cannotinstall the Dashboard Server on that machine. In this situation, install the Dashboard Server on a completely separate server.
- 8 -

Chapter 3 InstallationThis chapter explains how to install the Dashboard Server and the Analytics Studio.
3.1 Installation ProcedureThis section explains the installation procedure of the Dashboard Server and the Analytics Studio environments.
- Constructing the Dashboard Server environment
- Installing Interstage Business Process Manager Analytics
- Creating the Built-in database and users
- Creating dashboard users
- Starting the Dashboard Server
Note
- As a prerequisite, an SQC Manager and Operation Management Client must be installed.
- Start in console mode if you are going to install the software using a remote desktop.
- The following privileges are required when installing the Dashboard Server:
Privileges of a user belonging to the Administrators group
- Below is a list of port numbers used by the software that works in conjunction with the Dashboard Server. Ensure that there are noconflicts with other software on the system.
Software using the port Port number Remarks
Built-in ApplicationServer
40330 (predetermined) This can be changed.
40320 This cannot be changed.
- The following product cannot coexist with the Dashboard Server (refer to the "Products that cannot be installed" column in "2.1.1.2Software"). If previous versions are installed, refer to the manuals for each products to uninstall them:
- Interstage Business Process Manager Analytics
3.2 Constructing the Dashboard Server EnvironmentInstall and set up the software required for the Dashboard Server.
Note
When constructing the Dashboard Server under Windows Server 2008, execute commands as the administrator. To do so, from the Startmenu, select All Programs, Accessories, then right-click Command Prompt and select Run as administrator to start the commandprompt.
3.2.1 Installing Interstage Business Process Manager AnalyticsThis section explains the procedure for installing and setting up Interstage Business Process Manager Analytics.
- 9 -

3.2.1.1 Interstage Business Process Manager Analytics InstallationThis section explains the procedure for installing Interstage Business Process Manager Analytics.
Information
Refer to the following manual for details:
- "Setting Up the Analytics Server" in the Interstage Business Process Manager Analytics Installation Guide
1. Start the installer.
Insert the following DVD in the DVD drive of the computer.
- Systemwalker Service Quality Coordinator Enterprise Edition V15.0
Point
Depending on the settings of the machine, the installer may not start automatically. If it does not start automatically, perform thefollowing procedure to manually start the installer:
1. From the Start menu, select Run.
2. In the Run window, click Browse and select the file shown below, and then click OK.
DVD drive:\SwSetup.exe
When using DVD of the UNIX versions, perform the following procedure to manually start the installer:
1. From the Start menu, select Run.
2. In the Run window, click Browse and select the file shown below, and then click OK.
DVD drive:\client\SwSetup.exe
- 10 -

In the window that is displayed, select Setup(Client) >> Interstage Business Process Manager Analytics.
- 11 -

2. Click Install.
- 12 -

3. Make a selection for the installation.
Select Installation of Server component and then click Next.
4. Specify the settings for the Built-in database.Confirm that the Use Built-in database. checkbox is selected, and then, if there is no problem with the storage destination of thedatabase space, click Next.
- 13 -

Note
For the storage destination of the database space of the Built-in database, specify a disk with at least 25 GB of free space.
5. Select the Application Server type.
Confirm that Built-in Application Server has been selected, and the click Next.
6. Set the administrator ID and password.
First specify the ID and password of the administrator who will login to the Analytics Management Console. After specifying them,click Next.
The characters that can be specified in the administrator ID and password are shown below:
Character length Character type
AdministratorID
Up to 64 characters - Alphanumeric characters
- Symbols except for the following:
< > : | * ? / \
Password Up to 64 characters - Alphanumeric characters
- Symbols
- 14 -

7. Confirm the installation.
To make changes to the installation (for example, to the installation directory), select Change and then click Next.
If there are no changes to make, select Do not make any change and then click Next. Installation will start
- 15 -

Note
At least 25 GB of free space is required for the storage destination of the database space of the Built-in database. If space isinsufficient, the following error message will be output and installation will be interrupted:
Change the storage destination of the database space to a disk with at least 25 GB of free area.
8. Click Finish.
3.2.1.2 Registering PDB Sensors in Interstage Business Process Manager AnalyticsIn Interstage Business Process Manager Analytics, register the PDB sensor definition files and integrated modules (jar files) that arerequired in order to construct the dashboard.
Note
Do this after installing Interstage Business Process Manager Analytics and after restarting the operating system.
- 16 -

3.2.1.2.1 Registering definition files
Register definition files in Interstage Business Process Manager Analytics.
1. Deploy the template files for the PDB sensors of Interstage Business Process Manager Analytics.Copy the PDB directories stored at the following location in the Systemwalker Service Quality Coordinator Operation ManagementClient to the Dashboard Server environment, by directory:
Copy from
Storage location
<Install directory of the Operation Management Client>\dashboard\sensor\types\PDB
The default <Installation directory of the Operation Management Client> is "C:\Program Files\SystemwalkerSQC-C".
Note that the following files are stored in the PDB directory.
- agenttype.xml
- template.xml
- template_resource.properties
- template_resource_ja.properties
Copy to
Storage location
<Work area directory of the Interstage Business Process Manager Analytics>\tomcat6\webapps\ibpmm\conf\types
The default <Work area directory of the Interstage Business Process Manager Analytics> is "C:\ibpmm_data".
2. Deploy the log definition files for the PDB sensors of Interstage Business Process Manager Analytics.
Copy "BPMAS_PDB_Log4jConfiguration.xml" to the Dashboard Server environment.
Copy from
Storage location
<Install directory of the Operation Management Client>\dashboard\sensor\log\BPMAS_PDB_Log4jConfiguration.xml
The default <Installation directory of the Operation Management Client> is "C:\Program Files\SystemwalkerSQC-C".
Copy to
Storage location
<Work area directory of the Interstage Business Process Manager Analytics>\tomcat6\webapps\ibpmm\conf\log
The default of the <Work area directory of the Interstage Business Process Manager Analytics> is "C:\ibpmm_data".
3.2.1.2.2 Registering integrated modules (jar files)
Register integrated modules (jar files) in Interstage Business Process Manager Analytics.
- 17 -

Information
Refer to the following manual for details.
- "Integration Module Management" in the Interstage Business Process Manager Analytics Management Console Guide.
1. Using a Web browser, connect to the Interstage Business Process Manager Analytics Management Console.
From the Windows Start menu, click Interstage Business Process Manager Analytics >> Management Console, and then loginusing the administrator ID and password specified at installation.
2. Click Analytics System >> System Settings >>Integration Module Management.
3. Click the Browse button in Add JAR files(s)., and then specify the jar files stored below and click Add.
Storage location
<Install directory of the Operation Management Client>\dashboard\sensor\lib\pdb-sensor.jar
4. Stop the Built-in Application Server. Refer to the "A.3.2 Stopping the Built-in Application Server" for information on the stoppingprocedure.
5. Once the Built-in Application Server is stopped, restart the Built-in Application Server. Refer to the "A.3.1 Starting the Built-inApplication Server" for information on the starting procedure.
3.2.1.3 Creating the Built-in database and UsersThis section explains how to create a Built-in database and how to create users.
- 18 -
Note
Creating the Built-in database may take 60 minutes or more to complete.
Point
Database area of the Built-in database is 20GB for default. When changing the database area, edit the following file.
<Installation directory>\bpmm\dbscripts\symfoware\bpm-create-space-schema-symfo.sql
Edit part
CREATE DBSPACE EDBSPACE ALLOCATE FILE E:\ibpmmsym\space\EBPMSP01 ATTRIBUTE SPACE(20000M);
Edit "20000M" mentioned above edit part to the preferable size. Specify the value in MB unit.
1. Execute the following command to create Events DB and the database users:
<Installation directory>\bpmm\setup\builtinsetup.bat
Note: The default installation directory is "C:\ibpmm".
Point
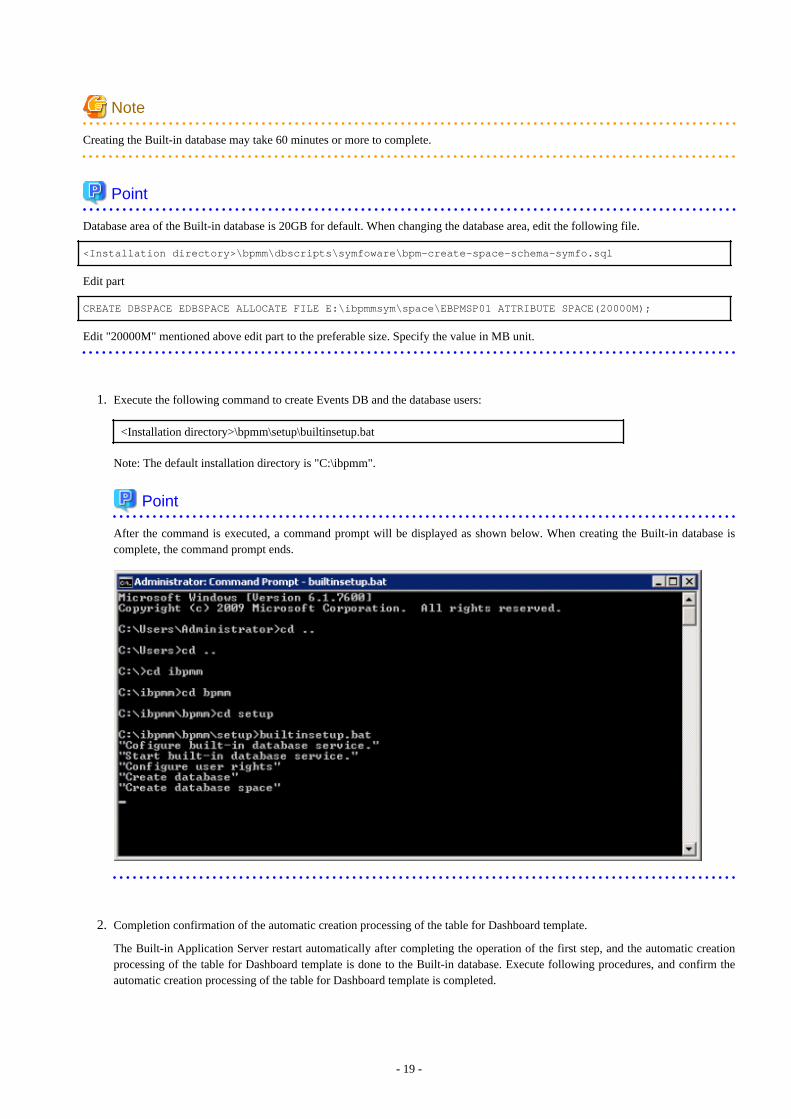
After the command is executed, a command prompt will be displayed as shown below. When creating the Built-in database iscomplete, the command prompt ends.
2. Completion confirmation of the automatic creation processing of the table for Dashboard template.
The Built-in Application Server restart automatically after completing the operation of the first step, and the automatic creationprocessing of the table for Dashboard template is done to the Built-in database. Execute following procedures, and confirm theautomatic creation processing of the table for Dashboard template is completed.
- 19 -

Note
Automatic creation processing of the table for Dashboard template may take 60 minutes or more to complete.
a. From the Windows Start menu, click Interstage Business Process Manager Analytics >> Management Console, andthen login using the administrator ID and password specified at installation.
b. Click Analytics System >> Sensor Management.
c. In the Sensor Status table, confirm the status of the Sensor Name <Host name> is "Running".
Point
When automatic creation processing of the table for Dashboard template has not been completed, following error message maydisplay on the bottom right of the screen. In that case, wait about tens of minutes, and then confirm it again.
ERROR BADM2405: Failed to get the State of the Sensor. (Details: BSDK2803: The error occurred while executing the request.(detail : BSDK2101: The sensor has not been initialized.))
3.2.1.4 Creating Dashboard UsersCreate dashboard users.
1. Using a Web browser, connect to Analytics Management Console of the Interstage Business Process Manager Analytics.
From the Windows Start menu, click Interstage Business Process Manager Analytics >> Management Console, and then loginusing the administrator ID and password specified at installation.
- 20 -

2. Click Analytics System >> System Settings >> User Management, and then select the User >> Create User tab.
Create users with the following two types of privileges:
- Users who can edit the dashboard using the Analytics Studio
- Users who can only view the dashboard
Set the following items:
Parameter Description
User ID Specify the ID of the user who will use thedashboard.
The character length and character types that canbe specified are as follows:
- Character length: Up to 64 characters
- Character type: Alphanumeric charactersand symbols except for the following:
< > : | * ? / |
Point
A user cannot be created with a user ID of "bpm","sqc", or the administrator ID specified atinstallation.
User name Specify the user name of the user who will usethe dashboard.
- 21 -

E-mail address Specify the email address of the user who will usethe dashboard. Optional.
Password Specify the login password of the user who willuse the dashboard.
The character length and character types that canbe specified are as follows:
- Character length: Up to 64 characters
- Character type: Alphanumeric charactersand symbols
Assigned Groups Specify the group to which the user belongs andset the privileges of the user.
- For a user who can edit the dashboard.
Set "Dashboard Power User" and "StudioSuper User".
- For a user who can only view the dashboard.
Set "Dashboard User".
Description Specify a description of the user. Optional.
Example 1: User who can edit the dashboard using the Analytic Studio
Parameter Description
User ID sqcadmin
User name sqcadmin
E-mail address
Password <Any password>
Assigned Groups Select the following:
Dashboard Power User
Studio Super User
Description
Example 2: User who can only view the dashboard
Parameter Description
User ID sqcuser
User name sqcuser
E-mail address
Password <Any password>
Assigned Groups Select the following:
Dashboard User
Description
3. Click the Create button.
- 22 -

3.2.1.5 Setting of the IP address of the connection target ManagerWhen the Dashboard Server and the Systemwalker Service Quality Coordinator Manager are constructed on different servers, setting ofthe IP address of the connection target Manager is required.
Point
Do not need to do this process if the Dashboard Server and the Systemwalker Service Quality Coordinator Manager are constructed onthe same server.
1. Using a Web browser, connect to the Interstage Business Process Manager Analytics Management Console.
From the Windows Start menu, click Interstage Business Process Manager Analytics >> Management Console, and then loginusing the administrator ID and password specified at installation
2. Click Analytics System >> Sensor Management >> <Host Name>, and then select [01:Summary_ECO]
Note
When the status of the [01:Summary_ECO] is "Running", select the checkbox on the left side of the Connection Name([01:Summary_ECO]) of the [Connection Status], click [Stop] button to stop.
3. Specify the host name of the Manager or the IP address to the textbox of the "PDB"Connection specific parameters >>PDBSensorConf >> SQCManagerHostName.
4. Click Modify button.
5. Select the checkbox on the left side of the Connection Name [01:Summary_ECO] of the Connection Status, and then click Startbutton.
6. Do the same steps 1 to 5 explained above for the Connection Name [06:VMwareESX/ESXi].
3.2.1.6 Confirm the Start of the Dashboard ServerRefer to "A.1.1 Starting the Dashboard Server" for information on starting the Dashboard Server, and confirm that the BPM AnalyticsServer has started. If the dashboard is stopped, start the dashboard.
3.2.1.7 Opening of dashboard template to the usersWork to open the view profile of the dashboard template to the users who was created at the "3.2.1.4 Creating Dashboard Users".
Refer to the "4.1.2.1 Releasing the Dashboard Templates Using the Analytic Studio" for the open procedure.
Point
View profiles which is applied as dashboard group at the "4.1.2.1 Releasing the Dashboard Templates Using the Analytic Studio" are asfollows.
- SQC Dashboard
- Virtualized Dashboard
- 23 -

3.3 Deleting the Dashboard Server EnvironmentThis section explains how to delete the Dashboard Server environment.
Point
Regarding the uninstallation of redistributable packages:
If the Dashboard Server is installed on a system that does not have the following redistributable packages already installed, then these willbe automatically installed:
- Microsoft Visual C++ 2005 Redistributable
- Microsoft Visual C++ 2005 Redistributable (x64) - When installed on a Windows x64 machine
When the Dashboard Server environment is deleted, these packages will not be automatically uninstalled.
1. Deleting Interstage Business Process Manager Analytics
In the Control Panel >> Programs and Features list, select Interstage Business Process Manager Analytics and click Uninstall.
Point
Before deletion, the confirmation message shown below will be displayed. After confirming that the required files do not exist inthe work area directory, click Yes.
2. Deleting the Built-in database (Symfoware)
a. Stop the following service:
- SymfoWARE RDB BPMA
- SymfoWARE RDA BPMA
b. From the Control Panel >> Programs and Features list, delete following program, and restart the system.
- Symfoware Server Client
Point
After deletion, the message shown below may be displayed. According to the message details, confirm whether theassembly exists and, if it does, uninstall it.
- 24 -

c. From the Control Panel >> Programs and Features list, delete following program, and restart the system.
- Symfoware Server Enterprise Edition
Note
Delete the following directories if they remain after uninstallation is executed:
- Installation directories of Interstage Business Process Manager Analytics
For example:
C:\ibpmm\bpme
C:\ibpmm\bpmm
C:\jdk60
- Symfoware program directories
For example:
C:\ibpmm\SFWCLNT
C:\ibpmm\SFWSV
C:\ibpmm\SFWETC
C:\Windows\ESQL
- Storage directory of the database space
For example:
C:ibpmmsym
- 25 -

Chapter 4 OperationThis chapter explains how to customize Systemwalker Service Quality Coordinator dashboard templates using the Analytics Studio andhow to change settings when operating the dashboard.
4.1 Systemwalker Service Quality Coordinator DashboardTemplates
This section gives an overview of Systemwalker Service Quality Coordinator dashboard templates and explains how to customize them.
4.1.1 OverviewThe Systemwalker Service Quality Coordinator dashboard templates provide views that allow you to monitor the following information:
- SQC_Dashboard
This view is used to monitor resource information, power consumption, and machine temperatures. The following templates areprovided:
- Resource_Dashboard
- Green_Dashboard
- Virtualization_Dashboard
This view is used to monitor the resources of virtual host and guest servers. The following template is provided:
- VMware
SQC_Dashboard - Resource_Dashboard
This view is used to monitor resource information (CPU, memory, and disk).
- 26 -

Graph title Displayed data Display
periodRemarks
CPU usage rate Record name: SUM_PROCField name: totproc
2 hours Displayed for eachsystem name
Free memory Record name: SUM_MEMField name: freemem
2 hours Displayed for eachsystem name
Read/Write service time Record name: SUM_DISKField name: dsksrvctim
2 hours Displayed for eachsystem name
Note
When you display in a line graph information that has been collected at different intervals from different agents (for example informationfrom a server with an Agent installed and information from a server being monitored by an agent for Agentless monitoring), the linefor the agent with the larger collection interval will be corrupted.
If you need to display information in a graph from agents that have different collection intervals, use the plot calibration function foundin the Analytics Studio under Chart >> <Name> >> Options, and set the plotting interval so that it matches the largest collectioninterval.
For example, for SUM_PROC_totproc prepared as a template:
Agent for Agent-based Monitoring: 1-minute intervals
Agent for Agentless Monitoring: 5-minute intervals
Displayed period: 2 hours
For the above conditions, set the "Max number of plots for category " in "Control Plot Volume " to 24.
- 27 -

SQC_Dashboard - Green_Dashboard
This view is used to monitor power consumption and machine temperatures.
Graph title Displayed data Display
periodRemarks
Electric power at moment(Total)
Record name: ECO_POWERField name: power
Latest value Sum total of the wholesystemMaximum: 5000(default) (*)
Electric power at moment Record name: ECO_POWERField name: power
2 hours Displayed for eachresource ID
Temperature at moment Record name:ECO_TEMPERATUREField name: temperature
2 hours Displayed for eachresource ID
*: Changes to match the operating environment.
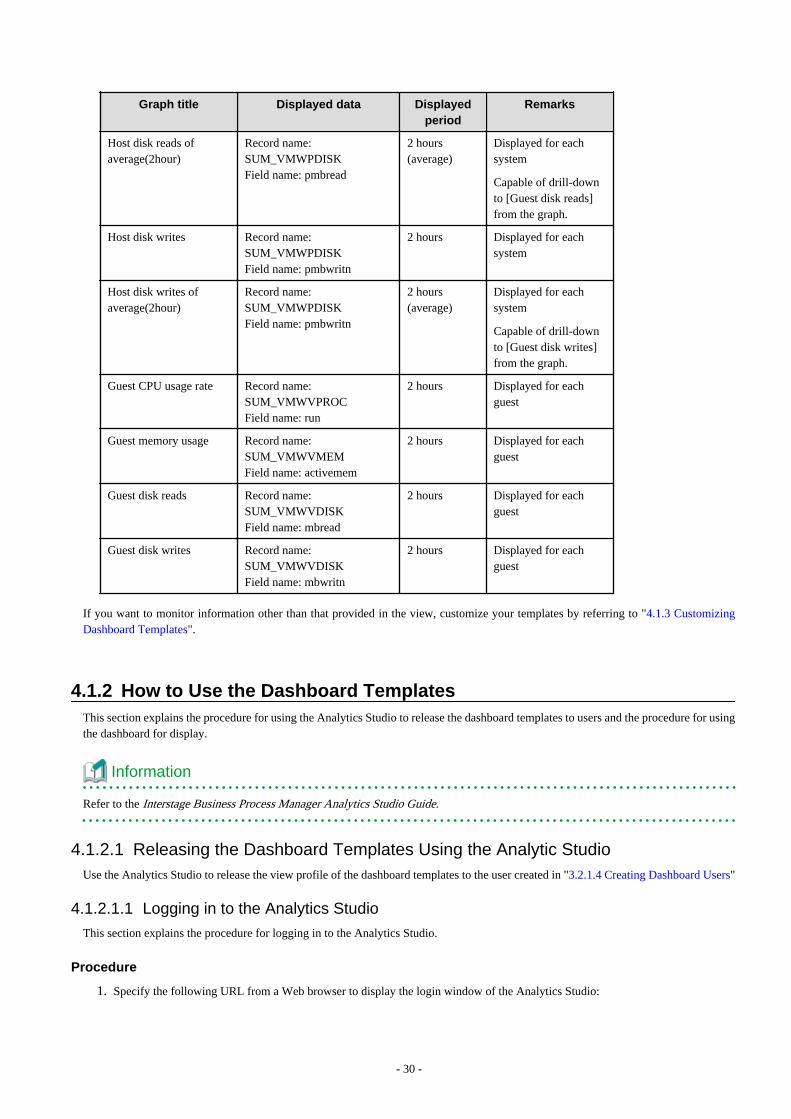
Virtualization_Dashboard - VMware
Sample of the view used to monitor the server resources of VMware host and guest servers.
- 28 -

Graph title Displayed data Displayed
periodRemarks
Host CPU usage rate Record name:SUM_VMWPPROCField name: pctottime
2 hours Displayed for eachsystem
Host CPU usage rate ofaverage(2hour)
Record name:SUM_VMWPPROCField name: pctottime
2 hours(average)
Displayed for eachsystem
Capable of drill-downto [Guest CPU usagerate] from the graph.
Host free memory Record name:SUM_VMWPMEMField name: pmfree
2 hours Displayed for eachsystem
Host free memory ofaverage(2hour)
Record name:SUM_VMWPMEMField name: pmfree
2 hours(average)
Displayed for eachsystem
Capable of drill-downto [Guest memoryusage] from the graph.
Host disk reads Record name:SUM_VMWPDISKField name: pmbread
2 hours Displayed for eachsystem
- 29 -
Graph title Displayed data Displayedperiod
Remarks
Host disk reads ofaverage(2hour)
Record name:SUM_VMWPDISKField name: pmbread
2 hours(average)
Displayed for eachsystem
Capable of drill-downto [Guest disk reads]from the graph.
Host disk writes Record name:SUM_VMWPDISKField name: pmbwritn
2 hours Displayed for eachsystem
Host disk writes ofaverage(2hour)
Record name:SUM_VMWPDISKField name: pmbwritn
2 hours(average)
Displayed for eachsystem
Capable of drill-downto [Guest disk writes]from the graph.
Guest CPU usage rate Record name:SUM_VMWVPROCField name: run
2 hours Displayed for eachguest
Guest memory usage Record name:SUM_VMWVMEMField name: activemem
2 hours Displayed for eachguest
Guest disk reads Record name:SUM_VMWVDISKField name: mbread
2 hours Displayed for eachguest
Guest disk writes Record name:SUM_VMWVDISKField name: mbwritn
2 hours Displayed for eachguest
If you want to monitor information other than that provided in the view, customize your templates by referring to "4.1.3 CustomizingDashboard Templates".
4.1.2 How to Use the Dashboard TemplatesThis section explains the procedure for using the Analytics Studio to release the dashboard templates to users and the procedure for usingthe dashboard for display.
Information
Refer to the Interstage Business Process Manager Analytics Studio Guide.
4.1.2.1 Releasing the Dashboard Templates Using the Analytic StudioUse the Analytics Studio to release the view profile of the dashboard templates to the user created in "3.2.1.4 Creating Dashboard Users"
4.1.2.1.1 Logging in to the Analytics Studio
This section explains the procedure for logging in to the Analytics Studio.
Procedure
1. Specify the following URL from a Web browser to display the login window of the Analytics Studio:
- 30 -
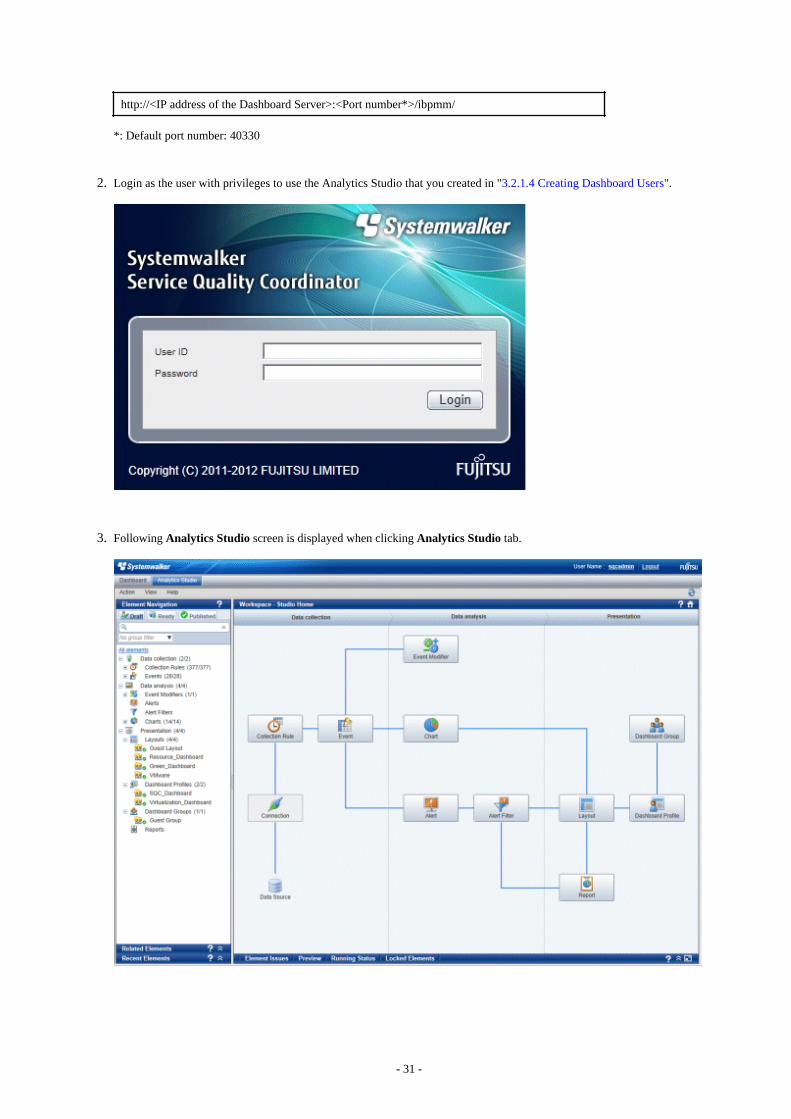
http://<IP address of the Dashboard Server>:<Port number*>/ibpmm/
*: Default port number: 40330
2. Login as the user with privileges to use the Analytics Studio that you created in "3.2.1.4 Creating Dashboard Users".
3. Following Analytics Studio screen is displayed when clicking Analytics Studio tab.
- 31 -

4.1.2.1.2 Creating a dashboard group
This section explains the procedure for grouping the dashboard users (into Dashboard Groups) to allocate the view profile for the dashboardtemplates provided.
Procedure
1. From the menu bar, click Action >> New >> Dashboard Group in that order to display the dialog box for creating the dashboardgroup.
2. In the Create Dashboard Group, enter the name of the group you want to create. Entry is mandatory.
Note
Use a unique and meaningful name as the dashboard group name. Any characters, numerics, and spaces can be used in the name.Up to 64 characters can be entered.
3. Click the Next button to proceed with the definition.
4. In the Overview Layout, specify Guest Layout.
5. Click the Next button to proceed with the definition.
6. Select the users you want to allocate to the dashboard group. From the Available box, select the user created in "3.2.1.4 CreatingDashboard Users" and then click the arrow button to add the user to the Selected box.
7. Apply a view profile to the dashboard group. From the Available box, select SQC_Dashboard and Virtualization_Dashboard andthen click the arrow button to add the view profile to the Selected. This determines which information the user will be able to viewfrom the dashboard.
- 32 -

8. Click the Next button to proceed with the definition.
9. Clear the Edit Chart and the Update Alert status checkbox selections.
10. Click the Finish button to create the dashboard group. The dashboard group that is created will be displayed under the dashboardgroups in the Element Navigation space.
4.1.2.1.3 Waiting for release of the dashboard group
In order to receive a review of the dashboard group details, you must apply the Ready. This section explains the procedure for applyingthe Ready to the dashboard group.
Procedure
1. Select the created dashboard group from the Dashboard Groups in the Element Navigation space.
2. Click the Share button in the Workspace-Editor. When sharing is completed, the message "Share successful" will be displayed.
3. Click OK to close the dialog box.
4. Click the Ready button in the Workspace-Editor. When you do so, a dialog box confirming that you want to wait for release willbe displayed.
5. Click Yes to wait for release of the dashboard group. The message "Ready successful" will be displayed.
6. Click OK to close the dialog box.
4.1.2.1.4 Releasing the dashboard group
This section explains the procedure for publishing the dashboard group. By publishing, you will be able to use the dashboard for display.
Procedure
1. Select the Ready tab in the Element Navigation space.
2. Select the dashboard group you want to release to confirm the definition. If the definition is incorrect, you can click the Reject toreject it.
3. If the definition is correct, select the Block based on Guest Group in the Element Navigation space.
4. Click the Publish All Elements to release the definition. When you do so, a dialog box confirming that you want to release thedefinition will be displayed.
5. Click Yes to release the definition. The message "Publish successful" will be displayed.
- 33 -

6. Click OK to close the dialog box.
Note
Log out once and log in again to display the Dashboard after executing "Publishing" procedure.
4.1.2.2 Displaying the Dashboard
4.1.2.2.1 Logging in to the Dashboard
This section explains the procedure for logging in to the dashboard.
Procedure
1. Specify the following URL from a Web browser to display the login window of the Analytics Studio:
http://<IP address of the Dashboard Server>:<Port number*>/ibpmm/
*: Default port number: 40330
2. Login as the user with privileges to use the dashboard that you created in "3.2.1.4 Creating Dashboard Users".
SQC_Dashboard - Displaying the Resource_Dashboard
Select KPIs >> SQC_Dashboard >> Resource_Dashboard to display the dashboard with CPU, memory, and disk information.
SQC_Dashboard - Displaying the Green_Dashboard
Select KPIs >> SQC_Dashboard >> Green_Dashboard to display the dashboard with power consumption and temperatureinformation.
- 34 -

Virtualization_Dashboard - Displaying VMware
Select PKIs >> Virtualization_Dashboard >> WMware to display the dashboard with server resource information for VMware hostand guest servers.
Point
When there are a large number of legend items shown in one chart, not all legend items will be displayed. To see more legend items, eitherincrease the legend display area by dragging the center of the chart (circled in red in the diagram below), or maximize the whole chart.
4.1.3 Customizing Dashboard TemplatesUse the Analytics Studio to customize the Systemwalker Service Quality Coordinator dashboard templates.
Point
Refer to the Interstage Business Process Manager Analytics Studio Guide for information on how to use the Analytics Studio (for example,customizing charts and views).
Note
The connection information name "01:Summary_ECO" appears as an example in images throughout this chapter. However, the actualnames that appear on working windows will depend on the template used in each case.
4.1.3.1 Dashboard templatesThere are different dashboard templates for the different items that need to be managed.
The items to be monitored will have "Active" applied by default for the information required by the dashboard views mentioned in "4.1.1Overview" only.
To apply "Active" to items to be monitored that are not default items in template customization, refer to "4.1.3.4 Adding Information tobe Monitored to the Dashboard" and apply "Active" to the other items to be monitored, and then perform customization.
Connection
information nameInformation collected Remarks
01:Summary_ECO
ServerMonitor
ZoneMonitor/ZoneStackMonitor/ZoneStackMonitor(All)
- 35 -

Connectioninformation name
Information collected Remarks
The ECO folder/No data
02:Windows The Windows folder/Windows reports
03:Unix Solaris & Linux folder/UNIX reports Records with the Record ID"UX_xxx" are defined fromamongst the collectedinformation.
04:Linux Solaris & Linux folder/UNIX reports Records with the Record ID"LX_xxx" are defined fromamongst the collectedinformation.
05:AIX_HP_UX Solaris & Linux folder/UNIX reports Records with the Record ID"AX_xxx" and "HP_xxx" aredefined from amongst thecollected information.
06:VMWare ESX /ESXi)
Vmware(Virtual)StackMonitor
Vmware(Physical)Monitor
The Vmware folder/Vmware reports
07:Hyper-V HyperV(Virtual)StackMonitor
HyperV(Physical)Monitor
The Hyper-V folder/Hyper-V reports
08:Xen Xen(Virtual)StackMonitor
The Xen folder/Xen reports
24:VMwarevCenter
VMware(Cluster)Monitor
VMware(ResourcePool)Monitor
The VMware folder/vCenter reports
25:KVM KVM(Virtual)StackMonitor
The KVM folder/KVM reports
26:SolarisZone ZoneMonitor
The SolarisZone folder/Solaris Zonereports
09:Response_Service
UserResponseMonitor
ServiceAvailMonitor
WebTrnMonitor
The ResponseCondition folder/End userresponse reports
The ServiceCondition folder/HTTP/DNS/SMTP/PORT service reports
The WebTrn folder/Web transactionreports
10:Network TcpNetworkMonitor
No data/Systemwalker Network Managerreports
- 36 -

Connectioninformation name
Information collected Remarks
The TcpNetwork folder/TcpNetworkreport
11:Storagemonitor StorageMonitor
The StorageResource folder/Storagereports
12:Systemwalker OperationMgrMonitor
No data/CentricManager reports
The OperationMgr folder/OperationManager reports
13:Interstage(summary)
Interstage(EJB)Monitor
Interstage(TD)Monitor
Interstage(CORBA)Monitor
Interstage(IJServer)Monitor
TxnSyncMonitor
TxnAsyncMonitor
ISI SequenceMonitor
ISI QueueMonitor
14:Interstage(detail)
The Interstage folder/Interstage reports
The Interstage(TxnAnalysis)JavaEE & TheInterstage(TxnAnalysis) folder/no data
The TxnAnalysis(Sync) folder/no data
The TxnAnalysis(Async) folder/no data
ISI folder/ISI reports
15:SymfoWARE SymfowareMonitor
The Symfoware folder/Symfoware reports
16:Oracle OracleMonitor
The Oracle folder/Oracle reports
17:MS-SQL MS-SQL_Monitor
18:MS-NET MS-.NET_Monitor
The MS-.NET folder/MS-.NET reports
19:SAP SAP Monitor
The SAP folder/SAP reports
20:UserDataMonitor
UserDataMonitor
21:UserData UserData folder/Drilled-Down/ReportInformation (UDATA1 to 20)
23:OSResource No data/P2V simulation reports
27:ResourceOrchestrator
VMPoolMonitor
StoragePoolMonitor
NetworkPoolMonitor
- 37 -

Connectioninformation name
Information collected Remarks
ServerPoolMonitor
AddressPoolMonitor
Resource Orchestrator folder/Pool(predicted demand) reports
Note
Agent performance information that can be collected by the Dashboard Server is as follows:
- Summary data
- Resource data (10 minutes)
4.1.3.2 Setting Agents to be MonitoredBy setting the Agents to be monitored, only information from the specified Agents is transferred to the Dashboard Server. This preventsthe Dashboard Server from being overloaded with information.
Procedure
1. Using a Web browser, connect to Analytics Management Console of the Interstage Business Process Manager Analytics.
From the Windows Start menu, click Interstage Business Process Manager Analytics >> Management Console, and then loginusing the administrator ID and password specified at installation.
2. Click Analytics System>> Sensor Management >> <Host name> to display the Connection Status.
- 38 -

3. Click Connection Name >> 01:Summary_ECO.
Note
When changing the settings of the Agent to be monitored, execute after status of the connection information to be changed is stopped.
4. The Modify Connection screen for the 01:Summary_ECO will be displayed. In the PDBSensorConf>>TargetServerNameList*: text box, enter the system name of the Agents you want to monitor using the dashboard. To entermultiple Agents for monitoring, separate the server IP addresses using commas.
Note
- When changing the system name of the management target by using the -h option of the sqcSetPolicy (Policy ApplicationCommand), enter the changed system name.
- For agent for Agentless Monitoring, enter the value of DISPLAYNAME (or HOSTNAME if there is no DISPLAYNAME) inthe remote monitoring configuration file created by the Manager/Proxy Manager.
Point
By default, an asterisk is entered in the PDBSensorConf >> TargetServerNameList*: text box. This asterisk indicates that allperformance information from Agents that is stored in the PDB will be obtained.To specify the Agents from which you want to collect information, enter their host names or IP addresses (up to 43,644 alphanumericcharacters in length). Use the asterisk wildcard character to allow forward or backward matching to be performed on the host namesor IP addresses.Examples are shown below:
- 39 -

- Specify "Win*" to specify host names beginning with "Win".
- Specify "*dows" to specify host names ending with "dows".
- Specify "*ndo*" to specify host names that include "ndo".
- Specify "192.168.0.*" to specify Agents with IP addresses between "192.168.0.0" and "192.168.0.255".
5. Click the Modify button.
4.1.3.3 Changing the Data Collection Interval of the Dashboard ServerThis section explains how to change the collection interval for the monitored data that the Dashboard Server collects from the Manager.
Note
Do not change the data collection interval to one that is smaller than the default setting (10 minutes). Otherwise, the Dashboard Servermay become overloaded and unable to collect the data correctly.
Procedure
1. Login to the Analytics Studio.
2. From under Collection Rules in the Element Navigation space, select the event for which you want to change the data collectioninterval.
3. Select Condition_<event name> from the Collection Rules.
- 40 -

4. Click the Edit button.
The message "Edit successful" will be displayed.
5. Click the Timing tab.
6. In the collection interval column of Schedule, change the time to the collection interval you want.
7. Click the Save button in the Workspace-Editor.
8. Click the Share button in the Workspace-Editor.
When sharing is completed, the message "Share successful" will be displayed.
9. Click OK to close the dialog box.
10. Click the Ready button in the Workspace-Editor.
When you do so, a dialog box confirming that you want to wait for publishing will be displayed.
11. Click Yes to wait for release of the dashboard group.
The message "Ready successful" will be displayed.
12. Click OK to close the dialog box.
13. Select the Ready tab in the Element Navigation space.
14. Select the collection condition you want to publish to confirm the definition.
If the definition is correct, select Block based on <eventname> in the Element Navigation space.
If the definition is incorrect, you can click the Reject to reject it.
15. Click the Publish All Elements to publish the definition.
When you do so, a dialog box confirming that you want to publish the definition will be displayed.
16. Click Yes to publish the definition.
The message "Publish successful" will be displayed.
17. Click OK to close the dialog box.
4.1.3.4 Adding Information to be Monitored to the DashboardThe events listed below are activated as monitored items in the Systemwalker Service Quality Coordinator Dashboard template, andperformance information for them is transferred from the Manager to the Dashboard Server.
Event name Remarks
PDB_M_SUM_PROC Monitor information (CPU)
PDB_M_SUM_MEM Monitor information (Memory)
PDB_M_SUM_DISK Monitor information (Disk)
PDB_M_SUM_ZONE Monitor information (ZONE)
PDB_D_ECO_POWER Power consumption
PDB_D_ECO_TEMPERATURE Temperature
PDB_M_SUM_VMWVPROC Monitor information (VMwarevirtual machine CPU)
PDB_M_SUM_VMWVMEM Monitor information (VMwarevirtual machine memory)
PDB_M_SUM_VMWVDISK Monitor information (VMwarevirtual machine disk)
PDB_M_SUM_VMWPPROC Monitor information (VMwarevirtual host CPU)
- 41 -

Event name Remarks
PDB_M_SUM_VMWPMEM Monitor information (VMwarevirtual host memory)
PDB_M_SUM_VMWPDISK Monitor information (VMwarevirtual host disk)
To add other events as monitored items, refer to "4.1.3.1 Dashboard templates". After applying the required template, perform the procedurebelow.
Note
- When you want to add an event as a monitored item or apply a new dashboard template, you must go to Sensor Management in theInterstage Business Process Manager Analytics Management Console and stop all connection information instances with theConnection Type "PDB". Adding a monitored item or uploading and applying a template while these instances are running can takea great deal of time.
Procedure
1. Use Analytics Studio to enable an event to be monitored.
1. Login to the Analytics Studio.
2. From under Collection Rules of the Data collection in the Element Navigation space, select the event for which you wantto activate the information to be monitored.
3. Select Condition_<event name> from the Collection Rules.
4. Click the Edit Button in the Workspace-Editor.
The message "Edit successful" will be displayed.
5. Click the Activate button in the Workspace-Editor.
6. Click the Save button in the Workspace-Editor.
7. Click the Share button in the Workspace-Editor.
When sharing is completed, the message "Share successful" will be displayed.
8. Click OK to close the dialog box.
9. Click the Ready button in the Workspace-Editor. When you do so, a dialog box confirming that you want to wait for releasewill be displayed.
10. Click Yes to wait for release of the dashboard group. The message "Ready successful" will be displayed.
11. Click OK to close the dialog box.
12. Select the Ready tab in the Element Navigation space.
Click All blocks when Condition_<eventname> is not displayed on the Ready.
13. Select the collection condition you want to publish to confirm the definition. If the definition is incorrect, you can click theReject to reject it.If the definition is correct, select Condition_<eventname> in the Element Navigation space.
14. Click the Publish All Elements to publish the definition.
When you do so, a dialog box confirming that you want to publish the definition will be displayed.
15. Click Yes to publish the definition.
The message "Publish successful" will be displayed.
16. Click OK to close the dialog box.
- 42 -

2. Use Analytics Management Console of the Interstage Business Process Manager Analytics to start the sensors.
1. Using a Web browser, connect to Analytics Management Console of the Interstage Business Process Manager Analytics.
2. From the Windows Start menu, click Interstage Business Process Manager Analytics >> Management Console, andthen login using the administrator ID and password specified at installation.
3. Click Analytics System >> Sensor Management >> <Host name> to display the Connection Status.
4. Select the checkbox for the connection information name of the monitored item, and then click Start.
5. After confirming that the Status column has changed from Stopped to Running, click Logout.
Point
To stop event information that does not need to be monitored from being transferred to the Dashboard Server clear the Active checkbox.
4.1.3.5 Account ManagementUse account management to define access privileges to the dashboard.
Refer to "3.2.1.4 Creating Dashboard Users" to create a user.
Refer to the Interstage Business Process Manager Analytics Studio Guide for details.
4.2 Event FormatThis section explains the composition of event names and event attributes defined by dashboard templates.
4.2.1 Event NameThis section explains the relationship between the event names defined in the dashboard templates and the Record IDs described in "DataFormats" in the Systemwalker Service Quality Coordinator Reference Guide.
4.2.1.1 Summary InformationRecord IDs of the summary information types described in "Summary Information" in the Systemwalker Service Quality CoordinatorReference Guide that have the prefix "PDB_M" added to the front of their names become the event names of the summary information.
Example: For ServerMonitor
Record ID Event name
SUM_PROC PDB_M_SUM_PROC
SUM_MEM PDB_M_SUM_MEM
SUM_DISK PDB_M_SUM_DISK
- 43 -

4.2.1.2 Drilled-Down/Report InformationRecord IDs of the drilled-down/report information types described in "Drilled-Down / Report Information" in the Systemwalker ServiceQuality Coordinator Reference Guide that have the prefix "PDB_D" added to the front of their names become the event names of thedrilled-down/report information.
Example: For Windows folder/Windows reports
Record ID Event name
WIN_DISKSPACE PDB_D_WIN_DISKSPACE
WIN_PROCESS PDB_D_WIN_PROCESS
WIN_LOGDISKBUSY PDB_D_WIN_LOGDISKBUSY
WIN_PHYDISKBUSY PDB_D_WIN_PHYDISKBUSY
WIN_MEMORY PDB_D_WIN_MEMORY
WIN_PAGEFILE PDB_D_WIN_PAGEFILE
WIN_CPUBUSY PDB_D_WIN_CPUBUSY
WIN_NET_INTERFACE PDB_D_WIN_NET_INTERFACE
WIN_NET_SYSTEM PDB_D_WIN_NET_SYSTEM
WIN_SYSTEM PDB_D_WIN_SYSTEM
4.2.2 Event AttributesThis section explains event attributes in events defined by dashboard templates.The following table shows the header information of the attributes of each event:
Event attribute name Description
SYSTEM_NAME System name
RECORD_ID Record ID
RESOURCE_ID Resource ID
START_DATE_TIME GMT (Greenwich mean time)
END_DATE_TIME GMT (Greenwich mean time)
CONSOL_FLAG 0 to 3
- 0: Summary data
- 1: 10 minute data
- 2: 1 hour data
- 3: 1 day data
CONSOL_INTERVAL Collection interval (seconds)
Along with the above attributes, the performance information for the events is also defined as an event attribute.
Performance information definition names are the fully capitalized "Field Names" of the record formats described in "Data Formats" inthe Systemwalker Service Quality Coordinator Reference Guide.
- 44 -

4.3 Changing the IP Addresses of Connected ManagersTo change the IP address of the Systemwalker Service Quality Coordinator Manager connected to the Dashboard Server, perform theprocedure shown below on the Dashboard Server:
Procedure
1. Using a Web browser, connect to Analytics Management Console of the Interstage Business Process Manager Analytics.
From the Windows Start menu, click Interstage Business Process Manager Analytics >> Management Console, and then loginusing the administrator ID and password specified at installation.
2. Click Analytics System >> Sensor Management >> <Host name> to display the Connection Status.
3. Click Connection Name >> 01:Summary_ECO.
Note
When changing the IP address of the Manager to connect, execute after the status of the connection information to be changed isstopped.
4. The Modify Connection screen for the connection information of 01:Summary_ECO will be displayed. Change the IP addressesof the connected Managers in the SQCManagerHostName* of PDBSensorConf.
5. Click the Modify.
4.4 Setting Dashboard Server Data Retention PeriodsThis section explains how to set the retention periods for monitored data that the Dashboard Server collects from the Manager.
Information
Refer to the Interstage Business Process Manager Analytics Studio Guide.
Note
If you do not do set a data retention period, data will remain undeleted on the Dashboard Server. Always set a retention period for eachmonitored item.
1. Select System Settings >> Data Migration from the Analytics Management Console of Interstage BPM-A.
2. Set the following in the Create an Archive Rule tab:
- Migration Definition Name: Any
- Migration Type: Delete from Events DB
- Migration Target: Specify the event at which the retention period will begin
- Range for leaving Events DB: Set the length of time that the data is to be retained before being deleted
3. Click the Create button.
- 45 -

4. Confirm that the following message is displayed on the message column on the bottom of the screen.
INFO BADM0573: Created the Archive Rule. (Value: <Migration Definition Name>)
4.5 Backup and Restore of the Dashboard Server EnvironmentThis section explains the backup and restoration of the Dashboard Server environment, which is useful when the environment needs to betransferred or restored.
4.5.1 Backup and Restore of Interstage Business Process ManagerAnalytics/Symfoware Server
Perform backup and restoration by referring to the manual shown below for details. Note that a backed up Interstage BPM Analyticsenvironment can only be restored onto an environment with the same system configuration. This means that components, (such as thedatabase product used for the event management database and the placement of sensors), must be the same on the machine where InterstageBPM Analytics will be restored as on the machine where the backup was made.
Information
Refer to "Maintaining" in the Interstage Business Process Manager Analytics Administration Guide
Note
The Dashboard Server in this manual corresponds to the Analytics Server in the Administrator Guide mentioned above.
In addition, because Symfoware Server is being used in the event management database in the Dashboard Server, refer to the followingmanual for information on performing backup and restoration of the database:
Information
Refer to " Maintaining the Built-in Database" in the Interstage Business Process Manager Analytics Administration Guide.
- 46 -

Appendix A Starting and StoppingThis appendix describes how to start and stop the Dashboard Server, the Built-in database, and the Built-in Application Server.
A.1 Starting and Stopping the Dashboard Server
A.1.1 Starting the Dashboard ServerUse the procedure shown below to start the dashboard:
1. Connect to Analytics Management Console of the Interstage Business Process Manager Analytics.
Use a Web browser to connect to the Management Console.
From the Windows Start menu, click Interstage Business Process Manager Analytics >> Management Console, and then login.
2. Select Analytics System >> Server Management >> BPM Analytics Server >> Server Status, and then click the Start buttonto start the Interstage Business Process Manager Analytics Server.
A.1.2 Stopping the Dashboard Server1. Use the procedure shown below to stop the dashboard:
2. Connect to Analytics Management Console of the Interstage Business Process Manager Analytics.
Use a Web browser to connect to the Analytics Management Console.
From the Windows Start menu, click Interstage Business Process Manager Analytics >> Management Console, and then login.
- 47 -

3. Select Analytics System >> Server Management >> BPM Analytics Server >> Server Status, and then click the Stop buttonto stop Interstage Business Process Manager Analytics Server.
A.2 Starting and Stopping the Built-in database
A.2.1 Starting the Built-in databaseTo start the Built-in database used by the Dashboard Server, start the following services:
- SymfoWARE RDA BPMA
- SymfoWARE RDB BPMA
A.2.2 Stopping the Built-in databaseTo stop the Built-in database used by the Dashboard Server, stop the following services:
- SymfoWARE RDA BPMA
- SymfoWARE RDB BPMA
A.3 Starting and Stopping the Built-in Application Server
A.3.1 Starting the Built-in Application Server1. Select Start >> All Programs >> Interstage Business Process Manager Analytics >> Configure Server.
- 48 -

2. In the General tab of the Interstage BPM Analytics Server Properties window, click the Start button.
A.3.2 Stopping the Built-in Application Server1. Select Start >> All Programs >> Interstage Business Process Manager Analytics >> Configure Server.
2. In the General tab of the Interstage BPM Analytics Server Properties window, click the Stop button.
- 49 -

Appendix B MigrationThis appendix describes the procedure of migration from the Dashboard Server of the Systemwalker Service Quality Coordinator V13.5to the Dashboard Server of the Systemwalker Service Quality Coordinator V15.0.
B.1 Advance PreparationThis section describes about the advance preparation which required to be done on the Dashboard Server of the Systemwalker ServiceQuality Coordinator V13.5 in order to do the migration
B.1.1 Changing settings of connection informationTo prevent the connection information from operating immediately after the migration, change all definitions which method of startingthe connection information is automatic start to manual start by using Analytics Studio of Interstage Business Process Manager Analytics.
Change the following connection information that are set to the automatic start by default in Systemwalker Service Quality CoordinatorV13.5 to a manual start.
- 01:Summary_ECO
- 06:Virtualization Server(VMWare)
In addition, change the method to manual start if connection information other than above has been customized to automatic start.
B.1.2 Changing Parameters of the DatabaseExecute following two setting in order to use the Database of the Dashboard Server which was used with the Systemwalker Service QualityCoordinator V13.5 continuously with the Systemwalker Service Quality Coordinator V15.0.
- Increase the size of the RDB dictionary
- Prevent the database space used up
Increase the size of the RDB dictionary
Increase the size of the RDB dictionary to 1GB by executing following procedure.
1. Stop the Application Server of the Dashboard Server.
2. Make a backup of RDB dictionary in case of abnormal termination of the capacity allocation. (When Symfoware Server is installedwith default, following command is stored under "<System Drive>:\SFWSV\RDB\BIN".)
a. Start command prompt, and set system name.
set RDBNAME=SWSQC
b. Execute following command, and set the update control to RDB dictionary.
rdbrtr -z -rw
c. Execute following command, and save the RDB dictionary.
rdbdmpdic -N -f dicback@<Directory to save> -e -y
d. Execute following command, and release the update control of RDB dictionary
rdbrls -z -rw
- 50 -

3. Execute to increase the size.
a. Execute following command, and stop the RDB system.
rdbstop -mwc
b. Execute following expansion command. (Default value of the RDB dictionary "<System Drive>:\SWFD\RDB\USR\DIC")
rdbaldic -a 20M -e -f <Directory of the RDB dictionary>/DICTIONARY2 -c 2048M
c. Execute following command, and start the RDB system.
rdbstart
4. Execute to allocate additional capacity.
a. Execute following command, and confirm the usage status of the RDB dictionary. When the Maximum value of the outputresult is less than 50%, procedure to allocate additional capacity is end.
rdbprdic
b. Stop Symfoware RDB system
c. Execute following command, and allocate additional capacity. Set the additional capacity with less than 50% of maximumvalue of rdbprdic.
rdbaldic -a <additional capacity>
d. Start Symfoware RDB System.
Prevent the database space used up
At the first time, Dashboard Server of the Systemwalker Service Quality Coordinator V15.0 uses about 7GB for table space of database.
Correspond as follows according to existing remained capacity.
- Less than 5GB : Create new database space
- 5GB - 7GB : Change the parameter of the default size
Confirm method of the remainder capacity in table space
Confirm as follows by using command prompt.
C:>set RDBNAME=SWSQC
C:>rdbspcinf -d EVENT
Database space : EVENTSPACE
Device : E:\INSTROOT\SWFD\RDB\USR\EVENT
Size : 20480000K
Static allocate size
total : 10000000K
Dynamic allocate size
total : 240000K
Free size
total : 10240000K
qdg12074i:rdbspcinf was normally terminated. Return code 00 (SYSTEMNAME =SWSQC )
In above case, remaining capacity (Free size) is about 10GB.
Remaining capacity is less than 5GB
When remaining capacity is less than 5GB, creating a new database space with more than 20GB is required before starting migration.Set a new database space as Events DB from Analytics Management Console of the Interstage Business Process Manager Analytics.
- 51 -

Remaining capacity is 5GB - 7GB
When remaining capacity is 5GB - 7GB, execute following procedure.
1. Change the parameter for table creation from Analytics Management Console of the Interstage Business Process ManagementAnalytics.
2. Change the following parameters under Analytics System >> System Settings >> Database Management >> Events DB >>JDBC Connection URL.
- CLI_DEFAULT_TABLE_SIZE=(8,256,25600,128)
- CLI_DEFAULT_INDEX_SIZE=(2,2,256,2560,128)
Example
jdbc:symford://XXX.XXX.XXX.XXX:23451/
EVENT;schema=EVENTSCHEMA;ctuneparam='CLI_MAX_SQL=(512);CLI_DEFAULT_TABLE_SIZE=(8,256,25600,128);CL
I_DEFAULT_INDEX_SIZE=(2,2,256,256,2560,128)'
B.1.3 Backup ResourcesBackup following information of the Dashboard Server.
- Setting file of Analytics Server
- Work space directory
- Event storage database (for restoration)
Refer to the "Backing Up the Interstage BPM Analytics Server environment" of the Interstage Business Process Manager Analytics V11.0Administration Guide for backup procedure.
Information
Backup resource of the database do not use directly at the migration. This procedure is in case of unforeseen problem happens at migration.
B.1.4 Uninstallation of the Interstage Business Process Manager AnalyticsUninstall the Interstage Business Process Manager Analytics. Refer to the manual of the version that installs the dashboard server for theuninstallation method.
Note
Event database will be used when migration, so do not delete after uninstallation.
B.2 Migration ProcedureThis section explains the migration procedure to the Dashboard Server of Systemwalker Service Quality Coordinator V15.0 after executingadvance preparation.
Note
Execute "B.1 Advance Preparation" is required when doing the migration.
B.2.1 Installation of the Interstage Business Process Manager AnalyticsV12
Install Interstage Business Process Manager Analytics V12 to the Dashboard Server.
- 52 -

Specify Interstage J2EE to the Application Server Type when specifying at the installation. Refer to "3.2.1.1 Interstage Business ProcessManager Analytics Installation" about the installation method.
B.2.2 Stopping the work unitStop the work unit (IBPMMServer) of the Dashboard Serer by using Interstage Management Console.
B.2.3 Replacement of configuration fileThe file in the backup resource which acquired at "B.1.3 Backup Resources" replace with the file for Dashboard Server of the SystemwalkerService Quality Coordinator V15.0.
The file for replacement is stored under the following installation directory of the Operation Management Client of Systemwalker ServiceQuality Coordinator V15.0.
File for replacement : <Operation Management Client Installation Directory>\dashboard\sensor\lib\pdb-sensor.jar
Replacement destination : <Work Space Directory (ibpmm_data)>\davroot\libFiles\pdb-sensor.jar
Files for replacement : Following files under the <Operation Management Client Installation Directory>\dashboard\sensor\types\PDBdirectory
- template.xml
- template_resource.properties
- template_resource_ja.properties
Replacement destination : <Conf directory of the Analytics Server Setting File>\types\PDB
B.2.4 Executing Migration CommandExecute migration command by referring following procedure.
1. Take out the following migration file under DVD of the Systemwalker Service Quality Coordinator Enterprise Edition V15.0, andstore in the Dashboard Server.
<DVD Drive>:\unified\bpma\Util\BPMMigrationUtil.zip
Point
The file mentioned above is store in the following place of the DVD for UNIX versions.
<DVD Drive>:\client\unified\bpma\Util\BPMMigrationUtil.zip
2. Unzip BPMMigrationUtil.zip file
3. After unzip, execute following command.
<Unzip destination>\bin\bpmmigrate2v12 -i <WorkDirectory> -M <DeployedDirectory> -p
<AdminPassword> -c <ConfDirectory> -a <AgentDirectory>
Option/Parameter Explanation
- -i <WorkDirectory>
Specify the path of the work space backed up from V11.1
- -M <DeployedDirectory>
Specify the following directory path to the <DeployedDirectory>.
<Interstage Installation Directory>\J2EE\var\deployment\ijserver\IBPMMServer\apps\ibpmm.war
- 53 -

- -p <AdminPassword>
Specify the password of the superuser which has been set when BPMAV12 installed.
- -c <ConfDirectory>
Specify the path of deployed destination of the conf directory which was backed up from V11.1.
- -a <AgentDirectory>
Specify the path of deployed destination of the Agent directory which was backed up from V11.1.
Example
> bpmmigrate2v12 -i C:\BPMBackup\ibpm_data -M C:\Interstage\J2EE\var\deployment\ijserver\IBPMMServer
\apps\ibpmm.war -p XXX -c C:\BPMBackup\conf -a C:\BPMBackup\agent
BUPG0001=Starting migration.
BUPG0003=Starting repository conversion. (Path:C:\BPMBackup\ibpmm_data)
BUPG0004=The repository conversion is complete.
BUPG0011=Starting conf directory conversion. (Path:C:\BPMBackup\conf)
BUPG0012=The conf directory conversion is complete.
BUPG0007=Starting agent directory conversion. (Path:C:\BPMBackup\agent)
BUPG0008=The agent directory conversion is complete.
BUPG0015=Starting DB structure conversion. (DB type:EVENTDB)
BUPG0016=The DB structure conversion is complete.
BUPG0005=Applying the converted repository to the system.
BUPG0006=The converted repository has been applied to the system.
BUPG0009=Applying the converted agent directory to the system.
BUPG0010=The convertied agent directory has been applied to the system.
BUPG0013=Applying the converted conf directory to the system.
BUPG0014=The converted conf directory has been applied to the system.
BUPG0002=The migration is complete.
Note
Execute this command after starting the Symfoware RDB system when stops.
B.2.5 Starting Work UnitStart the work unit (IBPMMServer) by using Interstage Management Console of the Dashboard Server.
Note
After starting the work unit, update process for Database of the Dashboard Server is automatically started. Update process might takemore than 1 hour. Because of that, when selecting Analytics System >> Sensor Management >> <Host name> of Analytics ManagementConsole of the Interstage Business Process Manager Analytics, following message might display on the screen. In that case, wait for fewminutes, and confirm the sensor status of the <Host name> is Running.
ERROR BADM2405: Failed to get the State of the Sensor. (Details: BSDK2803: The error occurred while executing the request. (detail :BSDK2101: The sensor has not been initialized.))
- 54 -

B.2.6 Setting of Connection InformationSet the following value to the connection information by using Analytics Management Console of the Interstage Business Process ManagerAnalytics. Specify the IP address of Manager of connection destination to all connection information which is used by Dashboard
- SQCManagerHostName
Reset the connection information which was set to manual start at "B.1.1 Changing settings of connection information"
B.3 Points of ConcernThis section describes points of concern at the migration.
- Setting of the log which set before migration is not succeeded. Setting again is required when it is specified.
- The user that uses when the dashboard is displayed by using dashboard function of the Systemwalker Service Quality CoordinatorV13.5 and the user that uses Analytics Studio are integrated. If user with same ID existed in each system, Analytics Studio user isdeleted. Create Analytics Studio user again if necessary.
- When Dashboard server and Manager are constructed in different servers, refer to "4.3 Changing the IP Addresses of ConnectedManagers" and set the connection target.
- If "4.1.3.2 Setting Agents to be Monitored" on Dashboard Server has been executed and Agent to be monitored has been specified,specification method of Agent required to be changed from IP address to System Name of monitoring target. Refer to "4.1.3.2 SettingAgents to be Monitored" and change the setting of the Agent to be monitored to System Name.
B.3.1 About the data handling when executing migrationWhen executing migration, uniqueness guarantee function (Double registration prevention function of performance data) becomes invalid.
If accessing to the Database of Systemwalker Service Quality Coordinator V13.5 without executing the migration, uniqueness guaranteefunction automatically effective, and data which was operated on V13.5 is cleared.
- 55 -