Embed Size (px)
Citation preview
Infrastructure Access Report
Infrastructure: ECN Hydrodynamic and Ocean Engineering Tank
User-Project: INNWIND.EU
Floating Wind Turbine Model Test
INNWIND.EU
Floating Wind Turbine Model Test
(Phase 2, November 2014)
Marine Renewables Infrastructure Network
Status: Draft
Version: 01
Date: 4-December -2014
Infrastructure Access Report: INNWIND.EU
Rev. 01, 08-Oct-2014
Page 2 of 33
ABOUT MARINET MARINET (Marine Renewables Infrastructure Network for emerging Energy Technologies) is an EC-funded network
of research centres and organisations that are working together to accelerate the development of marine renewable
energy - wave, tidal & offshore-wind. The initiative is funded through the EC's Seventh Framework Programme (FP7)
and runs for four years until 2015. The network of 29 partners with 42 specialist marine research facilities is spread
across 11 EU countries and 1 International Cooperation Partner Country (Brazil).
MARINET offers periods of free-of-charge access to test facilities at a range of world-class research centres.
Companies and research groups can avail of this Transnational Access (TA) to test devices at any scale in areas such
as wave energy, tidal energy, offshore-wind energy and environmental data or to conduct tests on cross-cutting
areas such as power take-off systems, grid integration, materials or moorings. In total, over 700 weeks of access is
available to an estimated 300 projects and 800 external users, with at least four calls for access applications over the
4-year initiative.
MARINET partners are also working to implement common standards for testing in order to streamline the
development process, conducting research to improve testing capabilities across the network, providing training at
various facilities in the network in order to enhance personnel expertise and organising industry networking events
in order to facilitate partnerships and knowledge exchange.
The aim of the initiative is to streamline the capabilities of test infrastructures in order to enhance their impact and
accelerate the commercialisation of marine renewable energy. See www.fp7-marinet.eu for more details.
Partners
Ireland
University College Cork, HMRC (UCC_HMRC)
Coordinator
Sustainable Energy Authority of Ireland (SEAI_OEDU)
Denmark
Aalborg Universitet (AAU)
Danmarks Tekniske Universitet (RISOE)
France
Ecole Centrale de Nantes (ECN)
Institut Français de Recherche Pour l'Exploitation de
la Mer (IFREMER)
United Kingdom
National Renewable Energy Centre Ltd. (NAREC)
The University of Exeter (UNEXE)
European Marine Energy Centre Ltd. (EMEC)
University of Strathclyde (UNI_STRATH)
The University of Edinburgh (UEDIN)
Queen’s University Belfast (QUB)
Plymouth University(PU)
Spain
Ente Vasco de la Energía (EVE)
Tecnalia Research & Innovation Foundation
(TECNALIA)
Belgium
1-Tech (1_TECH)
Netherlands
Stichting Tidal Testing Centre (TTC)
Stichting Energieonderzoek Centrum Nederland
(ECNeth)
Germany
Fraunhofer-Gesellschaft Zur Foerderung Der
Angewandten Forschung E.V (Fh_IWES)
Gottfried Wilhelm Leibniz Universität Hannover (LUH)
Universitaet Stuttgart (USTUTT)
Portugal
Wave Energy Centre – Centro de Energia das Ondas
(WavEC)
Italy
Università degli Studi di Firenze (UNIFI-CRIACIV)
Università degli Studi di Firenze (UNIFI-PIN)
Università degli Studi della Tuscia (UNI_TUS)
Consiglio Nazionale delle Ricerche (CNR-INSEAN)
Brazil
Instituto de Pesquisas Tecnológicas do Estado de São
Paulo S.A. (IPT)
Norway
Sintef Energi AS (SINTEF)
Norges Teknisk-Naturvitenskapelige Universitet
(NTNU)
Infrastructure Access Report: INNWIND.EU
Rev. 01, 08-Oct-2014
Page 3 of 33
DOCUMENT INFORMATION Title Floating Wind Turbine Model Test
Distribution Public
Document Reference MARINET-TA2-INNWIND.EU
User-Group Leader, Lead
Author
Frank Sandner USTUTT
[Optional: Insert address and contact details]
User-Group Members,
Contributing Authors
Henrik Bredmose DTU
Pierluigi Montinari POLIMI
Ricardo Pereira DNVGL
Carlo Bottasso POLIMI
Florian Amann USTUTT
José Azcona CENER
Faisal Bouchotrouch CENER
Infrastructure Accessed: ECN Hydrodynamic and Ocean Engineering Tank
Infrastructure Manager
(or Main Contact)
Jean-Marc Rousset
REVISION HISTORY Rev. Date Description Prepared by
(Name)
Approved By
Infrastructure
Manager
Status
(Draft/Final)
01
Infrastructure Access Report: INNWIND.EU
Rev. 01, 08-Oct-2014
Page 4 of 33
ABOUT THIS REPORT One of the requirements of the EC in enabling a user group to benefit from free-of-charge access to an infrastructure
is that the user group must be entitled to disseminate the foreground (information and results) that they have
generated under the project in order to progress the state-of-the-art of the sector. Notwithstanding this, the EC also
state that dissemination activities shall be compatible with the protection of intellectual property rights,
confidentiality obligations and the legitimate interests of the owner(s) of the foreground.
The aim of this report is therefore to meet the first requirement of publicly disseminating the knowledge generated
through this MARINET infrastructure access project in an accessible format in order to:
• progress the state-of-the-art
• publicise resulting progress made for the technology/industry
• provide evidence of progress made along the Structured Development Plan
• provide due diligence material for potential future investment and financing
• share lessons learned
• avoid potential future replication by others
• provide opportunities for future collaboration
• etc.
In some cases, the user group may wish to protect some of this information which they deem commercially
sensitive, and so may choose to present results in a normalised (non-dimensional) format or withhold certain design
data – this is acceptable and allowed for in the second requirement outlined above.
ACKNOWLEDGEMENT The work described in this publication has received support from MARINET, a European Community - Research
Infrastructure Action under the FP7 “Capacities” Specific Programme.
LEGAL DISCLAIMER The views expressed, and responsibility for the content of this publication, lie solely with the authors. The European
Commission is not liable for any use that may be made of the information contained herein. This work may rely on
data from sources external to the MARINET project Consortium. Members of the Consortium do not accept liability
for loss or damage suffered by any third party as a result of errors or inaccuracies in such data. The information in
this document is provided “as is” and no guarantee or warranty is given that the information is fit for any particular
purpose. The user thereof uses the information at its sole risk and neither the European Commission nor any
member of the MARINET Consortium is liable for any use that may be made of the information.
Infrastructure Access Report: INNWIND.EU
Rev. 01, 08-Oct-2014
Page 5 of 33
EXECUTIVE SUMMARY
This report covers the second of two phases of combined wind-and-wave model testing of a generic floating wind
turbine system. The widely studied open concept of the OC4-DeepCwind semi-submersible model has been tested
together with a Froude-scaled rotor with increased chord for low Re-numbers.Two different scaling ratios have been
used in order to represent, first, the 5MW NREL reference wind turbine and, second, the 10MW INNWIND.EU
reference wind turbine. All of rotor speed, wind speed and thrust force are correctly scaled in this approach.In the
second phase of this project the remaining test cases will be finalized (ULS conditions, yawed inflow, error
assessment) and a thrust force generation for both wind turbine models will be tested through a ducted fan in terms
of a hardware-in-the-loop experiment.
It is the explicit goal of this project to make the model and measurement data public to a full extent for the
international research community for model validation of advanced coupled software tools, including aerodynamic
and hydrodynamic CFD.
Infrastructure Access Report: INNWIND.EU
Rev. 01, 08-Oct-2014
Page 6 of 33
CONTENTS
1 INTRODUCTION & BACKGROUND ...................................................................................................................7
1.1 INTRODUCTION .................................................................................................................................................... 7
1.2 DEVELOPMENT SO FAR .......................................................................................................................................... 8
1.2.1 Stage Gate Progress .................................................................................................................................... 9
1.2.2 Plan for this Access .................................................................................................................................... 10
2 OUTLINE OF WORK CARRIED OUT ................................................................................................................. 13
2.1 SETUP ............................................................................................................................................................... 13
2.1.1 Low Reynolds Rotor ................................................................................................................................... 13
2.1.2 Ducted Fan and Software in the Loop ....................................................................................................... 13
2.1.3 Scaled model for the platform ................................................................................................................... 16
2.2 TESTS ............................................................................................................................................................... 19
2.2.1 Test Plan .................................................................................................................................................... 19
2.3 RESULTS ............................................................................................................................................................ 28
2.4 ANALYSIS & CONCLUSIONS................................................................................................................................... 29
3 MAIN LEARNING OUTCOMES ....................................................................................................................... 29
3.1 PROGRESS MADE ............................................................................................................................................... 29
3.1.2 Progress Made: for Marine Renewable Energy Industry ........................................................................... 29
3.2 KEY LESSONS LEARNED ........................................................................................................................................ 30
4 FURTHER INFORMATION .............................................................................................................................. 30
4.1 SCIENTIFIC PUBLICATIONS .................................................................................................................................... 30
5 REFERENCES ................................................................................................................................................ 31
6 APPENDICES ................................................................................................................................................ 31
6.1 STAGE DEVELOPMENT SUMMARY TABLE ................................................................................................................ 31
6.2 ANY OTHER APPENDICES ..................................................................................................................................... 33
Infrastructure Access Report: INNWIND.EU
Rev. 01, 08-Oct-2014
Page 7 of 33
1 INTRODUCTION & BACKGROUND
1.1 INTRODUCTION For floating wind turbine systems various numerical codes and methods are currently available or are still under
development. Here the major developments concern the coupling of advanced aerodynamics and hydrodynamics,
but also non-linear behavior of mooring lines. In addition, these experiments will be useful for the validation of
testing methodologies, in particular for the integration of the aerodynamic rotor thrust during combined wave and
wind tests and the mooring system modelling. The tools and methods validated in this test campaign will be applied
to the design of a floating substructure for a 10MW wind turbine in Task 4.3 of the INNWIND.EU project.
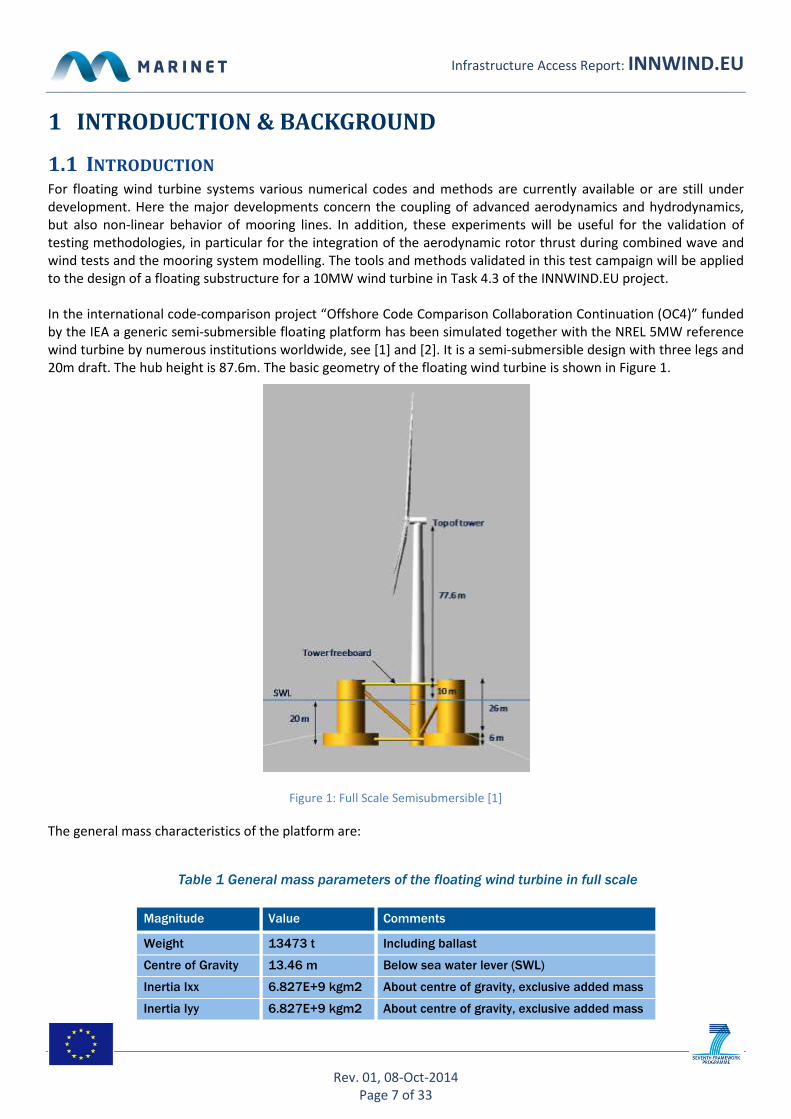
In the international code-comparison project “Offshore Code Comparison Collaboration Continuation (OC4)” funded
by the IEA a generic semi-submersible floating platform has been simulated together with the NREL 5MW reference
wind turbine by numerous institutions worldwide, see [1] and [2]. It is a semi-submersible design with three legs and
20m draft. The hub height is 87.6m. The basic geometry of the floating wind turbine is shown in Figure 1.
Figure 1: Full Scale Semisubmersible [1]
The general mass characteristics of the platform are:
Table 1 General mass parameters of the floating wind turbine in full scale
Magnitude Value Comments
Weight 13473 t Including ballast
Centre of Gravity 13.46 m Below sea water lever (SWL)
Inertia Ixx 6.827E+9 kgm2 About centre of gravity, exclusive added mass
Inertia Iyy 6.827E+9 kgm2 About centre of gravity, exclusive added mass

Infrastructure Access Report: INNWIND.EU
Rev. 01, 08-Oct-2014
Page 8 of 33
Inertia Izz 1.226E+10 kgm2
About centre of gravity, exclusive added mass
An overview of the main parameters that define the tower is provided in Table 2:
Table 2 General parameters of the tower
Magnitude Value Comments
Tower Base Elevation 10 m (Platform Top) Above SWL
Tower Top Elevation 87.6 m (Yaw Bearing) Above SWL
Total Tower Mass 249.718 t -
Tower centre of Gravity Location
43.4m Above SWL. Along Tower Centerline
Inertia Izz 1.226E10 kgm2 About centre of gravity, exclusive added mass
Table 3 shows a summary of the main parameters that define the rotor of the wind turbine model.
Table 3 General parameters of the rotor
Magnitude Value
Total RNA Mass 350 t
Rotor Mass 110 t
Nacelle Mass 240 t
Rotor Diameter 126 m
Rating 5 MW
Hub Height 90 m
Rated Tip Speed 80 m/s
The OC4 mooring lines system is composed by three lines spread symmetrically about the central vertical axis of the
platform. The depth of the location is 200m.
1.2 DEVELOPMENT SO FAR The objective of the project INNWIND.EU is to investigate the development of large offshore wind turbine systems
above 10MW. In workpackage 4 fixed-bottom as well as floating foundations are being analysed. A first goal for the
floating part is to gain valuable knowledge and experience in model testing and a thourough comparison with a wide
range of numerical simulation tools from conceptual models to high-fidelity CFD software. For this end, a generic
floating offshore wind turbine (FOWT) model has been selected.
The model in a scale of 1:45 has been set up by partner USTUTT and preliminary assembled with the wind turbine
model by partner POLIMI. It has been tested in a water tank and the datalogging devices synchronized through a
common trigger signal. In order to reduce the influence of data cables a wireless transmission system has been set
up for the platform inertial measurement unit (IMU) and the fairlead sensors. These waterproof sensors are selected
since no interference with the mooring system dynamics occurs.
Infrastructure Access Report: INNWIND.EU
Rev. 01, 08-Oct-2014
Page 9 of 33
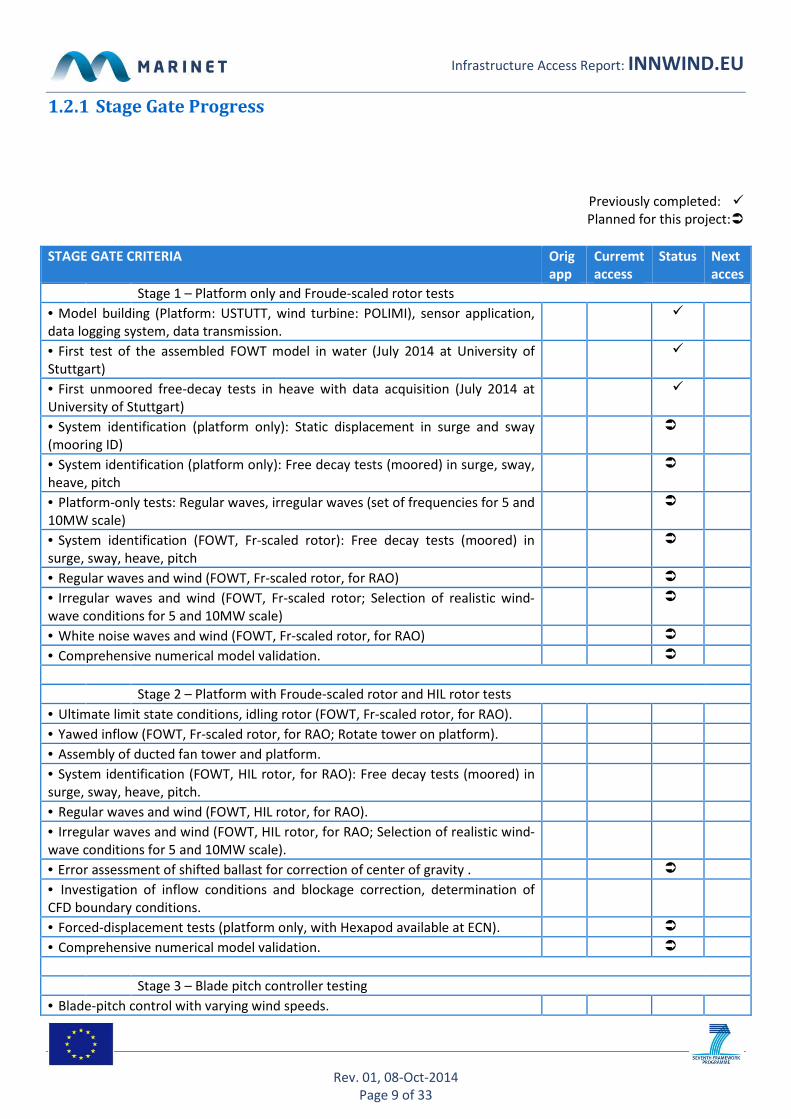
1.2.1 Stage Gate Progress
Previously completed: �
Planned for this project: �
STAGE GATE CRITERIA Orig
app
Curremt
access
Status Next
acces
Stage 1 – Platform only and Froude-scaled rotor tests
• Model building (Platform: USTUTT, wind turbine: POLIMI), sensor application,
data logging system, data transmission.
�
• First test of the assembled FOWT model in water (July 2014 at University of
Stuttgart)
�
• First unmoored free-decay tests in heave with data acquisition (July 2014 at
University of Stuttgart)
�
• System identification (platform only): Static displacement in surge and sway
(mooring ID)
�
• System identification (platform only): Free decay tests (moored) in surge, sway,
heave, pitch
�
• Platform-only tests: Regular waves, irregular waves (set of frequencies for 5 and
10MW scale)
�
• System identification (FOWT, Fr-scaled rotor): Free decay tests (moored) in
surge, sway, heave, pitch
�
• Regular waves and wind (FOWT, Fr-scaled rotor, for RAO) �
• Irregular waves and wind (FOWT, Fr-scaled rotor; Selection of realistic wind-
wave conditions for 5 and 10MW scale)
�
• White noise waves and wind (FOWT, Fr-scaled rotor, for RAO) �
• Comprehensive numerical model validation. �
Stage 2 – Platform with Froude-scaled rotor and HIL rotor tests
• Ultimate limit state conditions, idling rotor (FOWT, Fr-scaled rotor, for RAO).
• Yawed inflow (FOWT, Fr-scaled rotor, for RAO; Rotate tower on platform).
• Assembly of ducted fan tower and platform.
• System identification (FOWT, HIL rotor, for RAO): Free decay tests (moored) in
surge, sway, heave, pitch.
• Regular waves and wind (FOWT, HIL rotor, for RAO).
• Irregular waves and wind (FOWT, HIL rotor, for RAO; Selection of realistic wind-
wave conditions for 5 and 10MW scale).
• Error assessment of shifted ballast for correction of center of gravity . �
• Investigation of inflow conditions and blockage correction, determination of
CFD boundary conditions.
• Forced-displacement tests (platform only, with Hexapod available at ECN). �
• Comprehensive numerical model validation. �
Stage 3 – Blade pitch controller testing
• Blade-pitch control with varying wind speeds.
Infrastructure Access Report: INNWIND.EU
Rev. 01, 08-Oct-2014
Page 10 of 33
STAGE GATE CRITERIA Orig
app
Curremt
access
Status Next
acces
• Individual blade pitch control (IPC).
Stage 4 – Innovative INNWIND.EU floating platform
• Build new platform model for 10MW reference wind turbine in suitable scale.
• Test performance in combined wind-and-wave conditions.
• Compare results with design assumptions and numerical model predictions.
• Finalize structural design of innovative INNWIND.EU platform.
• Preliminary concept of manufacturing and installation.
• Levelized cost of energy analysis.
• Environmental impact analysis.
• Dissemination of results.
1.2.2 Plan for this Access
In a previous access of two weeks the group performed a series of tests of increasing complexity: including free
decays, only regular waves and RAO’s. The plan for this access consists on combined tests of wind and waves. All
possible combinations of steady and turbulent waves and regular and irregular waves are considered. The inclusion
of aerodynamic loads is performed using the ducted fan and software in the loop approach and also using a Reynolds
scaled rotor model.
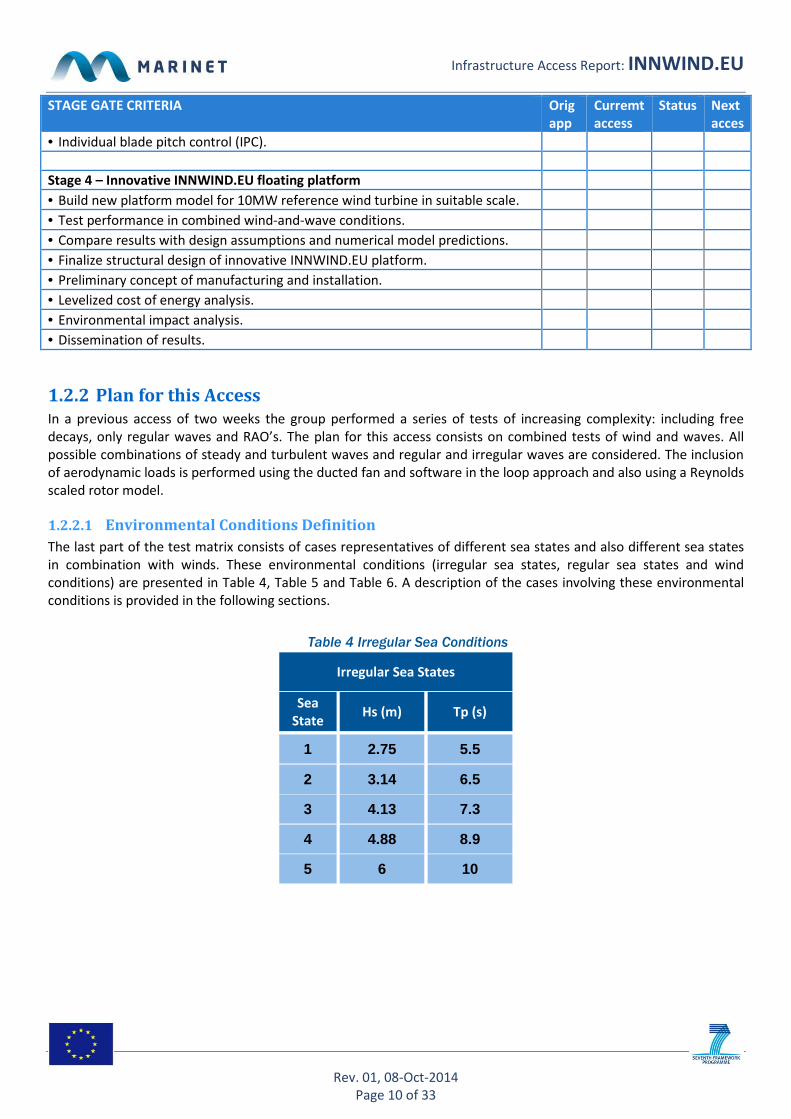
1.2.2.1 Environmental Conditions Definition
The last part of the test matrix consists of cases representatives of different sea states and also different sea states
in combination with winds. These environmental conditions (irregular sea states, regular sea states and wind
conditions) are presented in Table 4, Table 5 and Table 6. A description of the cases involving these environmental
conditions is provided in the following sections.
Table 4 Irregular Sea Conditions
Irregular Sea States
Sea
State Hs (m) Tp (s)
1 2.75 5.5
2 3.14 6.5
3 4.13 7.3
4 4.88 8.9
5 6 10
Infrastructure Access Report: INNWIND.EU
Rev. 01, 08-Oct-2014
Page 11 of 33
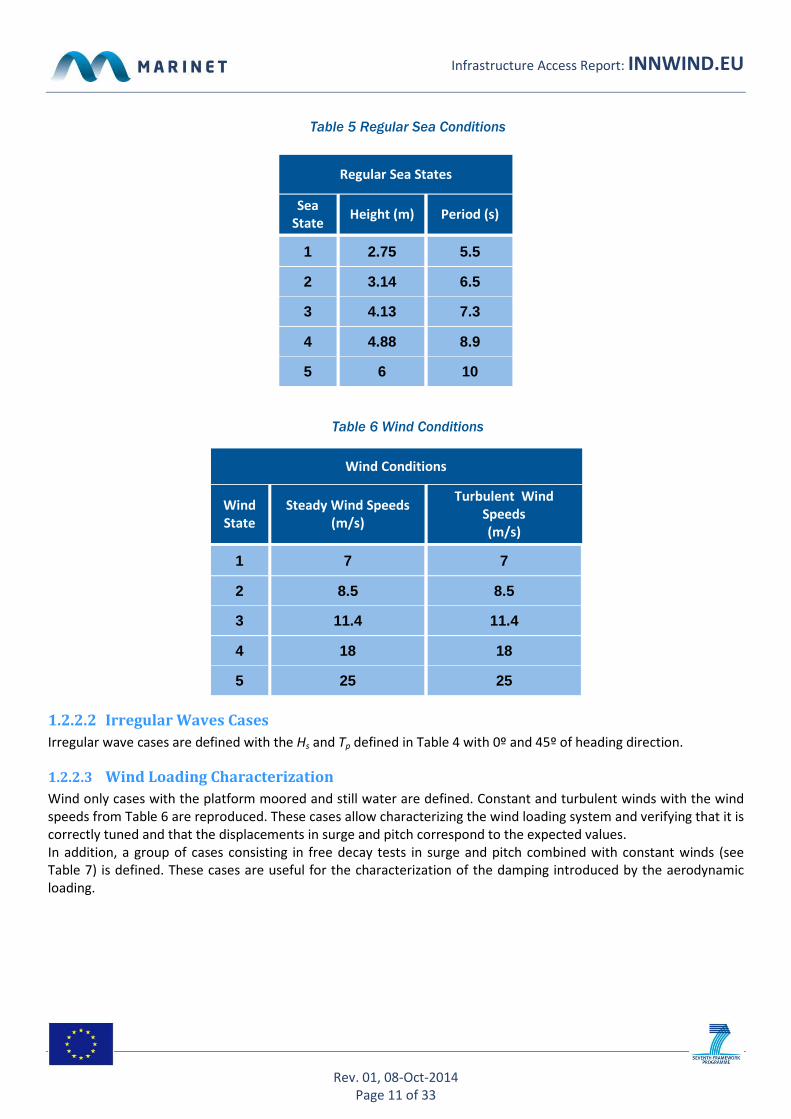
Table 5 Regular Sea Conditions
Regular Sea States
Sea
State Height (m) Period (s)
1 2.75 5.5
2 3.14 6.5
3 4.13 7.3
4 4.88 8.9
5 6 10
Table 6 Wind Conditions
1.2.2.2 Irregular Waves Cases
Irregular wave cases are defined with the Hs and Tp defined in Table 4 with 0º and 45º of heading direction.
1.2.2.3 Wind Loading Characterization
Wind only cases with the platform moored and still water are defined. Constant and turbulent winds with the wind
speeds from Table 6 are reproduced. These cases allow characterizing the wind loading system and verifying that it is
correctly tuned and that the displacements in surge and pitch correspond to the expected values.
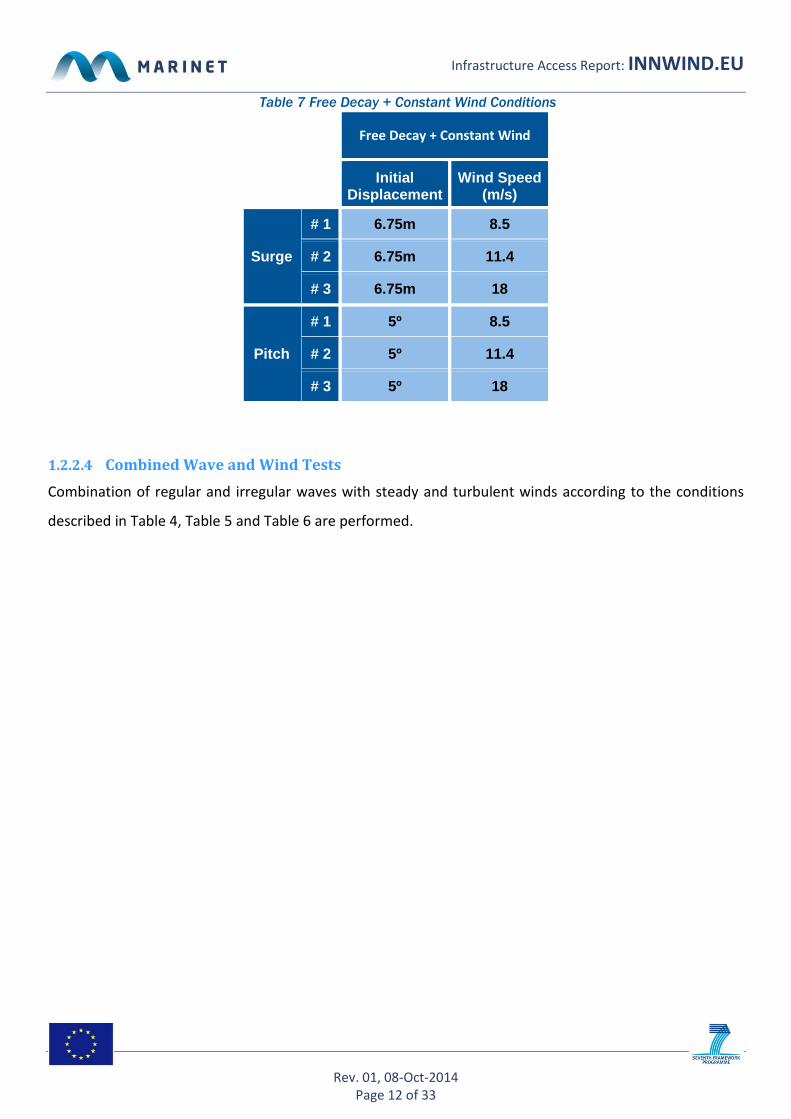
In addition, a group of cases consisting in free decay tests in surge and pitch combined with constant winds (see
Table 7) is defined. These cases are useful for the characterization of the damping introduced by the aerodynamic
loading.
Wind Conditions
Wind
State
Steady Wind Speeds
(m/s)
Turbulent Wind
Speeds
(m/s)
1 7 7
2 8.5 8.5
3 11.4 11.4
4 18 18
5 25 25
Infrastructure Access Report: INNWIND.EU
Rev. 01, 08-Oct-2014
Page 12 of 33
Table 7 Free Decay + Constant Wind Conditions
Free Decay + Constant Wind
Initial Displacement
Wind Speed (m/s)
Surge
# 1 6.75m 8.5
# 2 6.75m 11.4
# 3 6.75m 18
Pitch
# 1 5º 8.5
# 2 5º 11.4
# 3 5º 18
1.2.2.4 Combined Wave and Wind Tests
Combination of regular and irregular waves with steady and turbulent winds according to the conditions
described in Table 4, Table 5 and Table 6 are performed.

Infrastructure Access Report: INNWIND.EU
Rev. 01, 08-Oct-2014
Page 13 of 33
2 OUTLINE OF WORK CARRIED OUT
2.1 SETUP
2.1.1 Low Reynolds Rotor
The Setup consists of a wind turbine model with rigid rigid blades and flexible tower, that is mounted on the floating
platform. The nacelle is composed of the following components:
Figure 2: Picture of nacelle
At the bottom of the tower, strain gages are applied for acquiring tower loads. All the signal are then brought away
to the cabinet by water proof cables. The cabinet contains Bachmann control, data acquisition system, motor torque
and and power suppliers. Finally the system communicates throw Ethernet connection with a remote computer
with a user interface.
2.1.2 Ducted Fan and Software in the Loop
An alternative method to the design of a low-Reynolds rotor to achieve representative rotor thrust during the
execution of the tests is the use of a ducted fan to introduce a controlled force at the tower top that represents the
aerodynamic loading. This method has the advantages of being very economical and avoiding an external wind
generation system to introduce the main force impacting the floating system by other means. Several of these
options and the correlated experiments from the literature are outlined in [4]. The use of this method in addition to
the low-Reynolds rotor will allow an assessment of the advantages and shortcomings related to this simplified
testing method.
The basic concept of the method consists of substituting the rotor by a fan driven by an electric motor. The fan
thrust is controlled by the fan rotational speed set by the controller, which again depends on the real time
simulation of the full scale rotor in a turbulent wind field, with the platform motions measured in real time in the
wave tank test. A picture of the ducted fan at the tower top is shown in Figure 2.
• Mechanical components for transmission
• Optical encoder for azimuth
measurement
• 3-Pitch actuators control units with
position control
• Torque actuator housed in tower top for
torque and speed control
• Shaft strain gages and signal conditioning
board
• 36 channels slip ring

Infrastructure Access Report: INNWIND.EU
Rev. 01, 08-Oct-2014
Page 14 of 33
Figure 2 – Ducted fan
The fan and its real-time controller are lighter than the scaled mass and thus, ballast has been added to the nacelle
to match the full scale configuration. The fan is mounted on the same tower as the Froude-scaled rotor.
The model of ducted fan selected to generate the force representing the aerodynamic thrust during the tests is the
DS-30-AXI HDS, manufactured by the German company Schübeler. The fan is powered by a brushless motor HET
2W20 that is controlled by an Electronic Speed Controller (ESC) YGE 90 HV, and works with an industrial AC/DC
power supply. This system configuration produces an approximate force range of 0-18N. The rpm of the motor (and
therefore the force produced by the fan) is controlled by a Pulse Width Modulation (PWM) signal that is generated
with the LabVIEW control software, using servo libraries for Arduino. The demanded force for the fan is provided by
the full scale simulation of the rotor’s aerodynamic thrust.
The software used to compute the aerodynamic loads in real time is the version v6.02c-jmj of the FAST code, with
AeroDyn 12.58. The software has been compiled in Linux and during the test campaign it was ran in a computer with
a 2.54GHz Intel Core Duo CPU and 2GB of RAM.
Figure 4 – Fan Control System Lay Out
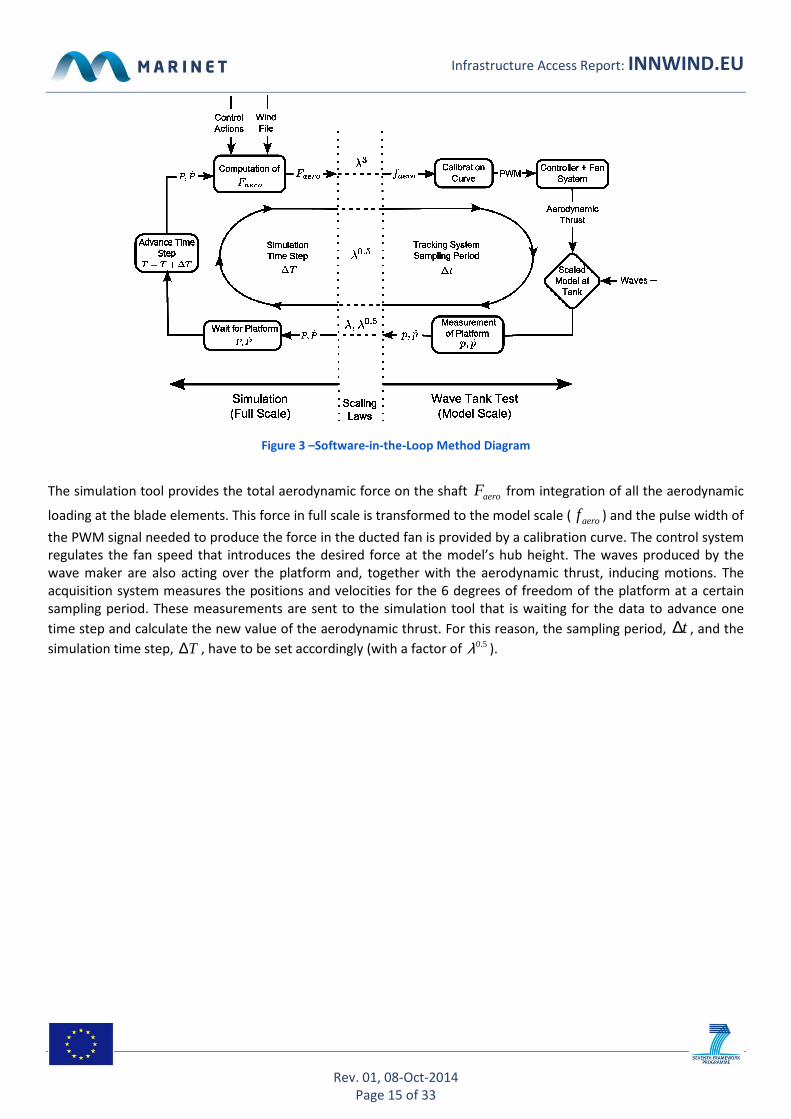
The layout of the system is shown in Figure 3. The left side describes the simulation part of the system, which works
in full scale, and the right side represents the wave tank scaled test. The different magnitudes that are interchanged
between both blocks are transformed by the appropriated scaling laws based on the factor scale λ .
Infrastructure Access Report: INNWIND.EU
Rev. 01, 08-Oct-2014
Page 15 of 33
Figure 3 –Software-in-the-Loop Method Diagram
The simulation tool provides the total aerodynamic force on the shaft aeroF from integration of all the aerodynamic
loading at the blade elements. This force in full scale is transformed to the model scale ( aerof ) and the pulse width of
the PWM signal needed to produce the force in the ducted fan is provided by a calibration curve. The control system
regulates the fan speed that introduces the desired force at the model’s hub height. The waves produced by the
wave maker are also acting over the platform and, together with the aerodynamic thrust, inducing motions. The
acquisition system measures the positions and velocities for the 6 degrees of freedom of the platform at a certain
sampling period. These measurements are sent to the simulation tool that is waiting for the data to advance one
time step and calculate the new value of the aerodynamic thrust. For this reason, the sampling period, t∆ , and the
simulation time step, T∆ , have to be set accordingly (with a factor of 0.5λ ).
Infrastructure Access Report: INNWIND.EU
Rev. 01, 08-Oct-2014
Page 16 of 33
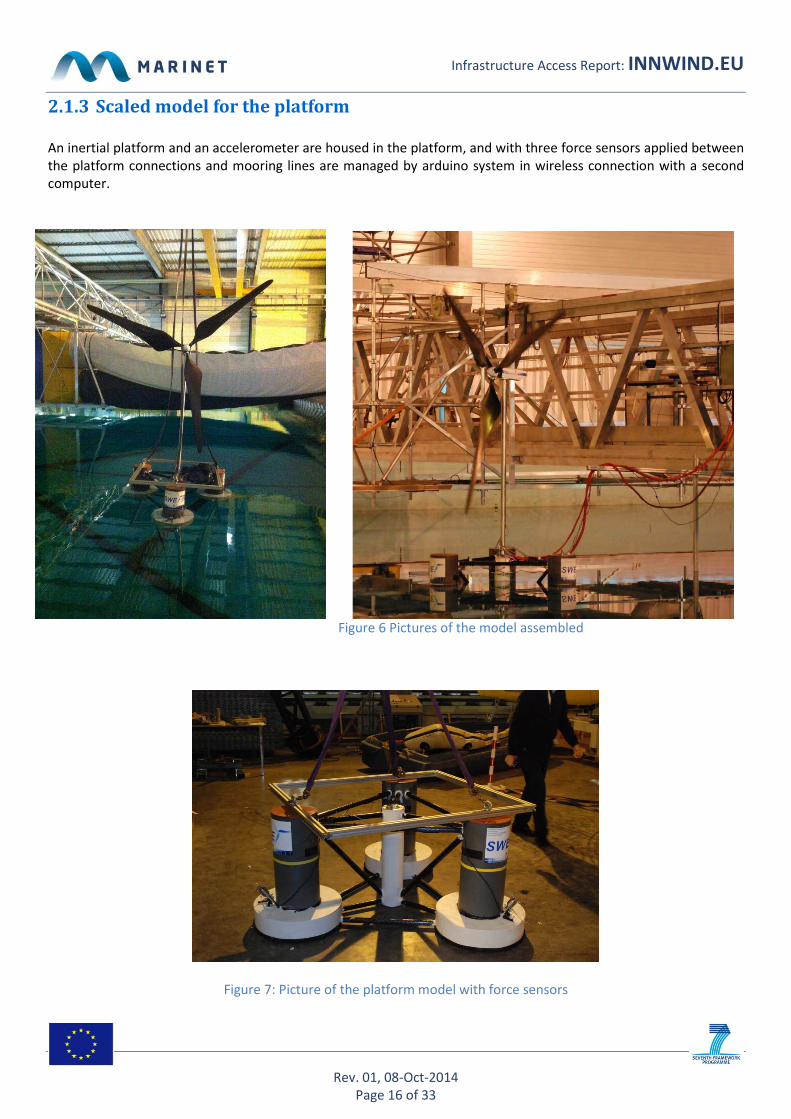
2.1.3 Scaled model for the platform
An inertial platform and an accelerometer are housed in the platform, and with three force sensors applied between
the platform connections and mooring lines are managed by arduino system in wireless connection with a second
computer.
Figure 6 Pictures of the model assembled
Figure 7: Picture of the platform model with force sensors
Infrastructure Access Report: INNWIND.EU
Rev. 01, 08-Oct-2014
Page 17 of 33
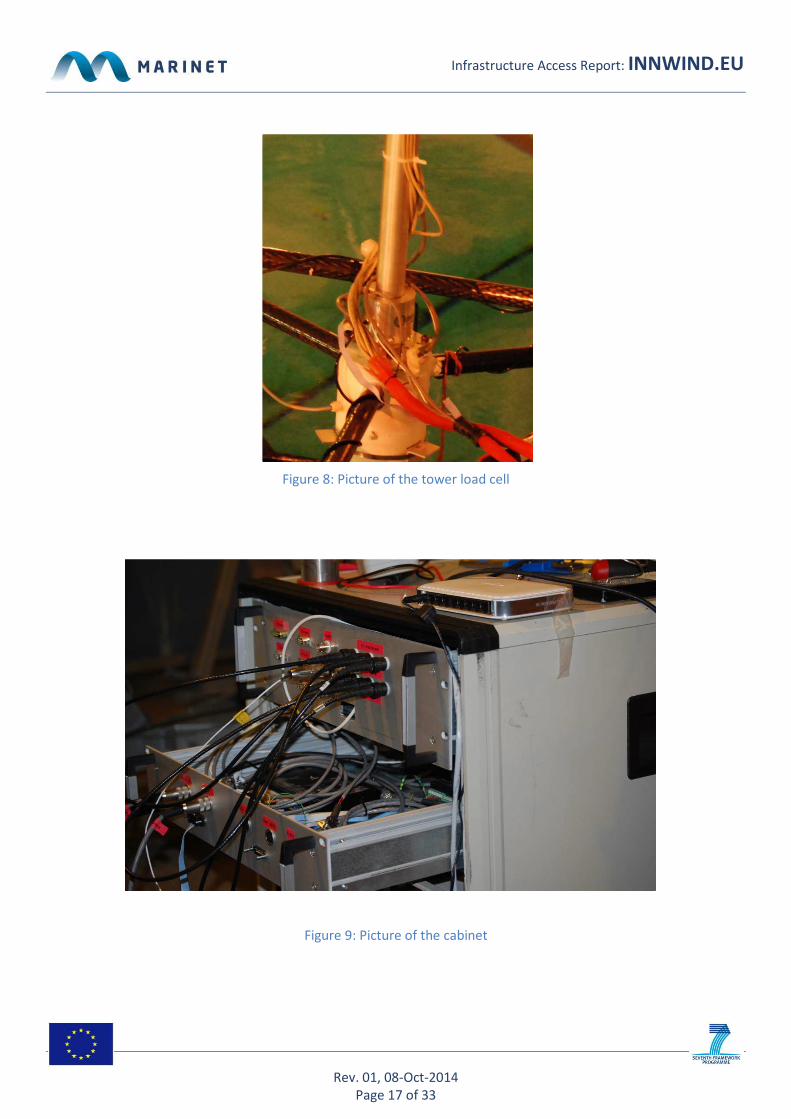
Figure 8: Picture of the tower load cell
Figure 9: Picture of the cabinet
Infrastructure Access Report: INNWIND.EU
Rev. 01, 08-Oct-2014
Page 18 of 33
Sample ‘Landscape’ section
Infrastructure Access Report: INNWIND.EU
Rev. 01, 08-Oct-2014
Page 19 of 33
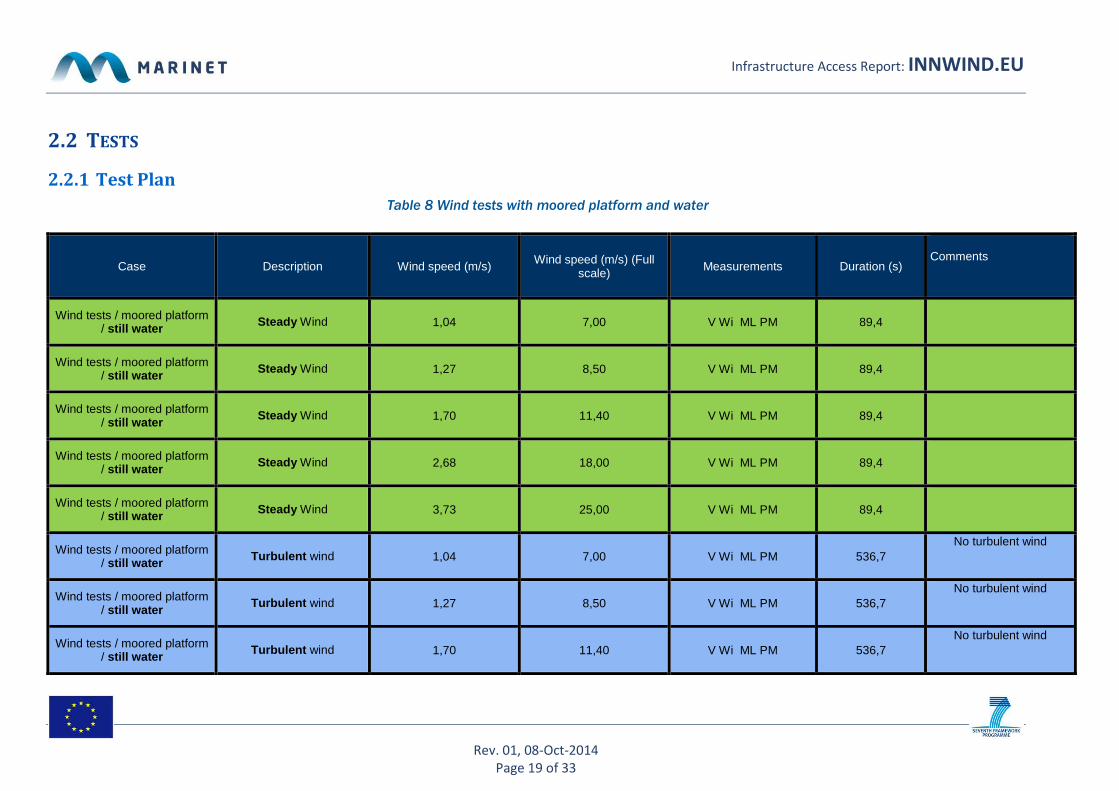
2.2 TESTS
2.2.1 Test Plan
Table 8 Wind tests with moored platform and water
Case Description Wind speed (m/s) Wind speed (m/s) (Full scale) Measurements Duration (s)
Comments
Wind tests / moored platform / still water Steady Wind 1,04 7,00 V Wi ML PM 89,4
Wind tests / moored platform / still water Steady Wind 1,27 8,50 V Wi ML PM 89,4
Wind tests / moored platform / still water
Steady Wind 1,70 11,40 V Wi ML PM 89,4
Wind tests / moored platform / still water Steady Wind 2,68 18,00 V Wi ML PM 89,4
Wind tests / moored platform / still water Steady Wind 3,73 25,00 V Wi ML PM 89,4
Wind tests / moored platform / still water Turbulent wind 1,04 7,00 V Wi ML PM 536,7
No turbulent wind
Wind tests / moored platform / still water
Turbulent wind 1,27 8,50 V Wi ML PM 536,7 No turbulent wind
Wind tests / moored platform / still water Turbulent wind 1,70 11,40 V Wi ML PM 536,7
No turbulent wind
Infrastructure Access Report: INNWIND.EU
Rev. 01, 08-Oct-2014
Page 20 of 33
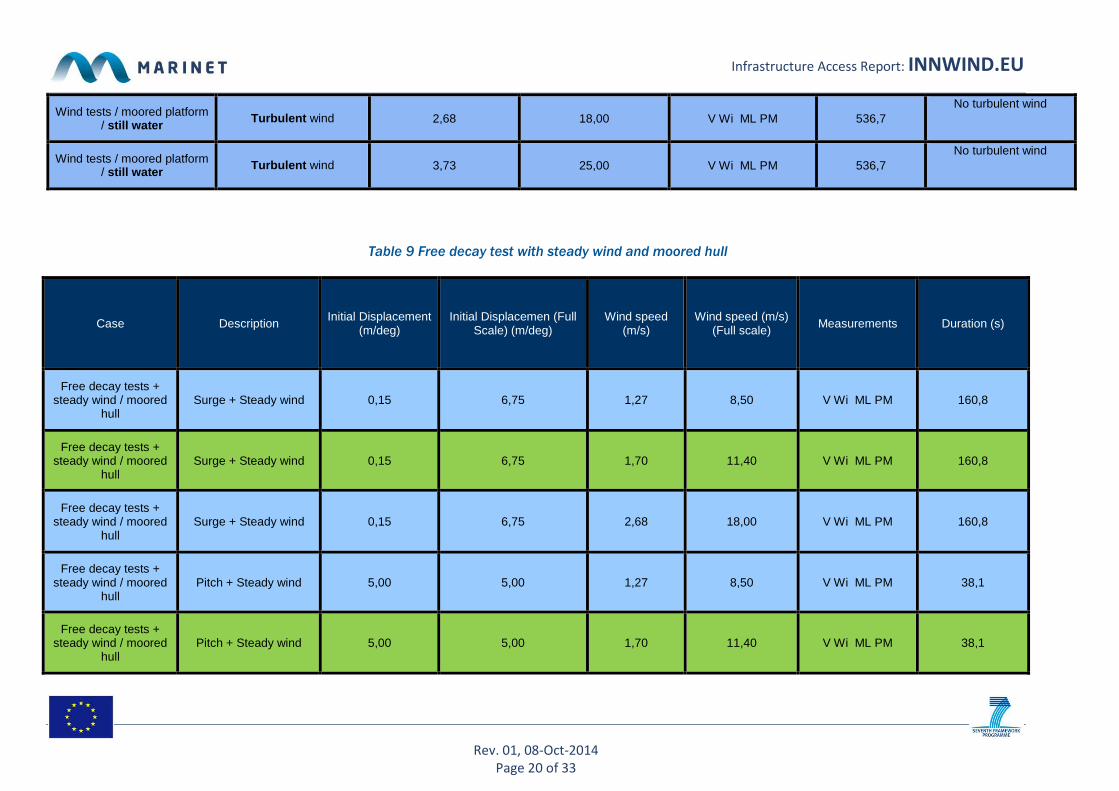
Wind tests / moored platform / still water
Turbulent wind 2,68 18,00 V Wi ML PM 536,7 No turbulent wind
Wind tests / moored platform / still water Turbulent wind 3,73 25,00 V Wi ML PM 536,7
No turbulent wind
Table 9 Free decay test with steady wind and moored hull
Case Description Initial Displacement
(m/deg) Initial Displacemen (Full
Scale) (m/deg) Wind speed
(m/s) Wind speed (m/s)
(Full scale) Measurements Duration (s)
Free decay tests + steady wind / moored
hull Surge + Steady wind 0,15 6,75 1,27 8,50 V Wi ML PM 160,8
Free decay tests + steady wind / moored
hull Surge + Steady wind 0,15 6,75 1,70 11,40 V Wi ML PM 160,8
Free decay tests + steady wind / moored
hull Surge + Steady wind 0,15 6,75 2,68 18,00 V Wi ML PM 160,8
Free decay tests + steady wind / moored
hull Pitch + Steady wind 5,00 5,00 1,27 8,50 V Wi ML PM 38,1
Free decay tests + steady wind / moored
hull Pitch + Steady wind 5,00 5,00 1,70 11,40 V Wi ML PM 38,1
Infrastructure Access Report: INNWIND.EU
Rev. 01, 08-Oct-2014
Page 21 of 33
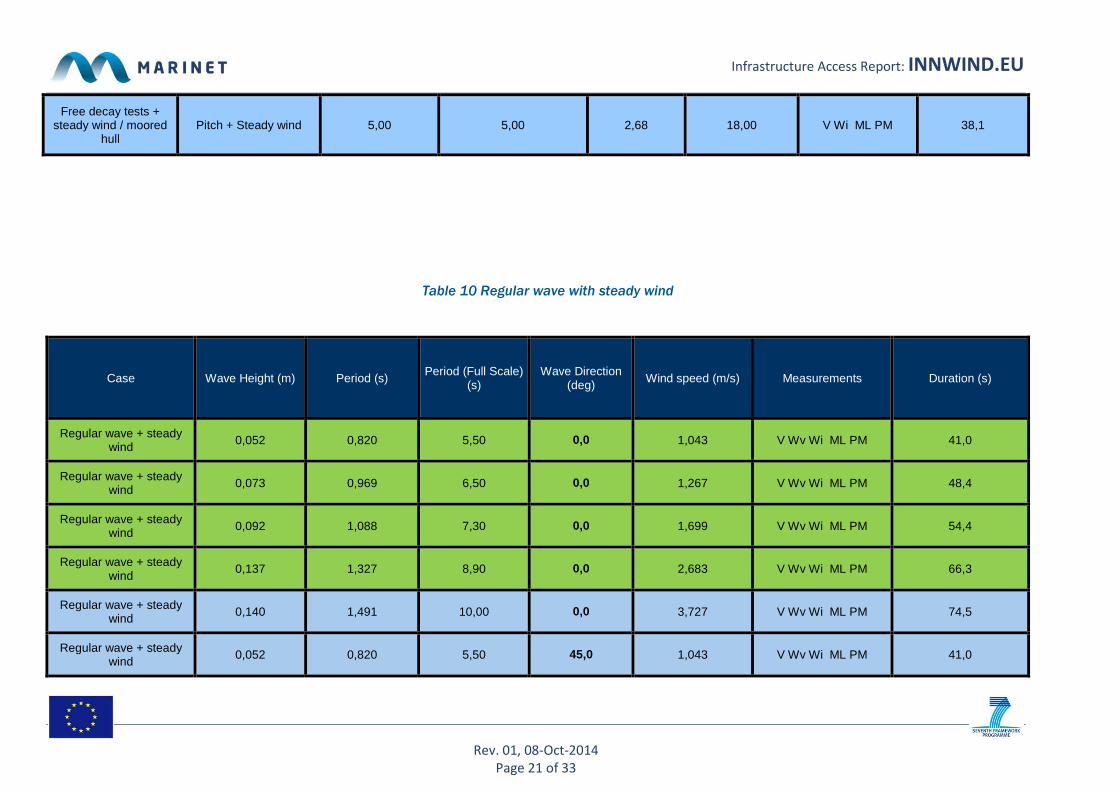
Free decay tests + steady wind / moored
hull Pitch + Steady wind 5,00 5,00 2,68 18,00 V Wi ML PM 38,1
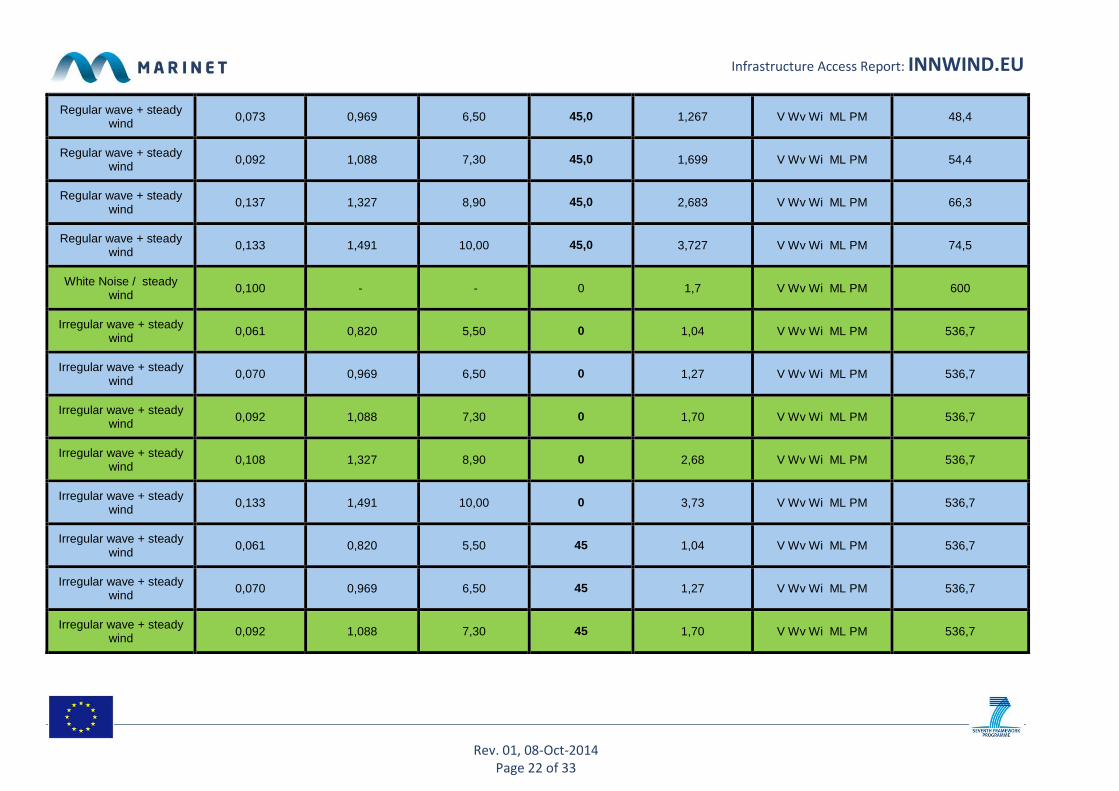
Table 10 Regular wave with steady wind
Case Wave Height (m) Period (s) Period (Full Scale)
(s) Wave Direction
(deg) Wind speed (m/s) Measurements Duration (s)
Regular wave + steady wind 0,052 0,820 5,50 0,0 1,043 V Wv Wi ML PM 41,0
Regular wave + steady wind 0,073 0,969 6,50 0,0 1,267 V Wv Wi ML PM 48,4
Regular wave + steady wind 0,092 1,088 7,30 0,0 1,699 V Wv Wi ML PM 54,4
Regular wave + steady wind
0,137 1,327 8,90 0,0 2,683 V Wv Wi ML PM 66,3
Regular wave + steady wind 0,140 1,491 10,00 0,0 3,727 V Wv Wi ML PM 74,5
Regular wave + steady wind 0,052 0,820 5,50 45,0 1,043 V Wv Wi ML PM 41,0
Infrastructure Access Report: INNWIND.EU
Rev. 01, 08-Oct-2014
Page 22 of 33
Regular wave + steady wind 0,073 0,969 6,50 45,0 1,267 V Wv Wi ML PM 48,4
Regular wave + steady wind 0,092 1,088 7,30 45,0 1,699 V Wv Wi ML PM 54,4
Regular wave + steady wind
0,137 1,327 8,90 45,0 2,683 V Wv Wi ML PM 66,3
Regular wave + steady wind 0,133 1,491 10,00 45,0 3,727 V Wv Wi ML PM 74,5
White Noise / steady wind 0,100 - - 0 1,7 V Wv Wi ML PM 600
Irregular wave + steady wind 0,061 0,820 5,50 0 1,04 V Wv Wi ML PM 536,7
Irregular wave + steady wind
0,070 0,969 6,50 0 1,27 V Wv Wi ML PM 536,7
Irregular wave + steady wind 0,092 1,088 7,30 0 1,70 V Wv Wi ML PM 536,7
Irregular wave + steady wind 0,108 1,327 8,90 0 2,68 V Wv Wi ML PM 536,7
Irregular wave + steady wind 0,133 1,491 10,00 0 3,73 V Wv Wi ML PM 536,7
Irregular wave + steady wind
0,061 0,820 5,50 45 1,04 V Wv Wi ML PM 536,7
Irregular wave + steady wind 0,070 0,969 6,50 45 1,27 V Wv Wi ML PM 536,7
Irregular wave + steady wind 0,092 1,088 7,30 45 1,70 V Wv Wi ML PM 536,7
Infrastructure Access Report: INNWIND.EU
Rev. 01, 08-Oct-2014
Page 23 of 33
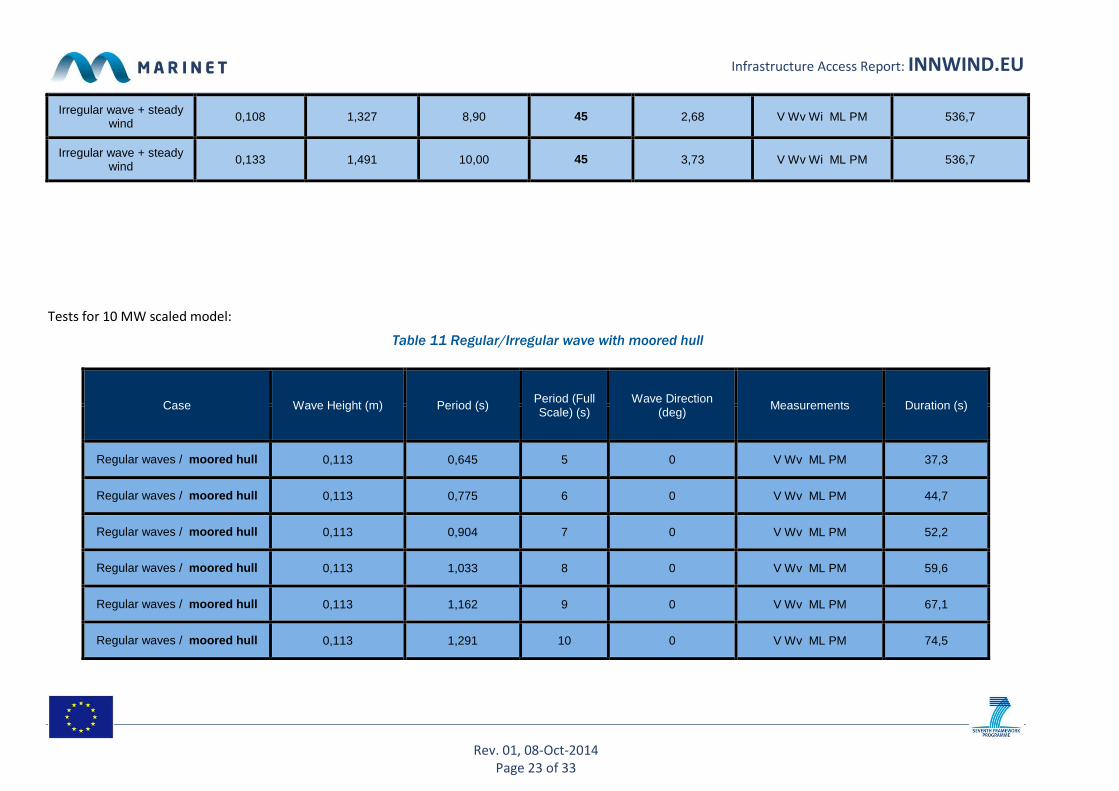
Irregular wave + steady wind 0,108 1,327 8,90 45 2,68 V Wv Wi ML PM 536,7
Irregular wave + steady wind 0,133 1,491 10,00 45 3,73 V Wv Wi ML PM 536,7
Tests for 10 MW scaled model:
Table 11 Regular/Irregular wave with moored hull
Case Wave Height (m) Period (s) Period (Full Scale) (s)
Wave Direction (deg)
Measurements Duration (s)
Regular waves / moored hull 0,113 0,645 5 0 V Wv ML PM 37,3
Regular waves / moored hull 0,113 0,775 6 0 V Wv ML PM 44,7
Regular waves / moored hull 0,113 0,904 7 0 V Wv ML PM 52,2
Regular waves / moored hull 0,113 1,033 8 0 V Wv ML PM 59,6
Regular waves / moored hull 0,113 1,162 9 0 V Wv ML PM 67,1
Regular waves / moored hull 0,113 1,291 10 0 V Wv ML PM 74,5
Infrastructure Access Report: INNWIND.EU
Rev. 01, 08-Oct-2014
Page 24 of 33
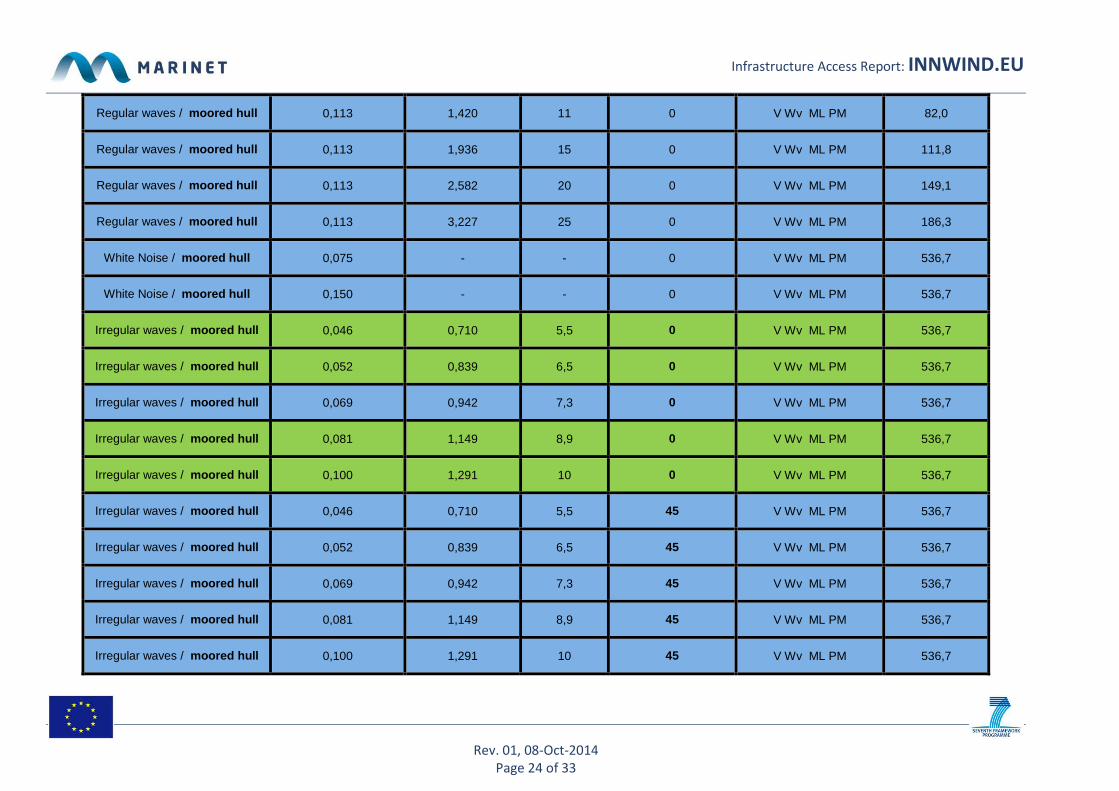
Regular waves / moored hull 0,113 1,420 11 0 V Wv ML PM 82,0
Regular waves / moored hull 0,113 1,936 15 0 V Wv ML PM 111,8
Regular waves / moored hull 0,113 2,582 20 0 V Wv ML PM 149,1
Regular waves / moored hull 0,113 3,227 25 0 V Wv ML PM 186,3
White Noise / moored hull 0,075 - - 0 V Wv ML PM 536,7
White Noise / moored hull 0,150 - - 0 V Wv ML PM 536,7
Irregular waves / moored hull 0,046 0,710 5,5 0 V Wv ML PM 536,7
Irregular waves / moored hull 0,052 0,839 6,5 0 V Wv ML PM 536,7
Irregular waves / moored hull 0,069 0,942 7,3 0 V Wv ML PM 536,7
Irregular waves / moored hull 0,081 1,149 8,9 0 V Wv ML PM 536,7
Irregular waves / moored hull 0,100 1,291 10 0 V Wv ML PM 536,7
Irregular waves / moored hull 0,046 0,710 5,5 45 V Wv ML PM 536,7
Irregular waves / moored hull 0,052 0,839 6,5 45 V Wv ML PM 536,7
Irregular waves / moored hull 0,069 0,942 7,3 45 V Wv ML PM 536,7
Irregular waves / moored hull 0,081 1,149 8,9 45 V Wv ML PM 536,7
Irregular waves / moored hull 0,100 1,291 10 45 V Wv ML PM 536,7
Infrastructure Access Report: INNWIND.EU
Rev. 01, 08-Oct-2014
Page 25 of 33
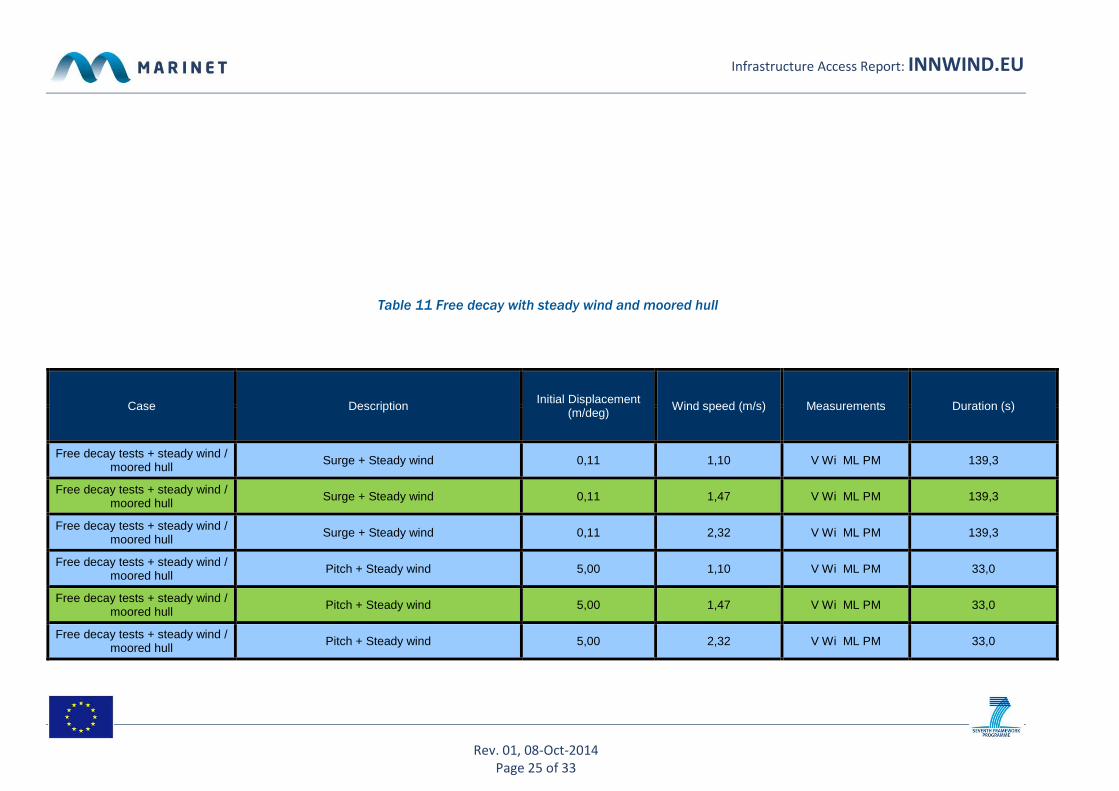
Table 11 Free decay with steady wind and moored hull
Case Description Initial Displacement (m/deg) Wind speed (m/s) Measurements Duration (s)
Free decay tests + steady wind / moored hull Surge + Steady wind 0,11 1,10 V Wi ML PM 139,3
Free decay tests + steady wind / moored hull Surge + Steady wind 0,11 1,47 V Wi ML PM 139,3
Free decay tests + steady wind / moored hull Surge + Steady wind 0,11 2,32 V Wi ML PM 139,3
Free decay tests + steady wind / moored hull Pitch + Steady wind 5,00 1,10 V Wi ML PM 33,0
Free decay tests + steady wind / moored hull Pitch + Steady wind 5,00 1,47 V Wi ML PM 33,0
Free decay tests + steady wind / moored hull Pitch + Steady wind 5,00 2,32 V Wi ML PM 33,0
Infrastructure Access Report: INNWIND.EU
Rev. 01, 08-Oct-2014
Page 26 of 33
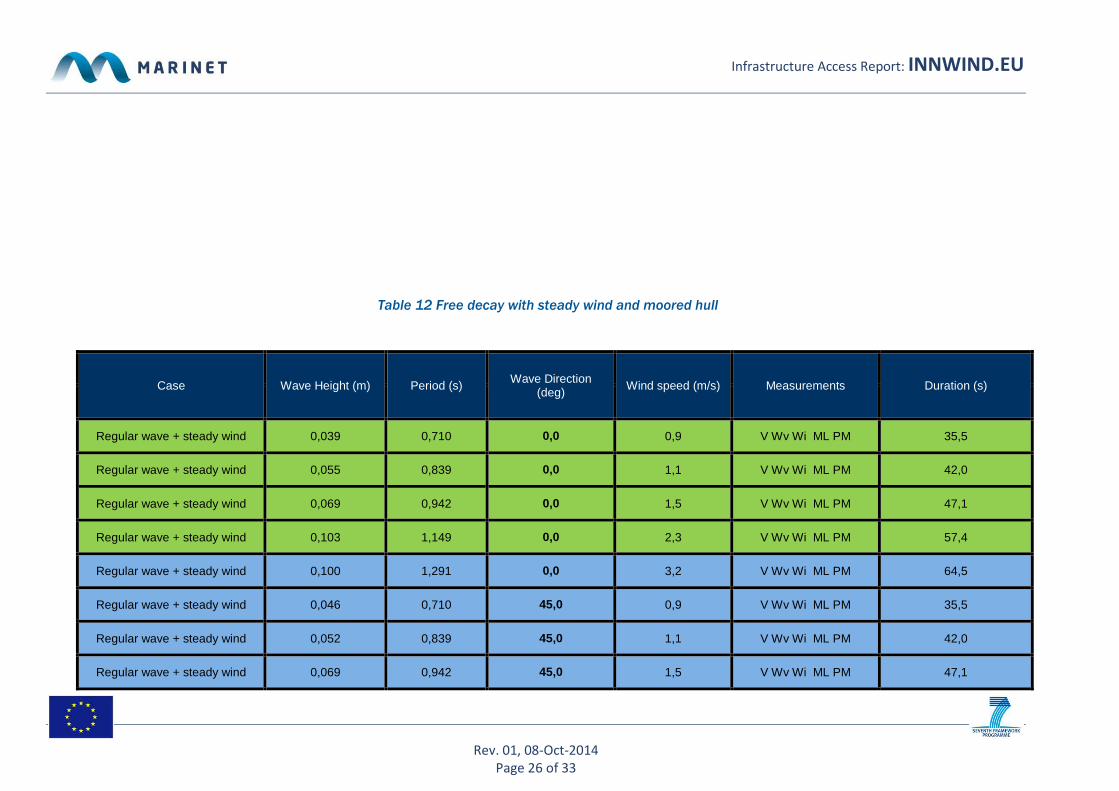
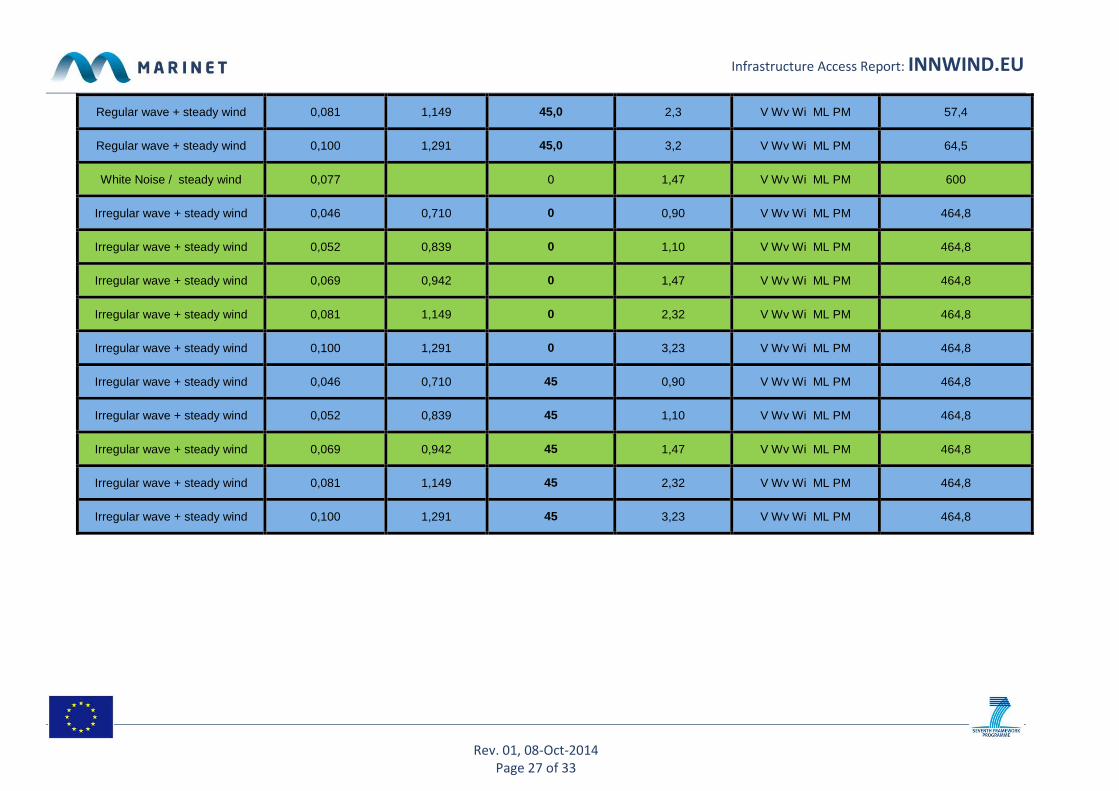
Table 12 Free decay with steady wind and moored hull
Case Wave Height (m) Period (s) Wave Direction (deg) Wind speed (m/s) Measurements Duration (s)
Regular wave + steady wind 0,039 0,710 0,0 0,9 V Wv Wi ML PM 35,5
Regular wave + steady wind 0,055 0,839 0,0 1,1 V Wv Wi ML PM 42,0
Regular wave + steady wind 0,069 0,942 0,0 1,5 V Wv Wi ML PM 47,1
Regular wave + steady wind 0,103 1,149 0,0 2,3 V Wv Wi ML PM 57,4
Regular wave + steady wind 0,100 1,291 0,0 3,2 V Wv Wi ML PM 64,5
Regular wave + steady wind 0,046 0,710 45,0 0,9 V Wv Wi ML PM 35,5
Regular wave + steady wind 0,052 0,839 45,0 1,1 V Wv Wi ML PM 42,0
Regular wave + steady wind 0,069 0,942 45,0 1,5 V Wv Wi ML PM 47,1
Infrastructure Access Report: INNWIND.EU
Rev. 01, 08-Oct-2014
Page 27 of 33
Regular wave + steady wind 0,081 1,149 45,0 2,3 V Wv Wi ML PM 57,4
Regular wave + steady wind 0,100 1,291 45,0 3,2 V Wv Wi ML PM 64,5
White Noise / steady wind 0,077 0 1,47 V Wv Wi ML PM 600
Irregular wave + steady wind 0,046 0,710 0 0,90 V Wv Wi ML PM 464,8
Irregular wave + steady wind 0,052 0,839 0 1,10 V Wv Wi ML PM 464,8
Irregular wave + steady wind 0,069 0,942 0 1,47 V Wv Wi ML PM 464,8
Irregular wave + steady wind 0,081 1,149 0 2,32 V Wv Wi ML PM 464,8
Irregular wave + steady wind 0,100 1,291 0 3,23 V Wv Wi ML PM 464,8
Irregular wave + steady wind 0,046 0,710 45 0,90 V Wv Wi ML PM 464,8
Irregular wave + steady wind 0,052 0,839 45 1,10 V Wv Wi ML PM 464,8
Irregular wave + steady wind 0,069 0,942 45 1,47 V Wv Wi ML PM 464,8
Irregular wave + steady wind 0,081 1,149 45 2,32 V Wv Wi ML PM 464,8
Irregular wave + steady wind 0,100 1,291 45 3,23 V Wv Wi ML PM 464,8
Infrastructure Access Report: INNWIND.EU
Rev. 01, 08-Oct-2014
Page 28 of 33
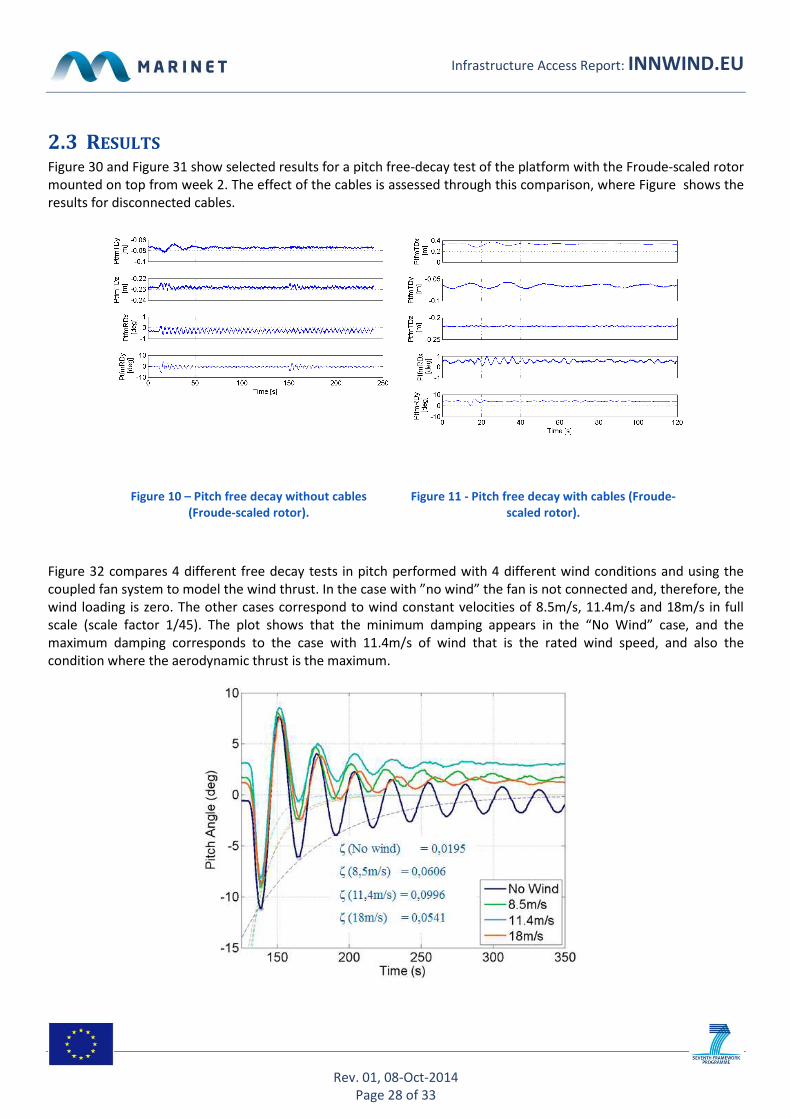
2.3 RESULTS Figure 30 and Figure 31 show selected results for a pitch free-decay test of the platform with the Froude-scaled rotor
mounted on top from week 2. The effect of the cables is assessed through this comparison, where Figure shows the
results for disconnected cables.
Figure 10 – Pitch free decay without cables
(Froude-scaled rotor).
Figure 11 - Pitch free decay with cables (Froude-
scaled rotor).
Figure 32 compares 4 different free decay tests in pitch performed with 4 different wind conditions and using the
coupled fan system to model the wind thrust. In the case with ”no wind” the fan is not connected and, therefore, the
wind loading is zero. The other cases correspond to wind constant velocities of 8.5m/s, 11.4m/s and 18m/s in full
scale (scale factor 1/45). The plot shows that the minimum damping appears in the “No Wind” case, and the
maximum damping corresponds to the case with 11.4m/s of wind that is the rated wind speed, and also the
condition where the aerodynamic thrust is the maximum.
Infrastructure Access Report: INNWIND.EU
Rev. 01, 08-Oct-2014
Page 29 of 33
Figure 12 – Comparison of pitch free decay tests with different constant wind speeds modelled by
the coupled fan system.
2.4 ANALYSIS & CONCLUSIONS
The combined tests of wave and wind have shown a good behaviour of the platform tested with moderate motions
of the concept. One important outcome has been the verification of the two approaches to integrate the
aerodynamic loading in the combined wave and wind tests. The measurements of thrust provided by the scaled low
Reynolds number rotor were in the range of the objective defined by the full scale rotor. In addition, the ducted fan
was also successfully integrated in the tests and the capability to model the aerodynamic damping has been showed
by the execution of pitch free decay tests under steady wind loading at different wind speeds.
3 MAIN LEARNING OUTCOMES
3.1 PROGRESS MADE
The validation of the methodology for the integration of aerodynamic loads on the test using a low-Reynolds, pitch
controlled rotor is a very innovative alternative to the other existing technologies as the use of a drag actuator disk
that can provide a very good performance, including the effect of the control actions. The detailed description of the
built model, the sensors and data loggers used and the test description and data which will be published allow for a
thorough improvement of the testing procedure of floating wind turbines and contribute to the establishment of
“best practices” for future model tests. In addition, the validation of the ducted fan and Software-in-the-Loop
approach is an important outcome of the project. During the implementation of the system, we gain important
experience on how to solve the communication problems between the computers and the acquisition system. Some
of the software in the loop simulations failed due to the use of a blade discretization with excessive number of
elements that slowed the simulation. This was an important lesson learnt.
3.1.1.1 Next Steps for Research or Staged Development Plan – Exit/Change & Retest/Proceed?
Once validated our methodologies for the testing of combined wave and wind cases, we plan to perform a validation
campaign with an innovative platform concept currently under development. It is a hybrid concept between spar
and semisubmersible in concrete.
3.1.2 Progress Made: for Marine Renewable Energy Industry
The validation of the methodology for the integration of aerodynamic loads on the test using a low-Reynolds, pitch-
controlled rotor is a very innovative alternative to the other existing technologies as the use of a drag actuator disk,
that can provide a very good performance, including the effect of the control actions. The ducted fan and software in
the loop method is also an innovative approach with very low cost that can be applied in facilities where no wind
generator exists.
Infrastructure Access Report: INNWIND.EU
Rev. 01, 08-Oct-2014
Page 30 of 33
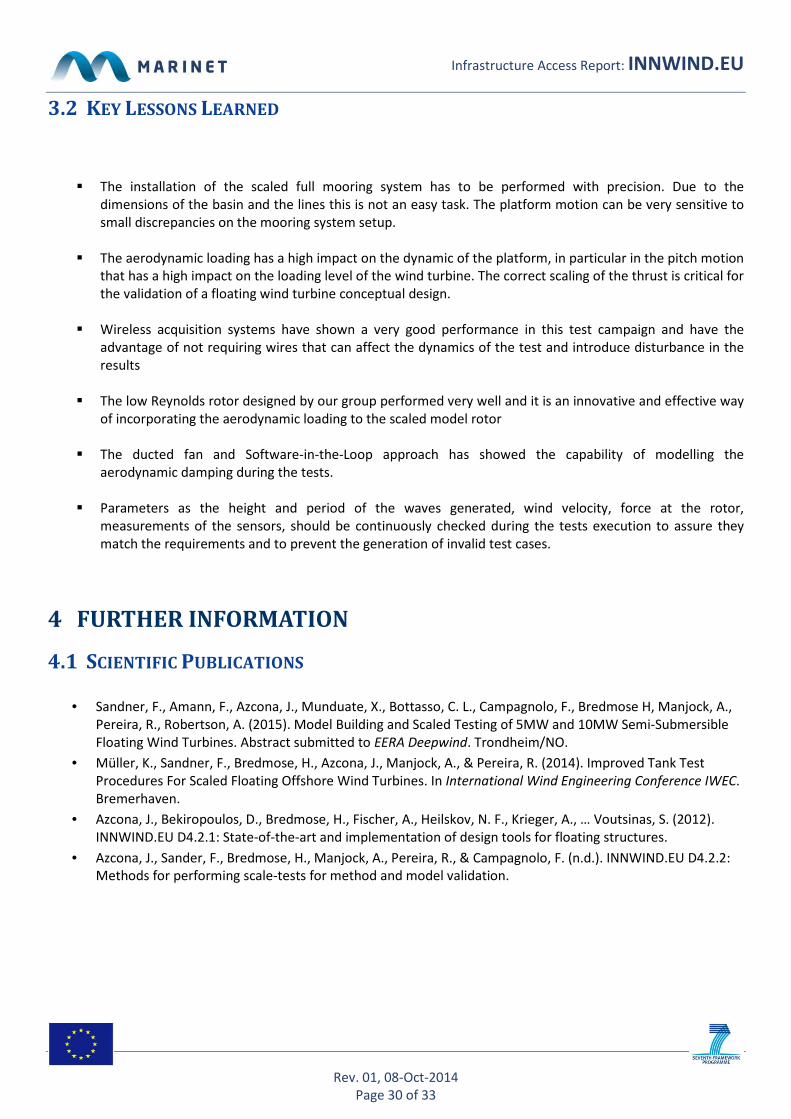
3.2 KEY LESSONS LEARNED
� The installation of the scaled full mooring system has to be performed with precision. Due to the
dimensions of the basin and the lines this is not an easy task. The platform motion can be very sensitive to
small discrepancies on the mooring system setup.
� The aerodynamic loading has a high impact on the dynamic of the platform, in particular in the pitch motion
that has a high impact on the loading level of the wind turbine. The correct scaling of the thrust is critical for
the validation of a floating wind turbine conceptual design.
� Wireless acquisition systems have shown a very good performance in this test campaign and have the
advantage of not requiring wires that can affect the dynamics of the test and introduce disturbance in the
results
� The low Reynolds rotor designed by our group performed very well and it is an innovative and effective way
of incorporating the aerodynamic loading to the scaled model rotor
� The ducted fan and Software-in-the-Loop approach has showed the capability of modelling the
aerodynamic damping during the tests.
� Parameters as the height and period of the waves generated, wind velocity, force at the rotor,
measurements of the sensors, should be continuously checked during the tests execution to assure they
match the requirements and to prevent the generation of invalid test cases.
4 FURTHER INFORMATION
4.1 SCIENTIFIC PUBLICATIONS
• Sandner, F., Amann, F., Azcona, J., Munduate, X., Bottasso, C. L., Campagnolo, F., Bredmose H, Manjock, A.,
Pereira, R., Robertson, A. (2015). Model Building and Scaled Testing of 5MW and 10MW Semi-Submersible
Floating Wind Turbines. Abstract submitted to EERA Deepwind. Trondheim/NO.
• Müller, K., Sandner, F., Bredmose, H., Azcona, J., Manjock, A., & Pereira, R. (2014). Improved Tank Test
Procedures For Scaled Floating Offshore Wind Turbines. In International Wind Engineering Conference IWEC.
Bremerhaven.
• Azcona, J., Bekiropoulos, D., Bredmose, H., Fischer, A., Heilskov, N. F., Krieger, A., … Voutsinas, S. (2012).
INNWIND.EU D4.2.1: State-of-the-art and implementation of design tools for floating structures.
• Azcona, J., Sander, F., Bredmose, H., Manjock, A., Pereira, R., & Campagnolo, F. (n.d.). INNWIND.EU D4.2.2:
Methods for performing scale-tests for method and model validation.
Infrastructure Access Report: INNWIND.EU
Rev. 01, 08-Oct-2014
Page 31 of 33
5 REFERENCES
[1] A. Robertson, J. Jonkman, M. Masciola, H. Song, A. Goupee, A. Coulling and C. Luan, "Definition of the
Semisubmersible Floating System for Phase II of OC4".
[2] J. Jonkman, S. Butterfield, W. Musial and G. Scott, "Definition of a 5-MW Reference Wind Turbine for Offshore
System Development Definition," no. February, 2009.
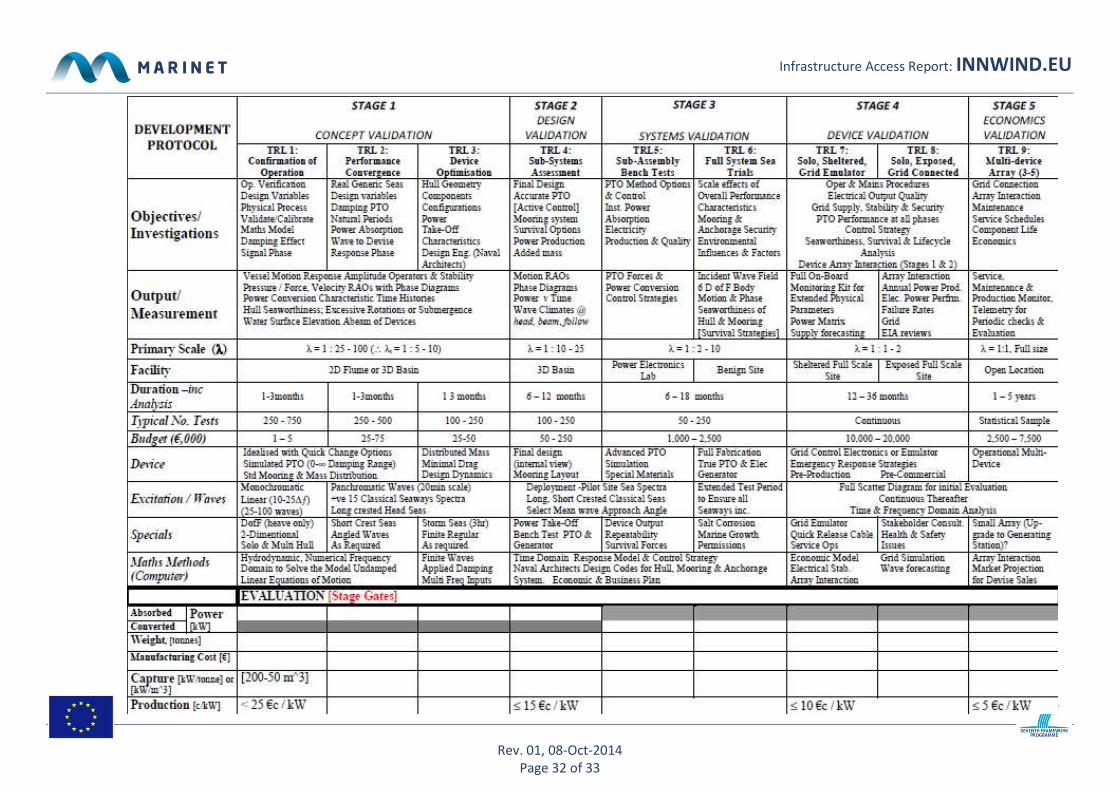
6 APPENDICES
6.1 STAGE DEVELOPMENT SUMMARY TABLE The table following offers an overview of the test programmes recommended by IEA-OES for each Technology
Readiness Level. This is only offered as a guide and is in no way extensive of the full test programme that should be
committed to at each TRL.
Infrastructure Access Report: INNWIND.EU
Rev. 01, 08-Oct-2014
Page 32 of 33

Infrastructure Access Report: INNWIND.EU
Rev. 01, 08-Oct-2014
Page 33 of 33
6.2 ANY OTHER APPENDICES


![A coupled floating offshore wind DeepWind 2016 turbine ... · • DTU 10MW reference wind turbine[1] – Designed for offshore application – Only tower is designed, no floating](https://img.dokumen.tips/doc/110x75/5f81b71936937067e57f6929/a-coupled-floating-offshore-wind-deepwind-2016-turbine-a-dtu-10mw-reference.jpg)