Embed Size (px)
Citation preview
User Preferences Modeling and
Learning for Pleasing Photo Collage
Generation
Simone Bianco and Gianluigi Ciocca
Dipartimento di Informatica Sistemistica e ComunicazioneUniversity of Milano-Bicocca
Viale Sarca 336, 20126, Milano, Italye-mail: [email protected]; [email protected]
Abstract: In this paper we consider how to automatically create pleasingphoto collages created by placing a set of images on a limited canvas area.The task is formulated as an optimization problem. Differently from exist-ing state-of-the-art approaches, we here exploit subjective experiments tomodel and learn pleasantness from user preferences. To this end, we designan experimental framework for the identification of the criteria that needto be taken into account to generate a pleasing photo collage. Five differentthematic photo datasets are used to create collages using state-of-the-artcriteria. A first subjective experiment where several subjects evaluated thecollages, emphasizes that different criteria are involved in the subjective def-inition of pleasantness. We then identify new global and local criteria anddesign algorithms to quantify them. The relative importance of these cri-teria are automatically learned by exploiting the user preferences, and newcollages are generated. To validate our framework, we performed severalpsycho-visual experiments involving different users. The results shows thatthe proposed framework allows to learn a novel computational model whicheffectively encodes an inter-user definition of pleasantness. The learned def-inition of pleasantness generalizes well to new photo datasets of differentthemes and sizes not used in the learning. Moreover, compared with twostate of the art approaches, the collages created using our framework arepreferred by the majority of the users.
Keywords and phrases: Image Processing and Computer Vision, Math-ematics of Computing, Optimization and Learning, Artificial Intelligence,Image Processing and Computer Vision, Applications.
1. Introduction
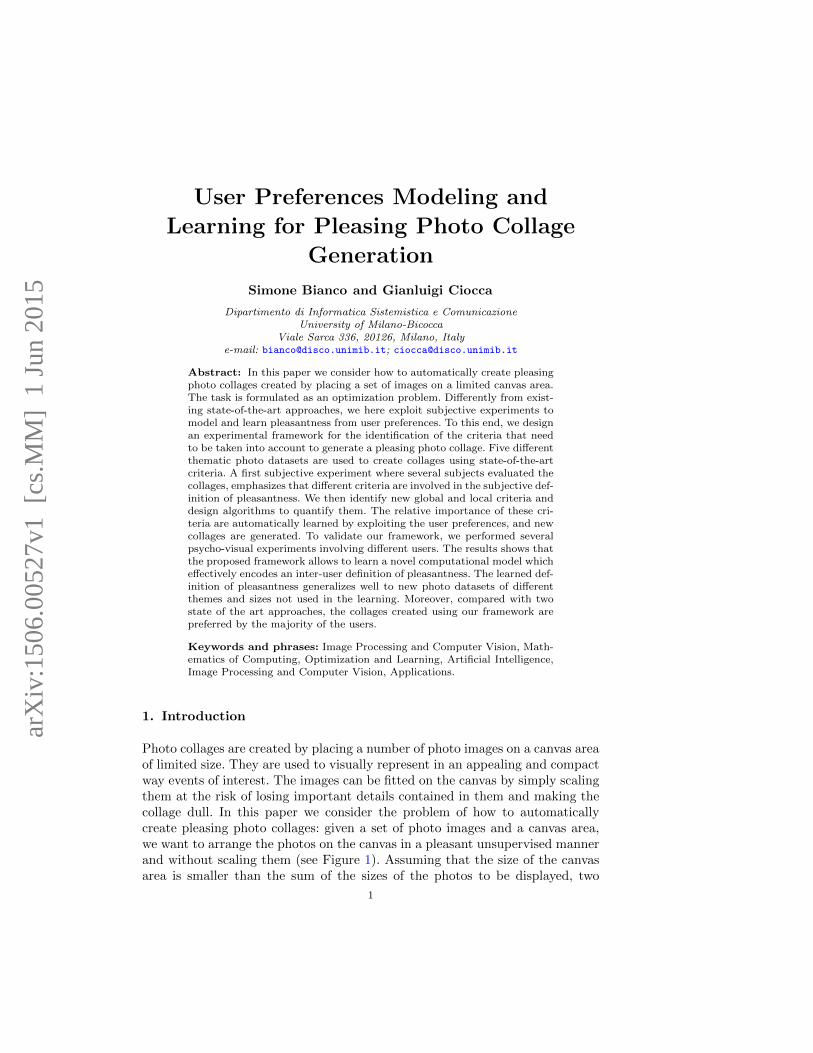
Photo collages are created by placing a number of photo images on a canvas areaof limited size. They are used to visually represent in an appealing and compactway events of interest. The images can be fitted on the canvas by simply scalingthem at the risk of losing important details contained in them and making thecollage dull. In this paper we consider the problem of how to automaticallycreate pleasing photo collages: given a set of photo images and a canvas area,we want to arrange the photos on the canvas in a pleasant unsupervised mannerand without scaling them (see Figure 1). Assuming that the size of the canvasarea is smaller than the sum of the sizes of the photos to be displayed, two
1
arX
iv:1
506.
0052
7v1
[cs
.MM
] 1
Jun
201
5
2 S. Bianco and G. Ciocca
Fig 1. Example photo collage created by placing a number of photo images on a canvas areaof limited size.
main issues arise. The first is that photos may occlude themselves, the secondis that photos may be partially outside the canvas area. These issues must beaddressed by taking into account the pleasantness of the resulting collage that isinfluenced by the order with which the photos are placed on the canvas and theirspatial arrangement. Usually, the most important photos are placed at the top ofthe less important ones in order to minimize the risk of being severely occluded,and composition properties related to photo contents, geometric constraints andaesthetic consideration are taken into account to maximize the pleasantness ofthe resulting collage. The criteria that define what is important in a photo andwhat composition properties should be satisfied may vary from user to user.Moreover the single criteria may compete against each other. To be used inan automatic system for photo collage generation, the pleasantness criteria andtheir relative importance must be properly quantified using suitable algorithms.At the end of this process a fitness function can be defined whose value representsthe overall degree of pleasantness of a photo collage. To obtain the most pleasantcollage, an automatic algorithm must search the best arrangement of the photosby maximizing the value of the fitness function. For this purpose an optimizationalgorithm is usually exploited. Several formulations of some of the above criteriahave been proposed in the literature but none of the existing works performedan user study in order to actually determine what are the criteria that made aphoto important, what constraints must be satisfied in order to have a collagebalanced, or what hints users pay attention to in judging the pleasantness ofa photo collage. We argue that if we could elicit the criteria by modeling thepreferences of the users, we would be able to create more pleasant photo collages.
1.1. Related Work
Previous works on photo collage can be categorized into two main groups de-pending on the processing applied to the photos. These two groups are: content-preserving and non content-preserving.
In the non content-preserving group belong the photo collage methods thatselect relevant regions within the photos in order to maximize the informationthat is conveyed in the final collage. The methods ensure that these regions
User Preferences Modeling and Learning for Pleasing Photo Collage Generation 3
are made visible in the final collage while the less relevant regions are eitherremoved (cropping) or hidden by other, more relevant, ones (hiding). In additionto scaling and translation, these methods usually perform a layering of thephotos to decide the order with which they are positioned on the canvas and/orrotate the photos to further preserve their content as much as possible.
Among the methods that also apply a rotation operation on the photos, wefind Picture Collage [37, 26] that is the one of the first works that formalized theproblem of photo collage as an optimization problem using different, competingcollage criteria, namely image saliency, blank space, and saliency raio balance.Inspired by this work is the collage strategy proposed in [2] which uses the samecriteria but images are firstly classified into three categories and then differ-ent relevant region detection strategies are adopted on the basis of the imagecategory. Also inspired by the work of [37] are the improved collage strategiesproposed by [38] and [41] where the collages can be also interactively modified bythe user. A recent photo collage approach [42] uses a heuristic search process toensure that salient information of each photo is displayed in the polygonal arearesulting from a power-diagram-based circle packing algorithm. Most of the pre-vious approaches use a saliency map, solely or coupled with other descriptors, asinformativeness criteria. In [13] instead, the informativeness criteria correspondsto foreground objects detected on depth maps. Finally, differently from all theaforementioned approaches, the method proposed in [19] creates Arcimboldo-like collages with multiple thematically-related cutouts from filtered Internetimages.
The stained glass-like photo collage by [15] is one of the methods that pre-serve the photo orientation without rotating them. The photos are cropped withrespect to the contained face regions. These cropped regions have straight edgesthat are used to arrange the photos on the canvas. Digital Tapestry [33] subdi-vides the photo into a set of sub-blocks and from them, the relevant regions ofthe photo are reconstructed and merged together. A pixel-based variant of thisapproach, named AutoCollage, is described in [34]. Here the relevant regions,with variable shapes are merged with a seamless blending that ensures that nosharp boundaries between them are formed in the final collage. A similar ap-proach is the Mobile Photo Collage presented in [25]. The Puzzle-Like collage[16] instead, cuts out from each photo an irregular shaped region which followsthe area surrounding a relevant object within the image. Finally, we can citethe Dynamic Media Assemblage [27], a photo collage approach that can be usedto summarize video content as well as a photo collection in a stained glass-likecollage.
In the content-preserving group belong those methods that arrange the pho-tos according to the relevance of their content defined in some way. The onlyoperations performed on them are scaling and translation. Usually the mostrelevant photos are scaled bigger than the less relevant ones, and they are posi-tioned on the most salient regions of the canvas. Moreover the aspect ratio of thephotos is preserved. These methods are also referred as photo layout methods.
An example is the work of [7] where the photo layout is constructed usinga larger topic photo and several small-size supportive photos. The photos are
4 S. Bianco and G. Ciocca
Fig 2. Experimental framework.
selected and sized according to their temporal and content coherence. A similarapproach is exploited in [5] on video sequences where key-frames in a visualsummary are arranged on the canvas using the narrative grammar of comics.Also within this group we can cite the work of [6] where exclusion zones areused to layout a set of photos on a canvas using different spatial criteria. Thismethod was further improved in [14]. In [35] spatial criteria are coupled withaesthetic principles to layout photos in a pleasant composition. Recently, takingadvantage of information usually found in social networking, and building onthe previous PicWall work [39], FriendWall ([40]) uses social attributes (intrinsiclabels) to create photo collage employing both image visual features and asso-ciated Metadata. As a final example, we can cite the interactive approach [10]where pre-designed layout templates of annotated cells are used to arrange thephotos according to their metadata, and focus area can be selected by the user.
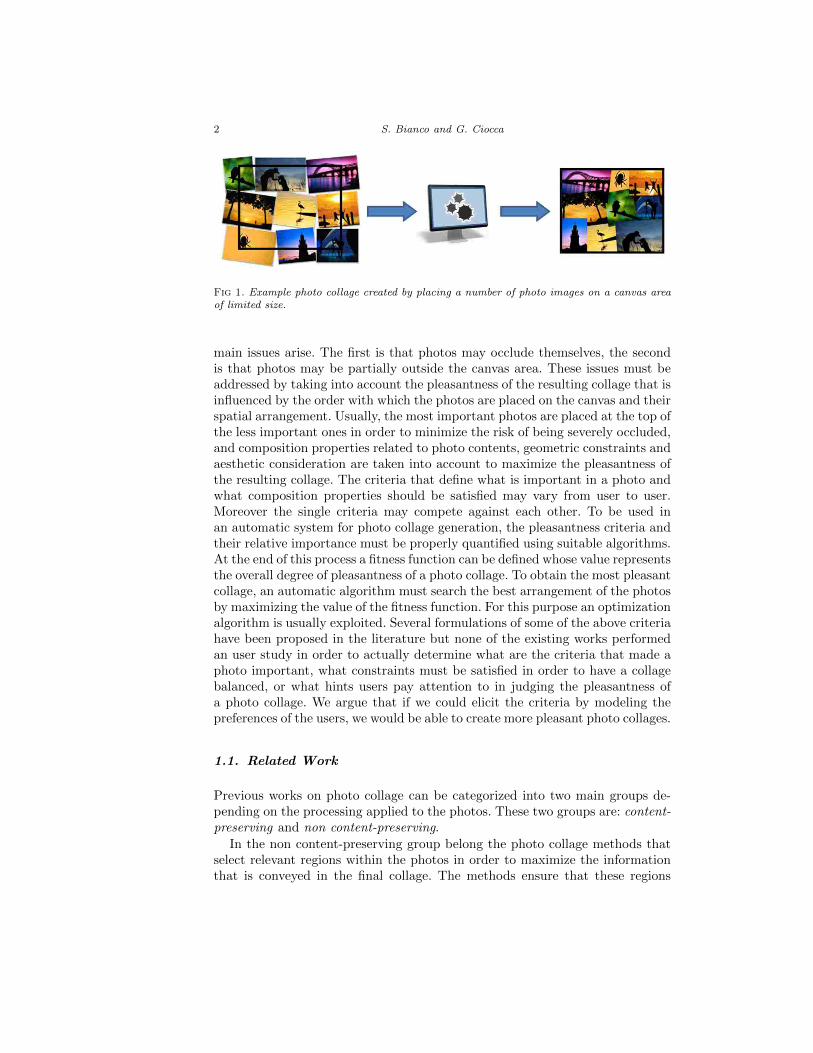
1.2. Paper Contribution and Organization
The focus of this work is to exploit subjective experiments to model user pref-erences in order to learn what criteria (and to what extent) need to be takeninto account to automatically generate a pleasing photo collage. To this end wedesigned an experimental framework that incorporates the identification of thecriteria via user preference modeling, the implementation of the correspond-ing computational algorithms, the learning of their relative importance, andthe validation of the results. We applied our framework in the context of noncontent-preserving collages. We believe that this category permits to investigatemore criteria underlying the definition of pleasantness as the associated prob-lem has more degrees of freedom than the one associated to content-preservingcollages. However, our proposed framework can be adapted to these methods aswell. The different steps of our framework are depicted in Figure 2. A first sub-jective experiment is conducted to investigate how different criteria are involvedin the user subjective definition of pleasantness. For this experiment, we redefinethe three basic criteria (image informativeness, canvas area coverage, and infor-mation ratio balance) exploited in most of the works in the state-of-the-art (e.g.[37, 2]). We evaluate three different representations of image informativeness:the first one, which is usually used in the state-of-the-art, is based on saliency;the other two are based on quality and color harmony respectively, and are hereintroduced. Collages are created by exploiting a Direct Search optimization al-
User Preferences Modeling and Learning for Pleasing Photo Collage Generation 5
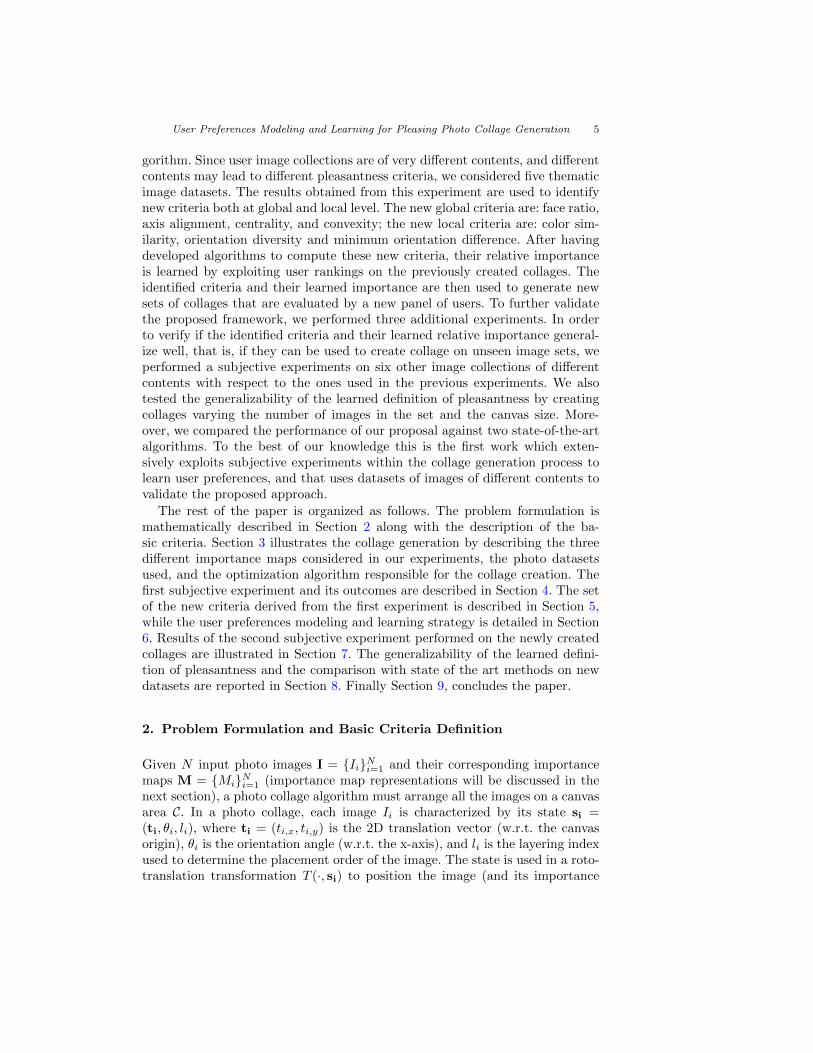
gorithm. Since user image collections are of very different contents, and differentcontents may lead to different pleasantness criteria, we considered five thematicimage datasets. The results obtained from this experiment are used to identifynew criteria both at global and local level. The new global criteria are: face ratio,axis alignment, centrality, and convexity; the new local criteria are: color sim-ilarity, orientation diversity and minimum orientation difference. After havingdeveloped algorithms to compute these new criteria, their relative importanceis learned by exploiting user rankings on the previously created collages. Theidentified criteria and their learned importance are then used to generate newsets of collages that are evaluated by a new panel of users. To further validatethe proposed framework, we performed three additional experiments. In orderto verify if the identified criteria and their learned relative importance general-ize well, that is, if they can be used to create collage on unseen image sets, weperformed a subjective experiments on six other image collections of differentcontents with respect to the ones used in the previous experiments. We alsotested the generalizability of the learned definition of pleasantness by creatingcollages varying the number of images in the set and the canvas size. More-over, we compared the performance of our proposal against two state-of-the-artalgorithms. To the best of our knowledge this is the first work which exten-sively exploits subjective experiments within the collage generation process tolearn user preferences, and that uses datasets of images of different contents tovalidate the proposed approach.
The rest of the paper is organized as follows. The problem formulation ismathematically described in Section 2 along with the description of the ba-sic criteria. Section 3 illustrates the collage generation by describing the threedifferent importance maps considered in our experiments, the photo datasetsused, and the optimization algorithm responsible for the collage creation. Thefirst subjective experiment and its outcomes are described in Section 4. The setof the new criteria derived from the first experiment is described in Section 5,while the user preferences modeling and learning strategy is detailed in Section6. Results of the second subjective experiment performed on the newly createdcollages are illustrated in Section 7. The generalizability of the learned defini-tion of pleasantness and the comparison with state of the art methods on newdatasets are reported in Section 8. Finally Section 9, concludes the paper.
2. Problem Formulation and Basic Criteria Definition
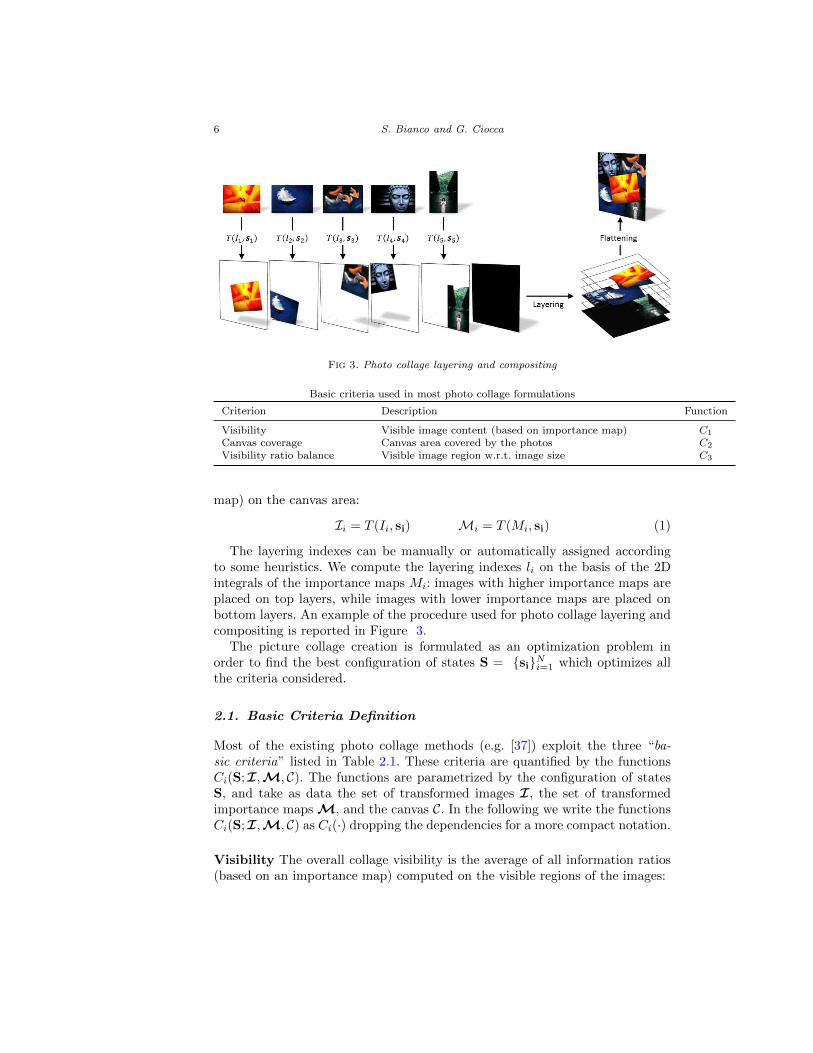
Given N input photo images I = {Ii}Ni=1 and their corresponding importancemaps M = {Mi}Ni=1 (importance map representations will be discussed in thenext section), a photo collage algorithm must arrange all the images on a canvasarea C. In a photo collage, each image Ii is characterized by its state si =(ti, θi, li), where ti = (ti,x, ti,y) is the 2D translation vector (w.r.t. the canvasorigin), θi is the orientation angle (w.r.t. the x-axis), and li is the layering indexused to determine the placement order of the image. The state is used in a roto-translation transformation T (·, si) to position the image (and its importance
6 S. Bianco and G. Ciocca
Fig 3. Photo collage layering and compositing
Basic criteria used in most photo collage formulations
Criterion Description Function
Visibility Visible image content (based on importance map) C1
Canvas coverage Canvas area covered by the photos C2
Visibility ratio balance Visible image region w.r.t. image size C3
map) on the canvas area:
Ii = T (Ii, si) Mi = T (Mi, si) (1)
The layering indexes can be manually or automatically assigned accordingto some heuristics. We compute the layering indexes li on the basis of the 2Dintegrals of the importance maps Mi: images with higher importance maps areplaced on top layers, while images with lower importance maps are placed onbottom layers. An example of the procedure used for photo collage layering andcompositing is reported in Figure 3.
The picture collage creation is formulated as an optimization problem inorder to find the best configuration of states S = {si}Ni=1 which optimizes allthe criteria considered.
2.1. Basic Criteria Definition
Most of the existing photo collage methods (e.g. [37]) exploit the three “ba-sic criteria” listed in Table 2.1. These criteria are quantified by the functionsCi(S;I,M, C). The functions are parametrized by the configuration of statesS, and take as data the set of transformed images I, the set of transformedimportance maps M, and the canvas C. In the following we write the functionsCi(S;I,M, C) as Ci(·) dropping the dependencies for a more compact notation.
Visibility The overall collage visibility is the average of all information ratios(based on an importance map) computed on the visible regions of the images:

User Preferences Modeling and Learning for Pleasing Photo Collage Generation 7
C1(·) =1
N
N∑i=1
sum2(vis(Mi))
sum2(Mi)(2)
where vis(·) is a function that computes the visible parts (taking into accountclipping and overlapping) of the given map, and sum2(·) is a function thatcomputes the 2D integrals of the map.
Canvas coverage The canvas coverage is defined as the ratio of canvas areacovered by the arranged photos:
C2(·) =1
area(C)
N∑i=1
area(vis(Mi)) (3)
where area(·) is a function that computes the area corresponding to the giveninput.
Visibility ratio balance The visibility ratio balance is computed as the stan-dard deviation of the information ratios:
C3(·) = 1− stdi=1...N
{sum2(vis(Mi))
sum2(Mi)
}(4)
where std{·} computes the standard deviation of the given values.
The values obtained are combined into a fitness function f that must bemaximized:
f(S;I,M, C) =
3∑i=1
λiCi(S;I,M, C) (5)
with λi, i = 1, . . . , 3, a weight used to define the contribution of the i-th criterion(usually fixed to 1). This fitness function is at the basis of most of the photocollage algorithms in the state-of-the-art.
3. Collage Generation
In the following subsections, assuming that a proper dataset of images is avail-able, we describe three different approaches to compute the image importancemap: the first approach is inspired by [28]; the other two are here introduced.We also describe the algorithm used to place the images on the canvas area bysearching the best configuration of states. The algorithm optimizes the fitnessfunction defined in Equation 5.
8 S. Bianco and G. Ciocca
Fig 4. The five thematic datasets. From top to bottom: Burst of Color III (Burst),FashionII (Fashion), Landscape V (Landscape), Self Portrait VII (Self), and Zen Photography III(Zen).
3.1. Photo Datasets
A collage is usually created from a set of images sharing a common underlyingtheme. To create our dataset, we downloaded the images from the DPChallenge1
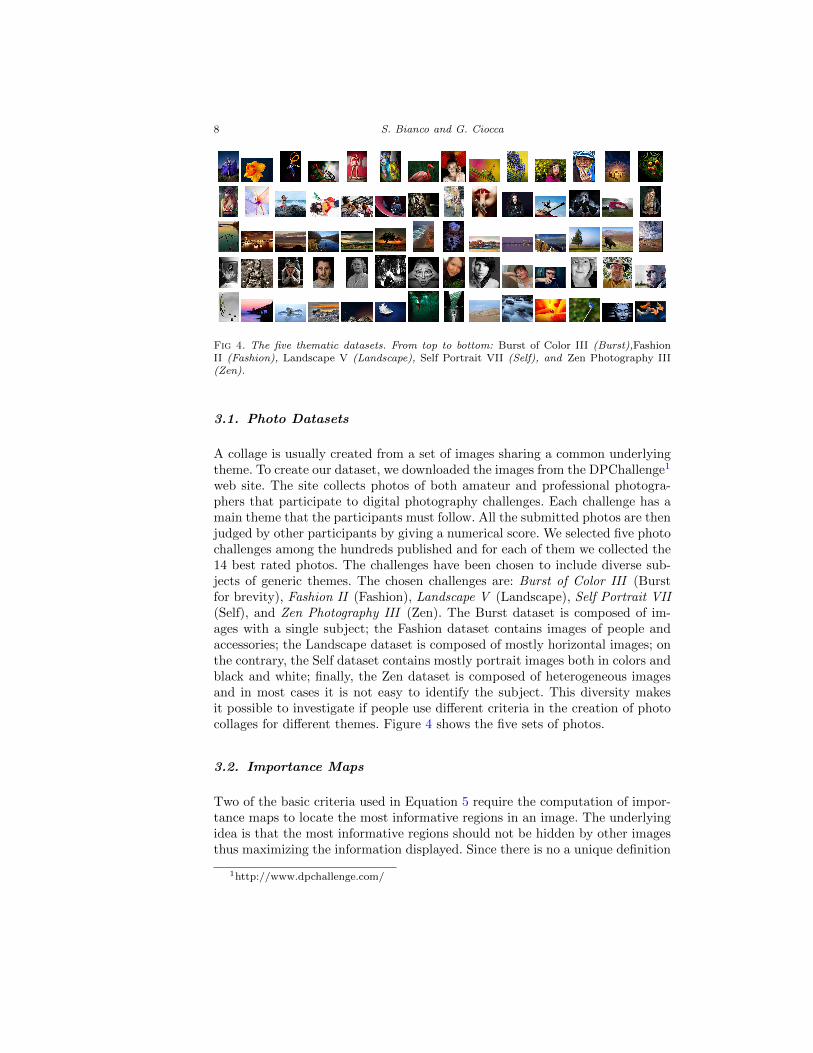
web site. The site collects photos of both amateur and professional photogra-phers that participate to digital photography challenges. Each challenge has amain theme that the participants must follow. All the submitted photos are thenjudged by other participants by giving a numerical score. We selected five photochallenges among the hundreds published and for each of them we collected the14 best rated photos. The challenges have been chosen to include diverse sub-jects of generic themes. The chosen challenges are: Burst of Color III (Burstfor brevity), Fashion II (Fashion), Landscape V (Landscape), Self Portrait VII(Self), and Zen Photography III (Zen). The Burst dataset is composed of im-ages with a single subject; the Fashion dataset contains images of people andaccessories; the Landscape dataset is composed of mostly horizontal images; onthe contrary, the Self dataset contains mostly portrait images both in colors andblack and white; finally, the Zen dataset is composed of heterogeneous imagesand in most cases it is not easy to identify the subject. This diversity makesit possible to investigate if people use different criteria in the creation of photocollages for different themes. Figure 4 shows the five sets of photos.
3.2. Importance Maps
Two of the basic criteria used in Equation 5 require the computation of impor-tance maps to locate the most informative regions in an image. The underlyingidea is that the most informative regions should not be hidden by other imagesthus maximizing the information displayed. Since there is no a unique definition
1http://www.dpchallenge.com/
User Preferences Modeling and Learning for Pleasing Photo Collage Generation 9
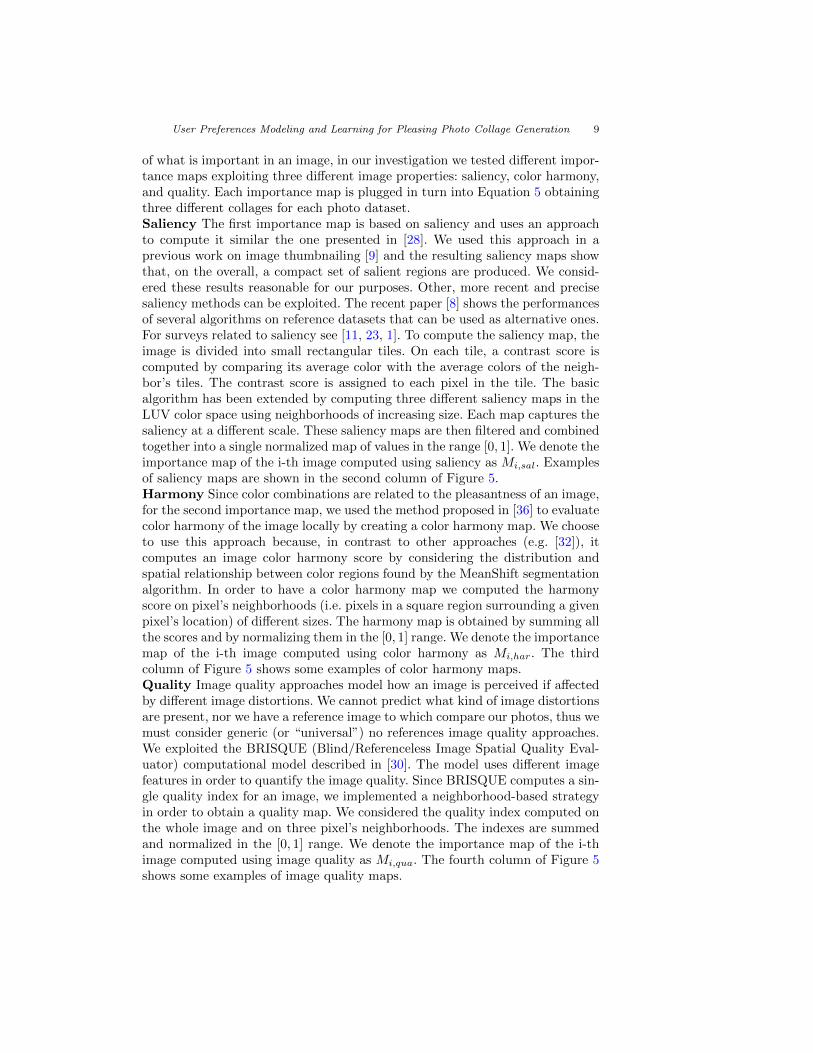
of what is important in an image, in our investigation we tested different impor-tance maps exploiting three different image properties: saliency, color harmony,and quality. Each importance map is plugged in turn into Equation 5 obtainingthree different collages for each photo dataset.Saliency The first importance map is based on saliency and uses an approachto compute it similar the one presented in [28]. We used this approach in aprevious work on image thumbnailing [9] and the resulting saliency maps showthat, on the overall, a compact set of salient regions are produced. We consid-ered these results reasonable for our purposes. Other, more recent and precisesaliency methods can be exploited. The recent paper [8] shows the performancesof several algorithms on reference datasets that can be used as alternative ones.For surveys related to saliency see [11, 23, 1]. To compute the saliency map, theimage is divided into small rectangular tiles. On each tile, a contrast score iscomputed by comparing its average color with the average colors of the neigh-bor’s tiles. The contrast score is assigned to each pixel in the tile. The basicalgorithm has been extended by computing three different saliency maps in theLUV color space using neighborhoods of increasing size. Each map captures thesaliency at a different scale. These saliency maps are then filtered and combinedtogether into a single normalized map of values in the range [0, 1]. We denote theimportance map of the i-th image computed using saliency as Mi,sal. Examplesof saliency maps are shown in the second column of Figure 5.Harmony Since color combinations are related to the pleasantness of an image,for the second importance map, we used the method proposed in [36] to evaluatecolor harmony of the image locally by creating a color harmony map. We chooseto use this approach because, in contrast to other approaches (e.g. [32]), itcomputes an image color harmony score by considering the distribution andspatial relationship between color regions found by the MeanShift segmentationalgorithm. In order to have a color harmony map we computed the harmonyscore on pixel’s neighborhoods (i.e. pixels in a square region surrounding a givenpixel’s location) of different sizes. The harmony map is obtained by summing allthe scores and by normalizing them in the [0, 1] range. We denote the importancemap of the i-th image computed using color harmony as Mi,har. The thirdcolumn of Figure 5 shows some examples of color harmony maps.Quality Image quality approaches model how an image is perceived if affectedby different image distortions. We cannot predict what kind of image distortionsare present, nor we have a reference image to which compare our photos, thus wemust consider generic (or “universal”) no references image quality approaches.We exploited the BRISQUE (Blind/Referenceless Image Spatial Quality Eval-uator) computational model described in [30]. The model uses different imagefeatures in order to quantify the image quality. Since BRISQUE computes a sin-gle quality index for an image, we implemented a neighborhood-based strategyin order to obtain a quality map. We considered the quality index computed onthe whole image and on three pixel’s neighborhoods. The indexes are summedand normalized in the [0, 1] range. We denote the importance map of the i-thimage computed using image quality as Mi,qua. The fourth column of Figure 5shows some examples of image quality maps.

10 S. Bianco and G. Ciocca
Original Saliency Harmony Quality
Fig 5. Examples of importance maps.
3.3. Optimization Algorithm
Let us consider, for now, a generic photo dataset and a generic importance mapdefinition. Under these assumptions, the optimal collage is generated by findingthe best configuration of states S which maximizes Equation 5. The solutionspace of this maximization problem is of mixed type: in fact for each statesi = (ti, θi, li) we have ti ∈ Z2, θi ∈ R, and li ∈ N. In order to uniform the statevariables types, and since small variations of θi do not affect the final collage,the allowed orientations are uniformly quantized in the range [−θmax, θmax].
The chosen optimization method is an extension of a Direct Search algorithm(DS) modified to deal with discrete solution spaces [4, 3]. DS is a derivative-freemethod for solving optimization problems [18, 24]. Since the focus of this paperis not on the optimization algorithm used, any non-gradient method could beused [31] as well as stochastic ones [17, 12].
The algorithm is initialized with a random configuration of states: the i-thimage is placed on the canvas at a random position ti and with a randomorientation θi. Its layering index instead is determined by the importance mapas previously described. At each iteration of the implemented DS algorithm,the algorithm finds the best configuration of states by testing the current bestconfiguration against all those obtained by varying the position and orientationin each image’s state. The position of each image is then updated and a newiteration is started. The algorithm terminates when the maximum number ofiterations has been reached.
We used the modified Direct Search algorithm without any heuristic whosecomputational cost is O(gan) with g being the number of grid points on thecanvas, a being the number of allowed orientation on ecah grid point, and nbeing the number of images to be placed. Other, more efficient, optimizationalgorithms can be used. Here we are interested in the effects of using differentcriteria in creating the photo collages, not the most efficient way to create them.
User Preferences Modeling and Learning for Pleasing Photo Collage Generation 11
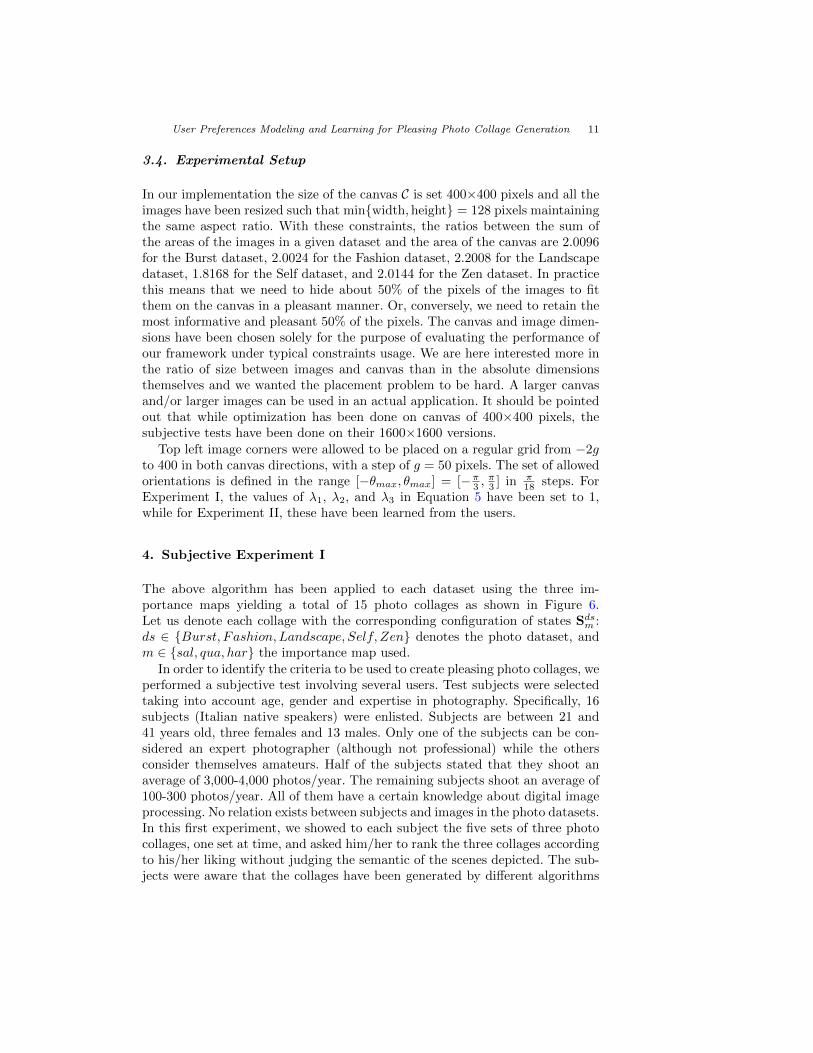
3.4. Experimental Setup
In our implementation the size of the canvas C is set 400×400 pixels and all theimages have been resized such that min{width,height} = 128 pixels maintainingthe same aspect ratio. With these constraints, the ratios between the sum ofthe areas of the images in a given dataset and the area of the canvas are 2.0096for the Burst dataset, 2.0024 for the Fashion dataset, 2.2008 for the Landscapedataset, 1.8168 for the Self dataset, and 2.0144 for the Zen dataset. In practicethis means that we need to hide about 50% of the pixels of the images to fitthem on the canvas in a pleasant manner. Or, conversely, we need to retain themost informative and pleasant 50% of the pixels. The canvas and image dimen-sions have been chosen solely for the purpose of evaluating the performance ofour framework under typical constraints usage. We are here interested more inthe ratio of size between images and canvas than in the absolute dimensionsthemselves and we wanted the placement problem to be hard. A larger canvasand/or larger images can be used in an actual application. It should be pointedout that while optimization has been done on canvas of 400×400 pixels, thesubjective tests have been done on their 1600×1600 versions.
Top left image corners were allowed to be placed on a regular grid from −2gto 400 in both canvas directions, with a step of g = 50 pixels. The set of allowedorientations is defined in the range [−θmax, θmax] = [−π3 ,
π3 ] in π
18 steps. ForExperiment I, the values of λ1, λ2, and λ3 in Equation 5 have been set to 1,while for Experiment II, these have been learned from the users.
4. Subjective Experiment I
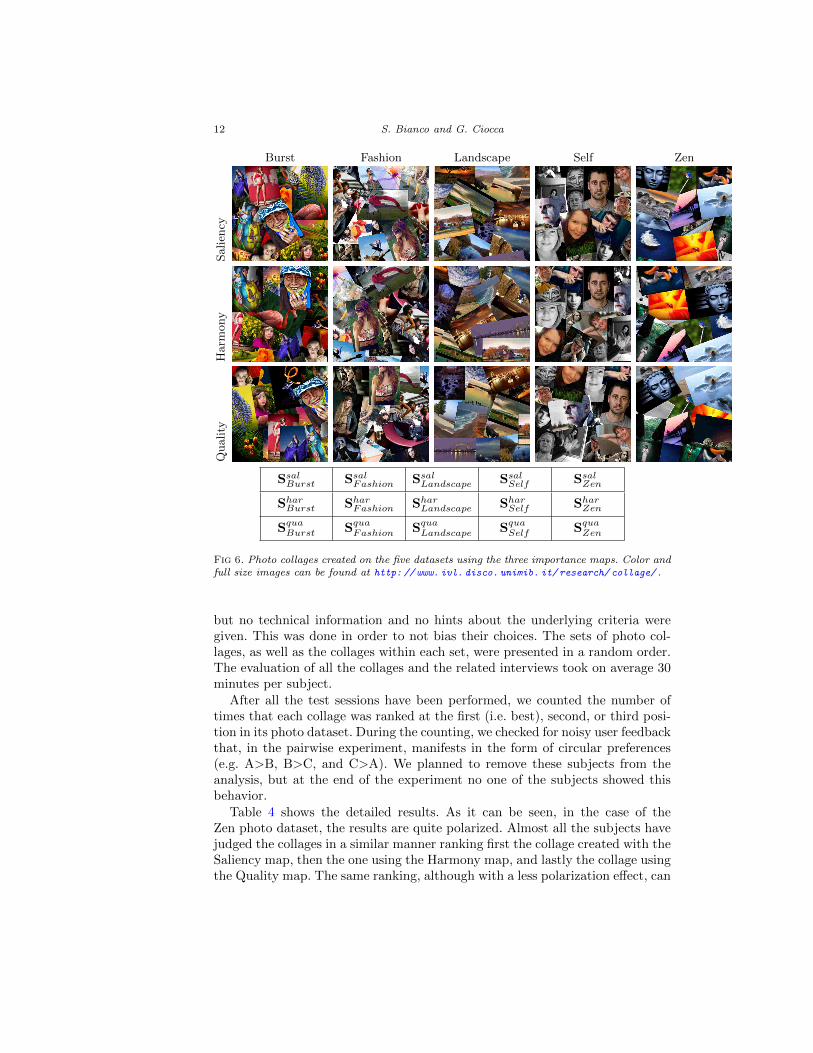
The above algorithm has been applied to each dataset using the three im-portance maps yielding a total of 15 photo collages as shown in Figure 6.Let us denote each collage with the corresponding configuration of states Sdsm :ds ∈ {Burst, Fashion, Landscape, Self, Zen} denotes the photo dataset, andm ∈ {sal, qua, har} the importance map used.
In order to identify the criteria to be used to create pleasing photo collages, weperformed a subjective test involving several users. Test subjects were selectedtaking into account age, gender and expertise in photography. Specifically, 16subjects (Italian native speakers) were enlisted. Subjects are between 21 and41 years old, three females and 13 males. Only one of the subjects can be con-sidered an expert photographer (although not professional) while the othersconsider themselves amateurs. Half of the subjects stated that they shoot anaverage of 3,000-4,000 photos/year. The remaining subjects shoot an average of100-300 photos/year. All of them have a certain knowledge about digital imageprocessing. No relation exists between subjects and images in the photo datasets.In this first experiment, we showed to each subject the five sets of three photocollages, one set at time, and asked him/her to rank the three collages accordingto his/her liking without judging the semantic of the scenes depicted. The sub-jects were aware that the collages have been generated by different algorithms
12 S. Bianco and G. Ciocca
Burst Fashion Landscape Self Zen
Salien
cyH
arm
ony
Quality
SsalBurst SsalFashion SsalLandscape SsalSelf SsalZen
SharBurst SharFashion SharLandscape SharSelf SharZen
SquaBurst SquaFashion SquaLandscape SquaSelf SquaZen
Fig 6. Photo collages created on the five datasets using the three importance maps. Color andfull size images can be found at http: // www. ivl. disco. unimib. it/ research/ collage/ .
but no technical information and no hints about the underlying criteria weregiven. This was done in order to not bias their choices. The sets of photo col-lages, as well as the collages within each set, were presented in a random order.The evaluation of all the collages and the related interviews took on average 30minutes per subject.
After all the test sessions have been performed, we counted the number oftimes that each collage was ranked at the first (i.e. best), second, or third posi-tion in its photo dataset. During the counting, we checked for noisy user feedbackthat, in the pairwise experiment, manifests in the form of circular preferences(e.g. A>B, B>C, and C>A). We planned to remove these subjects from theanalysis, but at the end of the experiment no one of the subjects showed thisbehavior.
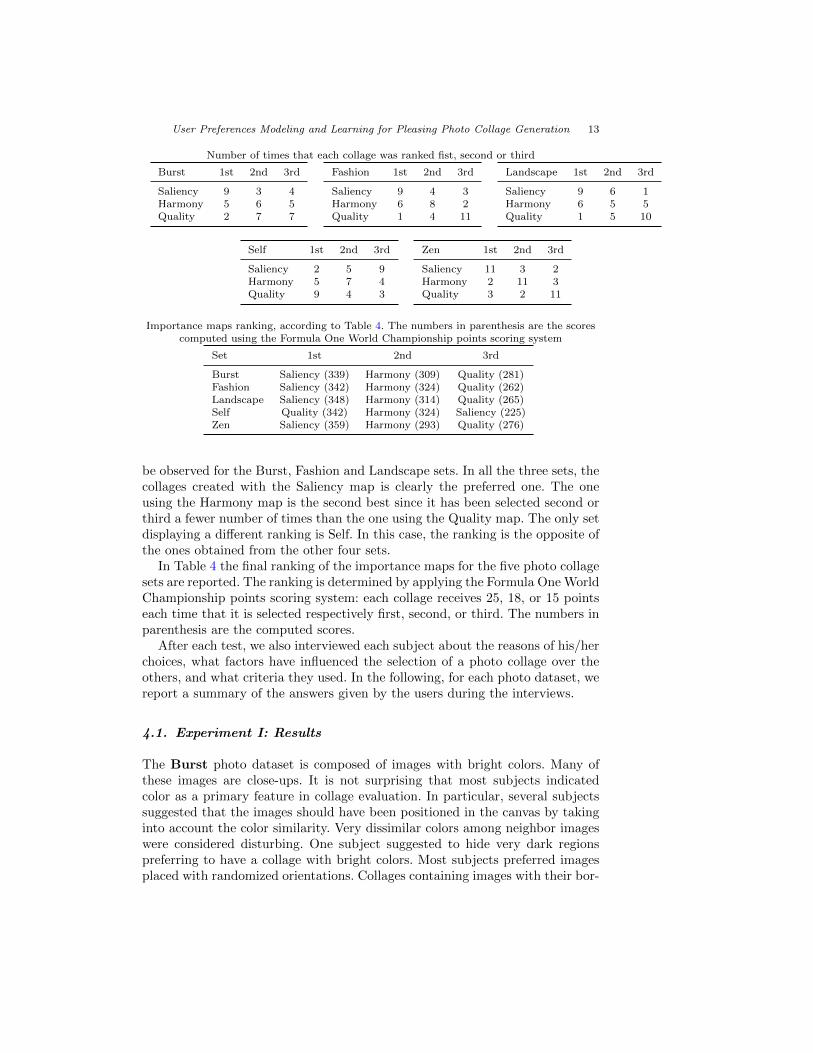
Table 4 shows the detailed results. As it can be seen, in the case of theZen photo dataset, the results are quite polarized. Almost all the subjects havejudged the collages in a similar manner ranking first the collage created with theSaliency map, then the one using the Harmony map, and lastly the collage usingthe Quality map. The same ranking, although with a less polarization effect, can
User Preferences Modeling and Learning for Pleasing Photo Collage Generation 13
Number of times that each collage was ranked fist, second or third
Burst 1st 2nd 3rd
Saliency 9 3 4Harmony 5 6 5Quality 2 7 7
Fashion 1st 2nd 3rd
Saliency 9 4 3Harmony 6 8 2Quality 1 4 11
Landscape 1st 2nd 3rd
Saliency 9 6 1Harmony 6 5 5Quality 1 5 10
Self 1st 2nd 3rd
Saliency 2 5 9Harmony 5 7 4Quality 9 4 3
Zen 1st 2nd 3rd
Saliency 11 3 2Harmony 2 11 3Quality 3 2 11
Importance maps ranking, according to Table 4. The numbers in parenthesis are the scorescomputed using the Formula One World Championship points scoring system
Set 1st 2nd 3rd
Burst Saliency (339) Harmony (309) Quality (281)Fashion Saliency (342) Harmony (324) Quality (262)Landscape Saliency (348) Harmony (314) Quality (265)Self Quality (342) Harmony (324) Saliency (225)Zen Saliency (359) Harmony (293) Quality (276)
be observed for the Burst, Fashion and Landscape sets. In all the three sets, thecollages created with the Saliency map is clearly the preferred one. The oneusing the Harmony map is the second best since it has been selected second orthird a fewer number of times than the one using the Quality map. The only setdisplaying a different ranking is Self. In this case, the ranking is the opposite ofthe ones obtained from the other four sets.
In Table 4 the final ranking of the importance maps for the five photo collagesets are reported. The ranking is determined by applying the Formula One WorldChampionship points scoring system: each collage receives 25, 18, or 15 pointseach time that it is selected respectively first, second, or third. The numbers inparenthesis are the computed scores.
After each test, we also interviewed each subject about the reasons of his/herchoices, what factors have influenced the selection of a photo collage over theothers, and what criteria they used. In the following, for each photo dataset, wereport a summary of the answers given by the users during the interviews.
4.1. Experiment I: Results
The Burst photo dataset is composed of images with bright colors. Many ofthese images are close-ups. It is not surprising that most subjects indicatedcolor as a primary feature in collage evaluation. In particular, several subjectssuggested that the images should have been positioned in the canvas by takinginto account the color similarity. Very dissimilar colors among neighbor imageswere considered disturbing. One subject suggested to hide very dark regionspreferring to have a collage with bright colors. Most subjects preferred imagesplaced with randomized orientations. Collages containing images with their bor-
14 S. Bianco and G. Ciocca
ders parallel to the canvas borders were penalized. Most of the images in thisdataset contain a single object of interest. Collages where this object was fullyvisible were thus preferred, in particular in the case of faces.
The Fashion photo dataset is mainly composed of images of full-body womenmodels. Only one image is a close-up. These images are less colorful than theBurst dataset but they contain high contrast regions. The main criterion usedin evaluating the collages was the visibility of the models. Several subjects alsoindicated that having the top layer image in a central position makes the col-lage more pleasing. Secondary criteria include the visibility of a (impossible tomodel) favourite image, and loss of bright colored regions. No other criteria weresuggested on this dataset.
The Landscape photo dataset contains images with mostly dull colors ifcompared against the previous ones. No people are visible and the scenes de-picted are mostly natural scenes. Several shots have a panoramic aspect ratio.For these reasons, according to the subjects, the collages created on this datasetresulted among the most difficult to be evaluated. Images arranged in a regularway were considered disturbing. If an image was mostly covered by the others(as for example the violet sunset in the collage created with the Saliency Map),it was considered acceptable by many users. On the overall, the collages wereoften considered equivalent.
The Self photo dataset was the easiest to evaluate probably because containsself portraits. As expected, the criteria arisen from the interviews referred mostlyto the visibility of the faces. One interesting insight on this dataset is that, eventhough we encouraged the subjects to avoid judging the image content fromthe semantic point of view, many choices were made based on the appealingof the faces depicted. For example, some subjects considered the photo of theclown unpleasant and thus a photo that could be covered before others. On thecontrary others considered this photo very artistic. It seems that when humanare depicted, personal preferences are difficult to ignore. This is the only datasetcontaining both gray-scale and color type of images. Some test subjects did notappreciate collages with spatial clusters of images of the same type.
The Zen photo dataset should inspire peace and tranquillity. It containsphotos with very few colors and details. They are mostly close-ups, and someof the photos show soft-focus effects. Most of the subjects found it difficult tojudge the collages and express the rationale behind their choices. However, colorcomposition and harmony were the most important criteria. The best collageswere those where the relevant objects were visible. One interesting criterionemerged on this dataset is that the shape of the visible image regions shouldnot be jagged. Regular (i.e. convex) shapes are considered more appealing.
5. New Criteria Definition
From the results reported in the previous section, we can see that the usersevaluated the collages using different criteria. These criteria are both local andglobal. Local criteria refer to either properties of single images or of their neigh-borhoods, while global criteria refer to properties of the collage seen as a whole.
User Preferences Modeling and Learning for Pleasing Photo Collage Generation 15
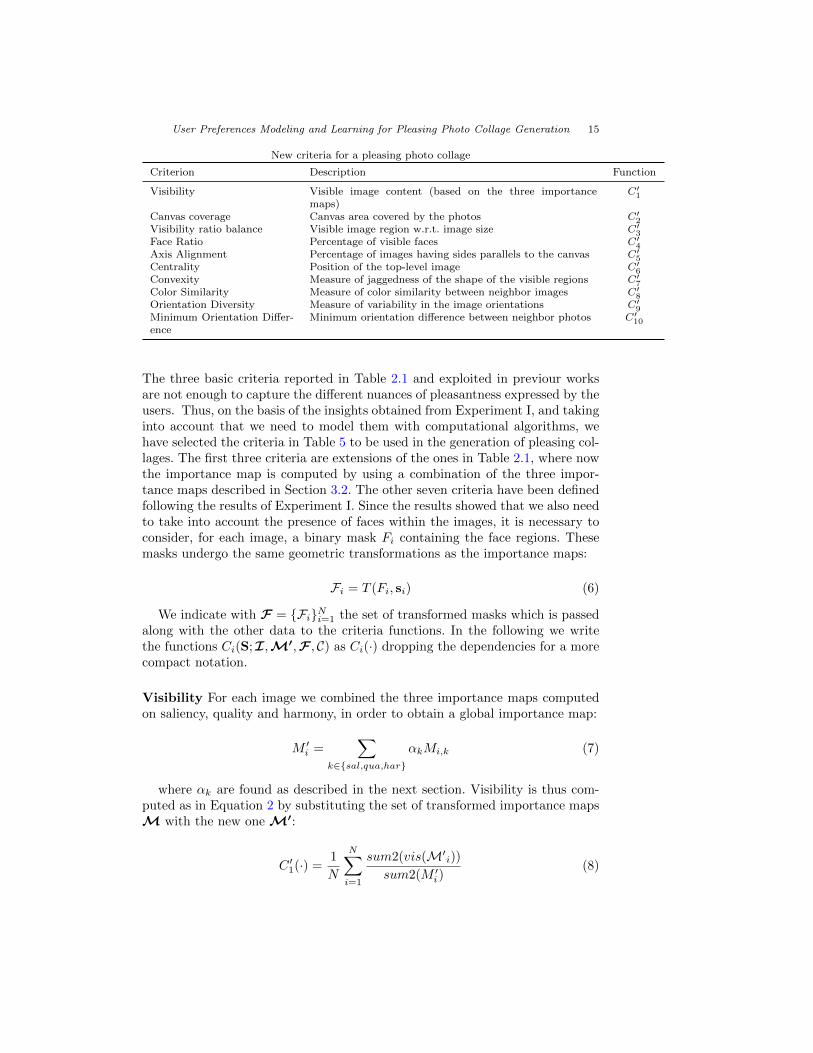
New criteria for a pleasing photo collage
Criterion Description Function
Visibility Visible image content (based on the three importancemaps)
C′1
Canvas coverage Canvas area covered by the photos C′2
Visibility ratio balance Visible image region w.r.t. image size C′3
Face Ratio Percentage of visible faces C′4
Axis Alignment Percentage of images having sides parallels to the canvas C′5
Centrality Position of the top-level image C′6
Convexity Measure of jaggedness of the shape of the visible regions C′7
Color Similarity Measure of color similarity between neighbor images C′8
Orientation Diversity Measure of variability in the image orientations C′9
Minimum Orientation Differ-ence
Minimum orientation difference between neighbor photos C′10
The three basic criteria reported in Table 2.1 and exploited in previour worksare not enough to capture the different nuances of pleasantness expressed by theusers. Thus, on the basis of the insights obtained from Experiment I, and takinginto account that we need to model them with computational algorithms, wehave selected the criteria in Table 5 to be used in the generation of pleasing col-lages. The first three criteria are extensions of the ones in Table 2.1, where nowthe importance map is computed by using a combination of the three impor-tance maps described in Section 3.2. The other seven criteria have been definedfollowing the results of Experiment I. Since the results showed that we also needto take into account the presence of faces within the images, it is necessary toconsider, for each image, a binary mask Fi containing the face regions. Thesemasks undergo the same geometric transformations as the importance maps:
Fi = T (Fi, si) (6)
We indicate with F = {Fi}Ni=1 the set of transformed masks which is passedalong with the other data to the criteria functions. In the following we writethe functions Ci(S;I,M′,F , C) as Ci(·) dropping the dependencies for a morecompact notation.
Visibility For each image we combined the three importance maps computedon saliency, quality and harmony, in order to obtain a global importance map:
M ′i =
∑k∈{sal,qua,har}
αkMi,k (7)
where αk are found as described in the next section. Visibility is thus com-puted as in Equation 2 by substituting the set of transformed importance mapsM with the new one M′:
C ′1(·) =
1
N
N∑i=1
sum2(vis(M′i))
sum2(M ′i)
(8)
16 S. Bianco and G. Ciocca
Canvas coverage The definition of the canvas coverage is identical to thedefinition of C2 in Equation 3:
C ′2(·) =
1
area(C)
N∑i=1
area(vis(M′i)) (9)
Visibility ratio balance The ratio balance is computed as in Equation 4:
C ′3(·) = 1− std
i=1...N
{sum2(vis(M′
i))
sum2(M ′i)
}(10)
Face ratio A face detector is run on each image Ii to find the mask containingthe face regions (i.e. face bounding boxes). Let the mask Fi be
Fi(x, y) =
{1 if (x, y) ∈ face region0 otherwise
(11)
the face ratio feature is then defined as follows:
C ′4(·) =
∑Ni=1 sum2(vis(Fi))∑N
i=1 sum2(Fi)(12)
Axis alignment This feature measures the ratio of images with orientationparallel to the axis, i.e. 0 given that θmax = π
3 .
C ′5(·) =
#{si ∈ S : θi = 0}N
(13)
Centrality The centrality feature measures how central is the image in the firstlayer, i.e. the top-most image. Let us call c1 = (x1, y1) the centroid of the visiblepart of the image in the top layer and c0 = (x0, y0) the centroid of the canvasC. The centrality is defined as:
C ′6(·) = 1−
‖c1 − c0‖2hdiag(C)
(14)
where hdiag(·) is used to compute the half diagonal length.
Convexity For each transformed image Ii the convexity ratio is defined as ratiobetween the area corresponding to the image’s visible region and the area of itsconvex hull. The convexity feature is computed as the minimum convexity ratioover all the transformed images:
C ′7(·) = min
i=1,...,N
{area(vis(Ii))
area(convex(vis(Ii)))
}(15)
User Preferences Modeling and Learning for Pleasing Photo Collage Generation 17
Color similarity This feature is computed by evaluating the color histogramsimilarity of each image on the canvas with respect to its neighbors. For eachimage we first compute:
di =∑
j∈neigh(Ii)
χ2(hist(vis(Ii)), hist(vis(Ij))) (16)
where hist(vis(Ii)) is the color histogram computed on the visible portion of Ii,χ2 is the chi-squared distance, and neigh(Ii) represents the set of the indexesof the images neighbors of Ii. Color similarity is then computed as:
C ′8(·) =
1
N
N∑i=1
di#{neigh(Ii)}
(17)
Orientation diversity This feature measures the average of the variance inorientation in each set of neighbor images:
C ′9(·) =
1
N
N∑i=1
stdj∈NI
{θjθmax
}(18)
where NI = neigh(Ii) ∪ {i} and θmax is the maximum rotation angle allowed.
Minimum orientation difference This feature measures the average of theminimum orientation differences between each image Ii and its neighboring setneigh(Ii):
C ′10(·) =
1
N
N∑i=1
minj∈neigh(Ii)
{|θi − θj |θmax
}(19)
The new fitness function f ′(·) to be optimized in the generation of pleasingphoto collages, can be compactly written as:
f ′(S;I,M′,F , C) =10∑i=1
λ′iC′i(S;I,M′,F , C) (20)
where each λ′i weights the contribution of criterion C ′i, and are found as
described in the next section. Please recall that the fitness function also dependson the three weights αk introduced in Equation 7, and that are used to computethe new importance maps.
6. User Preferences Modeling and Learning
Given as input the values C ′i, i = 1, . . . , 10, we want to learn a single set of
optimal weights [λ′,α] =[{λ′i}10i=1, {αi}i∈{sal,qua,har}
]to be plugged into Equa-
tion 20 so that they produce fitness values in accordance with user preferences
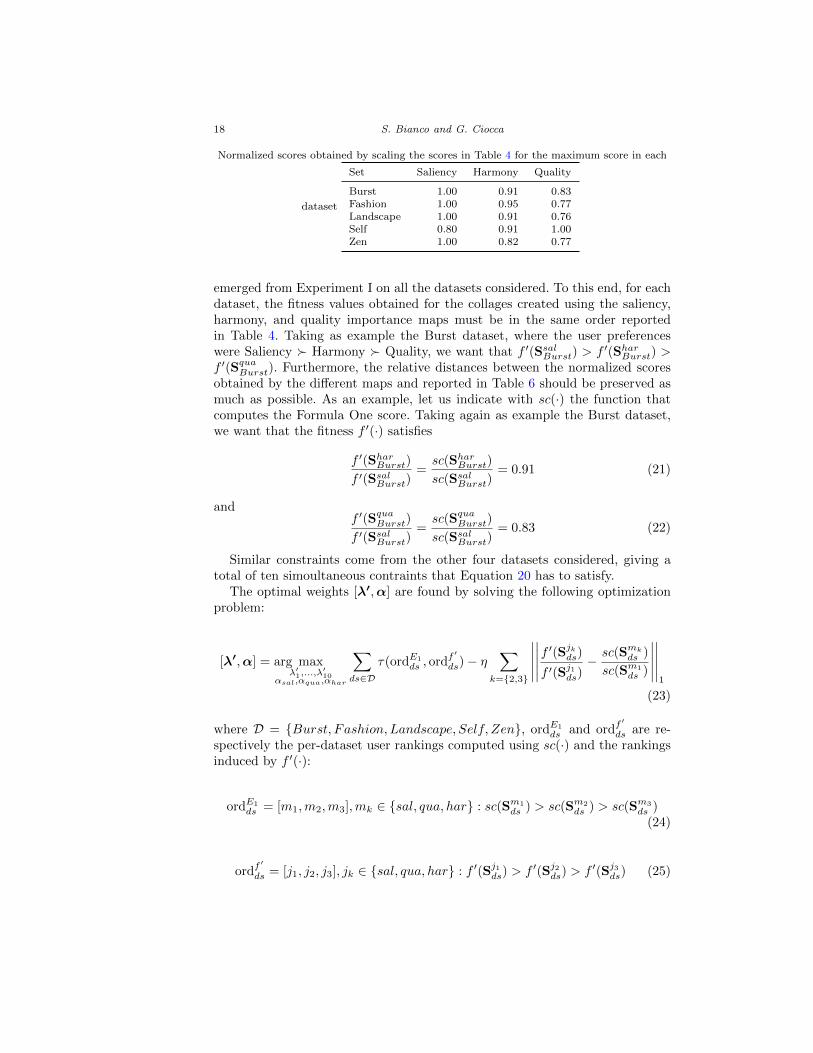
18 S. Bianco and G. Ciocca
Normalized scores obtained by scaling the scores in Table 4 for the maximum score in each
dataset
Set Saliency Harmony Quality
Burst 1.00 0.91 0.83Fashion 1.00 0.95 0.77Landscape 1.00 0.91 0.76Self 0.80 0.91 1.00Zen 1.00 0.82 0.77
emerged from Experiment I on all the datasets considered. To this end, for eachdataset, the fitness values obtained for the collages created using the saliency,harmony, and quality importance maps must be in the same order reportedin Table 4. Taking as example the Burst dataset, where the user preferenceswere Saliency � Harmony � Quality, we want that f ′(SsalBurst) > f ′(SharBurst) >f ′(SquaBurst). Furthermore, the relative distances between the normalized scoresobtained by the different maps and reported in Table 6 should be preserved asmuch as possible. As an example, let us indicate with sc(·) the function thatcomputes the Formula One score. Taking again as example the Burst dataset,we want that the fitness f ′(·) satisfies
f ′(SharBurst)
f ′(SsalBurst)=sc(SharBurst)
sc(SsalBurst)= 0.91 (21)
andf ′(SquaBurst)
f ′(SsalBurst)=sc(SquaBurst)
sc(SsalBurst)= 0.83 (22)
Similar constraints come from the other four datasets considered, giving atotal of ten simoultaneous contraints that Equation 20 has to satisfy.
The optimal weights [λ′,α] are found by solving the following optimizationproblem:
[λ′,α] = arg maxλ′1,...,λ
′10
αsal,αqua,αhar
∑ds∈D
τ(ordE1
ds , ordf′
ds)− η∑
k={2,3}
∣∣∣∣∣∣∣∣∣∣f ′(Sjkds)f ′(Sj1ds)
−sc(Smk
ds )
sc(Sm1
ds )
∣∣∣∣∣∣∣∣∣∣1
(23)
where D = {Burst, Fashion, Landscape, Self, Zen}, ordE1
ds and ordf′
ds are re-spectively the per-dataset user rankings computed using sc(·) and the rankingsinduced by f ′(·):
ordE1
ds = [m1,m2,m3],mk ∈ {sal, qua, har} : sc(Sm1
ds ) > sc(Sm2
ds ) > sc(Sm3
ds )(24)
ordf′
ds = [j1, j2, j3], jk ∈ {sal, qua, har} : f ′(Sj1ds) > f ′(Sj2ds) > f ′(Sj3ds) (25)
User Preferences Modeling and Learning for Pleasing Photo Collage Generation 19
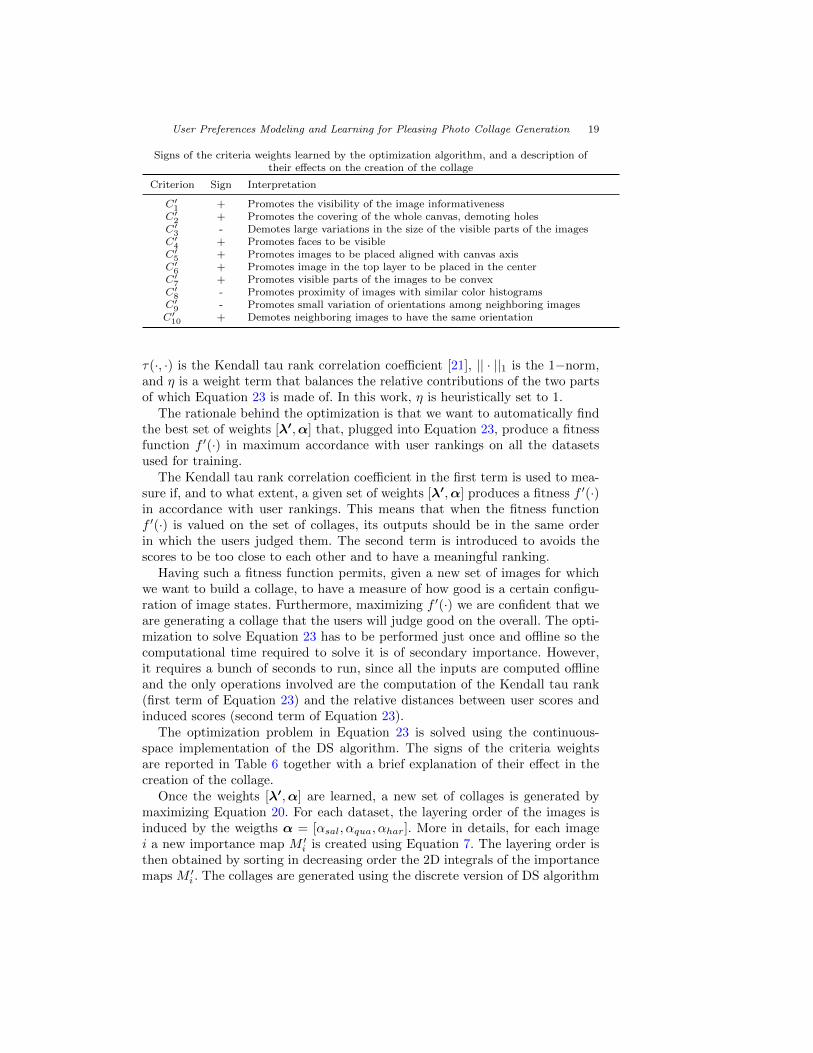
Signs of the criteria weights learned by the optimization algorithm, and a description oftheir effects on the creation of the collage
Criterion Sign Interpretation
C′1 + Promotes the visibility of the image informativeness
C′2 + Promotes the covering of the whole canvas, demoting holes
C′3 - Demotes large variations in the size of the visible parts of the images
C′4 + Promotes faces to be visible
C′5 + Promotes images to be placed aligned with canvas axis
C′6 + Promotes image in the top layer to be placed in the center
C′7 + Promotes visible parts of the images to be convex
C′8 - Promotes proximity of images with similar color histograms
C′9 - Promotes small variation of orientations among neighboring images
C′10 + Demotes neighboring images to have the same orientation
τ(·, ·) is the Kendall tau rank correlation coefficient [21], || · ||1 is the 1−norm,and η is a weight term that balances the relative contributions of the two partsof which Equation 23 is made of. In this work, η is heuristically set to 1.
The rationale behind the optimization is that we want to automatically findthe best set of weights [λ′,α] that, plugged into Equation 23, produce a fitnessfunction f ′(·) in maximum accordance with user rankings on all the datasetsused for training.
The Kendall tau rank correlation coefficient in the first term is used to mea-sure if, and to what extent, a given set of weights [λ′,α] produces a fitness f ′(·)in accordance with user rankings. This means that when the fitness functionf ′(·) is valued on the set of collages, its outputs should be in the same orderin which the users judged them. The second term is introduced to avoids thescores to be too close to each other and to have a meaningful ranking.
Having such a fitness function permits, given a new set of images for whichwe want to build a collage, to have a measure of how good is a certain configu-ration of image states. Furthermore, maximizing f ′(·) we are confident that weare generating a collage that the users will judge good on the overall. The opti-mization to solve Equation 23 has to be performed just once and offline so thecomputational time required to solve it is of secondary importance. However,it requires a bunch of seconds to run, since all the inputs are computed offlineand the only operations involved are the computation of the Kendall tau rank(first term of Equation 23) and the relative distances between user scores andinduced scores (second term of Equation 23).
The optimization problem in Equation 23 is solved using the continuous-space implementation of the DS algorithm. The signs of the criteria weightsare reported in Table 6 together with a brief explanation of their effect in thecreation of the collage.
Once the weights [λ′,α] are learned, a new set of collages is generated bymaximizing Equation 20. For each dataset, the layering order of the images isinduced by the weigths α = [αsal, αqua, αhar]. More in details, for each imagei a new importance map M ′
i is created using Equation 7. The layering order isthen obtained by sorting in decreasing order the 2D integrals of the importancemaps M ′
i . The collages are generated using the discrete version of DS algorithm
20 S. Bianco and G. Ciocca
Burst Fashion Landscape Self Zen
Exp.
I-
Bes
tco
ll.
Exp.
II-
New
coll.
SsalBurst SsalFashion SsalLandscape SquaSelf SsalZen
S′Burst S′
Fashion S′Landscape S′
Self S′Zen
Fig 7. Collages comparison between the best ranked collages in Experiment I (top) and thecollages created with the user preference modeling and learning procedure for Experiment II(bottom). Color and full size images can be found at http: // www. ivl. disco. unimib. it/
research/ collage/ .
introduced in Section 3.3.
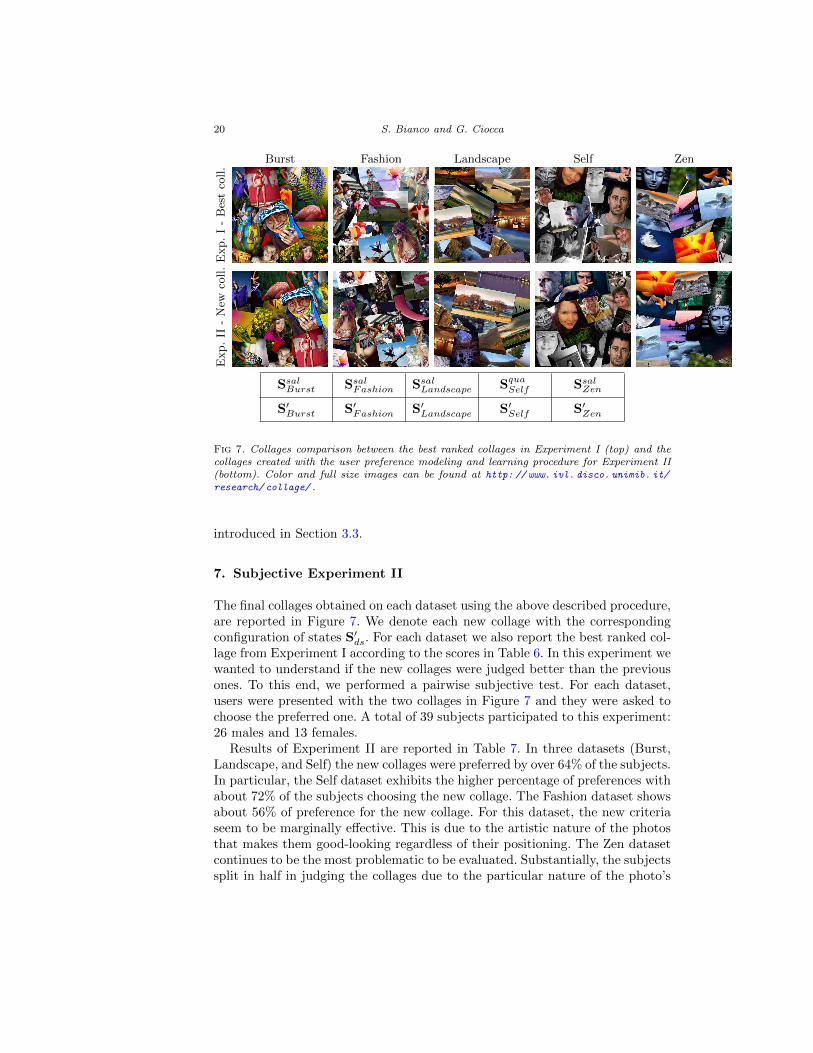
7. Subjective Experiment II
The final collages obtained on each dataset using the above described procedure,are reported in Figure 7. We denote each new collage with the correspondingconfiguration of states S′
ds. For each dataset we also report the best ranked col-lage from Experiment I according to the scores in Table 6. In this experiment wewanted to understand if the new collages were judged better than the previousones. To this end, we performed a pairwise subjective test. For each dataset,users were presented with the two collages in Figure 7 and they were asked tochoose the preferred one. A total of 39 subjects participated to this experiment:26 males and 13 females.
Results of Experiment II are reported in Table 7. In three datasets (Burst,Landscape, and Self) the new collages were preferred by over 64% of the subjects.In particular, the Self dataset exhibits the higher percentage of preferences withabout 72% of the subjects choosing the new collage. The Fashion dataset showsabout 56% of preference for the new collage. For this dataset, the new criteriaseem to be marginally effective. This is due to the artistic nature of the photosthat makes them good-looking regardless of their positioning. The Zen datasetcontinues to be the most problematic to be evaluated. Substantially, the subjectssplit in half in judging the collages due to the particular nature of the photo’s

User Preferences Modeling and Learning for Pleasing Photo Collage Generation 21
Number of times (#) and percentage (%) that a collage was preferred in Experiment II
Burst # %
Saliency 13 33.3Final collage 26 66.7
Fashion # %
Saliency 17 43.6Final collage 22 56.4
Landscape # %
Saliency 14 35.9Final collage 25 64.1
Self # %
Quality 11 18.2Final collage 28 71.8
Zen # %
Saliency 19 48.7Final collage 20 51.3
content. On average 62% of the subjects preferred the new photo collages.
8. Further experiments
In this section further experiments are carried out to verify the generalizationability of the identified criteria and their learned relative importance. Threedifferent experiments are presented: i) the learned definition of pleasantness isused to create collages on unseen image sets; ii) results obtained by our proposalare compared against two state-of-the-art algorithms; iii) the behavior of thelearned definition of pleasantness is also tested by varying the number of imagesin the dataset and the canvas size.
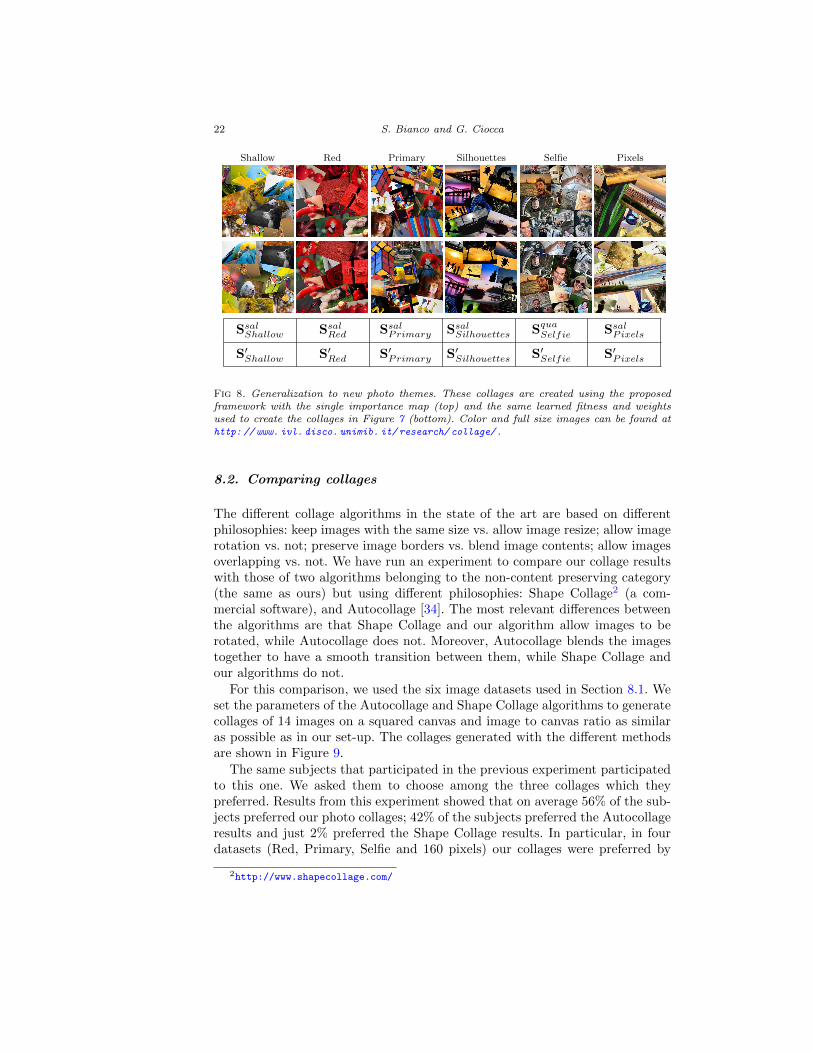
8.1. Generalization to new photo themes
In order to test how the learned definition of pleasantness generalizes to photocollages not seen during the training phase, a further experiment has been done.The optimal set of weights learned on the five training datasets in the previoussection is used as-is to create photo collages on the new datasets. For thisexperiment, six new challenges have been selected from the DPChallenge website. The chosen challenges are: Shallow DOF VI (Shallow for brevity), RedV (Red), Primary Colors II (Primary), Silhouettes VI (Silhouettes), Selfie!(Selfie), and 160 Pixels (Pixels).
The experiment performed is a pairwise subjective test similar to the oneused in Experiment II. For each dataset, users were presented with the twocollages in Figure 8 and they were asked to choose the preferred one. Followingthe results of Experiment I, one of the collage was generated using a singleimportance map; the other one was generated maximizing the learned fitness.A total of 42 subjects participated to this subjective experiment: 22 males and20 females.
Results from this experiment showed that on average 61% of the subjectspreferred the photo collages created using the learned definition of pleasantness.In particular, in four datasets (Shallow, Primary, Selfie and Pixels) these collageswere preferred by over 66% percent of the subjects. For the remaining twodatasets (Red and Silhouettes) instead, the two collage versions tied.
22 S. Bianco and G. Ciocca
Shallow Red Primary Silhouettes Selfie Pixels
SsalShallow SsalRed SsalPrimary SsalSilhouettes SquaSelfie SsalP ixels
S′Shallow S′
Red S′Primary S′
Silhouettes S′Selfie S′
Pixels
Fig 8. Generalization to new photo themes. These collages are created using the proposedframework with the single importance map (top) and the same learned fitness and weightsused to create the collages in Figure 7 (bottom). Color and full size images can be found athttp: // www. ivl. disco. unimib. it/ research/ collage/ .
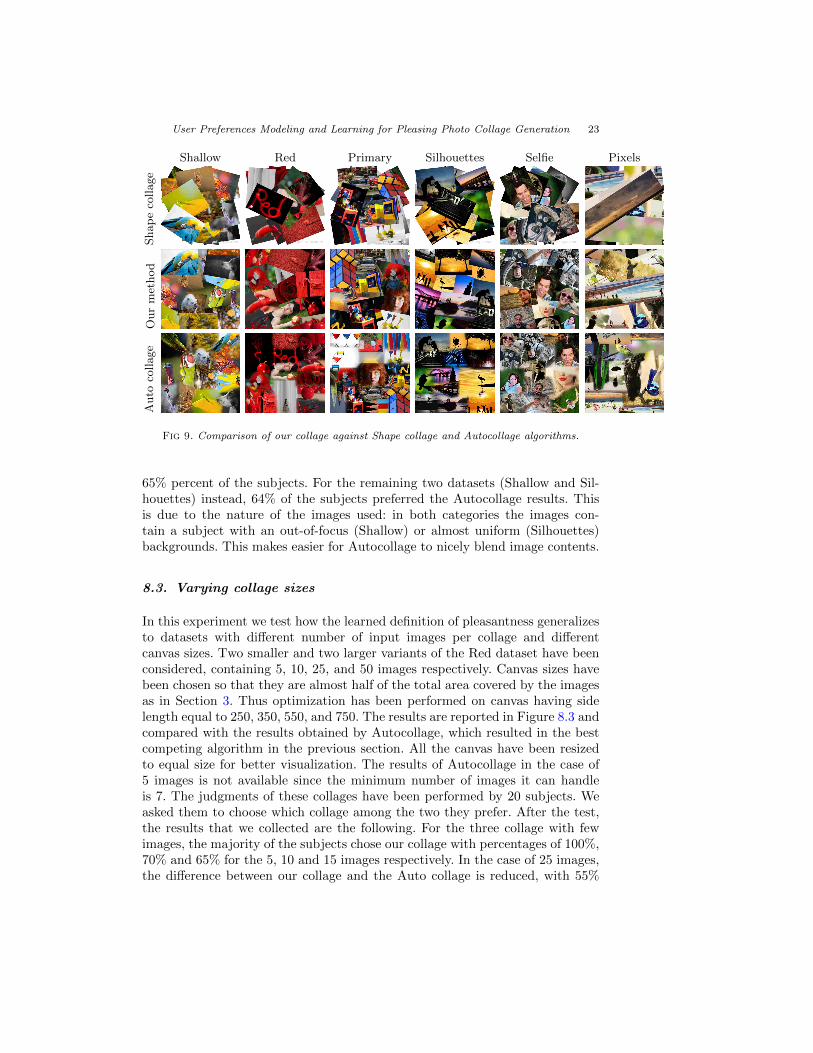
8.2. Comparing collages
The different collage algorithms in the state of the art are based on differentphilosophies: keep images with the same size vs. allow image resize; allow imagerotation vs. not; preserve image borders vs. blend image contents; allow imagesoverlapping vs. not. We have run an experiment to compare our collage resultswith those of two algorithms belonging to the non-content preserving category(the same as ours) but using different philosophies: Shape Collage2 (a com-mercial software), and Autocollage [34]. The most relevant differences betweenthe algorithms are that Shape Collage and our algorithm allow images to berotated, while Autocollage does not. Moreover, Autocollage blends the imagestogether to have a smooth transition between them, while Shape Collage andour algorithms do not.
For this comparison, we used the six image datasets used in Section 8.1. Weset the parameters of the Autocollage and Shape Collage algorithms to generatecollages of 14 images on a squared canvas and image to canvas ratio as similaras possible as in our set-up. The collages generated with the different methodsare shown in Figure 9.
The same subjects that participated in the previous experiment participatedto this one. We asked them to choose among the three collages which theypreferred. Results from this experiment showed that on average 56% of the sub-jects preferred our photo collages; 42% of the subjects preferred the Autocollageresults and just 2% preferred the Shape Collage results. In particular, in fourdatasets (Red, Primary, Selfie and 160 pixels) our collages were preferred by
2http://www.shapecollage.com/
User Preferences Modeling and Learning for Pleasing Photo Collage Generation 23
Shallow Red Primary Silhouettes Selfie PixelsShap
eco
llage
Our
met
hod
Auto
collage
Fig 9. Comparison of our collage against Shape collage and Autocollage algorithms.
65% percent of the subjects. For the remaining two datasets (Shallow and Sil-houettes) instead, 64% of the subjects preferred the Autocollage results. Thisis due to the nature of the images used: in both categories the images con-tain a subject with an out-of-focus (Shallow) or almost uniform (Silhouettes)backgrounds. This makes easier for Autocollage to nicely blend image contents.
8.3. Varying collage sizes
In this experiment we test how the learned definition of pleasantness generalizesto datasets with different number of input images per collage and differentcanvas sizes. Two smaller and two larger variants of the Red dataset have beenconsidered, containing 5, 10, 25, and 50 images respectively. Canvas sizes havebeen chosen so that they are almost half of the total area covered by the imagesas in Section 3. Thus optimization has been performed on canvas having sidelength equal to 250, 350, 550, and 750. The results are reported in Figure 8.3 andcompared with the results obtained by Autocollage, which resulted in the bestcompeting algorithm in the previous section. All the canvas have been resizedto equal size for better visualization. The results of Autocollage in the case of5 images is not available since the minimum number of images it can handleis 7. The judgments of these collages have been performed by 20 subjects. Weasked them to choose which collage among the two they prefer. After the test,the results that we collected are the following. For the three collage with fewimages, the majority of the subjects chose our collage with percentages of 100%,70% and 65% for the 5, 10 and 15 images respectively. In the case of 25 images,the difference between our collage and the Auto collage is reduced, with 55%
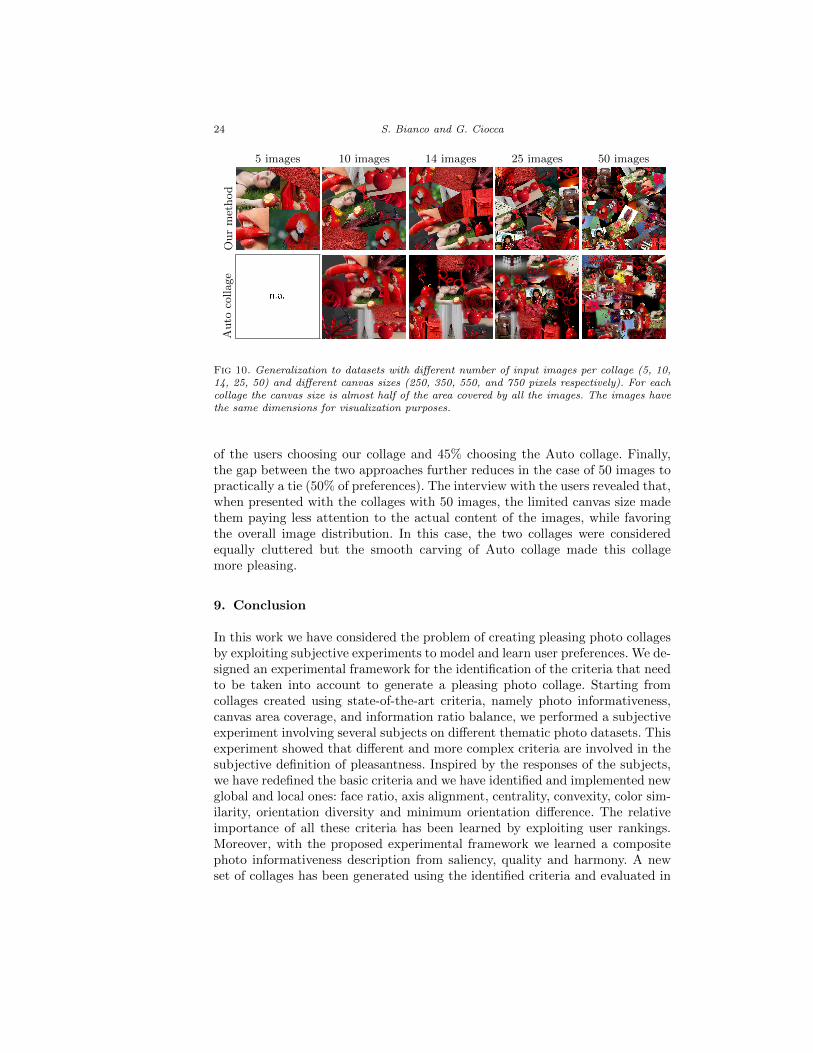
24 S. Bianco and G. Ciocca
5 images 10 images 14 images 25 images 50 images
Ou
rm
eth
od
Au
toco
llage
Fig 10. Generalization to datasets with different number of input images per collage (5, 10,14, 25, 50) and different canvas sizes (250, 350, 550, and 750 pixels respectively). For eachcollage the canvas size is almost half of the area covered by all the images. The images havethe same dimensions for visualization purposes.
of the users choosing our collage and 45% choosing the Auto collage. Finally,the gap between the two approaches further reduces in the case of 50 images topractically a tie (50% of preferences). The interview with the users revealed that,when presented with the collages with 50 images, the limited canvas size madethem paying less attention to the actual content of the images, while favoringthe overall image distribution. In this case, the two collages were consideredequally cluttered but the smooth carving of Auto collage made this collagemore pleasing.
9. Conclusion
In this work we have considered the problem of creating pleasing photo collagesby exploiting subjective experiments to model and learn user preferences. We de-signed an experimental framework for the identification of the criteria that needto be taken into account to generate a pleasing photo collage. Starting fromcollages created using state-of-the-art criteria, namely photo informativeness,canvas area coverage, and information ratio balance, we performed a subjectiveexperiment involving several subjects on different thematic photo datasets. Thisexperiment showed that different and more complex criteria are involved in thesubjective definition of pleasantness. Inspired by the responses of the subjects,we have redefined the basic criteria and we have identified and implemented newglobal and local ones: face ratio, axis alignment, centrality, convexity, color sim-ilarity, orientation diversity and minimum orientation difference. The relativeimportance of all these criteria has been learned by exploiting user rankings.Moreover, with the proposed experimental framework we learned a compositephoto informativeness description from saliency, quality and harmony. A newset of collages has been generated using the identified criteria and evaluated in
User Preferences Modeling and Learning for Pleasing Photo Collage Generation 25
a pairwise comparison experiment against the previous best rated collages. Thenew collages were preferred by the majority of the subjects for all the photodatasets considered, showing that the proposed framework is able to identifyand combine the criteria at the basis of user preference, and to learn a compu-tational model which effectively encodes an inter-user definition of pleasantness.A further experiment has been run, showing that the learned definition of pleas-antness generalizes well to new thematic photo datasets not used in the trainingphase.
Photo informativeness has been described in terms of saliency, quality, andharmony maps, but other maps taking into account different image propertiescan be incorporated as well in our framework (e.g. photo memorability by Isolaet al. [20, 22]). Furthermore, leveraging user preferences, the proposed frame-work permits to quantify the contribution of different visual features to modelnew intrinsic properties of the images.
The proposed framework can benefit current collage generation algorithms intwo different ways. The first regards its use to estimate the weights of the fitnessfunction (also called energy function) in the different collage generation algo-rithms, e.g: weights associated to region importance, transition cost, object sen-sitivity and face presence in Autocollage [34]; representativeness, compactnessand transition smoothness in Video collage [29]; salience visibility, salience ratiobalance, penalty of severe occlusions, blank space presence, canvas shape con-straint, spatially uniformity and orientation diversity in Picture collage [37, 26];image complexity and content distinctness in [42]. All these algorithms heuristi-cally set the weights associated to the different terms in their fitness functions.With our framework, these weights can be systematically set using user prefer-ences. This way requires that a training data has to be generated in the formof multiple collages and the collection of user judgments about them. This op-eration has to be done only once and does not impact collage generation time.The second way in which existing algorithms can leverage our work regards thepossibility of including the new criteria here defined inside their fitness/energyfunctions. This will not dramatically slow down the collage generation process,since the new criteria are fast to compute.
As future work we plan to investigate if the learned definition of pleasantnesschanges when subjects and photos are linked. We plan also to expand the set ofcriteria by enlarging the number of subjects in the experiments, and by addingmore thematic photo datasets.
References
[1] Ali, B., Ming-Ming, C., Huaizu, J. and Jia, L. (2014). Salient ObjectDetection: A Survey. arXiv:1411.5878 [cs.CV].
[2] Battiato, S., Ciocca, G., Gasparini, F., Puglisi, G. and Schet-tini, R. (2008). Smart photo sticking. In Adaptive Multimedia Retrieval:Retrieval, User, and Semantics. Lecture Notes in Computer Science 4918211–223. Springer.
26 S. Bianco and G. Ciocca
[3] Bianco, S. and Schettini, R. (2012). Sampling Optimization for PrinterCharacterization by Direct Search. IEEE Transactions on Image Processing21 4868–4873.
[4] Bianco, S. and Tisato, F. (2012). Sensor Placement Optimization inBuildings. In Image Processing: Machine Vision Applications V 8300830003. SPIE.
[5] Calic, J., Gibson, D. P. and Campbell, N. W. (2007). Efficient Layoutof Comic-Like Video Summaries. Circuits and Systems for Video Technol-ogy, IEEE Transactions on 17 931–936.
[6] Chao, H., Tretter, D. R., Zhang, X. and Atkins, C. B. (2010).Blocked recursive image composition with exclusion zones. In Proceedingsof the 10th ACM symposium on Document engineering. DocEng ’10 111–114. ACM.
[7] Chen, J.-C., Chu, W.-T., Kuo, J.-H., Weng, C.-Y. and Wu, J.-L.(2006). Tiling Slideshow. In Proceedings of the 14th Annual ACM Interna-tional Conference on Multimedia. MULTIMEDIA ’06 25–34. ACM.
[8] Cheng, M., Mitra, N. J., Huang, X., Torr, P. H. S. and Hu, S.(2015). Global Contrast Based Salient Region Detection. Pattern Analysisand Machine Intelligence, IEEE Transactions on 37 569-582.
[9] Ciocca, G. and Schettini, R. (2010). Multiple image thumbnailing. InDigital Photography VI 7537 75370S. SPIE.
[10] Diakopoulos, N. and Essa, I. (2005). Mediating Photo Collage Author-ing. In Proceedings of the 18th Annual ACM Symposium on User InterfaceSoftware and Technology. UIST ’05 183–186. ACM, New York, NY, USA.
[11] Duncan, K. and Sarkar, S. (2012). Saliency in images and video: a briefsurvey. Computer Vision, IET 6 514–523.
[12] Eberhart, R. C. and Kennedy, J. (1995). A new optimizer using particleswarm theory. In Proceedings of the sixth international symposium on micromachine and human science 1 39–43. New York, NY.
[13] Ekhtiyar, H., Sheida, M. and Amintoosi, M. (2011). Picture Collagewith Genetic Algorithm and Stereo vision. International Journal of Com-puter Science Issues 8 165–169.
[14] Fan, J. (2012). Photo Layout with a Fast Evaluation Method and GeneticAlgorithm. In Multimedia and Expo Workshops (ICMEW), 2012 IEEE In-ternational Conference on 308–313. IEEE.
[15] Girgensohn, A. and Chiu, P. (2003). Stained Glass Photo Collages. InIEEE International Conference on Image Processing 2 871–874.
[16] Goferman, S., Tal, A. and Zelnik-Manor, L. (2010). Puzzle-like Col-lage. Computer Graphics Forum 29 459–468.
[17] Goldberg, D. E. (1989). Genetic Algorithms in Search, Optimization andMachine Learning, 1st ed. Addison-Wesley Longman Publishing Co., Inc.,Boston, MA, USA.
[18] Hooke, R. and Jeeves, T. A. (1961). “Direct Search”Solution of Numer-ical and Statistical Problems. Journal of the ACM (JACM) 8 212–229.
[19] Huang, H., Zhang, L. and Zhang, H.-C. (2011). Arcimboldo-like Col-lage Using Internet Images. ACM Transaction on Graphics 30 155:1–155:8.
User Preferences Modeling and Learning for Pleasing Photo Collage Generation 27
[20] Isola, P., Xiao, J., Torralba, A. and Oliva, A. (2011). Whatmakes an image memorable? In Computer Vision and Pattern Recognition(CVPR), 2011 IEEE Conference on 145–152. IEEE.
[21] Kendall, M. G. (1938). A new measure of rank correlation. Biometrika30 81–93.
[22] Khosla, A., Xiao, J., Torralba, A. and Oliva, A. (2012). Memora-bility of Image Regions. In NIPS 2 4.
[23] Kimura, A., Yonetani, R. and Hirayama, T. (2013). Computationalmodels of human visual attention and their implementations: A survey.IEICE TRANSACTIONS on Information and Systems 96 562–578.
[24] Kolda, T. G., Lewis, R. M. and Torczon, V. (2003). Optimizationby direct search: New perspectives on some classical and modern methods.SIAM review 45 385–482.
[25] Lee, M. H., Singhal, N., Cho, S. and Park, I. K. (2010). Mobilephoto collage. In Computer Vision and Pattern Recognition Workshops(CVPRW), 2010 IEEE Computer Society Conference on 24–30.
[26] Liu, T., Wang, J., Sun, J., Zheng, N., Tang, X. and Shum, H.-Y.(2009). Picture collage. Multimedia, IEEE Transactions on 11 1225–1239.
[27] Luo, S.-J., Tsai, C.-Y., Chen, W.-C. and Chen, B.-Y. (2013). Dy-namic Media Assemblage. Circuits and Systems for Video Technology,IEEE Transactions on 23 2044–2053.
[28] Ma, Y.-F. and Zhang, H.-J. (2003). Contrast-based image attention anal-ysis by using fuzzy growing. In Proceedings of the eleventh ACM interna-tional conference on Multimedia. MULTIMEDIA ’03 374–381. ACM.
[29] Mei, T., Yang, B., Yang, S.-Q. and Hua, X.-S. (2009). Video collage:presenting a video sequence using a single image. The Visual Computer 2539–51.
[30] Mittal, A., Moorthy, A. K. and Bovik, A. C. (2012). No-ReferenceImage Quality Assessment in the Spatial Domain. Image Processing, IEEETransactions on 21 4695–4708.
[31] Nelder, J. A. and Mead, R. (1965). A simplex method for functionminimization. The computer journal 7 308–313.
[32] Ou, L.-C. and Luo, M. R. (2006). A colour harmony model for two-colourcombinations. Color Research & Application 31 191–204.
[33] Rother, C., Kumar, S., Kolmogorov, V. and Blake, A. (2005). Dig-ital tapestry [automatic image synthesis]. In Computer Vision and PatternRecognition, 2005. CVPR 2005. IEEE Computer Society Conference on 1589–596. IEEE.
[34] Rother, C., Bordeaux, L., Hamadi, Y. and Blake, A. (2006). Auto-collage. In ACM Transactions on Graphics (TOG) 25 847–852. ACM.
[35] Sandhaus, P., Rabbath, M. and Boll, S. (2011). Employing AestheticPrinciples for Automatic Photo Book Layout. In Advances in MultimediaModeling. Lecture Notes in Computer Science 6523 84–95. Springer BerlinHeidelberg.
[36] Solli, M. and Lenz, R. (2009). Color harmony for image indexing. InComputer Vision Workshops (ICCV Workshops), 2009 IEEE 12th Inter-
28 S. Bianco and G. Ciocca
national Conference on 1885–1892.[37] Wang, J., Quan, L., Sun, J., Tang, X. and Shum, H.-Y. (2006). Picture
collage. In Computer Vision and Pattern Recognition, 2006 IEEE Com-puter Society Conference on 1 347–354. IEEE.
[38] Wei, Y., Matsushita, Y. and Yang, Y. (2009). Efficient optimization ofphoto collage Technical Report No. MSRTR-2009-59, Microsoft Research.
[39] Wu, Z. and Aizawa, K. (2013). PicWall: Photo collage on-the-fly. In Sig-nal and Information Processing Association Annual Summit and Confer-ence (APSIPA), 2013 Asia-Pacific 1–10. IEEE.
[40] Wu, Z. and Aizawa, K. (2014). Building Friend Wall for Local PhotoRepository by Using Social Attribute Annotation. Journal of Multimedia9 4–13.
[41] Yang, Y., Wei, Y., Liu, C., Peng, Q. and Matsushita, Y. (2009).An improved belief propagation method for dynamic collage. The VisualComputer 25 431–439.
[42] Yu, Z., Lu, L., Guo, Y., Fan, R., Liu, M. and Wang, W. (2014).Content-Aware Photo Collage Using Circle Packing. Visualization andComputer Graphics, IEEE Transactions on 20 182–195.