Embed Size (px)
Citation preview
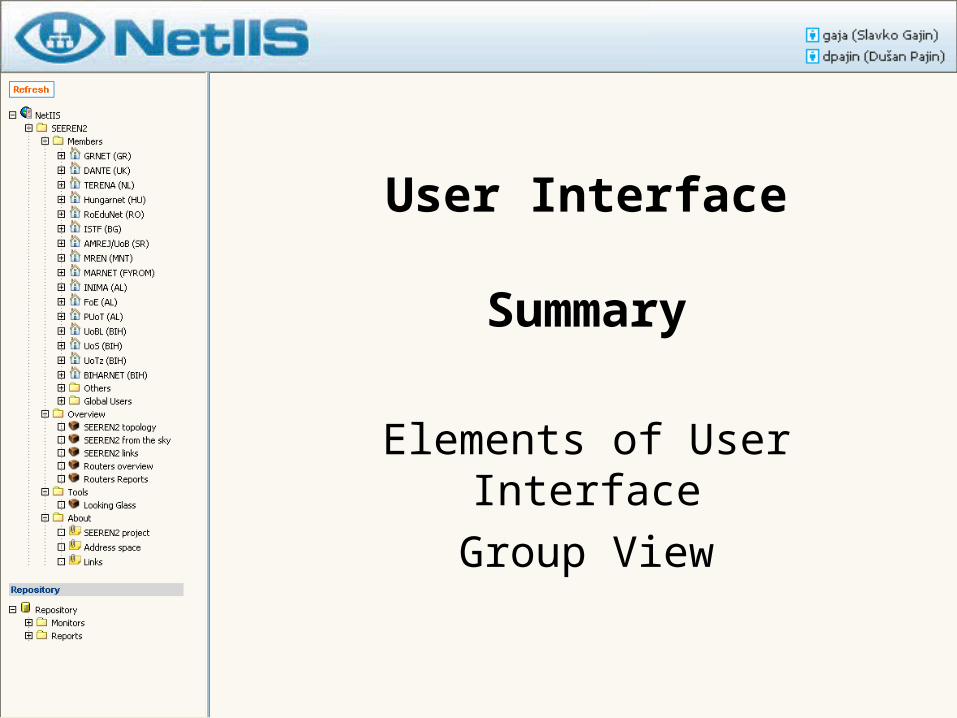
User Interface
Elements of User InterfaceGroup View
Introduction
• NetIIS web application is accessed via a standard web browser
• Independent of the web browser on the client computer (Internet Explorer, Mozilla Firefox etc.)
• This presentation will describe elements that form the user interface, principles of efficient overview and data alteration
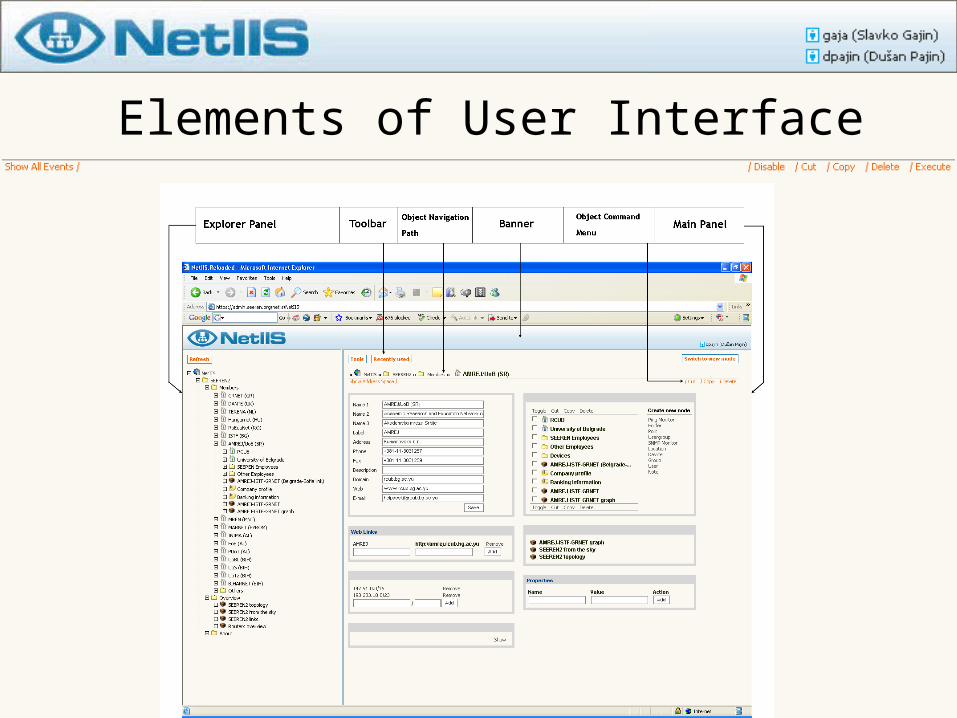
Elements of User Interface
Elements of User Interface
• Banner is located on the top of the screen that contains the NetIIS logo on the left side and username of the logged user on the right side
Elements of User Interface
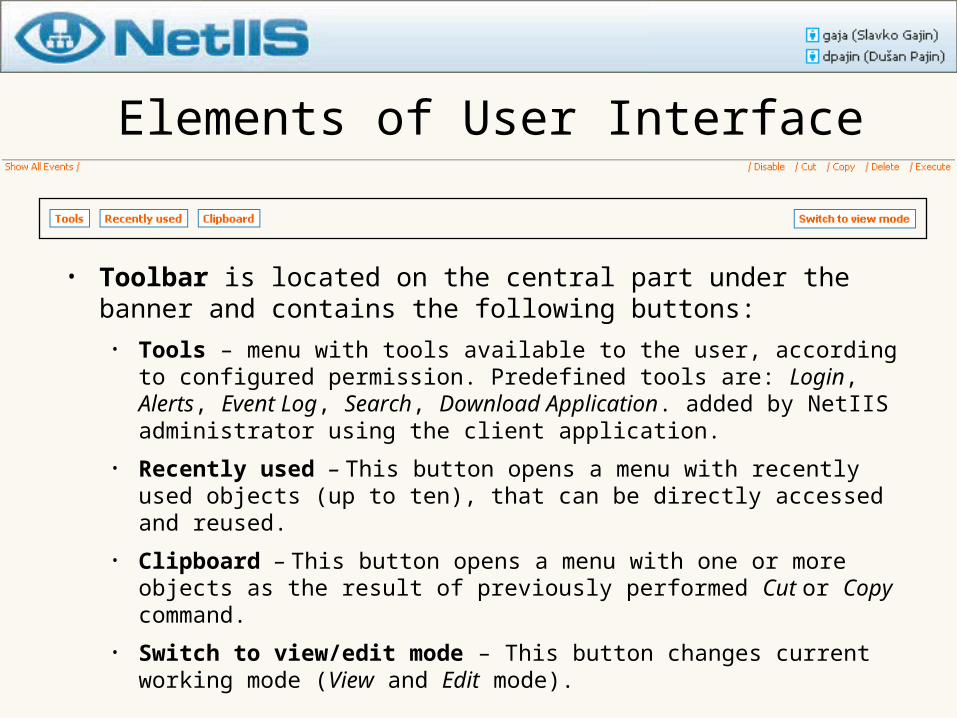
• Toolbar is located on the central part under the banner and contains the following buttons:
• Tools – menu with tools available to the user, according to configured permission. Predefined tools are: Login, Alerts, Event Log, Search, Download Application. added by NetIIS administrator using the client application.
• Recently used – This button opens a menu with recently used objects (up to ten), that can be directly accessed and reused.
• Clipboard – This button opens a menu with one or more objects as the result of previously performed Cut or Copy command.
• Switch to view/edit mode – This button changes current working mode (View and Edit mode).
Elements of User Interface
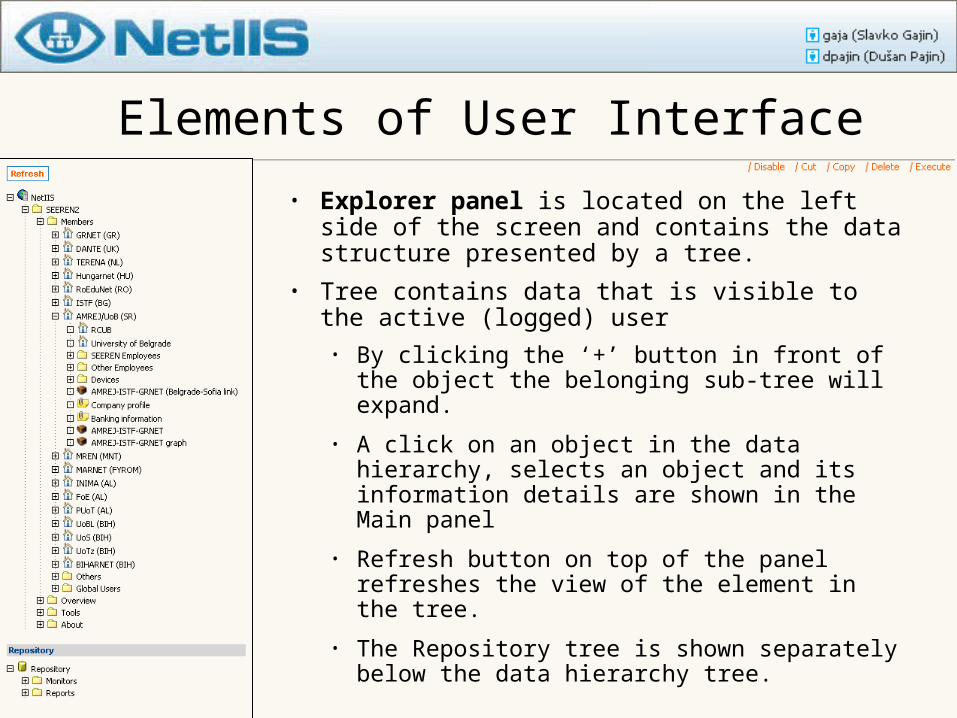
• Explorer panel is located on the left side of the screen and contains the data structure presented by a tree.
• Tree contains data that is visible to the active (logged) user
• By clicking the ‘+’ button in front of the object the belonging sub-tree will expand.
• A click on an object in the data hierarchy, selects an object and its information details are shown in the Main panel
• Refresh button on top of the panel refreshes the view of the element in the tree.
• The Repository tree is shown separately below the data hierarchy tree.
Elements of User Interface
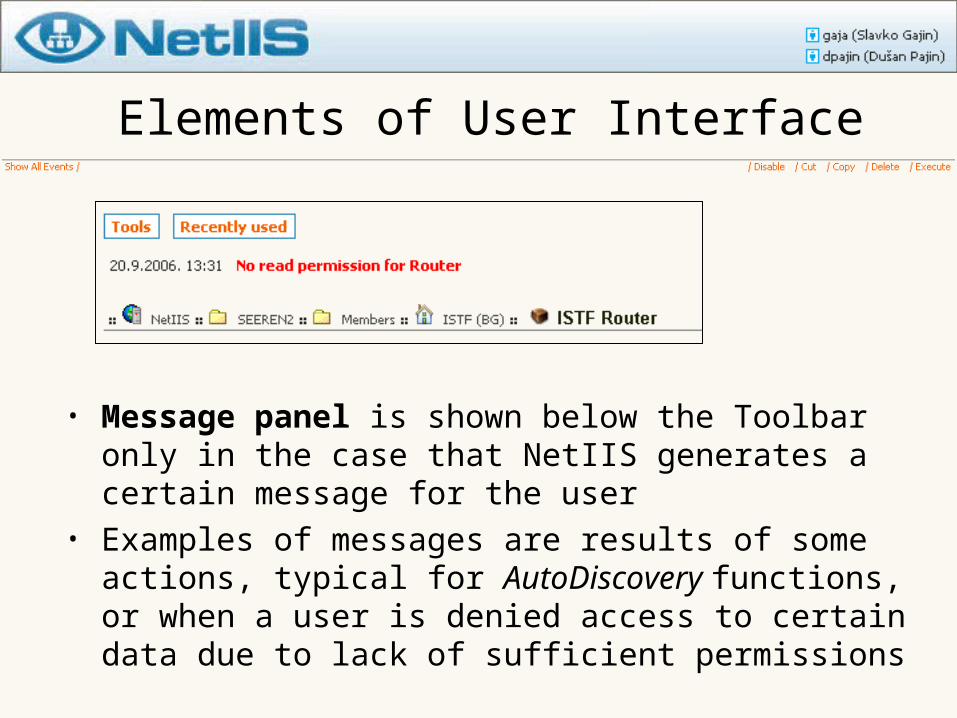
• Message panel is shown below the Toolbar only in the case that NetIIS generates a certain message for the user
• Examples of messages are results of some actions, typical for AutoDiscovery functions, or when a user is denied access to certain data due to lack of sufficient permissions
Elements of User Interface
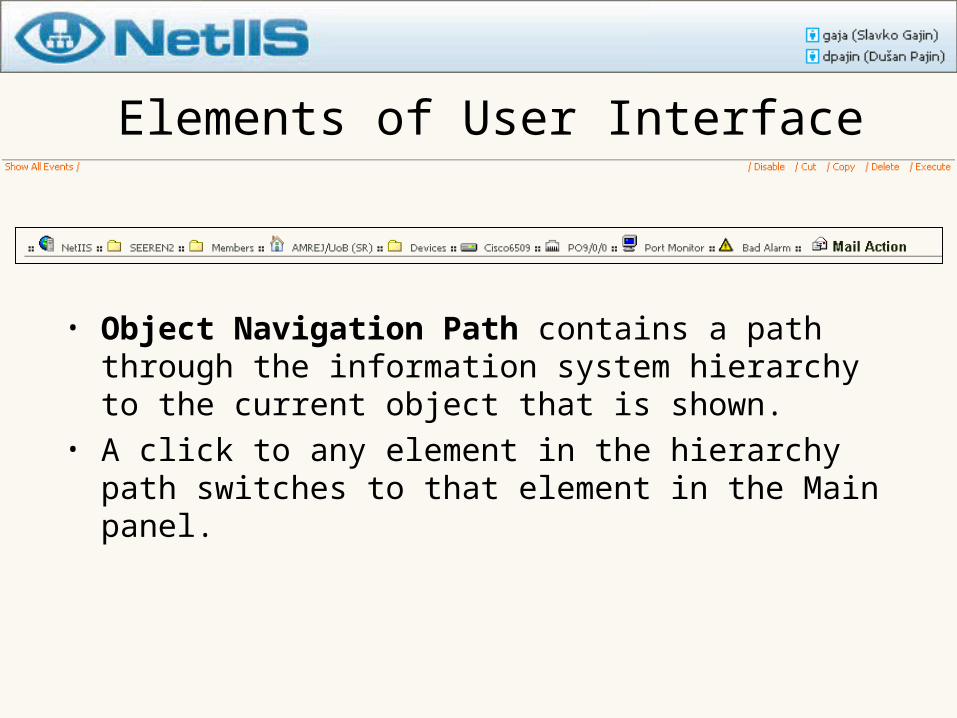
• Object Navigation Path contains a path through the information system hierarchy to the current object that is shown.
• A click to any element in the hierarchy path switches to that element in the Main panel.
Elements of User Interface
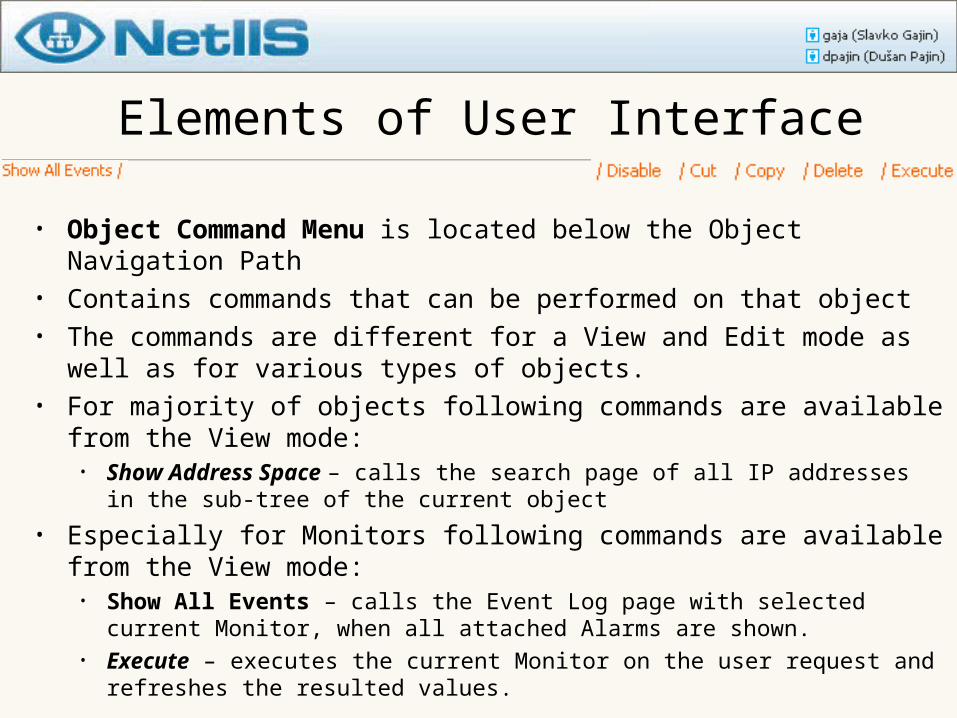
• Object Command Menu is located below the Object Navigation Path
• Contains commands that can be performed on that object • The commands are different for a View and Edit mode as well
as for various types of objects. • For majority of objects following commands are available from
the View mode:• Show Address Space – calls the search page of all IP addresses in
the sub-tree of the current object
• Especially for Monitors following commands are available from the View mode:
• Show All Events – calls the Event Log page with selected current Monitor, when all attached Alarms are shown.
• Execute – executes the current Monitor on the user request and refreshes the resulted values.
Elements of User Interface
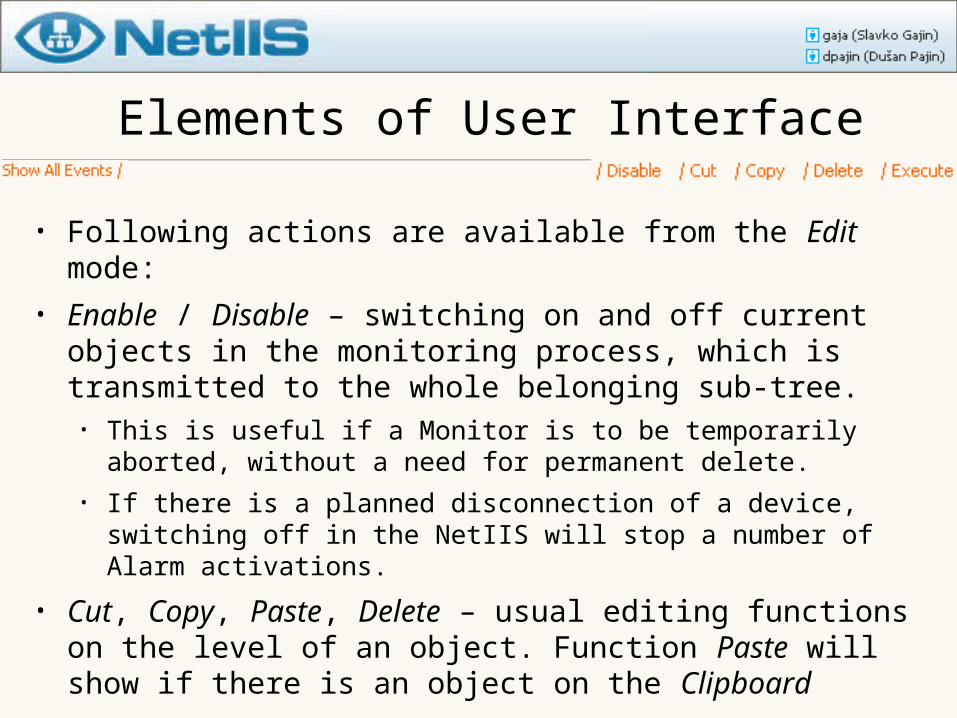
• Following actions are available from the Edit mode:• Enable / Disable – switching on and off current objects
in the monitoring process, which is transmitted to the whole belonging sub-tree. • This is useful if a Monitor is to be temporarily aborted,
without a need for permanent delete. • If there is a planned disconnection of a device, switching
off in the NetIIS will stop a number of Alarm activations.
• Cut, Copy, Paste, Delete – usual editing functions on the level of an object. Function Paste will show if there is an object on the Clipboard
Elements of User Interface
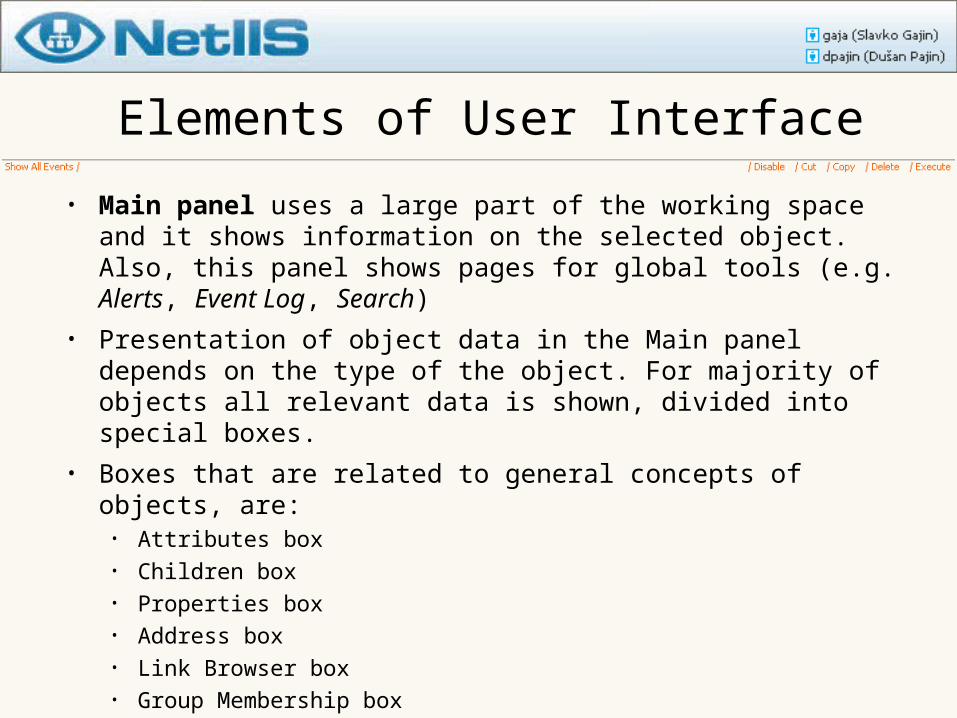
• Main panel uses a large part of the working space and it shows information on the selected object. Also, this panel shows pages for global tools (e.g. Alerts, Event Log, Search)
• Presentation of object data in the Main panel depends on the type of the object. For majority of objects all relevant data is shown, divided into special boxes.
• Boxes that are related to general concepts of objects, are:
• Attributes box• Children box• Properties box• Address box• Link Browser box • Group Membership box
Main Panel
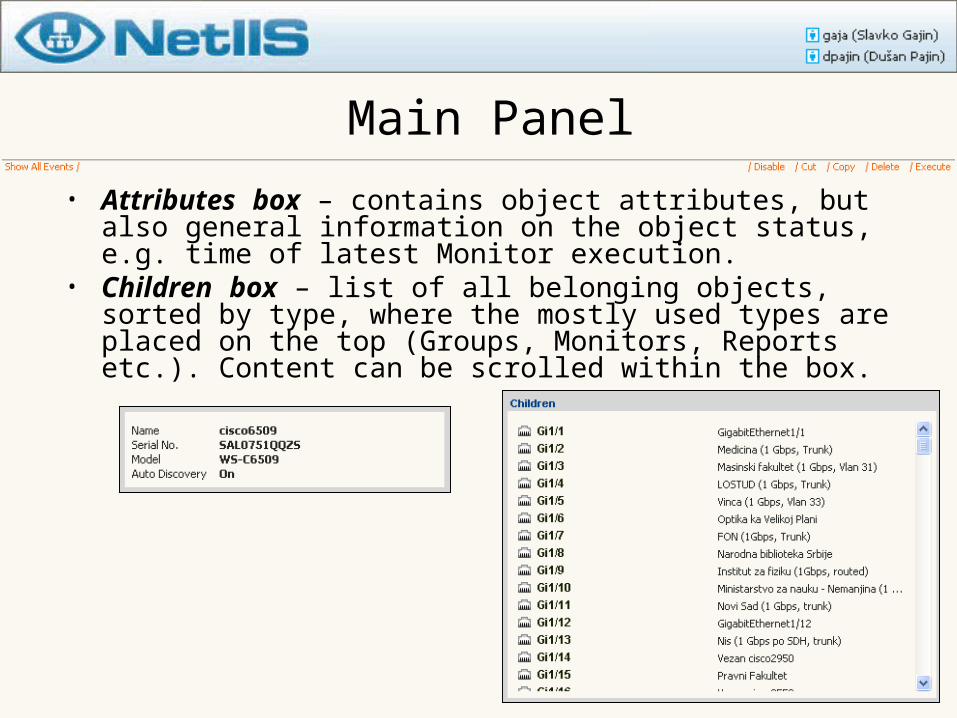
• Attributes box – contains object attributes, but also general information on the object status, e.g. time of latest Monitor execution.
• Children box – list of all belonging objects, sorted by type, where the mostly used types are placed on the top (Groups, Monitors, Reports etc.). Content can be scrolled within the box.
Main Panel
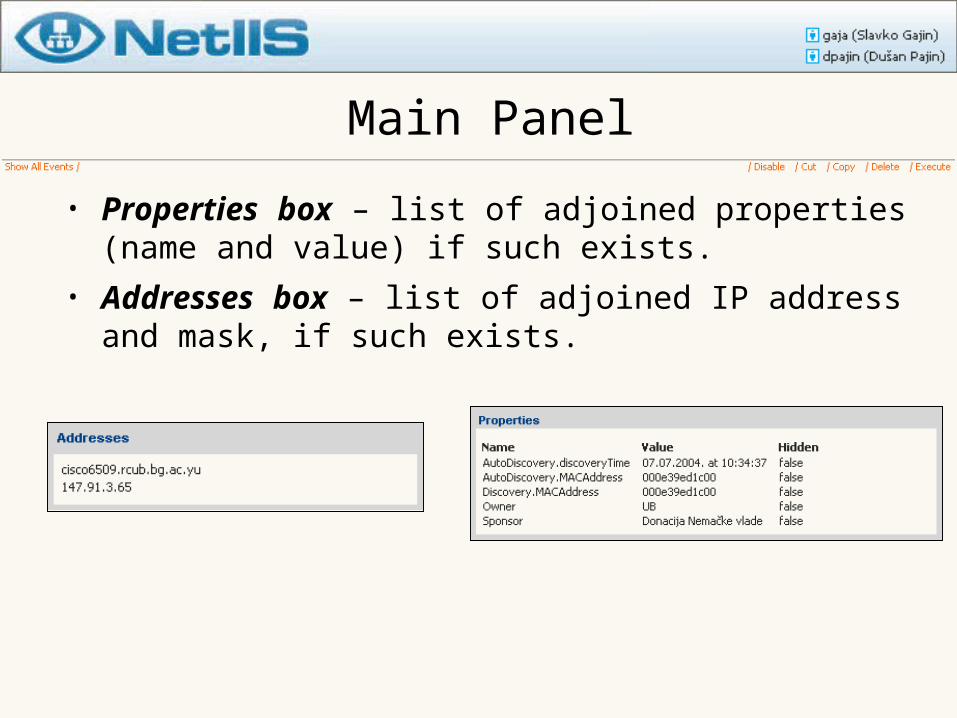
• Properties box – list of adjoined properties (name and value) if such exists.
• Addresses box – list of adjoined IP address and mask, if such exists.
Main Panel
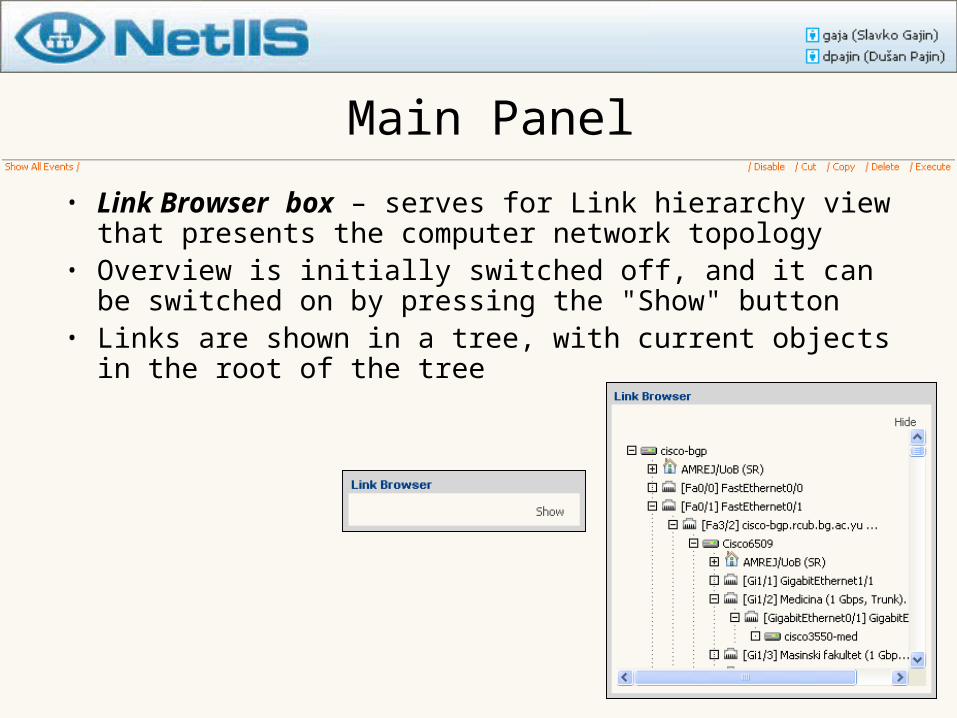
• Link Browser box – serves for Link hierarchy view that presents the computer network topology
• Overview is initially switched off, and it can be switched on by pressing the "Show" button
• Links are shown in a tree, with current objects in the root of the tree
Main Panel
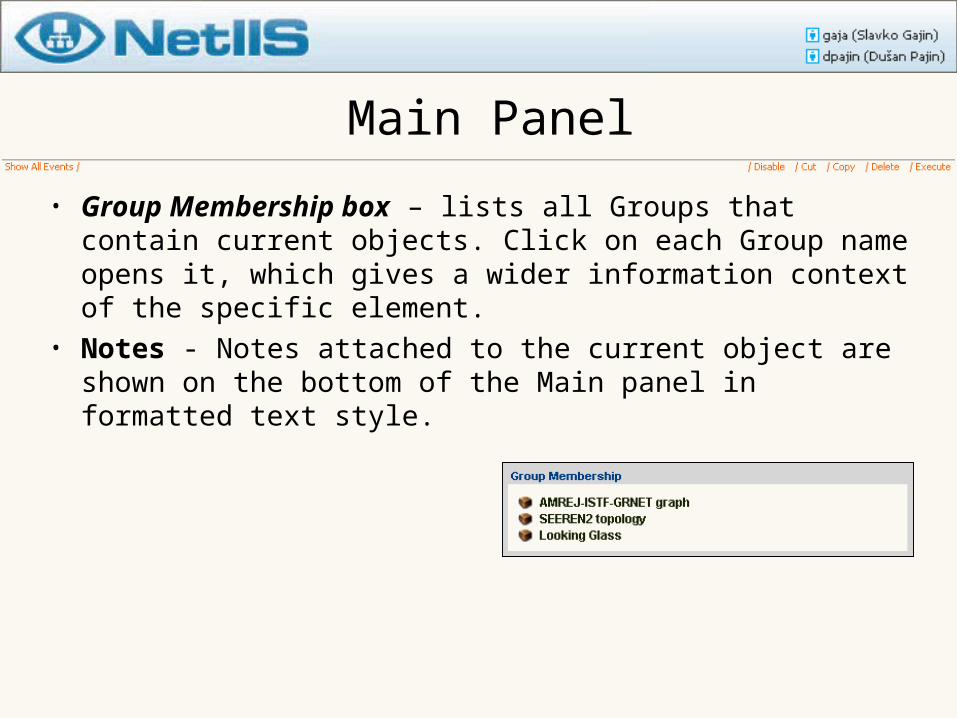
• Group Membership box – lists all Groups that contain current objects. Click on each Group name opens it, which gives a wider information context of the specific element.
• Notes - Notes attached to the current object are shown on the bottom of the Main panel in formatted text style.
Main Panel
• Other boxes depend on the type of objects in the following way.
• Devices and Ports:• Looking Glass box – The Execute button executes the
selected command on the current router, while the Telnet button initiates a telnet session in a default program on the client working station.
• Ports:• Trace box – The Execute button enlists all objects on the path
from the parent Location to the first-hop Location, followed by topological links.
• Monitors and Alarms:• Monitor Variables box – shows current values of all Monitor
variables. Variables marked with hide attribute are shown in a grey colour.
Group View
• Groups are shown depending on the type of the Group, which can be: • Simple Group • Graph• Looking Glass
Simple Group
• Simple Group serves for showing elements in a table form
• Used for joining Monitor elements and show current status
• Nesting of Groups is possible• Two outputs are supported for Simple
Groups:• Variables View• RRD Charts View
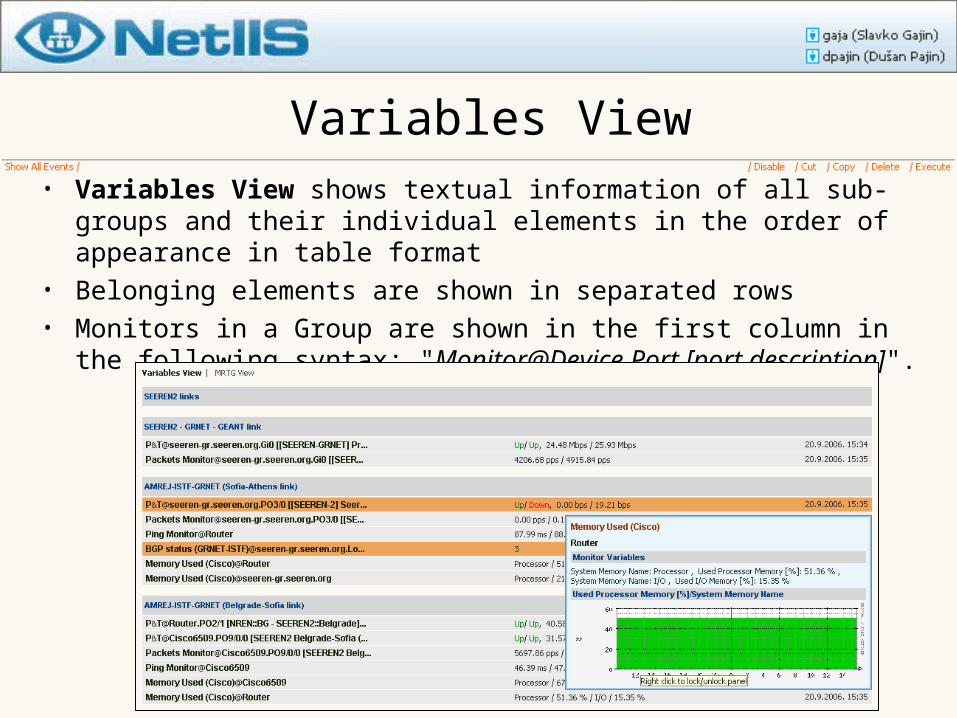
Variables View• Variables View shows textual information of all sub-groups
and their individual elements in the order of appearance in table format
• Belonging elements are shown in separated rows• Monitors in a Group are shown in the first column in the
following syntax: "[email protected] [port description]".
RRD Charts View
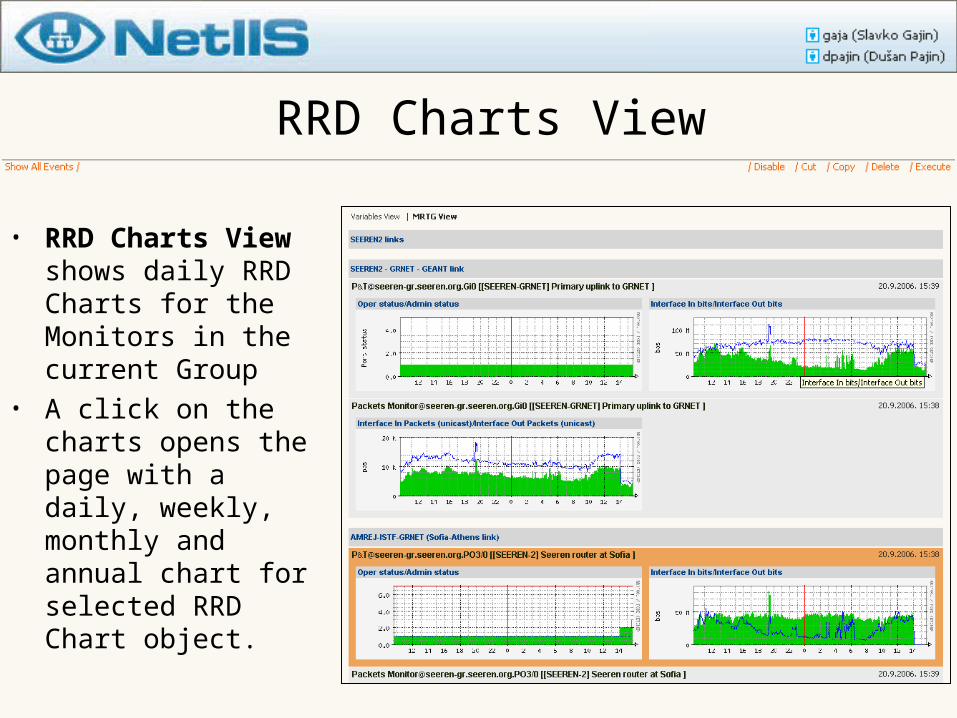
• RRD Charts View shows daily RRD Charts for the Monitors in the current Group
• A click on the charts opens the page with a daily, weekly, monthly and annual chart for selected RRD Chart object.
Graphs
• Graphs present special type of Group object, which serves for descriptive visual illustration of the topology of belonging elements with clearly marked statuses of individual Links and Devices
• Each type of object has a pre-defined icon, while individual sub-types of objects or individual objects can have a newly assigned icon
• NetIIS system shows direct or indirect Links between objects in the Group on the basis of Link topology
• The Links are represented as bidirectional arrows• Links can be marked with red and green colours, If Monitors
are added into the Graph• Apart from these general features, the Graphs have two
output forms: Weather Map and Link Status
Graphs – Weather Map
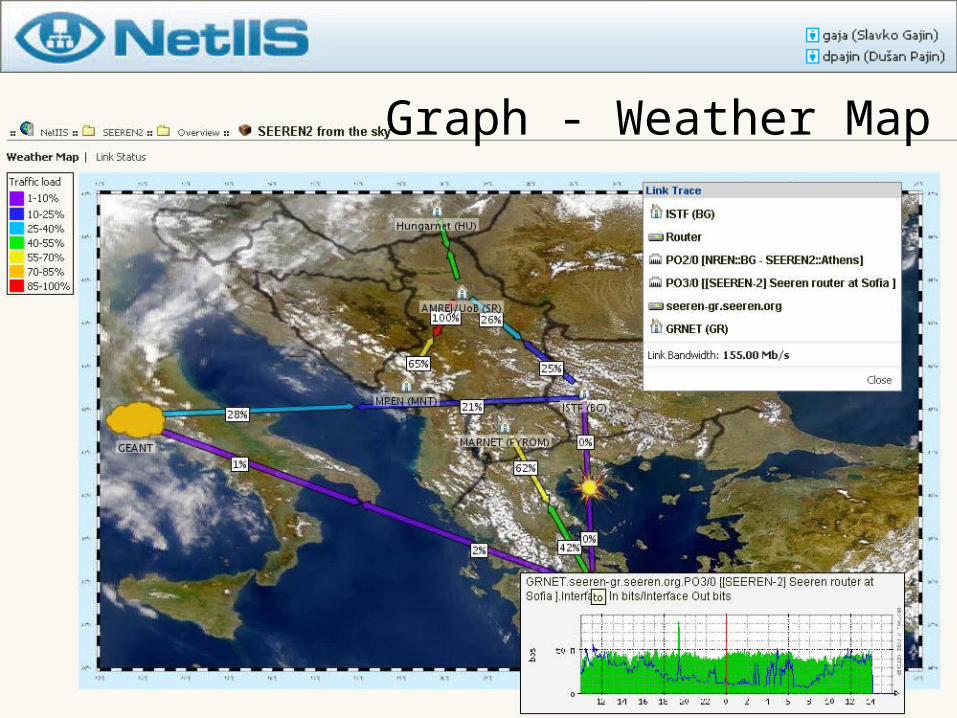
• Weather Map output aims to show current traffic flow on links, which is visually marked with various colours.
• The system automatically gets and shows Traffic Monitors on the path between two objects.
• The traffic intensity is shown as a capacity occupancy percentage. If an Alarm is active (Link is down) the associated Link will be marked with an "explosion" on the Graph.
Graph - Weather Map
Graph – Link Status
• Link Status output aims to show current link status depending on the Alarm status of corresponding Port Monitors
• If the state of the Monitor is Up, link will be presented with a green colour, and if the state of the Monitor is Down, link will be presented with a red colour.
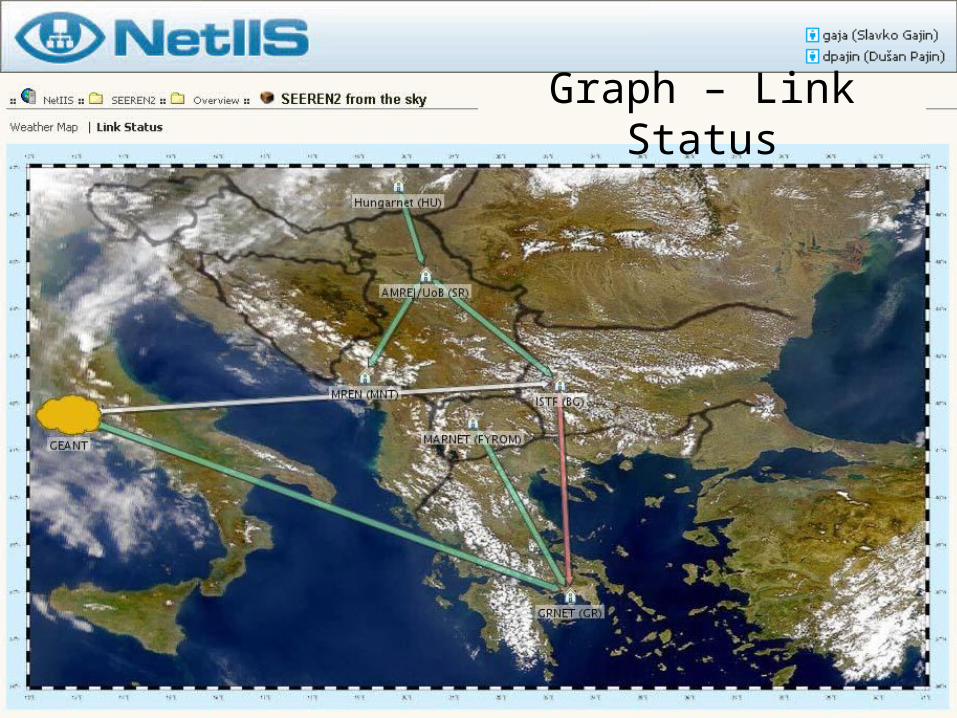
Graph – Link Status

Looking Glass
• Special Group of Looking Glass type collects all Devices which are allowed for a remote command execution, so-called Looking Glass functionality
• The only functional difference in relation to the Looking Glass box in the Main panel is reflected in a specific choice of Devices from the Group to which the selected command is to be performed
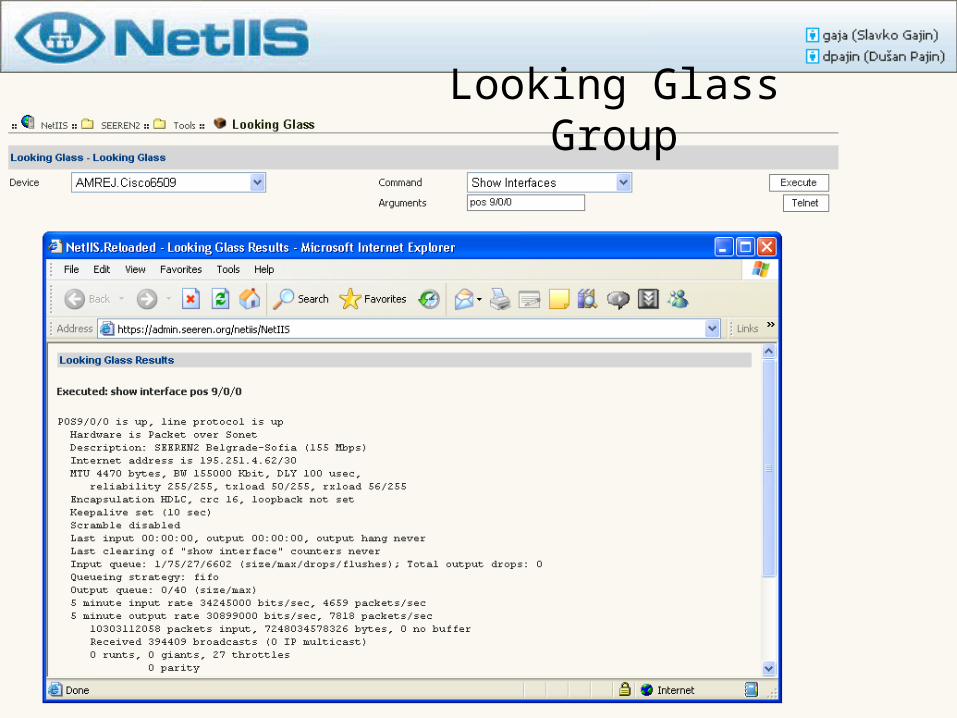
Looking Glass Group
User Interface
Summary
Elements of User InterfaceGroup View