Embed Size (px)
Citation preview

1. Introduction
2. Apoptosis pathways are
conserved
3. Caspases: key players in the
apoptosis pathway
4. Caspases are involved in
several neurodegenerative
diseases
5. Apoptosis: a good target for
drug discovery
6. Conventional assays for
assessing apoptosis
7. Zebrafish: a predictive model
for assessing apoptosis
8. Whole animal zebrafish
apoptosis assays
9. Potential strategy for
compound library screening
using whole zebrafish
10. Conclusions
11. Expert opinion
Review
Use of zebrafish apoptosis assaysfor preclinical drug discoveryPatricia McGrath† & Wen Lin SengPhylonix, Cambridge, MA, USA
Introduction: Apoptosis has become an important target for drug discovery.
Although the mouse remains the animal model of choice for the preclinical
assessment of drug toxicity and efficacy, zebrafish are increasingly used for
early drug studies. Here, we describe approaches for assessing drug effects
on apoptosis in transparent zebrafish.
Areas covered: In this review, the authors discuss the drug effects on develop-
mentally regulated apoptosis using microscopy. They also discuss the effects
of neuroprotectants in a chemical induced disease model using morphometric
image analysis. Finally, the authors review the effects of radioprotectants in
irradiated whole animals using a conventional 96-well microplate format.
Expert opinion: Several challenges have limited more widespread use of
zebrafish as the organism of choice for drug screening. However, zebrafish
do have a number of compelling inherent advantages including: rapid organ-
ogenesis, transparency, statistically significant numbers of animals per exper-
iment and adaptability of cell-based methods.
Keywords: acridine orange, apoptosis, caspase, cell death, microplate, TUNEL, zebrafish
Expert Opin. Drug Discov. [Early Online]
1. Introduction
During development, naturally occurring apoptosis plays an important role in tissuemodeling [1,2]. Uncontrolled apoptosis, however, is associated with numerous dis-eases including cancers, neurodegeneration, autoimmunity and heart and kidneyfailure [3]. In addition, many therapeutic approaches, including chemotherapy andorgan transplant, have been shown to induce apoptosis in normal cells [3]. Althoughgene products that regulate apoptosis appear to be excellent potential therapeutictargets, there are few drug candidates and predictive animal models are lacking.
2. Apoptosis pathways are conserved
Programmed cell death is precise and predictable and the stages and genes are highlyconserved throughout animal evolution. The genetics and molecular mechanisms ofapoptosis were first characterized in the late 1980s and early 1990s in studies usingCaenorhabditis elegans, the nematode worm [4,5]. Although C. elegans has severaladvantages as a model system, including conservation of the signaling pathwaysinvolved in apoptosis [6], vertebrates such as zebrafish are more complex organismscharacterized by multiple apoptosis pathways and multiple signaling molecules.Apoptosis appears to be directed by the dying cell itself, and during development,it is involved in maintaining the appropriate types and number of organ specificcells. Apoptosis is thought to be regulated by factors controlling growth and sur-vival, however, it can also be triggered by signals from viral infections, immune sys-tem responses, radiation, chemotoxins and temperature extremes [7]. Although themouse is a powerful genetic model, the ability to study phenotypic changes causedby apoptosis in this animal is hindered by its lengthy in utero development and reli-ance on laborious histology to assess drug effects.
10.1517/17460441.2013.825244 © 2013 Informa UK, Ltd. ISSN 1746-0441, e-ISSN 1746-045X 1All rights reserved: reproduction in whole or in part not permitted
Exp
ert O
pin.
Dru
g D
isco
v. D
ownl
oade
d fr
om in
form
ahea
lthca
re.c
om b
y W
ashi
ngto
n U
nive
rsity
Lib
rary
on
08/2
7/13
For
pers
onal
use
onl
y.

3. Caspases: key players in the apoptosispathway
There are two well-characterized apoptotic pathways: i) theextrinsic pathway, initiated by ligand-induced activation ofdeath receptors on the cell surface and ii) the intrinsic path-way, initiated by leakage of the mitochondrial outer mem-brane due to cellular damage [8]. A simplified diagram of thehighly complex extrinsic and intrinsic apoptotic pathways isshown in Figure 1.Apoptosis involves activation of caspases (cysteinyl aspar-
tate proteases), a family of proteins that cleave peptide bondsat the carboxyl side of aspartic acid. In mammals, 14 caspasesare segregated into two broad groups: i) initiator caspases,including caspase-2, -8, -9 and -10, that cleave inactive zym-ogens (enzyme precursors) and ii) effector caspases, includingcaspase-3, -6 and -7 (also known as executioner caspases), thatcleave intercellular proteins. Phylogenetic analysis of the cata-lytic and substrate recognition regions of caspases identifiedin: C. elegans, Drosophila melanogaster, Xenopus laevis, Daniorerio, Gallus gallus, Mus musculus and Homo sapiens confirmthat both initiator and executioner caspases are present in allspecies [9]. In zebrafish, caspase-2, -3, -6, -7, -8 and -9 havebeen identified and cloned [10,11].
4. Caspases are involved in severalneurodegenerative diseases
Abnormal regulation of apoptosis has been implicated in theonset and progression of a broad range of diseases and manydisorders are categorized by association with either decreasedor increased apoptosis, which is present in several neurode-generative diseases. For example, in Parkinson’s disease, anincrease in apoptotic nuclei and immunoreactivity have beenobserved [12]. In mice, caspase-3 is activated in dopaminergicneurons directly after 1-methyl-4-phenyl-1,2,3-tetrahydro-pyridine (MPTP) treatment [13]. In Alzheimers patients,apoptosis-related gene expression, including Bcl-2 and p53,have been observed in neuron associated plaque [14,15]. Apo-ptosis, DNA fragmentation, increased Bax mRNA expression
and caspase-3 activation have also been found in the spinalcord and motor cortex of amyotrophic lateral sclerosis (ALS)patients [16,17]. Apoptosis has been detected in neurons ofstroke and traumatic brain injury patients using the terminaldeoxynucleotidyl transferase mediated dUTP nick end label-ing assay (TUNEL), which assesses DNA breaks [18]. Inaddition, activated caspase-3 has been detected in thecerebrospinal fluid (CSF) of patients with head trauma [19].
5. Apoptosis: a good target for drugdiscovery
Insight into the mechanisms of apoptosis has resulted in asurge in research aimed at developing drug candidates thateither inhibit or activate cell death. The discovery of numer-ous signaling proteins and their receptors has armed biophar-maceutical companies with tools to fix the apoptotic cellularmachinery when it goes awry or to harness its potential forcell killing. In particular, since it is known that tumor cellsproliferate when the apoptotic engine fails to operate, a num-ber of approaches aimed at cancer therapy are under investiga-tion in commercial settings. Potential methods of repairinclude: stimulating death receptors in order to restoreapoptotic functions in cancer cells, stimulating apoptosis intumor induced angiogenic vessels and imitating apoptosisusing engineered bacteria. Using this approach, an adenovirusthat specifically replicates in and kills p53-deficient cells hasbeen assessed in clinical trials as a possible anti-tumor agent.However, effective therapies must be delivered to and acti-vated in specific targeted cells, a constraint that has impededdevelopment of several cell-based therapies, including viral-based approaches. Indiscriminate apoptosis inhibition maycause widespread hyperplasia and inappropriate activationmay cause undesirable tissue degeneration. Caspase-3 and-7 are known to be responsible for cleaving crucial substratesduring the final stage of cell degradation [20] and inhibitionof caspase-3 and/or -7 can potentially arrest death signalsfrom several pathways, which may be a more effective thera-peutic strategy than inhibiting factors involved in early stages.Increased understanding of the physiological process of apo-ptosis at the molecular level will provide insight into diseasepathogenesis and open new avenues for developing diagnostic,prognostic and therapeutic tools.
6. Conventional assays for assessingapoptosis
Since compounds that either inhibit apoptosis or derail theprocesses involved in cell death can potentially provide majortherapeutic benefits, several cell-based and whole animalmodel organism assays have been developed for research anddrug discovery. Currently, there are two primary approachesfor analyzing apoptosis. The first approach uses standard cellculture techniques combined with fluorescent probes, whichintercalate into the DNA of dying cells. The second approach
Article highlights.
. Apoptosis pathways are highly conserved among speciesincluding zebrafish.
. Apoptosis is a significant target for identifying inducersand inhibitors.
. Zebrafish has been shown to be a predictive model fordrug discovery.
. Conventional cell-based assay formats can be adaptedfor analyzing compound effects in whole zebrafish.
. In several studies, results in zebrafish have been shownto be predictive of results in mammals.
This box summarizes key points contained in the article.
P. McGrath & W. L. Seng
2 Expert Opin. Drug Discov. (2013) 8 (10)
Exp
ert O
pin.
Dru
g D
isco
v. D
ownl
oade
d fr
om in
form
ahea
lthca
re.c
om b
y W
ashi
ngto
n U
nive
rsity
Lib
rary
on
08/2
7/13
For
pers
onal
use
onl
y.

uses antibody staining on cultured cells. These widely usedassays are generally adequate for assessing inhibition or activa-tion of apoptosis in specific cell types. However, a majordrawback is that these formats do not assess effects in physio-logically intact whole organisms. To overcome the drawbacksof cell-based assays, apoptotic cells can also be detected insectioned tissues using either conventional histochemicalstaining or TUNEL staining [21].
7. Zebrafish: a predictive model for assessingapoptosis
Genetically, there is a closer resemblance between zebrafish andhumans than other non-mammalian model organisms and thisvertebrate has become the model of choice for developmentalbiologists. Underscoring its potential for studying humandiseases, all essential components of vertebrate morphologyand organ development are mimicked in the zebrafish andthe molecular bases are similar or identical [22-25].
For drug screening, zebrafish have several important advan-tages including: external fertilization, a large number ofembryos per mating (50 -- 100) and rapid development. Theentire vertebrate body plan is established by 24 h and precur-sor cells in the brain, eyes, heart and musculature can be easilyvisualized using light microscopy [25,26]. The gut, liver, kidneyand vasculature form by 48 h and morphogenesis is completeby ~ 72 h. Developmental apoptosis occurs throughout thisperiod, and, at later stages, cell death can be induced by treat-ment with compounds previously characterized in mammals(Table 1) [27-31].
Although visual assessment of staining is sufficient toassess significant changes in the number of apoptoticcells [27,32], quantitative information is more desirable for ana-lyzing dose--response and comparing compound potency. Inorder to analyze compound effects in specific regions of wholezebrafish, semi-quantitative morphometric image analysisoffers several advantages [27]. In addition, zebrafish can bereared in individual wells of 96-well microplates (Figure 2),comparatively high throughput whole animal assays can bedeveloped, an advantage no other vertebrate model pro-vides [26,33,34]. Because small amount of compound (µg vsmg) can be added directly to the fish water, this format isparticularly attractive for drug screening using conventionalcell-based liquid handling and analytical instrumentation.
Similar to higher vertebrates, in zebrafish, multiple deathpathways and multiple components of death regulatorsprovide additional advantages for drug screening. Recently,transgenic zebrafish exhibiting fluorescent annexin V labeledapoptotic cells have been generated, enabling assessment ofcell death in different cell populations during develop-ment [35]. Fluorescence in stably or transiently transfectedtransgenic animals can be quantified using either slide ormicroplate-based formats.
8. Whole animal zebrafish apoptosis assays
In this review, we discuss several approaches for assessing celldeath in zebrafish. First, visual assessment of developmen-tally regulated apoptosis in transparent zebrafish usingacridine orange (AO) staining and fluorescence microscopyis described. Second, generation of a chemical induced apo-ptosis disease model which is used to identify potential neu-roprotectants is described. For this assay format, zebrafishwere treated with L-2-hydroxyglutaric acid (LGA), a chemi-cal that induces brain specific apoptosis. Then, effects of co-treatment with characterized neuroprotectants were analyzedby morphometric image analysis. Third, assessment ofeffects of radioprotectants on irradiated zebrafish using ahighly sensitive chemiluminescent human caspase specificsubstrate and a quantitative 96-well microplate format isdescribed. In this study, cell death was also assessed on tissuesections using TUNEL staining.
Death
recep
tor
Adaptors
Caspase-8
Zymogens
Caspase-3 Caspase-7
Extrinsic pathway Intrinsic pathway
Caspase-9
Apaf-1 Cyt C
Mitochondria
Apoptosis
Figure 1. Simplified drawing of extrinsic and intrinsic
apoptotic pathways. In the extrinsic pathway, binding of
death receptors activates caspase-8, which in turn activates
caspase-3 and/or -7, which are responsible for proteolytic
cleavage of cellular proteins. In the intrinsic pathway,
mitochondrial damage causes leakage of cytochrome C into
the cytoplasm and activates Apaf-1, which activates initiator
caspase-9, which in turn activates executioner caspase-3 and/
or -7.
Use of zebrafish apoptosis assays for preclinical drug discovery
Expert Opin. Drug Discov. (2013) 8(10) 3
Exp
ert O
pin.
Dru
g D
isco
v. D
ownl
oade
d fr
om in
form
ahea
lthca
re.c
om b
y W
ashi
ngto
n U
nive
rsity
Lib
rary
on
08/2
7/13
For
pers
onal
use
onl
y.

8.1 Visual assessment of drug effects on
developmentally regulated apoptosisUnderscoring the versatility of the model organism for drugscreening, compound effects on developmentally regulatedapoptosis in live, transparent 2 day post fertilization (dpf)zebrafish were assessed visually. At this stage, apoptosis is pres-ent in the hatching gland and olfactory pits (Figure 3). In con-trast, only a few dispersed apoptotic cells can be visualized inthe tail. By 3 dpf, essentially no apoptosis is visible at any sitein whole zebrafish [27].In this study, effects of C3-tris, a water soluble fullerene,
were assessed using AO, a vital dye. In rats, C3-tris haspreviously been shown to be highly effective in blockingcell death induced by chemical toxins and electromagneticradiation [36,37]. Based on results from an initial lethalitytest, 1 dpf zebrafish were incubated with 10 µM C3-tris for
24 h. Untreated control animals exhibited strong AO stainingin the hatching gland and the olfactory pits (Figure 3A and C,hg, op) [38]. In contrast, after drug treatment, staining in thesetwo sites was insignificant (Figure 3B and D).
8.1.1 Zebrafish handlingZebrafish embryos were generated by natural pair-wisemating [39]. Four to five pairs were setup for each matingand on average 50 -- 100 embryos per pair were generated.Embryos were maintained in fish water (5 g of Instant OceanSalt with 3 g of CaSO4 in 25 L of distilled water) at 28�Cfor 6 h and then sorted based on viability; viability was thenreassessed at 24 hours post fertilization (hpf). Becauseembryos receive nourishment from an attached yolk sac, noadditional maintenance was required.
8.1.2 Drug treatment1 dpf zebrafish were deposited into 6-well microplates,10 zebrafish per well and treated with 10 µMC3-tris fullerenefor 24 h. Untreated and 0.1% DMSO-treated zebrafish wereused as assay and vehicle controls. After drug treatment,2 dpf control and drug-treated zebrafish were then washedfor AO staining [acridinium chloride hemi-(zinc chloride),Sigma-Aldrich] [38].
8.1.3 AO apoptosis stainingUntreated and C3-tris-treated zebrafish were immersed in1.5 g/ml AO in fish water at 28�C for 60 min [38]. AO wasthen removed by washing animals in fish water three times,5 min each. For visualization using fluorescence microscopy,zebrafish were anesthetized with MESAB (0.5 mM 3-amino-benzoic acid ethyl ester, 2 mM Na2HPO4) and mounted in2.5% methylcellulose on a depression slide.
8.1.4 Fluorescence microscopyFluorescence microscopy studies were performed using a ZeissM2 Bio fluorescence microscope equipped with FITC filter
Table 1. Effects of antioxidants on LGA induced zebrafish brain specific apoptosis.
Compounds Biological function BBB
permeable
EC50
(mM)
Max. %
inhibition*
D-Methionine (D-MET) Free radical scavenger Yes 250 58Indole-3-carbinol Free radical scavenger No ND InDeferoxamine (DFO) Iron chelator Yes 0.75 80Dihydroxybenzoate (DHB) Iron chelator Yes 0.04 82Deprenyl MAO inhibitor Yes 5.8 85L-NAME (N(G))-nitro-L-arginine methyl ester Nitric oxide synthase inhibitor Yes 0.67 63n-acety L-cysteine (L-NAC) Increases GSH Yes 7.8 582-Oxothiazolidine-4-carboxylate (OTC) Increases GSH Yes 4.8 58Lipoic acid Reduces lipid oxidation growth
factor synthesis and secretionYes 1.4 82
Buthionine sulfoximine (BSO) (negative control) Inhibits GSH synthesis Yes ND In
*p < 0.05.
In: Insignificant; ND: Not Determined.
Figure 2. Single zebrafish in wells of a 96-well microplate.
Single zebrafish, shown here at 5 dpf stage, can be cultured
in 100 µl fish water per well. Zebrafish do not require
feeding through 7 dpf, facilitating high throughput
screening.
P. McGrath & W. L. Seng
4 Expert Opin. Drug Discov. (2013) 8 (10)
Exp
ert O
pin.
Dru
g D
isco
v. D
ownl
oade
d fr
om in
form
ahea
lthca
re.c
om b
y W
ashi
ngto
n U
nive
rsity
Lib
rary
on
08/2
7/13
For
pers
onal
use
onl
y.

sets and an Axiocam camera (Carl Zeiss Microimaging, Inc.).Images were captured using Axiovision software Rel 4.0 (CarlZeiss Microimaging, Inc.) and processed using Photoshop6.0 (Adobe).
8.1.5 SummaryPresence of developmentally regulated apoptosis in transpar-ent, early stage zebrafish provides a unique parameter fordrug screening especially for identifying inhibitors. Effectscan be assessed visually using microscopy, as described here,or using automated formats including semi-quantitativemorphometric image analysis or quantitative microplateformats, as described below.
8.2 A chemical induced apoptosis disease model and
morphometric image analysisOne strategy for generating an apoptosis disease model fordrug screening is to chemically induce site specific cell deathand then to assess effects of potential protectants. In onerecent study, animals were co-treated with LGA, which indu-ces brain specific apoptosis and characterized neuroprotec-tants. After drug treatment, AO staining in live zebrafishwas analyzed using morphometric image analysis.
Hydroxyglutaric acids, which are structurally similar to glu-tamate, the primary excitatory amino acid, have been shownto promote oxidative stress and neuronal apoptosis in the
rodent brain [24,25]. In patients diagnosed with hydroxygluta-ric aciduria [17,23], LGA accumulates in the CSF and otherbodily fluids. LGA has also been shown to induce brainspecific apoptosis in zebrafish [27].
8.2.1 Generation of a chemical induced brain specific
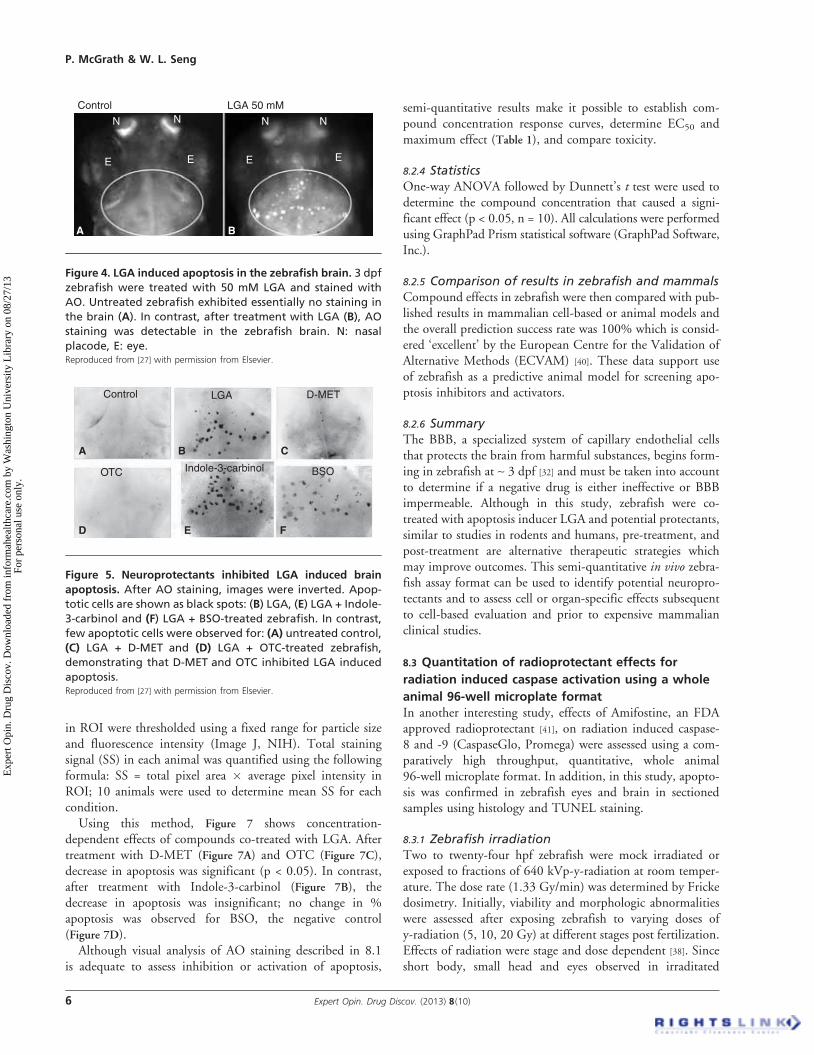
apoptosis disease modelAlthough the mechanism of action may not be known, inorder to generate a chemical induced disease model, com-pounds are added directly to fish water containing wild typeanimals. Using this strategy, LGA, which is blood--brain bar-rier (BBB) permeable, induced dose dependent, brain specificapoptosis AO staining (Figure 4). In contrast, untreated con-trols exhibited essentially no apoptosis in the brain region.Further supporting the brain specific effect of LGA, no apo-ptosis was observed in other sites or organs [27]. An additionaladvantage of this model for drug screening is that LGAinduced apoptosis persists for at least 5 days, an adequatetime window to assess effects of potential neuroprotectants.
8.2.2 Visual assessment of inhibition of LGA induced
brain specific apoptosis by neuroprotectantsIn this study, 3 dpf zebrafish were co-treated with 50 mMLGA and 9 characterized antioxidants, D-Methioine (D-MET), Indole-3-carbinol, Deferoxamine (DFO), Dihydroxy-benzoate (DHB), Deprenyl, L-NAME (N(G))-nitro-L-argininemethyl ester, n-acety L-cysteine (L-NAC), 2-Oxothiazolidine-4-carboxylate (OTC), Lipoic acid and one negative control com-pound, Buthionine sulfoximine (BSO) (Table 1); 1% DMSOwas used as vehicle control. Zebrafish handling was performedas described in 8.1.1. Results for these 9 neuroprotectants inzebrafish were predictive of results in mammals [27].
Here, we show results for representative compounds. Forthis assay format, similar to analysis described in 8.1, brainspecific apoptosis was initially visually assessed by AO stain-ing. As shown in Figure 5, compared to the untreated control(Figure 5A), LGA-treated zebrafish exhibited numerous apo-ptotic cells in the brain (Figure 5B, shown as black spots).Few apoptotic cells were observed after treatment with neuro-protectants: LGA + D-MET (Figure 5C) and LGA + OTC(Figure 5D), demonstrating that D-MET and OTC inhibitedLGA induced apoptosis. In contrast, numerous apoptotic cellswere observed after treatment with both LGA + Indole-3-car-binol (Figure 5E) and LGA + BSO (Figure 5F, negative controlcompound), indicating Indole-3-carbinol and BSO wereineffective in preventing LGA induced apoptosis.
8.2.3 Analysis of neuroprotective effects using
morphometric image analysisNext, AO staining results were analyzed using morphometricimage analysis adapted for zebrafish [27]. The dorsal side ofanimals was imaged using a fixed exposure time (0.2 s) andgain (10%) and inverted fluorescence images were processed(Figure 6). The mid/hind brain region was selected as theregion of interest (ROI) (Figure 6 circled area). Positive signals
A B
C D
Hg
Op
Op
Hg
Control 10 µM C3-tris
Figure 3. Inhibition of developmentally regulated apoptosis
by C3-tris fullerene. 1 dpf zebrafish were treated with 10 µMC3-tris for 24 h and stained with AO. After treatment with
C3-tris, AO staining decreased significantly in the hatching
gland (hg) (B) and the olfactory pits (op) (D), compared to
untreated controls (A and C).Reproduced from [38] with permission of Taylor & Francis.
Use of zebrafish apoptosis assays for preclinical drug discovery
Expert Opin. Drug Discov. (2013) 8(10) 5
Exp
ert O
pin.
Dru
g D
isco
v. D
ownl
oade
d fr
om in
form
ahea
lthca
re.c
om b
y W
ashi
ngto
n U
nive
rsity
Lib
rary
on
08/2
7/13
For
pers
onal
use
onl
y.
in ROI were thresholded using a fixed range for particle sizeand fluorescence intensity (Image J, NIH). Total stainingsignal (SS) in each animal was quantified using the followingformula: SS = total pixel area � average pixel intensity inROI; 10 animals were used to determine mean SS for eachcondition.Using this method, Figure 7 shows concentration-
dependent effects of compounds co-treated with LGA. Aftertreatment with D-MET (Figure 7A) and OTC (Figure 7C),decrease in apoptosis was significant (p < 0.05). In contrast,after treatment with Indole-3-carbinol (Figure 7B), thedecrease in apoptosis was insignificant; no change in %apoptosis was observed for BSO, the negative control(Figure 7D).Although visual analysis of AO staining described in 8.1
is adequate to assess inhibition or activation of apoptosis,
semi-quantitative results make it possible to establish com-pound concentration response curves, determine EC50 andmaximum effect (Table 1), and compare toxicity.
8.2.4 StatisticsOne-way ANOVA followed by Dunnett’s t test were used todetermine the compound concentration that caused a signi-ficant effect (p < 0.05, n = 10). All calculations were performedusing GraphPad Prism statistical software (GraphPad Software,Inc.).
8.2.5 Comparison of results in zebrafish and mammalsCompound effects in zebrafish were then compared with pub-lished results in mammalian cell-based or animal models andthe overall prediction success rate was 100% which is consid-ered ‘excellent’ by the European Centre for the Validation ofAlternative Methods (ECVAM) [40]. These data support useof zebrafish as a predictive animal model for screening apo-ptosis inhibitors and activators.
8.2.6 SummaryThe BBB, a specialized system of capillary endothelial cellsthat protects the brain from harmful substances, begins form-ing in zebrafish at ~ 3 dpf [32] and must be taken into accountto determine if a negative drug is either ineffective or BBBimpermeable. Although in this study, zebrafish were co-treated with apoptosis inducer LGA and potential protectants,similar to studies in rodents and humans, pre-treatment, andpost-treatment are alternative therapeutic strategies whichmay improve outcomes. This semi-quantitative in vivo zebra-fish assay format can be used to identify potential neuropro-tectants and to assess cell or organ-specific effects subsequentto cell-based evaluation and prior to expensive mammalianclinical studies.
8.3 Quantitation of radioprotectant effects for
radiation induced caspase activation using a whole
animal 96-well microplate formatIn another interesting study, effects of Amifostine, an FDAapproved radioprotectant [41], on radiation induced caspase-8 and -9 (CaspaseGlo, Promega) were assessed using a com-paratively high throughput, quantitative, whole animal96-well microplate format. In addition, in this study, apopto-sis was confirmed in zebrafish eyes and brain in sectionedsamples using histology and TUNEL staining.
8.3.1 Zebrafish irradiationTwo to twenty-four hpf zebrafish were mock irradiated orexposed to fractions of 640 kVp-y-radiation at room temper-ature. The dose rate (1.33 Gy/min) was determined by Frickedosimetry. Initially, viability and morphologic abnormalitieswere assessed after exposing zebrafish to varying doses ofy-radiation (5, 10, 20 Gy) at different stages post fertilization.Effects of radiation were stage and dose dependent [38]. Sinceshort body, small head and eyes observed in irraditated
Control
A B C
D E F
OTC Indole-3-carbinol BSO
LGA D-MET
Figure 5. Neuroprotectants inhibited LGA induced brain
apoptosis. After AO staining, images were inverted. Apop-
totic cells are shown as black spots: (B) LGA, (E) LGA + Indole-
3-carbinol and (F) LGA + BSO-treated zebrafish. In contrast,
few apoptotic cells were observed for: (A) untreated control,
(C) LGA + D-MET and (D) LGA + OTC-treated zebrafish,
demonstrating that D-MET and OTC inhibited LGA induced
apoptosis.Reproduced from [27] with permission from Elsevier.
N N
E
A B
Control LGA 50 mM
E
N N
E E
Figure 4. LGA induced apoptosis in the zebrafish brain. 3 dpf
zebrafish were treated with 50 mM LGA and stained with
AO. Untreated zebrafish exhibited essentially no staining in
the brain (A). In contrast, after treatment with LGA (B), AO
staining was detectable in the zebrafish brain. N: nasal
placode, E: eye.Reproduced from [27] with permission from Elsevier.
P. McGrath & W. L. Seng
6 Expert Opin. Drug Discov. (2013) 8 (10)
Exp
ert O
pin.
Dru
g D
isco
v. D
ownl
oade
d fr
om in
form
ahea
lthca
re.c
om b
y W
ashi
ngto
n U
nive
rsity
Lib
rary
on
08/2
7/13
For
pers
onal
use
onl
y.

zebrafish [41] indicated potential apoptosis [41], the effects ofradiation on caspase level were investigated.
8.3.2 Caspase level assessed in whole zebrafish using
a 96-well microplate formatFor this assay format, zebrafish were maintained at densities< 20 embryos/5 ml medium and irradiated with 0 -- 10 Gyat 4 hpf. Zebrafish samples were plated into black, clear bot-tomed, 96-well plates, 10 embryos per well. Chemilumines-cent CaspaseGlo reagents were added and zebrafish wereincubated for 2 h. Plates were then imaged using a Kodak4000 MM Imaging System. Images were captured andinverted and positive luminescence was detectable as darkcolor (Figure 8A). Photon emission was analyzed using KodakMolecular Imaging Software. Arbitrary luminescent unitswere defined by the software. Individual wells were manuallydefined as ROI and the background value was subtracted.
The caspase microplate assay was optimized using severalcontrols including: buffer alone, reagent powder alone, com-bined reagent powder and buffer without zebrafish, mockirradiation and varying numbers of zebrafish [41]. Tenzebrafish/well was optimal and level of caspase-8 and -9luminescence was radiation dose dependent (Figure 8A).
8.3.3 Quantitation of radioprotectant effects using a
96-well microplate assayTo optimize the 96-well microplate format, prior to irradia-tion, zebrafish were exposed to 4 mmol/L Amifostine, a char-acterized drug (Medimmune Oncology), for 30 min. Then,zebrafish (4 hpf) were irradiated with 0, 2, 6, or 10 Gy in:i) medium alone (IR alone), ii) presence of Amifostine(IR + Amifostine), iii) presence of Z-VAD-fmk, a known cas-pase inhibitor (IR +Z-VAD-fmk) [42] and iv) mock irradiatedand exposed to Staurosporine, a known caspase activator [43].Caspase-9 specific reagent was added and microplates wereimaged.
After treatment with: i) mock irradiation (IR alone) andii) Staurosporine, luminescence intensity was very strong(Figure 8A), validating the assay. However, after treatment
with iii) IR + Amifostine and iv) IR + Z-VAD-fmk (IR + Cas-pase inhib, Figure 8A), luminescence intensity decreased sig-nificantly, indicating Amifostine inhibited radiationinduced caspase activity.
Histograms displaying relative levels of luminescenceshown in arbitrary units, showed significant inhibition ofcaspase activity after co-treatement with Amifostine(Figure 8B). In contrast, treatment with Staurosporine increasedluminescence intensity (Figure 8A and B), validating the assay.
8.3.4 Irradiation induced cell death confirmed by
TUNEL staining on sectioned tissueIn this study, after irradiation, loss of tectum matter, disorga-nized retina and decreased number of neuronal cells in retinallayers were observed in histology sections [41]. Since micro-cephaly and micro-ophthalmia were attributed to cell death,confirmatory TUNEL analysis was then performed on histo-logical sections. Mock irradiated control and 10 Gy irradiatedzebrafish were fixed in 4% paraformaldehyde for 24 h andwashed with 1% PBS. Zebrafish were then embedded in par-affin and sectioned. To determine the location of TUNELstaining, the same field was analyzed using both phase con-trast and fluorescence images. Unirradiated control brainand eye showed no TUNEL labeling [41]. In contrast, 10-Gyradiation caused substantial TUNEL staining throughoutthe tectum (average of 57 ± 12 positive cells per field). Co-treatment with Amifostine significantly decreased apoptosis(average of 7 ± 3 positive cells per field) [41].
8.3.5 SummaryThis study supports use of zebrafish to identify potentialradioprotectants. Similar, comparatively high throughputmicroplate assay formats using: AO [25], TUNEL or antibodystaining [34], can be adapted to quantify drug effects in wholeanimals. In addition to caspase-8 and -9, reagents specific forhuman caspase-3 and -7, additional potential drug targets,have been shown to cross react in zebrafish (W. Seng, unpub-lished data). These microplate assay formats, widely usedfor cell-based analysis, are rapid, reproducible, and requireminimal sample manipulation. Next, we describe use of this
TIFF image Invert Threshold andselect ROI
Quantify signalin ROI
Figure 6. Morphometric image analysis. Dorsal view of AO stained zebrafish brain photographed using fixed exposure time
and gain, inverted, and analyzed using Image J software. A constant threshold was applied and total fluorescence signal was
then quantitated in the region of interest (ROI, circled area).Reproduced from [53] with permission of John Wiley and Sons.
Use of zebrafish apoptosis assays for preclinical drug discovery
Expert Opin. Drug Discov. (2013) 8(10) 7
Exp
ert O
pin.
Dru
g D
isco
v. D
ownl
oade
d fr
om in
form
ahea
lthca
re.c
om b
y W
ashi
ngto
n U
nive
rsity
Lib
rary
on
08/2
7/13
For
pers
onal
use
onl
y.

format for comparatively high throughput whole animal drugscreening.
9. Potential strategy for compound libraryscreening using whole zebrafish
Since several cell-based microplate assay formats have beendeveloped for assessing compound effects in zebrafish [32,33],this approach can be incorporated into a strategy for screeningcompound libraries. To increase efficiency, conventional highthroughput screening (HTS) paradigms frequently assessresults using a single compound concentration [44]. However,this strategy can result in high rates of false positives and false
negatives [44]. Here, using conventional cell-based methods,we describe a 2 tier strategy to identify potential drug candi-dates in whole zebrafish. In the first tier, in order to rapidlyeliminate ineffective compounds, analysis is performed ini-tially at the highest concentration selected, for example,100 µM. Ordinarily, if a compound is positive, effects willbe more pronounced at higher concentrations [45]. In contrast,if results are negative at the high concentration, it is unlikelyeffects will be statistically significant at lower concentrations.In the second tier, to eliminate false positives, potential hits(p < 0.05) identified in the first tier are reassessed using mul-tiple concentrations, for example, 0.1, 1, 10, and 100 µM.The ability to generate a dose response is generally considered
00.001 0.01 0.1
Concentrations (µM)
1 10 100 1000
20
40Ap
op
tosi
s (%
)
60
80
100
120
00.001 0.01 0.1
Concentrations (µM)
1 10 100 1000
20
40Ap
op
tosi
s (%
)
60
80
100
120
00.001 0.01 0.1
Concentrations (µM)
1 10 100 1000
20
40
Ap
op
tosi
s (%
)
60
80
100
120
00.001 0.01 0.1
Concentrations (µM)
1 10 100 1000
20
40Ap
op
tosi
s (%
)
60
80
100
120
A B
C D
Figure 7. Concentration response curves for neuroprotectants. 3 dpf zebrafish were co-treated with LGA and protectants for
24 h. AO staining and morphometric analysis were then used to quantify % apoptosis. AO signal in LGA-treated zebrafish was
considered 100%. X axis represents concentration; Y axis represents % apoptosis. Each point represents mean ± SD (n = 10).
Significant decrease in % apoptosis was observed for treatment with D-MET (A) and OTC (C). In contrast, decrease in %
apoptosis after treatment with Indole-3-carbinol (B) was insignificant and no change in % apoptosis was observed after
treatment with BSO (D).Reproduced from [27] with permission from Elsevier.
P. McGrath & W. L. Seng
8 Expert Opin. Drug Discov. (2013) 8 (10)
Exp
ert O
pin.
Dru
g D
isco
v. D
ownl
oade
d fr
om in
form
ahea
lthca
re.c
om b
y W
ashi
ngto
n U
nive
rsity
Lib
rary
on
08/2
7/13
For
pers
onal
use
onl
y.

additional confirmation that a compound is a true posi-tive [44,45]. Next, to reduce the number of false negatives,lethal compounds identified in the first tier are also screenedusing multiple concentrations.
Using this approach to identify compounds that affect apo-ptosis, as described in 8.3, caspase substrate is added directlyafter compound treatment. No washing steps or bufferchanges are required and damage and loss due to processingare decreased and throughput is increased. In addition, com-pound treatment and assay processing can be performed inthe same wells, facilitating automation. A conventional auto-mated liquid handler, such as Rapidplate (Caliper Life Scien-ces), adapted for processing zebrafish, is suitable fordispensing compounds and substrate and relative luminescentunits (RLU) can be quantified using a conventional 96-wellmicroplate reader.
9.1 Preliminary hit criteriaIn this screening strategy, in order to identify potential hitcompounds, stringent hit criteria can be used including:i) significant compound effect (p < 0.05), and ii) % Inhibitionor Activation greater than the variation observed for the vehi-cle control. Although use of a large number of wells (12) percondition reduces throughput, a large number of samplesprovides good statistical power. In addition, testing multipleconcentrations (5) of each potential hit compound in a secondtier screen facilitates elimination of false positives.
9.2 Estimated throughput for screening a
1000 member compound libraryCompound library screening involves: a) zebrafish samplepreparation, b) drug treatment, c) microplate assay processingand d) data analysis. For assay processing, a compact liquid
handler which has the capacity for 4, 96-well microplatescan be used. Since approximately 3 h are required for samplepreparation, ~ 3 h per day are available for microplate proc-essing. Quantitation of RLU in each microplate takes~ 5 min, and 12 microplates can be processed per hour; there-fore, 36 microplates can be processed per day (12 microplatesper hour x 3 h per day). For the first tier, single concentrationscreen, 12 wells in each of 6 microplate rows contain separatecompounds, and 2 rows contain assay and vehicle controls;therefore, ~ 216 compounds can be processed per day (6 com-pounds per microplate � 36 microplates per day = 216) and1000 compounds can be processed in ~ 5 days. Taking intoaccount time for drug treatment and data analysis, a singleconcentration of 1000 compounds can be screenedin ~ 9 days.
Subsequently, compounds exhibiting significant effects inthe first tier screen can be assessed in a second tier multipleconcentration screen, for example: 0.1, 1, 10, 50 and100 µM. A single row on each microplate is used for eachof 5 compound concentrations and 2 rows are required forcontrols (assay and vehicle); therefore, 7 rows on each micro-plate are required to screen each compound (one row remainsempty). Using the stringent hit criteria described above, it isanticipated that no more than 30% of compounds (300)will progress to the second tier screen. Assuming 36 micro-plates can be processed per day, then 300 compounds canbe processed in ~ 9 days (300 compounds by 36 microplatesper day = 8.3 days). Taking into account time for drug treat-ment and data analysis, ~ 20 days are required to perform thesecond tier, multiple concentration screen. Then 1000compounds can be screened in ~ 29 days (9 days for firsttier + 20 days for second tier), significant throughput for anin vivo bioassay.
IR aloneIR + Amifostine
IR + Caspase inhib.
× × ×
Dose (Gy)
0
IR alone
IR + Amifostine
IR + Caspase inhib.
Staurosporine
2 6 10
00 2 6 10 0 6
Dose (Gy)
10 0 2 6 102
500
1000
Arb
itar
ylu
min
esce
nce
un
its
1500
2000
A B
Figure 8. Quantitation of caspase activity using a 96-well microplate format. (A) Zebrafish were irradiated with 0, 2, 6, or
10 Gy at 4 hpf in medium alone (IR alone), in the presence of Amifostine (IR + Amifostine), in the presence of z-VAD-fmk (IR
+z-VAD-fmk), or mock irradiated and exposed to Staurosporine. Caspase-9 reagent was added and microplates were imaged
1 h after irradiation. All wells are shown as negative images. (B) Histograms show relative levels of emitted signal from
experiments shown in (A), displayed in arbitrary luminescence units.Reproduced from [41] with permission from American Association of Cancer Research.
Use of zebrafish apoptosis assays for preclinical drug discovery
Expert Opin. Drug Discov. (2013) 8(10) 9
Exp
ert O
pin.
Dru
g D
isco
v. D
ownl
oade
d fr
om in
form
ahea
lthca
re.c
om b
y W
ashi
ngto
n U
nive
rsity
Lib
rary
on
08/2
7/13
For
pers
onal
use
onl
y.

If a compound induces dramatically different effects at twoconsecutive test concentrations, the concentration range canbe narrowed and re-tested at twofold increments. For exam-ple, a compound that causes no effect at 1 µM and > 75%lethality at 10 µM can be re-tested at: 1, 2, 4, 8 and 10 µM.This iterative process reduces false negative results.
9.3 Confirmation of potential hitsTo reduce number of hits and to eliminate false positives,potential hits can be confirmed using a morphometricimage-based assay as described in 8.2. Then, similar to con-ventional drug screening strategies, hit compounds can besubsequently assessed using a conventional, low throughput,rodent model.
10. Conclusions
Data supporting use of zebrafish as a predictive animal modelfor drug screening continue to accumulate. Several inherentadvantages of the model support its high utility for assessingdrug effects on apoptosis and specific members of the caspasecascade. The ability to quantitate fluorescence or chem-iluminescence signals in whole animals provides a uniqueopportunity for drug screening.
11. Expert opinion
Use of zebrafish for preclinical drug screening is increasing,however, there are several challenges limiting more wide-spread use. Although the model has been used in Europe fordecades, in the USA, the model is relatively new and thepool of scientists trained to analyze zebrafish is comparativelysmall. Continued consolidation in the biopharmaceuticalindustry and a concomitant decrease in study sponsors havealso slowed acceptance. Lack of experimental data for a statis-tically significant number of compounds and lack of curatedcomparative data bases are additional factors reducing interestin the model. Although data presented for the studiesdescribed in this review show high predictivity, in other stud-ies, predictivity has been no better than in rodent models [46].Moreover, there is wide variation in experimental methodsamong labs. Regulatory requirements for new animal modelsas well as the mindsets of toxicologists and safety pharmacol-ogists also continue to hinder acceptance. An additional con-straint for using zebfrafish to predict toxicity and efficacy inhumans is that drug ADME is not well characterized;although drugs can be absorbed through skin, gills or mouth,absorption, distribution and metabolism may differ frommammals.
Reduced cost is a widely cited advantage of the zebrafishmodel, however, many pharmaceutical companies continueto require comparative validation studies in both mice andcell-based assays, increasing time and expense. Although apromising feature of the model is the ability to use conven-tional cell-based sample handling and analytical instrumenta-tion, to date, modification of many apparatus for use withzebrafish has been expensive and slow. An additional under-appreciated constraint of the model compared to cell-based analysis is the need to maintain a dedicated breedingfacility staffed by trained aquaculturists 24/7.
Despite these obstacles, the model offers compelling inher-ent advantages for drug screening including: rapid organogen-esis, transparency and a statistically significant number ofzebrafish per experiment. Availability of a wide variety ofcomparatively high throughput whole animal assay methodsand the ability to perform complex pathway analysis by geneknockdown [47,48] and knockin [49,50] techniques are impor-tant advantages. Recent advances in using transcriptionactivator-like effector nucleases (TALENs) to induce locus-specific mutations in the zebrafish genome for generatingstable mutant lines [51,52] further broaden the number ofapplications for the zebrafish model.
For preclinical drug screening, the model is particularlyuseful for ranking toxicity and efficacy of members in thesame chemical class [38]. Compound toxicity can initially bedetermined by assessing the LC50 or the maximum non-lethal concentration (MNLC), followed by assessing efficacyof non-toxic compounds in disease specific models (8.2).After toxicity profiling, pharmacological properties and bioa-vailabilty can be optimized by fine-tuning the combinationsof chemical building blocks. An additional advantage, sup-ported by the large number of embryos per mating, is theability to use complex matrices to screen compounds singlyor in combination in microplates, similar to cell-basedhigh throughput formats [41]. Based on the inherent advan-tages of this model organism for drug screening, developmentof unique, whole animal assays and disease models will belimited only by the imaginations of individual investigators.
Declaration of interest
This research was supported in part by National Institutes ofHealth grants: National Institute of Neurological Disordersand Stroke: 2R44 NS048607 and National Institute ofGeneral Medical Sciences: 1R43GM087754. P McGrath isthe President and CEO while WL Seng is a Project Directorat Phylonix. Both authors also declare that they are sharehold-ers of Phylonix.
P. McGrath & W. L. Seng
10 Expert Opin. Drug Discov. (2013) 8 (10)
Exp
ert O
pin.
Dru
g D
isco
v. D
ownl
oade
d fr
om in
form
ahea
lthca
re.c
om b
y W
ashi
ngto
n U
nive
rsity
Lib
rary
on
08/2
7/13
For
pers
onal
use
onl
y.

BibliographyPapers of special note have been highlighted as
either of interest (�) or of considerable interest(��) to readers.
1. Clarke PG. Developmental cell death:
morphological diversity and multiple
mechanisms. Anat Embryol
1990;181:195-213
2. Kerr JFR, Wyllie AH, Currie AR.
Apoptosis: a basic biological
phenomenon with wide-ranging
implications in tissue kinetics.
Br J Cancer 1972;26:239-57
3. Hetts SW. To die or not to die:
an overview of apoptosis and its role in
disease. JAMA 1998;279(4):300-7
. Describes the role of apoptosis in
disease pathogenesis and specific gene
targets for diagnosis and
drug development.
4. Ellis HM, Horvitz HR. Genetic control
of programmed cell death in the
nematode C. elegans. Cell
1986;44(6):817-29
5. Ellis RE, Yuan JY, Horvitz HR.
Mechanisms and functions of cell death.
Annu Rev Cell Biol 1991;7:663-98
6. Steller H. Mechanisms and genes of
cellular suicide. Science
1995;267(5203):1445-9
7. Thompson CB. Apoptosis in the
pathogenesis and treatment of disease.
Science 1995;267(5203):1456-62
.. Describes the role of apoptosis in
several diseases and its use as a specific
drug target.
8. Shi Y. Activation of initiator caspases:
history, hypotheses, and perspectives.
J Cancer Mol 2005;1(1):9-18
9. Lamkanfi M, Declercq W, Kalai M,
et al. Alice in caspase land.
A phylogenetic analysis of caspases
from worm to man. Cell Death Differ
2002;9(4):358-61
10. Eimon PM, Kratz E, Varfolomeev E,
et al. Delineation of the cell-extrinsic
apoptosis pathway in the zebrafish.
Cell Death Differ 2006;13(10):1619-30
11. Eimon PM, Ashkenazi A. The zebrafish
as a model organism for the study of
apoptosis. Apoptosis 2010;15(3):331-49
.. Comprehensive overview of apoptosis
in zebrafish.
12. Tatton NA. Increased caspase 3 and Bax
immunoreactivity accompany nuclear
GAPDH translocation and neuronal
apoptosis in Parkinson’s disease.
Exp Neurol 2000;166(1):29-43
13. Turmel H, Hartmann A, Parain K, et al.
Caspase-3 activation in 1-methyl-4-
phenyl-1,2,3,6-tetrahydropyridine
(MPTP)-treated mice. Mov Disord
2001;16(2):185-9
14. de la Monte SM, Sohn YK, Ganju N,
et al. P53- and CD95-associated
apoptosis in neurodegenerative diseases.
Lab Invest 1998;78(4):401-11
15. Mattson MP, Culmsee C, Yu ZF.
Apoptotic and antiapoptotic mechanisms
in stroke. Cell Tissue Res
2000;301(1):173-87
. Describes both pro and antiapoptotic
signaling cascades in stroke and
approaches for reducing neuronal
death in stroke patients.
16. Martin LJ. Neuronal death in
amyotrophic lateral sclerosis is apoptosis:
possible contribution of a programmed
cell death mechanism. J Neuropathol
Exp Neurol 1999;58(5):459-71
17. Mu X, He J, Anderson DW, et al.
Altered expression of bcl-2 and bax
mRNA in amyotrophic lateral sclerosis
spinal cord motor neurons. Ann Neurol
1996;40(3):379-86
18. Guglielmo MA, Chan PT, Cortez S,
et al. The temporal profile and
morphologic features of neuronal death
in human stroke resemble those observed
in experimental forebrain ischemia: the
potential role of apoptosis. Neurol Res
1998;20(4):283-96
19. Harter L, Keel M, Hentze H, et al.
Caspase-3 activity is present in
cerebrospinal fluid from patients with
traumatic brain injury. J Neuroimmunol
2001;121(1-2):76-8
20. Neviere R, Fauvel H, Chopin C, et al.
Caspase inhibition prevents cardiac
dysfunction and heart apoptosis in a rat
model of sepsis. Am J Respir Crit
Care Med 2001;163(1):218-25
21. Gavrieli Y, Sherman Y, Ben-Sasson SA.
Identification of programmed cell death
in situ via specific labeling of nuclear
DNA fragmentation. J Cell Biol
1992;119(3):493-501
22. Chen JN, Fishman MC. Zebrafish
tinman homolog demarcates the heart
field and initiates myocardial
differentiation. Development
1996;122(12):3809-16
23. Granato M, Nusslein-Volhard C. Fishing
for genes controlling development.
Curr Opin Genet Dev 1996;6(4):461-8
24. Wylie C. Zebrafish issue. Development
1996;123:1-481
.. Seminal issue on use of zebrafish as a
new animal model for research and
drug discovery.
25. Parng C, Anderson N, Ton C, et al.
Zebrafish apoptosis assays for drug
discovery. Methods Cell Biol
2004;76:75-85
. Describes approaches for developing
apoptosis assays in zebrafish.
26. Seng WL, Eng K, Lee J, et al. Use of a
monoclonal antibody specific for
activated endothelial cells to quantitate
angiogenesis in vivo in zebrafish after
drug treatment. Angiogenesis
2004;7(3):243-53
27. Parng C, Ton C, Lin YX, et al.
A zebrafish assay for identifying
neuroprotectants in vivo.
Neurotoxicol Teratol 2006;28(4):509-16
.. Describes use of developmentally
regulated apoptosis in zebrafish for
drug screening.
28. Park D, Haldi M, Seng WL. Zebrafish:
a new in vivo model for identifying
P-glycoprotein efflux modulators. In:
McGrath P, editor. Zebrafish, methods
for assessing drug safety and toxicity.
John Wiley & Sons, Inc; Hoboken, NJ:
2012. p. 177-90
29. Tang J, Tang S, Haldi M, et al.
Zebrafish assays for identifying potential
muscular dystrophy drug candidates. In:
McGrath P, editor. Zebrafish, methods
for assessing drug safety and toxicity.
John Wiley & Sons, Inc; Hoboken, NJ:
2012. p. 233-56
30. Ton C, Parng C. The use of zebrafish
for assessing ototoxic and otoprotective
agents. Hear Res 2005;208(1-2):79-88
31. Park D, Meidenbauer J, Sparta B, et al.
Zebrafish: a predictive model for
assessing seizure liability. In: McGrath P,
editor. Zebrafish, methods for assessing
drug safety and toxicity. John Wiley &
Sons, Inc; Hoboken, NJ:
2012. p. 165-75
32. Li C, Seng WL, Park D, et al. Methods
for assessing neurotoxicity in zebrafish.
In: McGrath P, editor. Zebrafish,
methods for assessing drug safety and
Use of zebrafish apoptosis assays for preclinical drug discovery
Expert Opin. Drug Discov. (2013) 8(10) 11
Exp
ert O
pin.
Dru
g D
isco
v. D
ownl
oade
d fr
om in
form
ahea
lthca
re.c
om b
y W
ashi
ngto
n U
nive
rsity
Lib
rary
on
08/2
7/13
For
pers
onal
use
onl
y.

toxicity. John Wiley & Sons, Inc;
Hoboken, NJ: 2012. p. 117-34
33. Li C, Luo L, Awerman J, et al. Whole
zebrafish cytochrome P450 assay for
assessing drug metabolism and safety. In:
McGrath P, editor. Zebrafish, methods
for assessing drug safety and toxicity.
John Wiley & Sons, Inc; Hoboken, NJ:
2012. p. 103-16
34. Li C, Luo L, McGrath P. Zebrafish
xenotransplant cancer model for drug
screening. In: McGrath P, editor.
Zebrafish, methods for assessing drug
safety and toxicity. John Wiley & Sons,
Inc; Hoboken, NJ: 2012. p. 219-32
.. Describes development of a whole
animal chemiluminescent microplate
format for drug screening.
35. van Ham TJ, Mapes J, Kokel D, et al.
Live imaging of apoptotic cells in
zebrafish. Faseb J 2010;24(11):4336-42
36. Daroczi B, Kari G, McAleer MF, et al.
In vivo radioprotection by the fullerene
nanoparticle DF-1 as assessed in a
zebrafish model. Clin Cancer Res
2006;12(23):7086-91
37. Lin AM, Fang SF, Lin SZ, et al. Local
carboxyfullerene protects cortical
infarction in rat brain. Neurosci Res
2002;43(4):317-21
38. Beuerle F, Witte P, Hartnagel U, et al.
Cytoprotective activities of water-soluble
fullerenes in zebrafish models.
J Exp Nanosci 2007;2(3):147-70
.. Describes strategies for drug design
using zebrafish assays.
39. Westerfield M. The zebrafish book:
a guide for the laboratory use of
zebrafish. The University of Oregon
Press; 1993
40. Genschow E, Spielmann H, Scholz G,
et al. The ECVAM international
validation study on in vitro
embryotoxicity tests: results of the
definitive phase and evaluation of
prediction models. European Centre for
the Validation of Alternative Methods.
Altern Lab Anim 2002;30(2):151-76
41. Geiger GA, Parker SE, Beothy AP, et al.
Zebrafish as a ‘biosensor’? Effects of
ionizing radiation and amifostine on
embryonic viability and development.
Cancer Res 2006;66(16):8172-81
42. Slee EA, Zhu H, Chow SC, et al.
Benzyloxycarbonyl-Val-Ala-Asp (OMe)
fluoromethylketone (Z-VAD.FMK)
inhibits apoptosis by blocking the
processing of CPP32. Biochem J
1996;315(Pt 1):21-4
43. Stepczynska A, Lauber K, Engels IH,
et al. Staurosporine and conventional
anticancer drugs induce overlapping, yet
distinct pathways of apoptosis and
caspase activation. Oncogene
2001;20(10):1193-202
44. Inglese J, Auld DS, Jadhav A, et al.
Quantitative high-throughput screening:
a titration-based approach that efficiently
identifies biological activities in large
chemical libraries. Proc Natl Acad
Sci USA 2006;103(31):11473-8
45. Yuill T, Miller M. Dose-response
relationship. In: Cleveland CJ, editor.
Encyclopedia of earth, envirobnmental
information coalition. National Council
for Science and the Environment;
Washington, D.C: 2008
46. Redfern WS, Waldron G, Winter MJ,
et al. Zebrafish assays as early safety
pharmacology screens: paradigm shift or
red herring? J Pharmacol
Toxicol Methods 2008;58(2):110-17
47. Nasevicius A, Ekker SC. Effective
targeted gene ‘knockdown’ in zebrafish.
Nat Genet 2000;26(2):216-20
48. Dong M, Fu YF, Du TT, et al.
Heritable and lineage-specific gene
knockdown in zebrafish embryo.
PLoS One 2009;4(7):e6125
49. Liu WY, Wang Y, Qin Y, et al.
Site-directed gene integration in
transgenic zebrafish mediated by cre
recombinase using a combination of
mutant lox sites. Mar Biotechnol (NY)
2007;9(4):420-8
50. Deiters A, Yoder JA. Conditional
transgene and gene targeting
methodologies in zebrafish. Zebrafish
2006;3(4):415-29
51. Dahlem TJ, Hoshijima K, Jurynec MJ,
et al. Simple methods for generating and
detecting locus-specific mutations
induced with TALENs in the zebrafish
genome. PLoS Genet 8(8):e1002861
52. Zu Y, Tong X, Wang Z, et al.
TALEN-mediated precise genome
modification by homologous
recombination in zebrafish. Nat Methods
10(4):329-31
53. Ton C, Lin Y, Willett C. Zebrafish as a
model for developmental neurotoxicity
testing. Birth Defects Res A Clin
Mol Teratol 2006;76(7):553-67
AffiliationPatricia McGrath† & Wen Lin Seng PhD†Author for correspondence
Phylonix, 100 Inman Street, Cambridge, 02139,
MA, USA
E-mail: [email protected]
P. McGrath & W. L. Seng
12 Expert Opin. Drug Discov. (2013) 8 (10)
Exp
ert O
pin.
Dru
g D
isco
v. D
ownl
oade
d fr
om in
form
ahea
lthca
re.c
om b
y W
ashi
ngto
n U
nive
rsity
Lib
rary
on
08/2
7/13
For
pers
onal
use
onl
y.