Embed Size (px)
Citation preview

Use of Neural Networks with Advection-Diffusion-Reaction Models to Estimate Large-Scale Movements of
Skipjack Tuna from Tagging Data
M. Shiham Adam*
and John R. Sibert
Pelagic Fisheries Research Program University of Hawaii at Manoa
Honolulu, HI 96822
*currently at Marine Research Centre, Ministry of Fisheries, Agriculture and Marine Resources
H. White Waves, Malé, Republic of Maldives
SOEST 04-03 JIMAR Contribution 04-350

Adam, M. S., and J. R. Sibert, Use of Neural Networks with Advection-Diffusion-Reaction Models to Estimate Large-Scale Movements of Skipjack Tuna from Tagging Data, 34 pp, University of Hawaii, Joint Institute for Marine and Atmospheric Research, 1000 Pope Road, Honolulu, HI 96822, 2004.
ii

Contents
1 Motivation 2 2 The model 2 3 Parameterizing movement fields 4
3.1 User of neural networks 5
3.2 Scaling the output 7
3.3 Constraining the parameters 7
4 Integrating the neural networks and estimation of the model parameters 10 5 Input data 11 6 Results and discussion 15
6.1 Simulation 21
6.2 Results from a typical fit 23
7 Recommendations for further research 29 8 Acknowledgments 30 9 References 30
iii

iv
Abstract
We explored integration of multi–layer, feed–forward neural networks into an advection–diffusion–reaction model to estimate large–scale tuna movement from conventional taggingdata. Two neural networks were used to compute spatially and temporally varying move-ment parameters from a series of input data specific to the computational grid. The firstneural network computed the zonal and meridional components of the advection term, andthe second computed the diffusion term. The input data, which are considered proxies forhabitat that may be important for determining skipjack behavior, include temporal (cal-endar year, month, Southern Oscillation Index), spatial (latitude, longitude, water depth,seabed topography, distance from the land), and spatio–temporal data (sea surface temper-ature and surface currents). The computed movement parameters from the neural networkswere used in the advection–diffusion–reaction model, along with the tag-attrition parameters(natural and fishing mortality rates), to compute predicted tag recaptures. The trainingof the neural network and simultaneous estimation of the other model parameters wereachieved by minimizing the negative log of a likelihood function that relates the observedand predicted tag recoveries.
The method was applied to the skipjack tuna data from the central and western PacificOcean. The results were compared against an earlier analysis of the same data where move-ment parameters were mapped onto a 10-region × 2-season advection-diffusion-reactionmodel. Numerous neural network configurations and parameter combinations were inves-tigated, and three-layer neural networks with 4-6 input nodes in the input layer and with3-5 nodes in the hidden layer were found to be reasonable. None of the models gave sat-isfactory estimates of the neural network (movement) parameters. In all the cases themovement parameters of the advection-diffusion-reaction model were poorly defined by theneural network models. The attrition parameters, however, were estimated satisfactorilyin all the models, and the predicted and observed tag recaptures showed good agreement,particularly for sporadic and isolated recaptures. This is in contrast with the regional andseasonal parameterization where model prediction was better for short–term recoveries.
Problems using neural networks in these models are discussed, and possible improvementsin the neural network configuration and alternative parameterization of the movement pa-rameters are suggested.

1 Motivation
Tunas have ocean–wide distributions in the tropical and subtropical regions of the world.They are highly mobile and are classified as ‘highly migratory’ in many international con-ventions. Within their broad geographic distribution, and in all the oceans, a multitude offisheries exploits the resource, both on the high seas and in the coastal regions. Most ofthe coastal tuna fishing nations are small island countries and their economies are often de-pendent on the tuna resource. Despite the tuna’s economic importance and their potentialfor fishery interactions, the effects of their movements on fishery management, at a level ofindividual fishery area, are normally neglected.
The state–of–the–art, ocean–wide stock assessment models that are in use today considerthe movement within the context of ‘bulk transfer’ models (Fournier et al. 1998; Hamptonand Fournier 2001). Although these models have been successful in predicting the changein population density in broad geographic regions, they cannot be used to predict changein an arbitrary point (or at fishery levels) because they are not continuous in space.
Advection–diffusion–reaction (ADR) models of continuous time and space have beensuccessfully used to model tagged populations of skipjack tuna on large scales (Sibert et al.1999; Adam and Sibert 2002; Sibert and Hampton 2003). The models estimate movementparameters using likelihood methods. However, in the absence of theory explicitly relatingmovement behavior to the environment, structural assumptions that associate movementparameters within regions and seasons were made for estimating the movement parameters.
In this investigation, we attempted to take a step further to improve upon the movementparameterization by making use of neural networks to compute local movement parametersfrom a variety of habitat proxies. The spatio-temporally varying movement parameterswere computed by the neural network and used in the ADR model described by Sibert etal. (1999) to simultaneously estimate the parameters for both the neural network and theADR model by maximum likelihood. We illustrate the approach using the SSAP1 data setused by Sibert et al. (1999).
2 The model
A tuna tagging experiment begins with release of tagged fish from one or more locations.Subsequent releases may occur and the experiment continues until the last tagged fish(or simply tags) have been recovered. The basic information collected include release andrecapture times and their geographic positions. The number of tags, Nxyt, at any giventime, t, at geographic position, (x, y), is given by
Nxyt =ct∑
c
Nxytc,(1)
1Skipjack Survey and Assessment Programme, Secretariat of the Pacific Community, Noumea, NewCaledonia
2

where Nxytc is the number of tags remaining alive at time, t, at the geographic position(x, y) that were released from cohorts thus far where c = 1, ..., c = ct. In the case wherea subsequent cohort, d, release occurs at time td at location (xd, yd) the density of thatlocation is reassigned to the sum of its present value and the cohort value, i.e.,
N txy ← Nxdydtdcd
+ct∑
c=1
Nxytc.(2)
Assuming the behavior of cohorts are independent, and that complete mixing of tagged andnon–tagged fish occurs following release such that they have equal probability of recapture,the population of tags may be represented by the ADR model (Bills and Sibert 1997; Sibertet al. 1999)
∂N
∂t=
∂
∂x
(D
∂N
∂x
)+
∂
∂y
(D
∂N
∂y
)− ∂
∂x(uN)− ∂
∂y(vN)− ZN.(3)
The model resolves the local rate of change in the density of tags into random (or diffusion,D), directed (or advective, u, v) and reaction (or mortality Z) components. Details of theboundary conditions and issues relating to the solution of the PDE are given in Bills andSibert (1997) and Sibert et al. (1999). In this exercise we only used reflective boundariesand a fully implicit upwind differencing method of solving equation (3), which guaranteesnumerical stability even with large rates of movement (see Press et al. (1993) for a discussionon implicit differencing). Wthout further constraints, movement parameters (u, v, D) willvary over time and space. The initial condition for N is
Nxyt0 ={
Nxcycc0t0 over release locations0 elsewhere.
(4)
The reaction term includes components of natural mortality, M , and fishing mortality, F .Using the convention
Zxyt = M +∑
f
Fxyft, where Fxyft = QfExyft.(5)
Fishing mortality of the fleet f is then assumed to be a constant proportion, Qf (thecatchability coefficient) of the fishing effort Exyft. The predicted number of recapturedtags, Cxyt, is given by
Cxyt = βfFxyft
Zxyt(1− e−Zxyt)Nxyt(6)
where βf is the fishery–specific tag reporting rate, independently estimated from tag-seedingexperiments (e.g., Hampton 1997).
3

3 Parameterizing movement fields
Without further information to parameterize movement behavior, the usual approach inthe past has been to constrain movement parameters to be constant in some ‘space–timeblocks’ of the model domain (Sibert et al. 1999; Adam and Sibert 2002). The idea hereis to make the assumption that movement behavior would be the same in regions andseasons so as to estimate the regional and seasonal movement parameters. Those analysessuggest that movement information in the tagging data were highly variable and might bebetter explained by continuously varying movement parameters. Also, the region–seasonparametrization often produces arbitrary discontinuities in population density that are notbiologically realistic. An alternative parameterization of the ADR model in time–spacediscretized form was used by Kleiber and Hampton (1994). Using skipjack tuna tagging datafrom the Solomon Islands, they modeled the movement (in this case transfer rate coefficientsfrom the grid boundaries) as functions of the number of FADs2 and the proportion of theisland mass that falls within the grid. While successful in detecting a FAD and an islandmass effect, these approaches would not be applicable for open ocean where such featureswould not be available. Lehodey et al. (1998, 2003) have shown, in a simulation model,that a proxy for tuna forage can be used to parameterize movement parameters in an ADRmodel that produces realistic distribution of skipjack tuna.
In principle, it would be possible to parameterize the movement fields using a mecha-nistic model based upon the scientific understanding about the relationship between themovement behaviour and the explanatory variables. However, these relationships are cur-rently unknown. It is generally accepted that the small–scale distribution and abundanceof skipjack tuna is affected by the the availability of forage (Lehodey et al. 1997). The for-age comprises epipelagic prey items ranging from large zooplankton, such as euphausiids,amphipods and other small crustaceans, to bait fish such as oceanic anchovy (Lehodey et al.1998). The distribution and abundance of the forage are essentially regulated by oceano-graphic processes, such as seasonal upwelling events driven by oceanic features that occurat scales of few kilometers and months. However, direct measurements of forage density atresolutions compatiable with spatio-temporal scales of the tagging data are currently arenot available. Similarly, indirect measurements of forage, such as ocean color, that are ob-tainable by means of remote sensing have not been satisfactory to complement the existingtagging data.
Earlier efforts at parametrizing the movement fields to a simple ‘habitat index’ based onsea-surface temperature and sea-surface current were not unsuccessful (Sibert and Bertignac,unpublished analysis). The problem appeared to be lack of detail in the data sets (inter-polated climatology data) available at the time. However, recent advances in computersimulations of skipjack populations from ADR models have been encouraging. For exam-ple, Lehodey et al. (2003) showed that skipjack tuna catch history is reproducible at oceanbasin level by constraining the movement fields to primary production, sea surface temper-ature, and oceanic currents that were simulated from a coupled physical–biogeochemicalmodel.
2Fish Aggregating Devices, floating objects specifically deployed to attract fish
4

3.1 Use of neural networks
Neural networks are proving to be attractive devices for modeling complex nonlinear pro-cesses without making an a priori relationship between the predictor and the explanatoryvariables (Lek and Guegan 2000). The December 2001 special issue of Ecological Modelling(Vol. 146, 1-3) contains several applications of artificial neural network modeling. Neuralnetworks have been used in many fishery applications; forecasting fish recruitment (Chenand Ware 1999), estimating fish density (Brosse and Lek 2002) and standardizing fishingeffort data (Maunder and Hinton submitted).
Our approach was to use neural networks to compute local movement parameters of anADR model using a series of habitat proxies as input data. The parameters of both neuralnet and ADR model are estimated simultaneously from a maximum likelihood algorithm.Before explaining how the neural network is integrated into the ADR model, we describebelow the type of the neural network used and various constraints we imposed on the neuralnet parameters.
We used simple multi–layer, feed–foward neural networks. A typical configuration ofneural network is shown in Figure 1. The processing elements, called nodes (or neuronsin the jargon of neural networks), are arranged in layers. The first layer, called the inputlayer, takes in the explanatory variables (input variables) and output comes off from the lastlayer, called the output layer. In between the input and ouput layers is the hidden layer(s).For any given number of input nodes, the model complexity may be increased by increasingthe hidden layers and/or increasing the number of nodes in the hidden layer(s). For thepurposes of this analysis we used three-layered networks only. Each node is connectedto all other nodes of adjacent layers and receives input and sends output through theseconnections. In the hidden layers the nodes simply sum the weighted values of the inputvariables, adds a bias term, and passes the value through a scaling function (or activationfunction in the neural net jargon). A three–layered neural network may mathematically berepresented by
hk = φk
n∑
j=1
(wjkxj + bk)
k = 1, .., k = m,
ot = θt
(m∑
k=1
(wkthk + bt)
)t = 1 or 2(7)
where hk is the hidden–layer output, which is scaled by the activation function φ(x) (seebelow). The first subscript in the weights, w, indexes the nodes in the preceding layer andthe second indexes the nodes in the current layer, xj , where j = 1, ..j = n are the inputvalues of the input layer, b is the bias term, and m and n are the number of the input–layernodes and hidden–layer nodes respectively. The hidden–layer output becomes the inputvalues for the output layer, ot, which uses the output scaling function θ(x) (see below) toscale the output values to appropriate range for use in the ADR model. The activationfunction, φ(x), can be sigmoid or linear. We chose a sigmoid function that scales the valuesbetween -1 and +1 as given by
5

Output
HiddenLayer
Bias (=1)
Bias(=1)
Figure 1: A feed–forward neural network with single hidden layer and with two outputnodes in the output layer.
6

φ(x) =2π
arctan(x).(8)
3.2 Scaling the output
To be able to use the neural network output as movement parameters of the ADR model,the output values have to be scaled to the appropriate range of the ADR models’ movementparameters. Previous analyses suggested that D would be in the range of 0–50,000 squarenautical miles per month and u and v around -30 to 30 nautical miles per month. To mapthe neural network output to these ranges of the movement parameters, we used a flexiblescaling function that takes in the desired range of the parameter along with a ‘slope’ andan ‘offset’ parameter. The scaling function is given by
θ(x) = min + (max−min)(
arctan(α ∗ [x− β])π + 0.5
)(9)
where α and β are slope and offset parameters respectively. Higher values of α increasethe ‘sigmoid nature’ of the function and very high values tend to make it a step function.Conversely, decreasing α makes the function more linear. The parameter β is simply theoffset of the input values relative to zero. An example of scaling functions with differentvalues of α and β is shown in Figure 2.
While it may be possible to estimate the values of α and β from the tagging data itself,we found that the parameters are confounded with the weights connecting from the hiddenlayer to the output layer. For example, the scaled output for a neural network with twonodes in the hidden layer, ignoring the constant terms, is given by α{arctan(w1h1 +w2h2 +b − β)}. Any given value of this expression may be obtained by dividing and multiplyingthe parameters with a constant, giving multiple solutions, for example α
2 {arctan([2w1h1] +[2w2h2] + [2b]− [2β])}. Similarly by adding and subtracting a constant to b and β wouldhave no effect on the value of the expression. We therefore made α and β constants in themodel fitting procedure. Alternatively, a linear scaling function may be used that wouldavoid the use of these parameters.
3.3 Constraining the parameters
In a highly generalized nonlinear model structure like the nueral network, the issues of localand multiple global minima are a pervasive problem (Sussmann 1992; Intrator and Intrator2001). In the conventional ‘training’ of the neural network (model fitting), a subset of thedata, called the validation set, is left aside for testing the performance of the model (methodof cross validation). During training, the error (the sum of the squared differences betweenthe observed and predicted) of the training and the validation set is compared after eachfunction evaluation over the entire training set (called an epoch in the neural net jargon).If the training and validation set were independent and representative of each other, thedecrease in error of the training and validation set as a function of increasing epochs shouldbe more or less similar (Lek and Guegan 2000). Optimum training for a given model is
7

−20 −10 0 10 20
010
000
2000
030
000
4000
050
000
slope=0.5, offset =0.0
NN Output
Diff
usio
n
−20 −10 0 10 20
−20
−10
010
20
slope=0.25, offset=−5.0
NN Ouput
Adv
ectio
n
Figure 2: Scaling function for diffusion and advection with offset (α) and slope (β) param-eters.
8

achieved when the error of the validation set starts to increase even if the error from thetraining set continues to decrease. This discrepancy is due to over-fitting (over-generalizing)of the model. The idea here is to train the neural net to a degree so that the general featureof the underlying nonlinear model of the data is captured in the parameters of the neuralnet. The fitting procedure does not guarantee that the network has found a minimum orindeed a unique solution in parameter space. Thus, the success of the training procedureand the resulting neural network’s ability to accurately predict future events depends uponinclusiveness of the observation data and the correct choice of neural network configuration,the latter found by trial and error.
For our purposes of estimating the maximum likelihood of the data given a particularmodel, the fitting procedure should find the global minimum of the error surface in parame-ter space, thus converging to a unique solution. In the neural net models, it has been shownthat non-uniqueness occurs with certain neural net configurations (Sussman 1992; Albertiniet al. 1993). To avoid such undesirable effects we constrained the weights connecting fromthe hidden layer to the output layer to be positive and be in ascending order. For example ifwij , i = 1, .., 4; k = 1, 2 represents the matrix of weights connecting from a neural networkwith four nodes in the hidden layer connecting to two output nodes in the output layer, weconstrained the weights to be the difference between the weights of the current node andthe previous node. For example,
w11 < w21 < w31 < w41, wi1 > 0
w12 < w22 < w32 < w42 wi2 > 0.
Non-decreasing weights were achieved by re–parameterizing the weights as
w′11 = w11; w′21 = w21 + w11; w′31 = w31 + w21 + w11; w′41 = w41 + w31 + w21 + w11
so that w31 = w′31 − w21 − w11 where w′31 is the actual neural network parameter to beestimated. Simple simulation experiments with the above constraints on the hidden–layerweights consistently gave unique solutions. In addition to the hidden–layer weight con-straints we also penalized the likelihood with a value dependent on the total magnitudeof the weights connecting from the input layer to the hidden layer (Hsieh 2004). If thelikelihood function is f(θ;X) this is achieved by
`(X|θ) = f(θ;X) + Pn∑
j=1
(wjk)2
where P is a weight magnitude penalty parameter. Larger values of P would tend to makethe weights smaller in magnitude, yielding a smoother and less nonlinear solution than whenP is small or zero.
At the start of the model–fitting procedure, the weights of the neural network wereinitialized with small random values and the bias terms initialized with zero. The attritionparameters were initialized with values close to the estimated values of the regional andseasonal movement model estimates.
9

Nxyt(uxyt, vxyt, Dxyt, Zxyt, |, W, B, M, q)
M + qExyt
Sum objective function
Lastmonth? YESNO
Compare observed andpredicted recoveries
Min. reached ongrad. vector?
Scaled input data Fishing effort data
YES
Write output
NOAutoDiff Quasi− New ton Func tion Mini miz erChange param eter values
W, b , M, & q
Use new values
Loop over(x,y) mon th
Figure 3: Schematic flowchart showing the main features in the integration of a neuralnetwork into the ADR model.
4 Integrating the neural networks and
estimation of the model parameters
We used two neural networks: one that calculates two output values corresponding to theu and v, the other calculating a single output value corresponding to the D. At eachtime step and at each computational element in the model, the neural networks calculatethree output values corresponding to the three movement parameters of the ADR modelfrom a series of grid–specific input data (see below). These values are then scaled usingthe appropriate scaling functions of the movement parameters and passed to the ADRmodel. The movement parameters along with the attrition parameters (q and M) are usedto calculate local density of the tags. A flow chart representing the integration of neuralnetworks to the ADR model and the parameter estimation procedure is given in Figure 3.
In order to estimate the parameters of the model, we assumed that recaptures occur ineach grid cell, and in each time step follow a Poisson probability distribution. The likelihoodof the data given the model is (Sibert et al. 1999)
`(X|θ) =∏
xyft
e−Ct
xyf Ctxyf
Ctxyf
Ctxyf !
.(10)
The estimates of the parameters were found by minimizing the negative log of the likelihoodfunction across all observations. We used the Autodiff Library’s quasi–Newton function
10
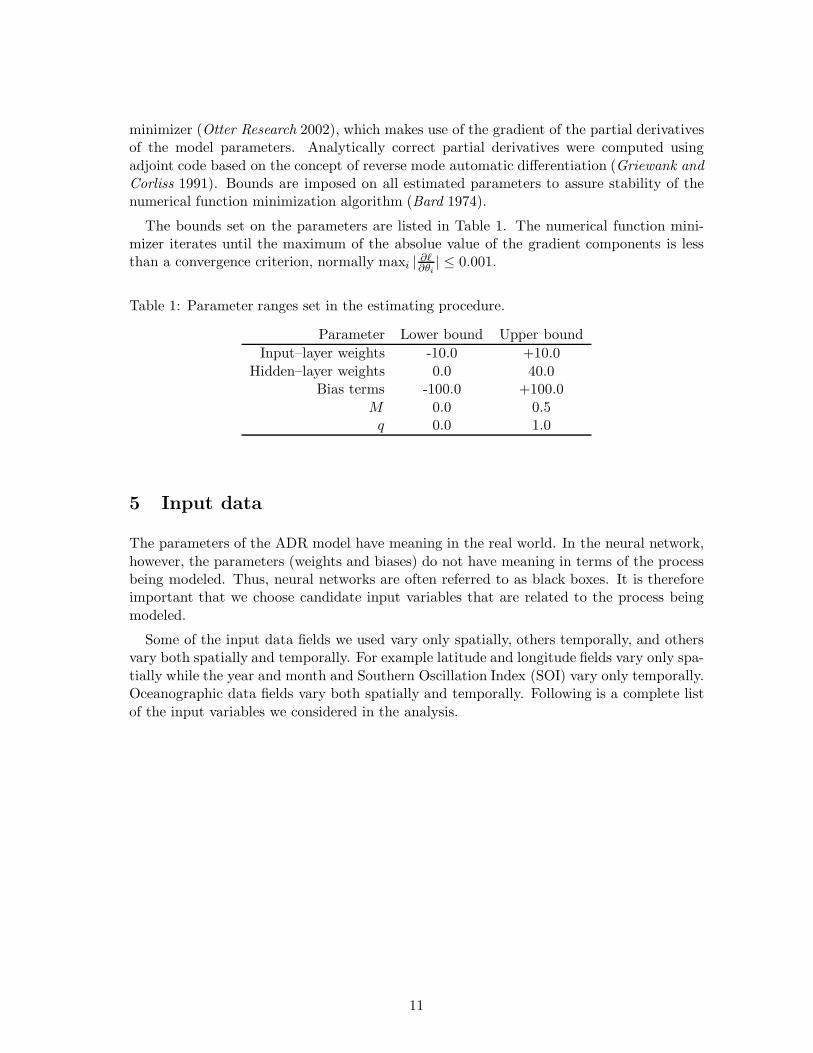
minimizer (Otter Research 2002), which makes use of the gradient of the partial derivativesof the model parameters. Analytically correct partial derivatives were computed usingadjoint code based on the concept of reverse mode automatic differentiation (Griewank andCorliss 1991). Bounds are imposed on all estimated parameters to assure stability of thenumerical function minimization algorithm (Bard 1974).
The bounds set on the parameters are listed in Table 1. The numerical function mini-mizer iterates until the maximum of the absolue value of the gradient components is lessthan a convergence criterion, normally maxi | ∂`
∂θi| ≤ 0.001.
Table 1: Parameter ranges set in the estimating procedure.
Parameter Lower bound Upper boundInput–layer weights -10.0 +10.0
Hidden–layer weights 0.0 40.0Bias terms -100.0 +100.0
M 0.0 0.5q 0.0 1.0
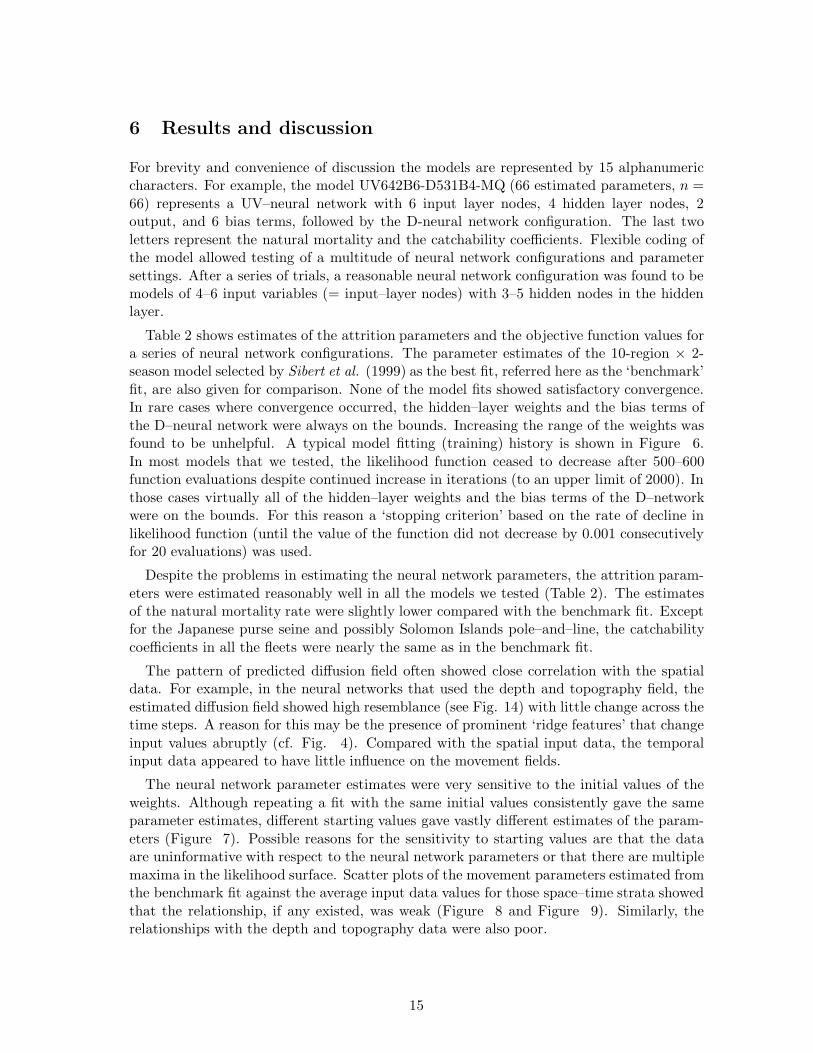
5 Input data
The parameters of the ADR model have meaning in the real world. In the neural network,however, the parameters (weights and biases) do not have meaning in terms of the processbeing modeled. Thus, neural networks are often referred to as black boxes. It is thereforeimportant that we choose candidate input variables that are related to the process beingmodeled.
Some of the input data fields we used vary only spatially, others temporally, and othersvary both spatially and temporally. For example latitude and longitude fields vary only spa-tially while the year and month and Southern Oscillation Index (SOI) vary only temporally.Oceanographic data fields vary both spatially and temporally. Following is a complete listof the input variables we considered in the analysis.
11

• Temporal fields
– Calendar year and month: We used the year and month of the models’ timehorizon to provide time information. A smooth sigmoid transformation for themonth signal was used to avoid discontinuity when month change occurs at theend of each year.
– Southern Oscillation Index: Standard SOI3 index. This field gives a timesignal since the SOI was the monthly average across the Pacific Ocean. In thecentral and western Pacific Ocean the SOI has a profound influence on the east–west distribution of the skipjack abundance (Lehodey et al. 1997).
• Spatial fields
– Geographic location: We used the latitude and longitude positions of the gridelement to provide the spatial information to the model. Both would give asmooth signal in the x and y dimensions of the model.
– Water depth: We used average water depth at computational grid, calculatedusing the ETOPO54 to give spatial heterogeneity to the model.
– Topography:4 This field was taken to be the difference between the maximum(at sea level) and minimum elevation at the computational element and providespatial heterogeneity.
– Distance from land: Calculated as the nearest distance from the computa-tional element to the land, visible in the model resolution. This information maybe useful as a proxy to the so called ‘island mass effect’ (Kleiber and Hampton1994).
• Combined Temporal and Spatial fields5
– Zonal and meridional surface current: Meridional and zonal sea surfacecurrent in the computational element.
– Sea surface temperature: Meridional and zonal sea–surface temperatures inthe computational element.
– Simulated ‘tuna forage’: Simulated forage field from a biogeochemical model.
– Simulated habitat index: ‘Habitat’ field predicted by parameterizing the for-age field.
All input data fields were scaled between -1 and +1. Figure 4 shows water depth andtopography fields. Histograms of the SST, and the zonal and meridional currents for theSSAP region are shown in Figure 5.
3http://tao.atmos.washington.edu/data sets/globalsstenso/, accessed December 20014ETOPO5 (Earth Topography - 5 Minute), National Geophysical Data Center (NGDC), Boulder, CO.5Provided by Dr. Patrick Lehodey, Secretariat of the Pacific Community, Noumea, New Caledonia. The
data are the same as those used in Lehodey (2001).
12

Depth
Seabed topography
−1.0 −0.5 0.0 0.5 1.0
Figure 4: Scaled spatial fields of the water depth and the topography
13

Sea−surface temperature
Fre
quen
cy
−1.0 −0.5 0.0 0.5 1.0
010
0030
0050
00
Zonal surface current
Fre
quen
cy
−1.0 −0.5 0.0 0.5 1.0
050
0015
000
2500
0
Meridional surface current
Fre
quen
cy
−1.0 −0.5 0.0 0.5 1.0
050
0010
000
2000
0
Figure 5: Frequency distributions of the sea surface temperature (SST), zonal surface cur-rent (USC) and meridional surface current (VSC).
14
6 Results and discussion
For brevity and convenience of discussion the models are represented by 15 alphanumericcharacters. For example, the model UV642B6-D531B4-MQ (66 estimated parameters, n =66) represents a UV–neural network with 6 input layer nodes, 4 hidden layer nodes, 2output, and 6 bias terms, followed by the D-neural network configuration. The last twoletters represent the natural mortality and the catchability coefficients. Flexible coding ofthe model allowed testing of a multitude of neural network configurations and parametersettings. After a series of trials, a reasonable neural network configuration was found to bemodels of 4–6 input variables (= input–layer nodes) with 3–5 hidden nodes in the hiddenlayer.
Table 2 shows estimates of the attrition parameters and the objective function values fora series of neural network configurations. The parameter estimates of the 10-region × 2-season model selected by Sibert et al. (1999) as the best fit, referred here as the ‘benchmark’fit, are also given for comparison. None of the model fits showed satisfactory convergence.In rare cases where convergence occurred, the hidden–layer weights and the bias terms ofthe D–neural network were always on the bounds. Increasing the range of the weights wasfound to be unhelpful. A typical model fitting (training) history is shown in Figure 6.In most models that we tested, the likelihood function ceased to decrease after 500–600function evaluations despite continued increase in iterations (to an upper limit of 2000). Inthose cases virtually all of the hidden–layer weights and the bias terms of the D–networkwere on the bounds. For this reason a ‘stopping criterion’ based on the rate of decline inlikelihood function (until the value of the function did not decrease by 0.001 consecutivelyfor 20 evaluations) was used.
Despite the problems in estimating the neural network parameters, the attrition param-eters were estimated reasonably well in all the models we tested (Table 2). The estimatesof the natural mortality rate were slightly lower compared with the benchmark fit. Exceptfor the Japanese purse seine and possibly Solomon Islands pole–and–line, the catchabilitycoefficients in all the fleets were nearly the same as in the benchmark fit.
The pattern of predicted diffusion field often showed close correlation with the spatialdata. For example, in the neural networks that used the depth and topography field, theestimated diffusion field showed high resemblance (see Fig. 14) with little change across thetime steps. A reason for this may be the presence of prominent ‘ridge features’ that changeinput values abruptly (cf. Fig. 4). Compared with the spatial input data, the temporalinput data appeared to have little influence on the movement fields.
The neural network parameter estimates were very sensitive to the initial values of theweights. Although repeating a fit with the same initial values consistently gave the sameparameter estimates, different starting values gave vastly different estimates of the param-eters (Figure 7). Possible reasons for the sensitivity to starting values are that the dataare uninformative with respect to the neural network parameters or that there are multiplemaxima in the likelihood surface. Scatter plots of the movement parameters estimated fromthe benchmark fit against the average input data values for those space–time strata showedthat the relationship, if any existed, was weak (Figure 8 and Figure 9). Similarly, therelationships with the depth and topography data were also poor.
15

0 200 400 600 800 1000
4000
4500
5000
5500
6000
6500
7000
#Function evaluations
− L
oglik
elih
ood
valu
e
Figure 6: A typical training history of the model. In most cases the function values cease todecline after about 500–600 iterations despite increase in the number of function evaluations.
16
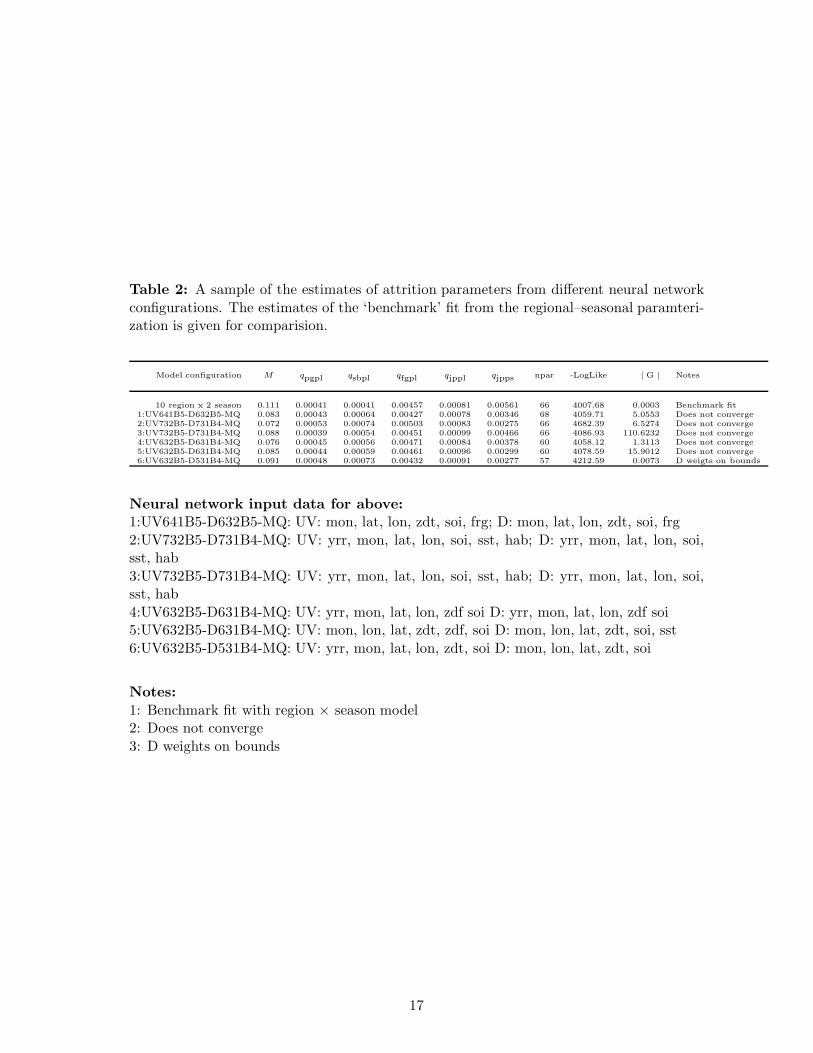
Table 2: A sample of the estimates of attrition parameters from different neural networkconfigurations. The estimates of the ‘benchmark’ fit from the regional–seasonal paramteri-zation is given for comparision.
Model configuration M qpgpl qsbpl qfgpl qjppl qjpps npar -LogLike | G | Notes
10 region x 2 season 0.111 0.00041 0.00041 0.00457 0.00081 0.00561 66 4007.68 0.0003 Benchmark fit1:UV641B5-D632B5-MQ 0.083 0.00043 0.00064 0.00427 0.00078 0.00346 68 4059.71 5.0553 Does not converge2:UV732B5-D731B4-MQ 0.072 0.00053 0.00074 0.00503 0.00083 0.00275 66 4682.39 6.5274 Does not converge3:UV732B5-D731B4-MQ 0.088 0.00039 0.00054 0.00451 0.00099 0.00466 66 4086.93 110.6232 Does not converge4:UV632B5-D631B4-MQ 0.076 0.00045 0.00056 0.00471 0.00084 0.00378 60 4058.12 1.3113 Does not converge5:UV632B5-D631B4-MQ 0.085 0.00044 0.00059 0.00461 0.00096 0.00299 60 4078.59 15.9012 Does not converge6:UV632B5-D531B4-MQ 0.091 0.00048 0.00073 0.00432 0.00091 0.00277 57 4212.59 0.0073 D weigts on bounds
Neural network input data for above:1:UV641B5-D632B5-MQ: UV: mon, lat, lon, zdt, soi, frg; D: mon, lat, lon, zdt, soi, frg2:UV732B5-D731B4-MQ: UV: yrr, mon, lat, lon, soi, sst, hab; D: yrr, mon, lat, lon, soi,sst, hab3:UV732B5-D731B4-MQ: UV: yrr, mon, lat, lon, soi, sst, hab; D: yrr, mon, lat, lon, soi,sst, hab4:UV632B5-D631B4-MQ: UV: yrr, mon, lat, lon, zdf soi D: yrr, mon, lat, lon, zdf soi5:UV632B5-D631B4-MQ: UV: mon, lon, lat, zdt, zdf, soi D: mon, lon, lat, zdt, soi, sst6:UV632B5-D531B4-MQ: UV: yrr, mon, lat, lon, zdt, soi D: mon, lon, lat, zdt, soi
Notes:1: Benchmark fit with region × season model2: Does not converge3: D weights on bounds
17

uvw111 uvw123 uvw142 uvw161 uvw173 Dw121 Dw132 Dw143 Dw154
−10
−5
05
10
Input layer weights
uvw211 uvw212 uvw213 uvw221 uvw222 uvw223 Dw211 Dw212 Dw213 Dw214
010
2030
40
Hidden layer weights
uvbias1 uvbias2 uvbias3 uvbias4 uvbias5 Dbias1 Dbias2 Dbias3 Dbias4 Dbias5
−10
0−
500
5010
0
Bias terms
Figure 7: Distributions of estimates of the neural network parameters for a UV732B5-D731B5-MQ (n = 66) model using 20 different sets of initial values of weights and biasterms.
18

−0.96 −0.92 −0.88 −0.84
020
000
6000
010
0000
hab, seas. 1
−0.96 −0.92 −0.88 −0.84
020
000
6000
010
0000
hab, seas. 2
−0.94 −0.90 −0.86 −0.82
020
000
6000
010
0000
frg, seas. 1
−0.96 −0.92 −0.88 −0.84
020
000
6000
010
0000
frg, seas. 2
0.1 0.2 0.3 0.4 0.5 0.6 0.7
020
000
6000
010
0000
sst, seas. 1
0.3 0.4 0.5 0.6 0.7
020
000
6000
010
0000
sst, seas. 2
Figure 8: Relationship between the benchmark fit estimated values of D against the averagevalues of spatio–temporally varying neural network input data (habitat (hab), forage (frg),and sea surface temperature (sst)). Left panels are for season 1 and right panels are forseason 2.
19

−0.20 −0.15 −0.10 −0.05
020
000
6000
010
0000
usc, seas. 1
−0.20 −0.15 −0.10 −0.05 0.00
020
000
6000
010
0000
usc, seas. 2
0.00 0.05 0.10 0.15 0.20
020
000
6000
010
0000
vsc, seas. 1
0.05 0.10 0.15 0.20
020
000
6000
010
0000
vsc, seas. 2
Figure 9: Relationship between the benchmark fit estimated values of D against the averagevalues of spatio–temporally varying neural network input data (zonal (usc) and meridional(vsc) surface current). Left panels are for season 1 and right panels for season 2.
20

In all the cases, the advection field was strongly oriented to a northwesterly direction atthe eastern boundary of Australia. Incidently there was no release and hardly any recapturein this area of the model (see Fig. 12). The spare and sporadic nature of the recapture datamay also explain the multimodal distribution of the estimates of diffusion (see Fig. 13).
6.1 Simulation
In order to investigate the reliability of the estimating procedure, we simulated a series ofrecapture data sets from the model (UV732B5-D731B4-MQ, n = 66) using an estimatedset of parameter values. In the simulation, movements were deterministic but recaptureswere sampled from a probability distribution where the predicted tag density from theADR model was considered to be the expected value of a Poisson random variable. Usingdifferent starting values for the weights and bias terms at each time, the parameters wereestimated for 50 realizations of tag–recapture data. The bias in the estimates, calculated asthe difference between the true and the estimated value divided by the standard deviationof the estimates, is shown in Figure 10. The estimates of the weights show large bias, someeven larger than two standard deviations indicated by the horizontal lines in the figures.The attrition parameters, however, were estimated with reasonable accuracy similar to theaverage estimates (cf. Table 2).
A plausible reason for this behavior of the neural network model could be related tothe nature of the recapture observations in the data, but perhaps more importantly it isdue to the paucity of the recapture data in the model. In the conventional tagging datathe movement path of the fish is not known; only the release and recapture locations areknown. For a given time–at–liberty, the fish could have moved in a multitude of paths to berecaptured at the observed time–grid strata. The implicit assumption in the ADR modelis that large numbers of releases and recaptures should, at the population level, reveal thepopulation movement that would be statistically estimable from the ADR model. It isthus conceivable to imagine that multiple maxima in the likelihood surface for a set of tagrecaptures to have originated from more than one possible movement path between pointsof release and recapture.
In reality, the recaptures in any grid–time strata are very few. In fact, of the 99,180 (58months × 1710 non-land grids) computational grids specified in the model domain, only952 (<1%) grids had observed recaptures; 99% of the model domain was void of recapturedata for which the parameters of the model would have to explain the movement (or moreprecisely the continuously changing gradient field) of the density of the tags. In the regional× seasonal parameterization of the ADR model, the accuracy of parameter estimates ishigher when there are larger numbers of recaptures in a region × season stratum (Billsand Sibert 1997). In practice, regions are adjusted so that each region × season stratumcontained at least one tag recapture. In the regional × seasonal parameterization, themovement field was effectively constrained to be uniform in each region × season strata,whereas in the neural network model, the movement field may vary continuously across theentire model domain at 1◦ × 1◦ resolution. Given the paucity of recaptures relative to theregion × season parameterization, it is therefore not surprising that we were not able toaccurately estimate the movement parameters.
21

uvw111 uvw123 uvw142 uvw161 uvw173 Dw121 Dw132 Dw143 Dw161 Dw172
−3
−2
−1
01
23
Input layer weightsS
tand
ardi
zed
bias
uvw211 uvw213 uvw222 Dw211 Dw213 uvbias2 uvbias4 Dbias1 Dbias3
−3
−2
−1
01
23
Hidden layer weights and bias terms
Sta
ndar
dize
d bi
as
M q1 q2 q3 q4 q5
−3
−2
−1
01
23
Attrition parameters
Sta
ndar
dize
d bi
as
Figure 10: Bias in the estimates of the neural networks parameers from simulated data(UV732B5-D731B4-MQ, n = 66). The bias is calculated as the difference between the‘true’ value and the estimated value divided by the standard deviations of the estimates.
22
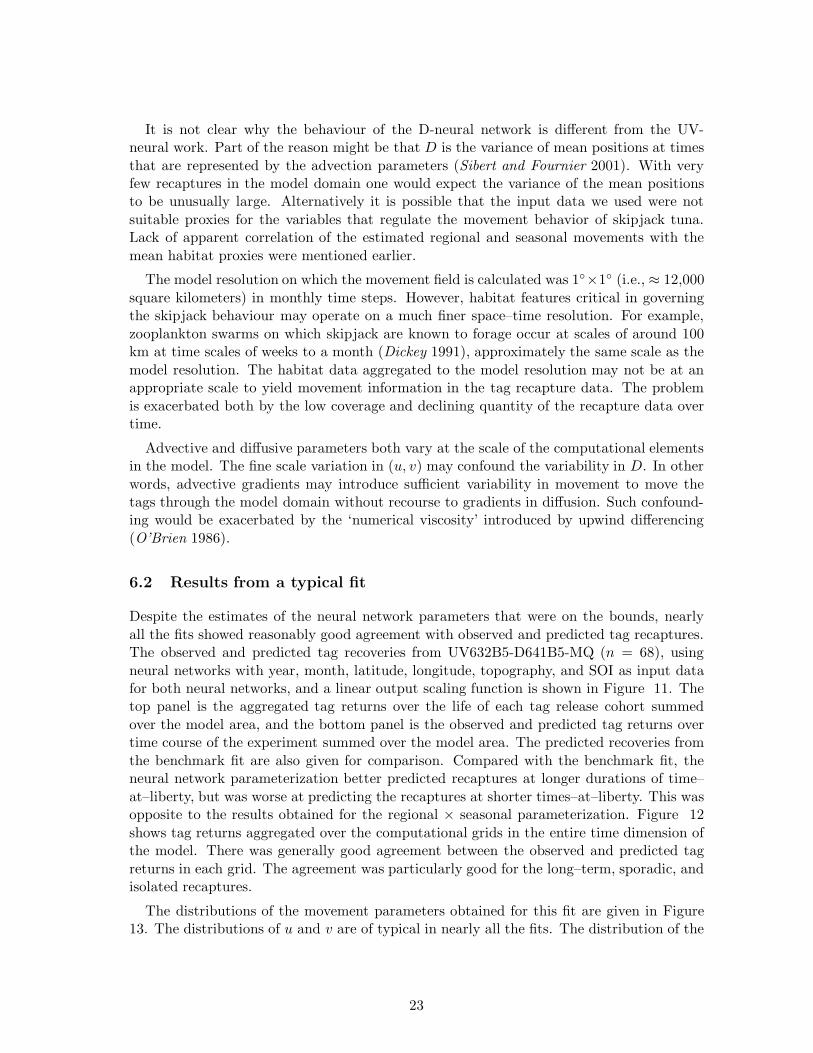
It is not clear why the behaviour of the D-neural network is different from the UV-neural work. Part of the reason might be that D is the variance of mean positions at timesthat are represented by the advection parameters (Sibert and Fournier 2001). With veryfew recaptures in the model domain one would expect the variance of the mean positionsto be unusually large. Alternatively it is possible that the input data we used were notsuitable proxies for the variables that regulate the movement behavior of skipjack tuna.Lack of apparent correlation of the estimated regional and seasonal movements with themean habitat proxies were mentioned earlier.
The model resolution on which the movement field is calculated was 1◦×1◦ (i.e., ≈ 12,000square kilometers) in monthly time steps. However, habitat features critical in governingthe skipjack behaviour may operate on a much finer space–time resolution. For example,zooplankton swarms on which skipjack are known to forage occur at scales of around 100km at time scales of weeks to a month (Dickey 1991), approximately the same scale as themodel resolution. The habitat data aggregated to the model resolution may not be at anappropriate scale to yield movement information in the tag recapture data. The problemis exacerbated both by the low coverage and declining quantity of the recapture data overtime.
Advective and diffusive parameters both vary at the scale of the computational elementsin the model. The fine scale variation in (u, v) may confound the variability in D. In otherwords, advective gradients may introduce sufficient variability in movement to move thetags through the model domain without recourse to gradients in diffusion. Such confound-ing would be exacerbated by the ‘numerical viscosity’ introduced by upwind differencing(O’Brien 1986).
6.2 Results from a typical fit
Despite the estimates of the neural network parameters that were on the bounds, nearlyall the fits showed reasonably good agreement with observed and predicted tag recaptures.The observed and predicted tag recoveries from UV632B5-D641B5-MQ (n = 68), usingneural networks with year, month, latitude, longitude, topography, and SOI as input datafor both neural networks, and a linear output scaling function is shown in Figure 11. Thetop panel is the aggregated tag returns over the life of each tag release cohort summedover the model area, and the bottom panel is the observed and predicted tag returns overtime course of the experiment summed over the model area. The predicted recoveries fromthe benchmark fit are also given for comparison. Compared with the benchmark fit, theneural network parameterization better predicted recaptures at longer durations of time–at–liberty, but was worse at predicting the recaptures at shorter times–at–liberty. This wasopposite to the results obtained for the regional × seasonal parameterization. Figure 12shows tag returns aggregated over the computational grids in the entire time dimension ofthe model. There was generally good agreement between the observed and predicted tagreturns in each grid. The agreement was particularly good for the long–term, sporadic, andisolated recaptures.
The distributions of the movement parameters obtained for this fit are given in Figure13. The distributions of u and v are of typical in nearly all the fits. The distribution of the
23

0 5 10 15 20 25 30 35
15
5050
050
00
fit43
Months at liberty
Tag
Ret
urns
per
mon
th
Regional & SeasonalNeural Network
0 10 20 30 40 50 60
010
030
050
0
Months from first release
Tag
Ret
urns
per
mon
th Regional & SeasonalNeural Network
Figure 11: A typical fit of the neural network model (UV632B5-D641B5-MQ, n = 68) Thebenchmark fit, n = 66, is overlaid for comparison.
24

130E 140E 150E 160E 170E 180 170W
25S
18S
11S
4S3N
10N
1 2 7 20 54 148 403
Figure 12: Spatial distribution of observed and predicted tag returns over time for model(UV632B5-D641B5-MQ, n = 68). Each one-degree square of the model region is dividedinto two triangles, the upper left triangle representing the observed tag recaptures and thelower right representing the predicted tag recaptures. The color of the triangle representsthe number of returns on the logarithmic scale. Two triangles forming a square of uniformcolor indicate close agreement between the observed and the predicted recaptures in one–degree geographic areas.
25

Unscaled uF
requ
ency
−5 0 5 10
020
0050
00Scaled u
Fre
quen
cy
−4 −2 0 2 4 6
020
0040
00
Unscaled v
Fre
quen
cy
−2 −1 0 1 2 3
020
0060
00
Scaled v
Fre
quen
cy
−1 0 1 2
040
0080
00
Unscaled D
Fre
quen
cy
−60 −40 −20 0 20 40
040
0080
00
Scaled D
Fre
quen
cy
0 10000 20000 30000 40000
040
0080
00
Figure 13: Distributions of the u, v, and D (fit43; UV632B5-D641B5-MQ). The figures onthe left panels are unscaled values, i.e, the neural network output, and the panels on theright are scaled values, using a linear scaling function.
26

D, however, was highly variable between the fits. Most of them tended to show multi–modaldistributions as were estimated in this fit. Given that the model fit did not converge, it willbe difficult to provide meaningful interpretations of these distributions. A sample of themovement fields showing the density of the tags and the advection and diffusion parametersis given in Figure 14.
27

0.0 0.2 0.4 0.6 0.8 1.0
0.0
0.2
0.4
0.6
0.8
1.0
Tag Density (log−scale)
02
46
0.0 0.2 0.4 0.6 0.8 1.0
0.0
0.2
0.4
0.6
0.8
1.0
Diffusion and Advection Fields
010
000
3000
050
000
Figure 14: Sample tag density and movement fields from UV632B5-D641B5-MQ.
28

7 Recommendations for further research
• Change the parameterization to eliminate the gradients in D. Either esimate a singleuniform value of D or set its value at an arbitrary constant.
• The recapture data were too few in quantity to estimate the continuously varyingmovement parameters. To compensate for this lack of recapture data, the approachfollowed in the regional × seasonal movement parameterization may be used. Move-ment parameters, for example, may be computed over 5-degree × 2 month time stepsinstead of the 1-degree × 1-month resolution that was used for this analysis. Thiswould allow for more effective use of the sparse movement information in the recap-ture data. Implementing this scheme would require only minor modification of theexisting model code.
• Future attempts should also explore use of Generalized Additive Models (GAMs) inplace of the neural networks for computing local movement parameters. Somewhatsimilar to the neural networks, GAMs are highly flexible statistical models that areoften used to identify and characterize nonlinear regression effects.
• Alternative parameterization of movement patterns: The time-space discretized ap-proach of ADR model implemented by Kleiber and Hampton (1994) considers move-ments as fluxes, or transfer coefficients, across the cell boundaries. In their approachthe flux rates are modified by the presence of FADs and island masses, where FADeffect is computed from a model.
Using a similar approach, the computed value of the neural network may be used tomodify the transfer coefficients as follows:
m↑ = D.NN(X; θ)m↓ = D.NN(X; θ)
m→ = D.NN(X; θ)m← = D.NN(X; θ)
Here NN(X; θ) is the neural network model, where X are the input data and θ themodel parameters. The output of the neural network may be directly used to avoidthe output scaling functions. Lower values of the neural network output indicate lackof local features that affect movement behavior, while higher values affect the behaviormore strongly. Note that in this parameterization D is referred to as diffusivity and isdifferent from diffusion, D, of the continuous form of the ADR model (see Appendix Aof Kleiber and Hampton (1994) for a numerical treatment of the difference in the twoapproaches). Also there is no explicit advection term. Lack of habitat features (i.e.,lower neural network output) indicates diffusivity is uniform. But uniform dispersionwould be the exception rather than the norm for tunas.
29

8 Acknowledgments
The study was funded by the cooperative agreement NA67RJ0154 from the National Oceanicand Atmospheric Administration. The views expressed are those of the authors and do notrepresent views of the NOAA or its affiliated agencies or institutions. Suggestions madeby Anders Nielsen on neural network parameter constraints and help with R scripts aregreatly appreciated. Johnoel Ancheta’s advice on C++ programming and development andmaintenance of the inhouse graphics display package, ‘Akira’, is also appreciated.
9 References
Adam, M. S., and J. R. Sibert. 2002. Population dynamics and movements of skipjacktuna (Katsuwonus pelamis) in the Maldivian fishery: analysis of tagging data from anadvection-diffusion-reaction model. Aquat. Living Res. 15: 13-23.
Albertini, F., E. D. Sontag, and V. Malliot 1993. Uniqueness of weights for neuralnetworks, In pages 115–125, R. Mammone (ed.) Artificial Neural Networks for Speechand Vision. Chapman and Hall, London.
Bard, Y. 1974. Nonlinear Parameter Estimation. Academic Press. San Diego, CA. 341pp.
Bills, P. J., and J. R. Sibert. 1997. Design of tag-recapture experiments for estimatingyellowfin tuna stock dynamics, mortality and fishery interactions. Pelagic FisheriesResearch Program, Honolulu, Hawaii.
Brosse, S., and S. Lek. 2002. Relationships between environmental characteristics andthe density of age-0 Eurasian perch Perca fluvatilis in the littoral zone of a lake: anonlinear approach. Trans. Amer. Fish. Soc. 131: 1033-1043.
Chen, D. G. and D. M. Ware. 1999. A neural network model for forecasting fish stockrecruitment. Can. J. Fish. Aquat. Sci. 56: 2385-2396.
Dickey, T. P. 1991. The emergence of concurrent high resolution physical and bio–opticalmeasurements in the upper ocean and their applications. Rev. Geophys. 29(3): 383-413.
Fournier, D. A., J. Hampton, and J. Sibert. 1998. MULTIFAN–CL: a length based,age–structured model for fisheries stock assessment, with application to South Pacificalbacore, Thunnus alalunga. Can. J. Fish. Aquat. Sci. 55: 2105–2116.
Griewank, A., and G. F. Corliss. 1991. Automatic differentiation of algorithms: theory,practice and application. SIAM, Philadelphia, PA.
Hampton, J. 1997. Estimation of tag reporting and tag-shedding rates in a large–scaletuna tagging experiment in the western tropical Pacific Ocean. Fish. Bull. 95: 68-79.
Hampton, J. and D. Fournier, 2001. A spatially disaggregated, length–based, age–structured population model yellowfin tun Thunnus albacares in the western and centralPacific Ocean. Mar. Freshwater Res., 52:937–963.
30

Hsieh, W. 2004. Nonlinear multivariate and time series analysis by neural networkmethod. Rev. Geophys. 10.1029/2002RG000112 42(1) RG1003.
Intrator, O, and N. Intrator. 2001. Interpreting neural–network results: a simulationstudy. Comput. Stat. Data Anal. 27(3): 373–393.
Kleiber, P., and J. Hampton. 1994. Modeling effects of FADs and islands on movement ofskipjack tuna (Katsuwonus pelamis): Estimating parameters from tagging data. Can.J. Fish. Aquat. Sci. 51:2642–2653.
Lehodey, P., M. Bertignac, J. Hampton, and A. Lewis. 1997. El Nino Southern Oscilla-tion and tuna in the western Pacific. Nature 389: 715-718.
Lehodey, P., J. M. Andre, M. Bertignac, J. Hampton, A. Stoens, C. Menkes, L. Memery,and N. Grima. 1998. Predicting the tuna forage in the equatorial Pacific using acoupled dynamical bio-geochemical model. Fish. Oceanogr. 7(3/4):317–325.
Lehodey, P. 2001. The pelagic ecosystem of the tropical Pacific Ocean: dynamic spatialmodeling and biological consequences of ENSO. Progr. Oceanogr. 49: 439-468.
Lehodey, P., F. Chai, and J. Hampton. 2003. Modeling climate–related variability oftuna populations from a coupled ocean–biogeochemical–populations dynamics model.Fish. Oceanogr. 12(4/5):483–494.
Lek. S. and J.F. Guegan, 2000. Artificial Neuronal Networks. Application to Ecologyand Evolution. Springer–Verlag, Berlin. 262 p.
Maunder, M. and M. Hinton. Estimating relative abundance from catch and effort datausing neural networks. Submitted to Can. J. Fish. Aquat. Sci.
O’Brien, J. J. 1986. The hyperbolic problem, In O’Brien, J. J. (ed.), Advanced PhysicalOceanographic Numerical Modeling, D. Reidel, Dordrecht.
Otter Research Limited, 2002. http://otter-rsch.com/, accessed December 2002.
Press, W. H., B. P. Flannery, S. A. Teukolsky, and W. T. Vetterling. 1993. NumericalRecipes in C: The Art of Scientific Computing. 2nd ed., Cambridge University Press,Cambridge. 1020 p.
Sibert, J., and D. Fournier. 2001. Possible models for combining tracking data withconventional tagging data. In pages 443–456, Sibert, J. and J. Nielsen (eds.) ElectronicTagging and Tracking in Marine Fisheries Review: Methods and Technology in FishBiology and Fisheries. Dordrecht: Kluwer Academic Press.
Sibert, J., J. Hampton, D. A. Fournier, and P. J. Bills. 1999. An advection-diffusion-reaction model for the estimation of fish movement parameters from tagging data, withapplication to skipjack tuna (Katsuwonus pelamis). Can. J. Fish. Aquat. Sci. 56:925-938.
Sibert, J., and J. Hampton, 2003. Mobility of tropical tunas and the implications forfisheries management. Marine Policy. 27:87–95.
Sussmann, H. 1992. Uniqueness of the weights for minimal feed forward nets with giveninput–output map. Neural Network 5:589-8-593.
31