Embed Size (px)
Citation preview

U.S. SOLAR MARKET INSIGHTExecutive Summary
Q2 2016
June 2016

Contents
U.S. Solar Market Insight June 2016 │ 2
CONTENTS1. Introduction ..............................................................................................................................5
2. Photovoltaics.............................................................................................................................9
2.1. Market Segment Trends 102.1.1. Residential PV 10
2.1.2. Non-Residential PV 10
2.1.3. Utility PV 11
2.2. National Solar PV System Pricing 13
2.3. Component Pricing 15
2.4. Market Outlook 16

IntroductionError*
U.S. Solar Market Insight June 2016 │ 3
ABOUT THE REPORTU.S. Solar Market Insight® is a quarterly publication of GTM Research and the Solar EnergyIndustries Association (SEIA)®. Each quarter, we collect granular data on the U.S. solar market fromnearly 200 utilities, state agencies, installers and manufacturers. This data provides the backboneof this U.S. Solar Market Insight® report, in which we identify and analyze trends in U.S. solardemand, manufacturing and pricing by state and market segment. We also use this analysis to lookforward and forecast demand over the next five years. All forecasts are from GTM Research; SEIAdoes not predict future pricing, bid terms, costs, deployment or supply.
References, data, charts and analysis from this executive summary should be attributed to“GTM Research/SEIA U.S. Solar Market Insight®.”
Media inquiries should be directed to Mike Munsell ([email protected]) at GTMResearch and Alexandra Hobson ([email protected]) at SEIA.
All figures are sourced from GTM Research. For more detail on methodology and sources,visit www.gtmresearch.com/solarinsight.
Our coverage in the U.S. Solar Market Insight reports includes 34 individual states and Washington,D.C. However, the national totals reported include all 50 states, Washington, D.C., and Puerto Rico.
Detailed data and forecasts for 34 states and Washington, D.C. are contained within the full versionof this report, available at www.greentechmedia.com/research/ussmi.
AUTHORS
GTM Research | U.S. Research TeamShayle Kann, Senior Vice PresidentMJ Shiao, Director of Solar ResearchCory Honeyman, Associate Director of U.S. Solar (lead co-author)Austin Perea, Solar Analyst (lead co-author)Jade Jones, Senior Solar AnalystColin Smith, Solar AnalystBenjamin Gallagher, Solar AnalystScott Moskowitz, Solar Analyst
Solar Energy Industries Association | SEIAJustin Baca, Vice President of Markets & ResearchShawn Rumery, Director of ResearchAaron Holm, Data EngineerKatie O’Brien, Research Associate

IntroductionError*
U.S. Solar Market Insight June 2016 │ 4
Author’s Note: Revision to U.S. Solar Market Insight report title
GTM Research and SEIA have changed the naming convention for the U.S. Solar Market Insightreport series. From this publication onward, the report title will reference the quarter in which thereport is released, as opposed to the most recent quarter in which installation figures are tracked.
Key Figures
The U.S. installed 1,665 MWdc of solar PV in Q1 2016, increasing 24% over Q1 2015. This quarter is thelargest non-Q4 in U.S. the history of the U.S. solar industry.
In Q1 2016, the cumulative number of U.S. solar installations brought on-line eclipsed 1million, representing 27.5 GWdc in operating capacity.
In Q1 2016, solar accounted for 64% of all new electric generating capacity brought on-line in the U.S.
Residential PV remained relatively flat compared to Q4 2015 due to seasonal effects, but stilladded well over half a GWdc for the fourth consecutive quarter.
For the first time ever, non-residential PV installed more than 300 MWdc in back-to-back quarters.
GTM Research forecasts that 14.5 GWdc of new PV installations will come on-line in 2016, up94% over 2015. Utility PV is expected to drive the majority of demand, accounting for nearlythree-fourths of new capacity.
IntroductionError*
U.S. Solar Market Insight June 2016 │ 5
1. INTRODUCTIONIn Q1 2016, the U.S. solar market installed 1,665 megawatts direct current (MWdc), up 24%over Q1 2015. For the tenth consecutive quarter, quarterly installations exceeded 1 GWdc, andthis continued gigawatt-level growth enabled the U.S. solar market to achieve an importantmilestone in Q1 2016:
There are now more than 1 million operating solar PV installations, representing 27.5 GWdc ofoperating solar PV capacity in the U.S.
Putting this figure in historical context, 1 million installations is that much more of an impressivefeat, given that more than 90% of these projects came on-line during this decade alone.
Figure 1.1 Annual U.S. Solar PV Installations, Q1 2010-Q1 2016
Source: GTM Research
When accounting for all projects (both distributed and centralized), solar continues to drive agrowing portion of new electric generating capacity additions. Last year, solar exceeded natural-gas capacity additions for the first time on an annual basis. Building off that momentum, solaraccounted for 64% of all new electric generating capacity installed in the U.S. in Q1 2016, rankingas the largest driver of capacity additions across all fuel types.
0
500
1,000
1,500
2,000
2,500
3,000
3,500
Inst
alla
tions
(MW
dc)
Residential Non-Residential Utility

IntroductionError*
U.S. Solar Market Insight June 2016 │ 6
Figure 1.2 Share of New U.S. Electric Generating Capacity Additions, 2010-Q1 2016
Source: GTM Research (solar), FERC (all other technologies)
Looking ahead, the extension of the federal Investment Tax Credit will enable the U.S. solar PVmarket to become a double-digit-gigawatt annual market not only in 2016, but also through theend of this decade. However, in 2016, the rate at which the U.S. solar PV market grows in eachmarket segment will be impacted by the timing of the recent federal ITC extension, along withthe timing of several state-level policy developments that happened in late 2015 and early 2016.
Utility PV: Given that the federal ITC extension was ultimately passed by Congress inDecember 2015, more than 10 GWdc of utility PV has been rushed through the developmentcycle and is still slated to come on-line this year. At least another 4.5 GWdc of utility PVinstallations are expected to be nearly or fully finished with construction in Q4 2016, withofficial commercial operation expected in 2017. The drivers behind where, how and whythis spillover happens are explored further in the full version of this report.
Non-residential PV: For the non-residential PV market, which has remained flat over the pastthree years, a rebound in 2016 should stem from new state-level policies established duringlegislative or regulatory proceedings in early 2016. These include extensions to NEM programcapacity limits and the rollout of new non-residential PV incentive programs, particularly forcommunity solar.
4% 8% 9%
27% 27% 30%
64%
36%
51%
31%
47% 43%29%
1%
32%
10%
16%
10%
1%
24% 29%
41%
7%25%
39%33%
4% 3% 4% 9% 5% 3% 3%
0%
10%
20%
30%
40%
50%
60%
70%
80%
90%
100%
2010 2011 2012 2013 2014 2015 Q1 2016
Shar
e of
New
Cap
acity
Add
ition
s (%
)
Solar Natural Gas Coal Wind Other

IntroductionError*
U.S. Solar Market Insight June 2016 │ 7
Residential PV: The timing of net metering reforms in a handful of major state markets willplay a role in inflating 2016 growth. Most notably, Nevada’s market has seen a freeze in newrooftop solar sales in response to stark NEM reforms in NV Energy territory. However, morethan 20 MWdc still came on-line in Q1 2016 from projects that rushed through the installationprocess in Q4 2015, with hopes of being grandfathered in under old NEM rules.
2016 finds the U.S. solar market in a period of transition, characterized by shifts in both the driversand geographic distribution of market demand. A wave of geographic demand diffusion isexpected, primarily in the utility PV market. Most notably in the southeast, states where operatingsolar capacity stands at or below 10 MWdc will increase their capacity by more than tenfold due toinexpensive utility PV power-purchase agreements (PPAs) that reflect the ability of utility-scalesolar to both compete with and complement new natural gas plants.
Meanwhile, commercial customers’ solar procurement strategies are expanding, with well over1 GWdc of offsite solar projects in development, from both community solar and offsite utility-scale solar. And finally, the policy landscape for rooftop solar is becoming increasinglyfragmented and complicated, with debates over net metering and rate design evolving beyondfixed-charge proposals to multifaceted ones that encompass demand charges, time-of-use rates,and/or value-of-solar tariffs.
Amidst these near-term state-level drivers and risks, the extension of the federal Investment TaxCredit will serve as a long-term policy bridge to help transform solar PV into an increasinglymainstream source of power generation in the U.S. electricity market. With the federal ITCextended through 2021, and a “commence-construction” rule added, market participants benefitfrom federal-level policy visibility through 2023. Building off that policy certainty, as the followingfigure reveals, U.S. solar is expected to account for more than 6% of operating electric generatingcapacity by 2021, compared to just 0.3% at the beginning of this decade.

IntroductionError*
U.S. Solar Market Insight June 2016 │ 8
Figure 1.3 Solar’s Share of Annual Operating Electric Generating Capacity, 2010-2021
Source: GTM Research (solar); FERC (historical non-solar figures); EIA (projected non-solar figures)
0.3% 0.4%0.7%
1.0%1.4%
2.0%
2.8%
3.5%
4.0%
4.6%
5.3%
6.1%
0%
1%
2%
3%
4%
5%
6%
7%
0
20
40
60
80
100
120
2010 2011 2012 2013 2014 2015 2016E 2017E 2018E 2019E 2020E 2021E
Share of U.S. O
perating Electric Generating Capacity (%
)Cu
mul
ativ
e U
.S. O
pera
ting
Sola
r Cap
acity
(GW
AC)
Solar's Share of Operational Electric Generating Capacity (%)Cumulative Solar Installed Capacity (GW AC)

PhotovoltaicsError*
U.S. Solar Market Insight June 2016 │ 9
2. PHOTOVOLTAICSFigure 2.1 Annual State Solar PV Installation Rankings
Rank Installations (MWdc)State 2014 2015 Q1 2016 2014 2015 Q1 2016California 1 1 1 3549 3266 700
North Carolina 2 2 2 397 1140 201
Massachusetts 4 3 3 308 340 107
Nevada 3 4 4
Underlying Data Available inthe Full Report
New York 7 7 5
Maryland 11 11 6
New Jersey 6 10 7
Arizona 5 5 8
Georgia 16 6 9
Colorado 13 12 10
Hawaii 9 13 11
Texas 8 9 12
Connecticut 15 14 13
New Mexico 10 15 14
Oregon 26 19 15
Indiana 14 21 16
Utah 23 8 17
Florida 20 17 18
Pennsylvania 25 25 19
Vermont 18 16 20
Delaware 27 23 21
Washington 24 20 22
New Hampshire 31 24 23
South Carolina 35 35 24
Ohio 22 29 25
Missouri 12 22 26
Tennessee 17 28 27
Louisiana 19 18 28
Iowa 21 32 29
Virginia 30 30 30
Michigan 32 33 31
Wisconsin 34 34 32
Washington, D.C. 33 31 33
Minnesota 29 26 34
Illinois 28 27 35

PhotovoltaicsError*
U.S. Solar Market Insight June 2016 │ 10
2.1. Market Segment Trends
2.1.1. Residential PV
Key Figures
Up 1% over Q4 2015
Up 34% over Q1 2015
With an average growth rate of 11% over the preceding four quarters, the residential PV slowdownin Q1 2016 was a function of both seasonal factors and the inevitable leveling-off of demand afteryears of persistently robust growth. Though California still accounts for nearly 50% of residentialPV this quarter, installations did not grow in Q1 for the first time in a year, with many major statemarkets experiencing similar trends.
Likely attributable to seasonal factors, California’s flat growth in Q1 is unlikely to continue into therest of the year, as the state will retain its position as the top state market and a significant driverof PV demand. However, volumes in other major state markets that have experienced NEM reform,such as Nevada and Hawaii, will taper throughout the year as non-energized projects make theirway through the interconnection queue. Despite declining or flat growth in select major states,growth in some major and emerging state markets helped buoy rooftop PV in Q1. New York’s andMaryland’s rooftop PV markets both experienced over 25% growth this quarter, while Texas andUtah both saw impressive growth in their own right. Going forward, we expect a number of smallerstate markets to pick up steam and balance out the demand slowdown seen in major states.
2.1.2. Non-Residential PV Down 6% over Q4 2015
Up 36% over Q1 2015
Continuing the trend of 2015, growth in the non-residential PV segment remains constrained.California’s share of the market continues to hover near one-third of the market total, though thestate saw its first decline in installations since Q1 2015. Persistent stagnation within the non-residential space stems from development issues specific to particular sub-segments, such assmall-scale, unrated commercial and industrial, in addition to a deteriorating incentiveenvironment in many major state markets.
On an individual state level, both Massachusetts and Maryland saw notable growth, as recentregulatory developments have provided some short- to medium-term policy stability forcommercial development. In total, 20 states experienced growth on a year-over-year basis.

PhotovoltaicsError*
U.S. Solar Market Insight June 2016 │ 11
2.1.3. Utility PV 12th consecutive quarter in which utility PV added at least 500 MWdc
Contracted utility PV pipeline currently totals 21.4 GWdc
The utility PV market continues to serve as the bedrock driver of installation growth in the U.S.solar market, accounting for 43% of capacity installed in Q1 2016. The market is on the verge of anunprecedented rate of project completion, with 8.4 GWdc already announced as underconstruction. Altogether, the utility PV market remains on track to install more than 10 GWdc in2016 from late-stage projects that are coming on-line despite the extension of the federal ITC.While 10 GWdc is an impressive figure, the 2016 outlook has substantially changed over the pastfew months, during which time developers are pushing project completion dates from this yearinto 2017. The ability to push these projects out to 2017 is due to three major reasons:
Manageable financial penalties: Financial penalties incurred due to interconnection delaysare sufficiently low for a developer to spill over a project while maintaining required returns.
Voluntary vs. required commercial operation dates: Many projects’ PPAs had voluntary2016 commercial operation dates that were proposed by the developer, but mandatory 2017commercial operation dates set forth by the utility.
Utility-led spillover: Some utilities have expressed willingness to push a project’s commercialoperation date from Q4 2016 to 1H 2017 as long as the developer demonstrates substantialprogress toward completion, such as finishing construction before the end of this year.Alternatively, certain procurement programs, such as the California investor-owned utilities’Renewable Auction Mechanism, have clauses in PPAs that would allow for spillover due to autility-led interconnection delay.
Looking ahead, a couple of key trends that will shape the near-term utility PV market outlookinclude continued growth of utility PV outside of renewable portfolio standard (RPS)obligations and increased procurement by municipal and cooperative utilities. While only 9states have 200 MWdc or more operating, 17 states now have 200 MWdc or more indevelopment. This is in part driven by utilities in both major and emerging markets procuringsolar as a hedge against natural-gas price volatility. Underlying these geographic demand andprocurement trends is the low price environment for utility PV, with recent PPAs being signedat prices between $35/MWh and $50/MWh.

PhotovoltaicsError*
U.S. Solar Market Insight June 2016 │ 12
Figure 2.2 U.S. Utility PV Pipeline
Source: GTM Research, U.S. Utility PV Market Tracker
13,882 13,228
30,7008,414
0
5,000
10,000
15,000
20,000
25,000
30,000
35,000
Operating Contracted (PPA Signed) Announced (Pre-Contract)
U.S
Util
ity C
apac
ity (M
Wdc
)
In Construction

PhotovoltaicsError*
U.S. Solar Market Insight June 2016 │ 13
2.2. National Solar PV System PricingWe utilize a bottom-up modeling methodology to track and report national average PV systempricing for the major market segments. Though we continue to solicit weighted-average systempricing directly from utility and state incentive programs, we believe this data less accuratelyreflects the current state of system pricing. Systems utilizing local incentive programs constitute aminority share of the market, and data from these sources often represents pricing quoted wellprior to the installation and connection date.
Our bottom-up methodology is based on tracked wholesale pricing of major solar componentsand data collected from interviews with major installers, supplemented by data collected fromutility and state programs.
Figure 2.3 Modeled U.S. National Average System Costs by Market Segment, Q1 2015-Q1 2016
Note: Detailed information about national system prices by market segment and component is available in the full report.
In Q1 2016, overall system pricing fell by up to 8.8%, depending on the market segment, with thelargest declines in the utility tracking sector. On a quarterly basis, pricing continues to trenddownward across all market segments. After a relatively stagnant 2015, residential system pricesfell 8.3% in Q1 2016. This decrease is due to continued hardware cost reductions and an increasedfocus on tackling soft costs. Price declines of 8.3% and 6.9% also occurred in the non-residentialand fixed-tilt utility sectors, respectively. Moreover, as installers and EPCs expand to states with
$0.00
$0.50
$1.00
$1.50
$2.00
$2.50
$3.00
$3.50
$4.00
Residential Non-Residential Utility Fixed Tilt Utility Tracking
Turn
key
Inst
alle
d Co
sts
($/W
dc)
Q1 2015 Q2 2015 Q3 2015 Q4 2015 Q1 2016

PhotovoltaicsError*
U.S. Solar Market Insight June 2016 │ 14
lower labor and regulatory compliance costs (e.g., South Carolina and Indiana), these geographieswill have a larger impact on aggregate pricing.
In Q1 2016, average pricing for residential rooftop systems landed at $3.21/Wdc, with nearly 63%of costs coming from on-site labor, engineering, permitting and other soft costs. While residentialhardware costs fell by over 4% in the past quarter, soft costs have decreased on an industry-average basis of almost 12%. In fact, this quarter has seen the first decrease in residential soft costssince Q4 2014. This was driven by concerted efforts by national and regional installers to loweroperational costs and to optimize on-site installation labor.
In Q1 2016, the non-residential sector also saw a significant 7% fall in pricing. Within non-residential,hardware costs fell 6% quarter-over-quarter, while soft costs saw a decrease of 9%. Despite thisdecrease, in Q1 2016 soft costs still accounted for approximately 50% of total system pricing. Thisreflects many of the challenges of selling and executing projects with multiple stakeholders andproject parameters that may vary from sale to sale. Moreover, soft costs can be even higher forprojects in regions with strict labor requirements, and particularly in jurisdictions with more stringentpermitting and interconnection requirements. Despite the variety of challenges in the non-residentialmarket, engineering, procurement and construction (EPC) providers are successfully reducing theirdesign costs and minimizing overhead.
Utility fixed-tilt and tracking projects in Q1 2016 saw an average pricing of $1.24/Wdc and $1.41/Wdc,respectively. Among both fixed-tilt and tracker ground-mount systems, both hardware and soft-costreductions contributed to lower overall system pricing. While utility system pricing is more tightlyclustered than are residential and non-residential systems pricing, state-by-state variation isprevalent. In particular, Texas sees some of the most competitive ground-mount systems pricing.Moreover, the cost premium of tracking systems over fixed-tilt is beginning to shrink. In Q1 2015,tracker systems carried a $0.21/Wdc premium over fixed-tilt systems. However, in Q1 2016, thatpremium shrunk to $0.17/Wdc. Continued reduction of upfront costs for trackers will spur theincreasing share of tracking projects in the utility ground-mount market.

PhotovoltaicsError*
U.S. Solar Market Insight June 2016 │ 15
2.3. Component PricingPrices in Q1 2016 were driven by seasonally weak downstream demand and component-levelinventory and supply availability.
For polysilicon, prices fell 2% to $14.17/kg in Q1 2016. While down during the quarter, thelevel of sequential decline decreased as channel inventory declined.
Wafer and cell prices were effectively flat, reaching $0.21/W and $0.33/W, respectively, in Q1 2016.Prices for these components were driven by stable demand and price expectations from buyers.
U.S. module prices are largely driven by antidumping and countervailing duties on Chinesesuppliers. In July 2015, the U.S. Department of Commerce filed its final review of the import tariffson Chinese cells into the U.S. market. The final ruling set the cumulative duty at 30.61% for mostmajor suppliers (21.70% for Yingli). During the first quarter, the average delivered price for Chinesemodules ranged from $0.61/W on the low side (corresponding to order volumes greater than 10MW for less established firms) to $0.63/W on the high side (established, bankable firms; ordervolumes of less than 1 MW). It should be noted that there is some price risk for producers thatcontinue to ship all-Chinese products to the U.S. in 2016 as the tariff on Chinese cells may changeagain. Further, there is no assurance that the final results will resemble preliminary results(antidumping duties: 4.53% to 11.47%; countervailing duties: 19.62%).
2.4 U.S. Polysilicon, Wafer, Cell, and Module Prices, Q1 2015-Q1 2016
Q1 2015 Q2 2015 Q3 2015 Q4 2015 Q1 2016Polysilicon ($/kg) $18.94 $15.53 $15.06 $14.46 $14.17
Wafer ($/W) $0.21 $0.20 $0.20 $0.21 $0.21
Cell ($/W) $0.31 $0.29 $0.30 $0.33 $0.33
Module ($/W) $0.72 $0.68 $0.67 $0.65 $0.63

PhotovoltaicsError*
U.S. Solar Market Insight June 2016 │ 16
2.4. Market OutlookIn December 2015, Congress passed an omnibus spending bill that included a multiyear extensionof the federal Investment Tax Credit. Without question, the extension of the federal ITC ranks asthe most important policy development for U.S. solar in almost a decade. Between this year andthe end of the decade, the ITC extension will spur more than 20 GWdc of additional PV capacity,positioning U.S. solar to become a 20 GWdc annual market by 2021.
Looking ahead, the federal ITC will remain at 30% through 2019, and then step down to 26% in2020 and 22% in 2021. In 2022, it will step down to 10% for third-party-owned residential, non-residential, and utility PV projects, while expiring entirely for direct-owned residential PV. Equallyimportant, projects that commence construction but do not interconnect in the years 2019, 2020and 2021 can qualify for correspondingly larger tax credits if they come on-line by the end of 2023.
Given the timing of the federal ITC extension, however, the wheels are already in motion for U.S. solarto benefit in 2016 from a double-digit-gigawatt pipeline of late-stage utility PV projects that rushedthrough development last year. In turn, we expect another record year for the U.S. PV market in 2016,with installations reaching 14.5 GWdc, a 94% increase over 2015. In 2017, while the residential andnon-residential PV markets are both expected to grow year-over-year, the U.S. solar market is stillexpected to drop on an annual basis due to the aforementioned pull-in of utility PV demand in 2016.However, the year-over-year downturn for utility PV has softened due to a growing number ofprojects that have pushed out completion dates from this year to 2017.
By 2019, U.S. solar is expected to resume year-over-year growth across all market segments. Andby 2021, more than half of all states in the U.S. will be 100+ MWdc annual solar markets, bringingcumulative U.S. solar installations above the 100 GWdc mark.
Forecast details by state (34 states plus Washington, D.C.) and market segment through 2021 areavailable in the full report.
PhotovoltaicsError*
U.S. Solar Market Insight June 2016 │ 17
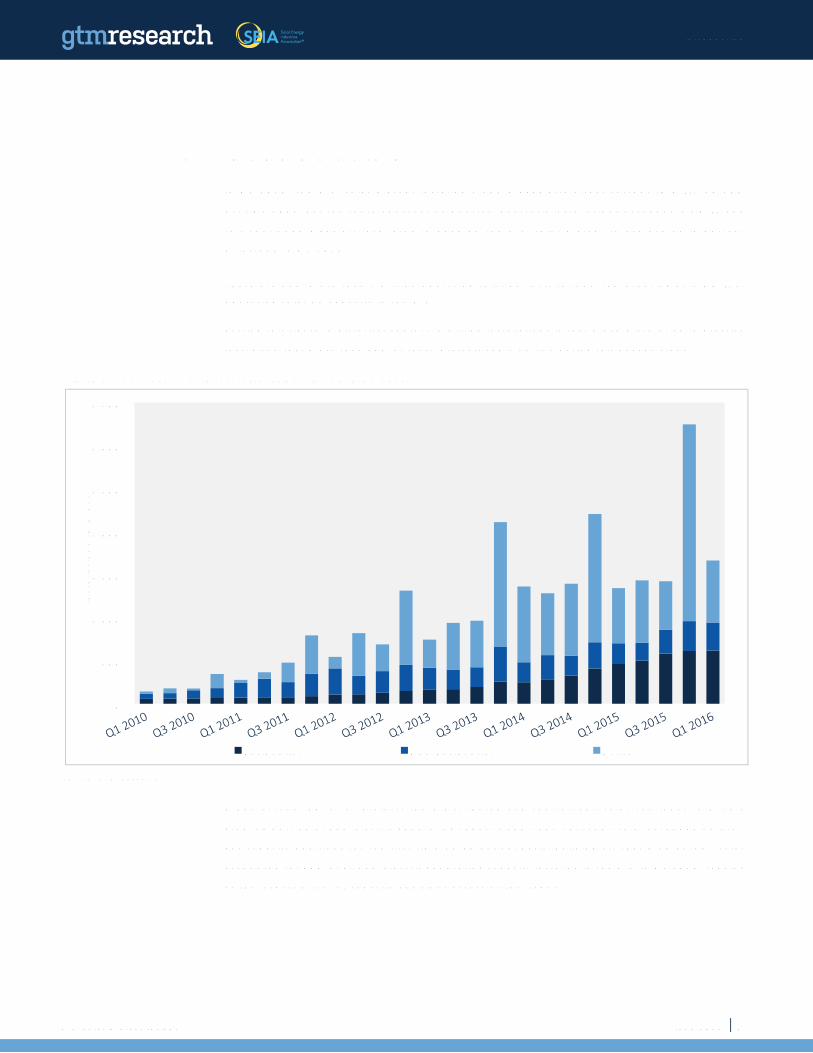
Figure 2.5 U.S. PV Installation Forecast, 2010-2021E Figure 2.6 U.S. PV Installation Forecast by Segment, 2010-2021E
Source: GTM Research
0
5,000
10,000
15,000
20,000
25,000
2010 2011 2012 2013 2014 2015 2016E 2017E 2018E 2019E 2020E 2021E
Inst
alle
d Ca
paci
ty (M
Wdc
)
Residential PV Non-Residential PV Utility PV
0%
10%
20%
30%
40%
50%
60%
70%
80%
90%
100%
2010 2011 2012 2013 2014 2015 2016E 2017E 2018E 2019E 2020E 2021EIn
stal
led
Capa
city
(MW
dc)
Residential PV Non-Residential PV Utility PV

› Installations by market segment for
the top 34 states and Washington DC
› Installed cost by market segment
for each state
› State-by-state market analysis
› Component pricing across the
value chain
› Manufacturing capacity & production
by component
› Demand projections out to 2020 by
technology, market segment & state
› National aggregate capacity additions
› National aggregate number of
installations
› National weighted average
installed price
› National aggregate manufacturing
production
U.S. Solar Market Insight™
U.S. Solar Market Insight™ brings high-quality, solar-specific analysis
and forecasts to industry professionals in the form of quarterly and annual reports.
These reports present market conditions, opportunities and outlooks for the photovoltaics (PV) and concentrating solar power (CSP) markets in the U.S. Primary data for the reports is collected directly from installers, manufacturers, state agencies and utilities. That data is analyzed to provide comprehensive upstream and downstream analysis on installations, costs, manufacturing, and market projections.
U.S. Solar Market Insight™ is offered quarterly in two versions– Executive Summary and Full Report. The Executive Summary is free, and the Full Report is available individually each quarter or as part of an annual subscription.
SEIA® and GTM Research Deliver the Most Comprehensive
U.S. Solar Market Analysis and Industry Data Available Today.
*Please find a more detailed content and pricing matrix on the reverse side of this page.
For more information on U.S. Solar Market InsightTM and to download this quarter’s free Executive Summary, visit www.gtmresearch.com/solarinsight or www.seia.org/cs/research/solarinsight
Solar Research Subscription Service
FULL REPORT
EXECUTIVE SUMMARY - FREE
Justin Freedman
Director, Research [email protected] + 1 617 500 6243

Installations + Market Analysis
› Shipments vs. Installations
› By Market Segment
› By State
› Number of Installations
Installed Price Manufacturing
› Polysilicon
› Wafers
› Cells
› Modules
› Active U.S. Manufacturing Plants
› Inverters
Component Pricing
› Polysilicon, Wafers, Cells and Modules
› Inverters
› PV Mounting Structures
Demand Projections
› By Market Segment
› By State
Subscribers to U.S. Solar Market Insight include:Photovoltaics (PV)
Concentrating Solar Power (CSP)
TABLE OF CONTENTS
Technology Firms
Component Manufacturers
BOS Providers
System Integrators
Residential Third-Party Financiers
Project Developers
Utilities & IPPs
Investors
WHO BUYS US SOLAR MARKET INSIGHT?
› Installations + Market Analysis
› Installed Price
› Manufacturing Production
› Demand Projections
Executive SummaryFull Report (Pdf Enterprise License)
Individual Quarterly Report Annual Subscription - 4 Reports
SEIA® Members Free $1,995 $5,995
Non-SEIA® Members Free $3,995 $9,995
Justin Freedman
Director, Research [email protected] + 1 617 500 6243
For more information on U.S. Solar Market InsightTM and to download this quarter’s free Executive Summary, visit www.gtmresearch.com/solarinsight or www.seia.org/cs/research/solarinsight
Solar Research Subscription Service