Embed Size (px)
Citation preview
Trade Flows and Domestic Content for Solar Energy-Related Goods and Services in the United States
A GTM Research StudyPrepared for Solar Energy Industries Association® August 2011
U.S. Solar Energy Trade Assessment 2011:
2 Copyright © 2011 Greentech Media
U.S. SOLAR ENERGY TRADE ASSESSMENT 2011 Photovoltaics Concentrating Solar Power Solar Heating & Cooling
TABLE OF CONTENTS
1 EXECUTIVE SUMMARY 51.1 Key Findings: Solar Energy 61.2 Photovoltaics (PV) 91.3 Concentrating Solar Power (CSP) 121.4 Solar Heating and Cooling (SHC) 131.5 U.S.-China Trade Flows 16
2 PHOTOVOLTAICS (PV) 172.1 Domestic Value Created 172.2 Crystalline Silicon PV Modules 18
2.2.1 Polysilicon Production 182.2.2 Ingot and Wafer Production 202.2.3 Cell Production 222.2.4 Module Assembly 232.2.5 Crystalline Silicon Module 25
2.3 Thin Film PV Modules 272.4 Blended PV Module 312.5 Year-Over-Year Comparison 322.6 Inverter 332.7 Mounting Structure 362.8 Combiner Box and Miscellaneous Electrical Equipment 372.9 Site Preparation, Labor, Soft Costs and Value Chain Markup 392.10 Domestic Value Creation of PV System by Module Technology 39
2.10.1 Crystalline Silicon System 392.10.2 Thin Film System 40
2.11 Total Blended PV System 422.12 Year-Over-Year Analysis 442.13 Trade Flow Analysis 46
2.13.1 Capital Equipment 472.13.2 Polysilicon 492.13.3 Thin Film Feedstock 512.13.4 Wafer 522.13.5 Cell 54
2.13.6 Module 552.13.7 Inverter 562.13.8 Total PV Trade Flows 57
3 CONCENTRATING SOLAR POWER (CSP) 603.1 Domestic Value Created 60
3.1.1 Mirrors 643.1.2 Receivers 643.1.3 Turbine 643.1.4 Molten Salt 653.1.5 Storage Tanks 653.1.6 Frames and Balance of Plant 653.1.7 Labor 653.1.8 Other Costs and Value Chain Markup 65
3.2 Concentrating Solar Trade Flow Analysis 66
4 SOLAR HEATING & COOLING 684.1 Solar Water Heating (SWH) 68
4.1.1 Domestic Value Created 684.1.1.1 SWH Collectors 714.1.1.2 Storage Tank 714.1.1.3 All Other Equipment 714.1.1.4 Site Design and Installation Labor 714.1.1.5 Total Domestic Value Creation Year-Over-Year 72
4.2 Solar Pool Heating (SPH) 734.2.1 Domestic Value Created 734.2.1.1 SPH Collectors 754.2.1.2 Other Equipment 754.2.1.3 Site Design and Installation Labor 76
4.3 SWH and SPH Trade Flow Analysis 76
5 AGGREGATE FINDINGS 78
3 Copyright © 2011 Greentech Media
U.S. SOLAR ENERGY TRADE ASSESSMENT 2011 Photovoltaics Concentrating Solar Power Solar Heating & Cooling
LIST OF FIGURES
Figure 1-1: Solar Industry Trade Flows, 2010 7Figure 1-2: U.S. Solar Installations Domestic Value Creation, 2010 8Figure 1-3: Solar Industry Domestic Value Creation by Technology, 2010 9Figure 1-4: PV System Domestic Value Creation, 2010 10Figure 1-5: PV Imports and Exports by Source/Destination, 2010 11Figure 1-6: CSP Project Domestic Value Creation, 2010 12Figure 1-7: SWH System Domestic Value Creation, 2010 13Figure 1-8: SPH System Domestic Value Creation, 2010 14Figure 1-9: SWH and SPH Collectors: Imports and Exports by Source/Destination, 2010 15Figure 1-10: U.S.-China Solar Energy - Related Trade Flows, 2010 16Figure 2-1: Solar Polysilicon Production by Country, 2010 19Figure 2-2: Global PV Wafer Market Share, 2010 20Figure 2-3: Estimation of Domestic Content of U.S.-installed PV Wafers, 2010 21Figure 2-4: Crystalline Silicon Cell Production by Country, 2010 22Figure 2-5: Estimation of Domestic Content of U.S.-installed c-Si Cells, 2010 23Figure 2-6: U.S.-Installed Crystalline Silicon Modules by Geographic Origin of Production (Module Assembly Only), 2010 24Figure 2-7: Percentage of Value Created Domestically, U.S.-installed Crystalline Silicon Module, 2010 25Figure 2-8: Percentage of Value Created Domestically, U.S.-installed Crystalline Silicon Module, 2010 26Figure 2-9: Crystalline Silicon Module Cost Structure, Wafer-to-Module Integrated Facility, China, 2010 27Figure 2-10: Percentage of Value Created Domestically, U.S.-installed Thin Film Module, 2010 29Figure 2-11: Percentage of Value Created Domestically, U.S.-installed Thin Film Module, 2010 30Figure 2-12: 2010 U.S. PV Installations by Module Technology 31Figure 2-13: Percentage of Value Created Domestically, PV Module, 2010 32Figure 2-14: PV Module Domestic Value Creation Year-over-Year Comparison 33Figure 2-15: U.S. Market Share of Global Inverter Production, 2010 34Figure 2-16: Domestic Market Share of U.S. and Foreign Manufacturers by Installation Market Segment, 2010 35Figure 2-17: Domestic Content Creation in U.S. PV Mounting Structures, 2010 36Figure 2-18: Domestic Content Creation of Balance of PV Electrical Equipment, 2010 38Figure 2-19: Cost Breakdown for Crystalline Silicon PV Systems in 2010 40Figure 2-20: Cost Breakdown for Thin Film Systems in 2010 41Figure 2-21: Breakdown of Typical U.S. PV Installation and Resulting Value Created for the U.S., 2010 42Figure 2-22: PV System Domestic Value Creation, 2010 43Figure 2-23: Breakdown of PV Hardware Components and Resulting Value Created for the U.S., 2010 44Figure 2-24: Year-over-Year Comparison of PV Domestic Value Creation, 2009 v. 2010 45
4 Copyright © 2011 Greentech Media
U.S. SOLAR ENERGY TRADE ASSESSMENT 2011 Photovoltaics Concentrating Solar Power Solar Heating & Cooling
Figure 2-25: PV Capital Equipment Imports and Exports by Source/Destination, 2010 48Figure 2-26: PV Polysilicon Imports and Exports by Source/Destination, 2010 50Figure 2-27: PV Thin Film Feedstock Imports and Exports by Source/Destination, 2010 51Figure 2-28: PV Wafer Imports and Exports by Source/Destination, 2010 53Figure 2-29: PV Cell Imports and Exports by Source/Destination, 2010 54Figure 2-30: PV Module Imports and Exports by Source/Destination, 2010 55Figure 2-31: PV Inverter Imports and Exports by Source/Destination, 2010 56Figure 2-32: U.S. PV Trade Flows by Value Chain Segment, 2010 57Figure 2-33: U.S. PV Net Exports by Value Chain Segment, 2010 58Figure 2-34: U.S. PV Trade Flows by Country, 2010 59Figure 3-1: Concentrating Solar includes both Concentrating PV (CPV) and Concentrating Solar Power (CSP) technologies 60Figure 3-2: U.S. CSP Project Map for U.S. Southwest 61Figure 3-3: CSP Percent of Value Created in the U.S. 63Figure 3-4: CSP Project Domestic Value Creation, 2010 63Figure 3-5: CSP Imports and Exports by Source/Destination, 2010 67Figure 4-1: Diagram of the Primary Components of a SWH System 68Figure 4-2: SWH Percent of Value Created in the U.S. 69Figure 4-3: SWH Domestic Value Creation, 2010 70Figure 4-4: Total Value Creation 2009 - 2010 72Figure 4-5: SPH Percent of Value Created in the U.S., 2010 74Figure 4-6: SPH Domestic Value Creation, 2010 75Figure 4-7: SWH and SPH Imports/Exports by Source/Destination, 2010 77Figure 4-8: SWH and SPH Imports and Exports by Source/Destination, 2010 78Figure 5-1: Solar Industry Domestic Value Creation, 2010 79Figure 5-2: Solar Industry Trade Flows, 2010 80Figure 5-3: Year-over-Year Solar Industry Trade Flows Comparison, 2009 vs. 2010 81
Solar Energy Industries Association:
Tom Kimbis, Vice President, Strategy & External Affairs
Justin Baca, Senior Research Manager
John Smirnow, Vice President, Trade & Competitiveness
Will Lent, Research & Policy Analyst
GTM Research:
Shayle Kann, Managing Director
Shyam Mehta, Senior Analyst
Brett Prior, Senior Analyst
MJ Shiao, Solar Analyst
Andrew Krulewitz, Research Associate
5 Copyright © 2011 Greentech Media
U.S. SOLAR ENERGY TRADE ASSESSMENT 2011 Photovoltaics Concentrating Solar Power Solar Heating & Cooling
1 EXECUTIVE SUMMARY
Trade
This is the second annual edition of a study fi rst published in November 2010. It is a comprehensive analysis of trade fl ows and domestic value creation in the U.S. solar energy industry for the calendar year 2010. The primary intent of this study is to go beyond the relatively simplistic analysis of solar trade issues often provided in both industry and political circles. Specifi cally, most prior analyses have focused on estimating domestic production versus imports of individual components of a solar system, particularly the solar module (also known as the panel). However, a complete assessment of solar trade fl ows needs to be both broader and deeper.
In contrast to other research, this study:
• Captures critical elements of the solar value chain such as installation labor, legal costs, and other “soft costs”, the value of which accrues directly to the U.S. for domestic installations;
• Analyzes trade fl ows of components of a solar installation, such as polysilicon, that are omitted in other analyses;
• Examines, in the case of photovoltaic (PV) modules, not just the location of fi nal assembly but also production locations for earlier steps in the value chain; and
• Examines all mainstream solar technologies types individually and aggregated – photovoltaics, concentrating solar power (CSP), and solar heating and cooling (SHC).
In addition, this updated version of the report considers two important elements that were not included in last year’s report: capital equipment and thin fi lm PV feedstock.
Domestic Value Creation
A signifi cant portion of the revenue generated by solar projects resides beyond the physical components, as site preparation, installation labor, permitting, fi nancing and other soft costs comprise nearly 50% of the total cost of a typical project. Accordingly, when evaluating solar installations this study focuses on the proportion of “total value created” in the U.S. rather than just the components that would fi gure into a “domestic content” calculation.
This study seeks to answer two fundamental questions:
• What percentage of the value in U.S. solar installations was created domestically in 2010?
• What was the value of solar products that were imported into, and exported from, the United States in 2010?
6 Copyright © 2011 Greentech Media
U.S. SOLAR ENERGY TRADE ASSESSMENT 2011 Photovoltaics Concentrating Solar Power Solar Heating & Cooling
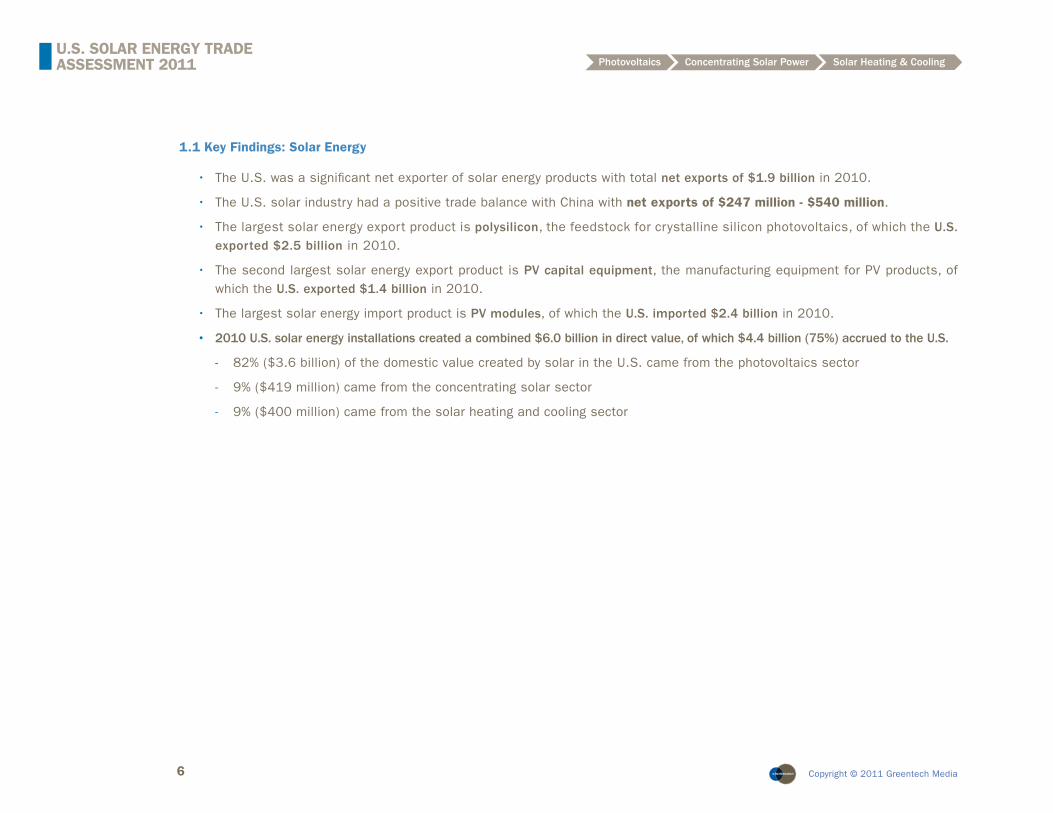
1.1 Key Findings: Solar Energy
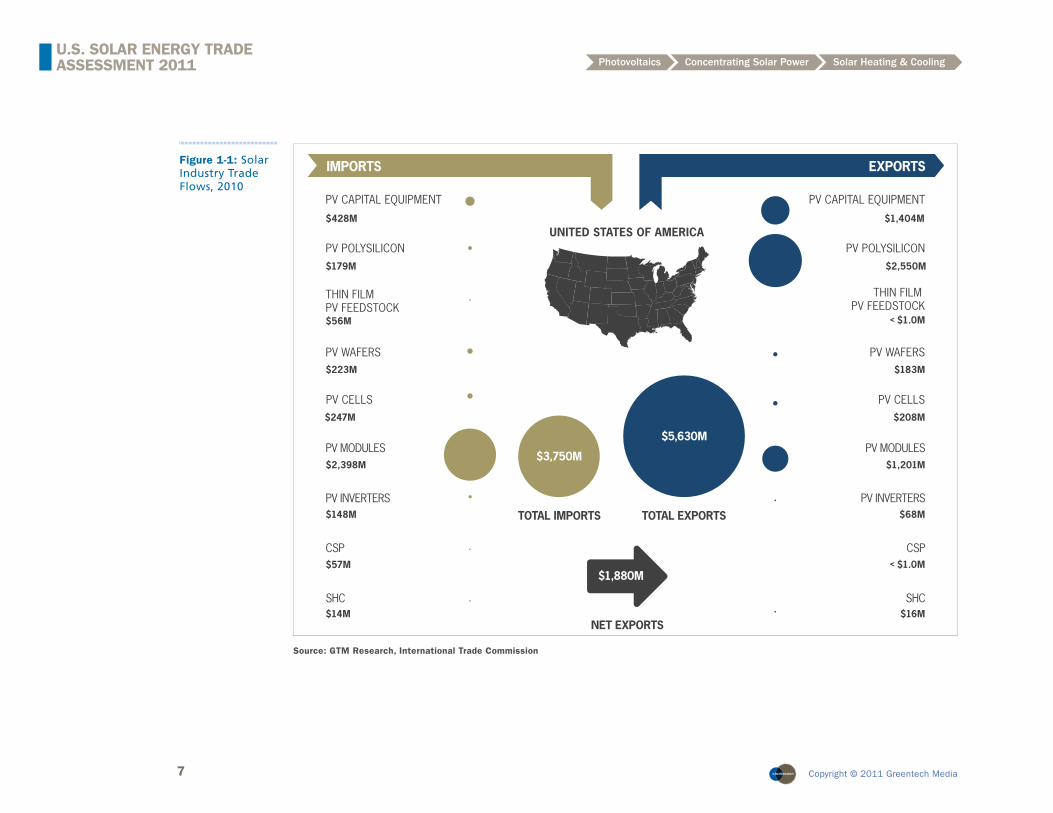
• The U.S. was a signifi cant net exporter of solar energy products with total net exports of $1.9 billion in 2010.
• The U.S. solar industry had a positive trade balance with China with net exports of $247 million - $540 million.
• The largest solar energy export product is polysilicon, the feedstock for crystalline silicon photovoltaics, of which the U.S. exported $2.5 billion in 2010.
• The second largest solar energy export product is PV capital equipment, the manufacturing equipment for PV products, of which the U.S. exported $1.4 billion in 2010.
• The largest solar energy import product is PV modules, of which the U.S. imported $2.4 billion in 2010.
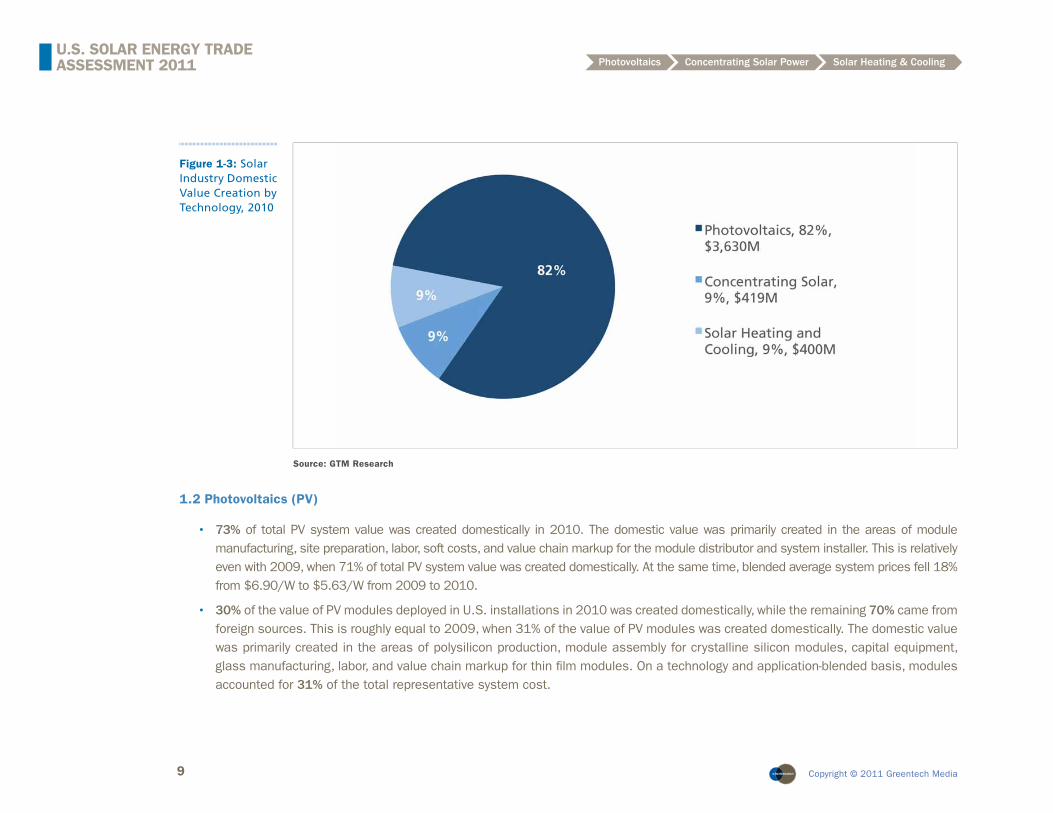
• 2010 U.S. solar energy installations created a combined $6.0 billion in direct value, of which $4.4 billion (75%) accrued to the U.S.
- 82% ($3.6 billion) of the domestic value created by solar in the U.S. came from the photovoltaics sector
- 9% ($419 million) came from the concentrating solar sector
- 9% ($400 million) came from the solar heating and cooling sector
7 Copyright © 2011 Greentech Media
U.S. SOLAR ENERGY TRADE ASSESSMENT 2011 Photovoltaics Concentrating Solar Power Solar Heating & Cooling
Source: GTM Research, International Trade Commission
TOTAL IMPORTS
PV CAPITAL EQUIPMENT
PV POLYSILICON
THIN FILM PV FEEDSTOCK
PV WAFERS
PV MODULES
IMPORTS
TOTAL EXPORTS
EXPORTS
NET EXPORTS
UNITED STATES OF AMERICA
PV INVERTERS
$5,630M
$3,750M
CSP
SHC
PV CAPITAL EQUIPMENT
PV POLYSILICON
THIN FILM PV FEEDSTOCK
PV WAFERS
PV MODULES
PV INVERTERS
CSP
SHC
$1,880M
$428M $1,404M
$179M $2,550M
$56M
$223M $183M
$2,398M $1,201M
$148M $68M
$57M
$14M $16M
PV CELLS PV CELLS
$247M $208M
$1.0M<
$1.0M<
Figure 1-1: Solar Industry Trade Flows, 2010

8 Copyright © 2011 Greentech Media
U.S. SOLAR ENERGY TRADE ASSESSMENT 2011 Photovoltaics Concentrating Solar Power Solar Heating & Cooling
Source: GTM Research
Figure 1-2: U.S. Solar Installations Domestic Value Creation, 2010
9 Copyright © 2011 Greentech Media
U.S. SOLAR ENERGY TRADE ASSESSMENT 2011 Photovoltaics Concentrating Solar Power Solar Heating & Cooling
Source: GTM Research
1.2 Photovoltaics (PV)
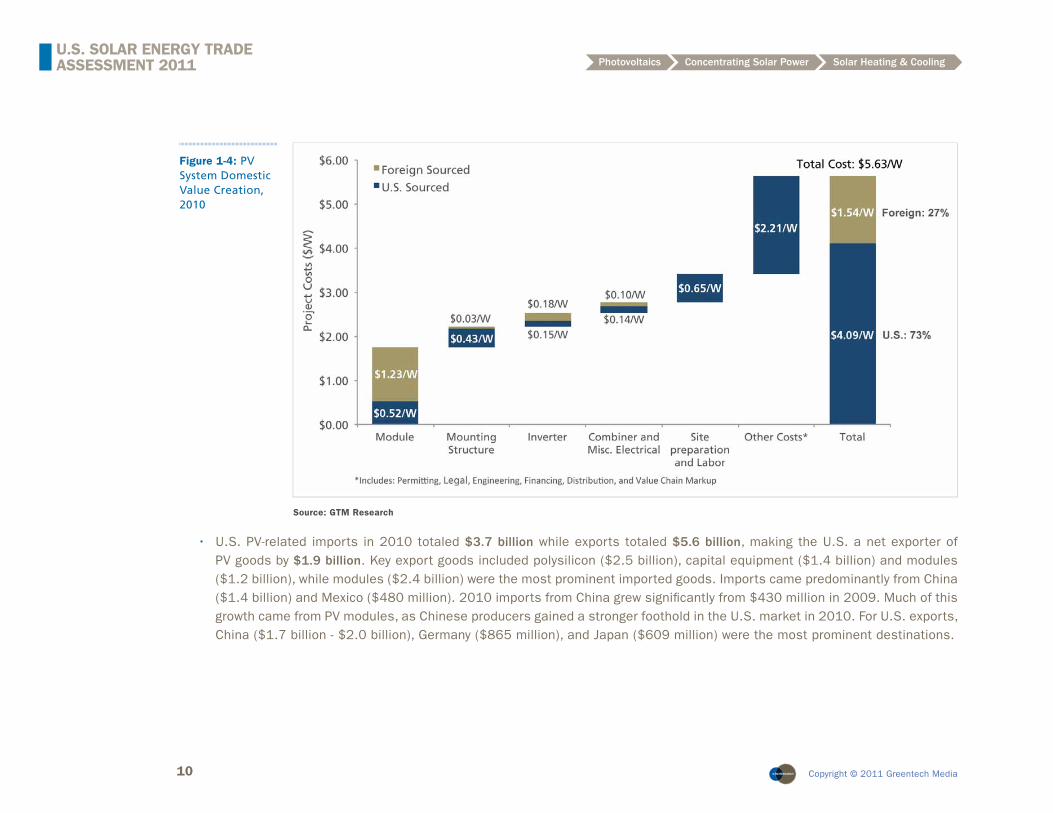
• 73% of total PV system value was created domestically in 2010. The domestic value was primarily created in the areas of module manufacturing, site preparation, labor, soft costs, and value chain markup for the module distributor and system installer. This is relatively even with 2009, when 71% of total PV system value was created domestically. At the same time, blended average system prices fell 18% from $6.90/W to $5.63/W from 2009 to 2010.
• 30% of the value of PV modules deployed in U.S. installations in 2010 was created domestically, while the remaining 70% came from foreign sources. This is roughly equal to 2009, when 31% of the value of PV modules was created domestically. The domestic value was primarily created in the areas of polysilicon production, module assembly for crystalline silicon modules, capital equipment, glass manufacturing, labor, and value chain markup for thin fi lm modules. On a technology and application-blended basis, modules accounted for 31% of the total representative system cost.
Figure 1-3: Solar Industry Domestic Value Creation by Technology, 2010
10 Copyright © 2011 Greentech Media
U.S. SOLAR ENERGY TRADE ASSESSMENT 2011 Photovoltaics Concentrating Solar Power Solar Heating & Cooling
Source: GTM Research
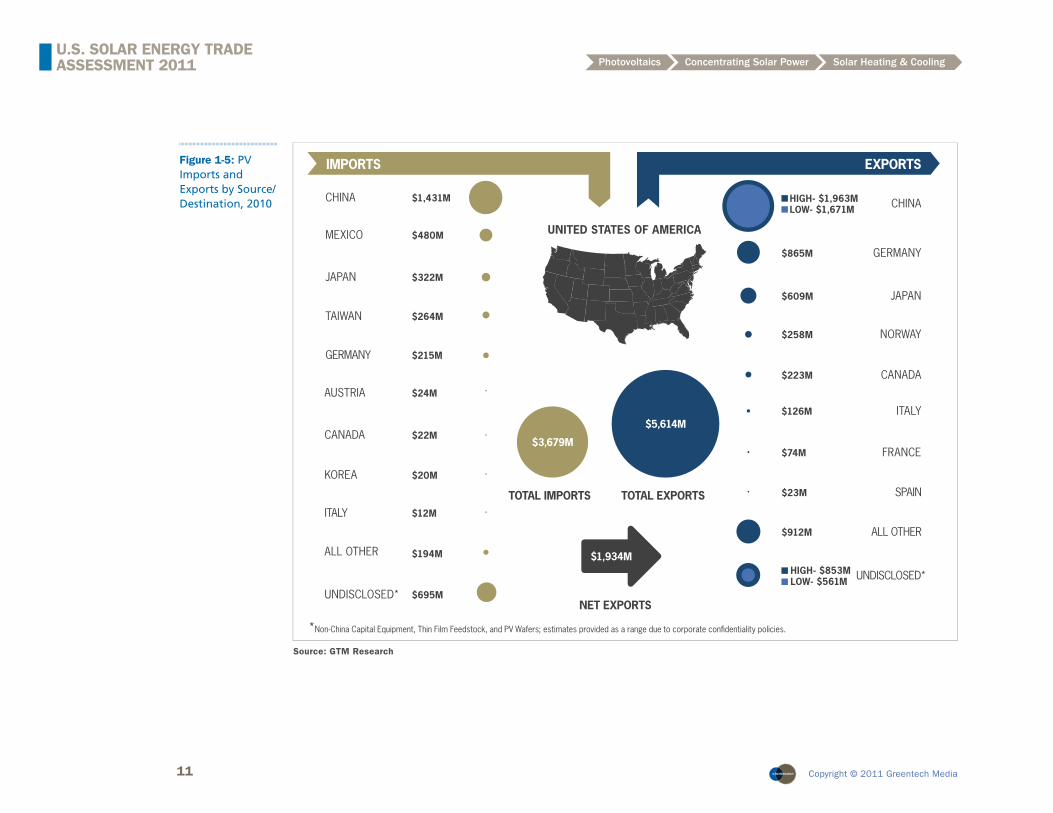
• U.S. PV-related imports in 2010 totaled $3.7 billion while exports totaled $5.6 billion, making the U.S. a net exporter of PV goods by $1.9 billion. Key export goods included polysilicon ($2.5 billion), capital equipment ($1.4 billion) and modules ($1.2 billion), while modules ($2.4 billion) were the most prominent imported goods. Imports came predominantly from China ($1.4 billion) and Mexico ($480 million). 2010 imports from China grew signifi cantly from $430 million in 2009. Much of this growth came from PV modules, as Chinese producers gained a stronger foothold in the U.S. market in 2010. For U.S. exports, China ($1.7 billion - $2.0 billion), Germany ($865 million), and Japan ($609 million) were the most prominent destinations.
Figure 1-4: PV System Domestic Value Creation, 2010
11 Copyright © 2011 Greentech Media
U.S. SOLAR ENERGY TRADE ASSESSMENT 2011 Photovoltaics Concentrating Solar Power Solar Heating & Cooling
Figure 1-5: PV Imports and Exports by Source/Destination, 2010
Source: GTM Research
TOTAL IMPORTS
CHINA
MEXICO
JAPAN
TAIWAN
GERMANY
IMPORTS
TOTAL EXPORTS
EXPORTS
NET EXPORTS
UNITED STATES OF AMERICA
$5,614M
$3,679M
AUSTRIA
CANADA
KOREA
ITALY
ALL OTHER
UNDISCLOSED*
CHINA
*Non-China Capital Equipment, Thin Film Feedstock, and PV Wafers; estimates provided as a range due to corporate confidentiality policies.
$1,431M
$480M
$322M
$264M
$215M
$24M
$22M
$20M
$12M
$194M
$695M
JAPAN$609M
NORWAY$258M
GERMANY$865M
SPAIN$23M
CANADA$223M
ITALY$126M
FRANCE$74M
ALL OTHER$912M
UNDISCLOSED*
$1,934M
HIGH- $1,963MLOW- $1,671M
HIGH- $853MLOW- $561M

12 Copyright © 2011 Greentech Media
U.S. SOLAR ENERGY TRADE ASSESSMENT 2011 Photovoltaics Concentrating Solar Power Solar Heating & Cooling
1.3 Concentrating Solar Power (CSP)
• 88% of the total value of 2010 CSP installations was created domestically. The only components sourced internationally were mirrors, which were imported from Spain.
• U.S. imports of CSP-related goods totaled $57 million, all of which came from Spain. The U.S. did not export any CSP–related goods in 2010 in signifi cant quantities. Looking forward, trade fl ows for CSP should remain relatively small, as many of the components are low value per pound commodities, where the economics favor domestic sourcing to avoid transport costs.
• Note that data for CSP installations in 2010 is limited as there was only one large installation in the U.S. during the year.
Figure 1-6: CSP Project Domestic Value Creation, 2010
Source: GTM Research
13 Copyright © 2011 Greentech Media
U.S. SOLAR ENERGY TRADE ASSESSMENT 2011 Photovoltaics Concentrating Solar Power Solar Heating & Cooling
1.4 Solar Heating and Cooling (SHC)
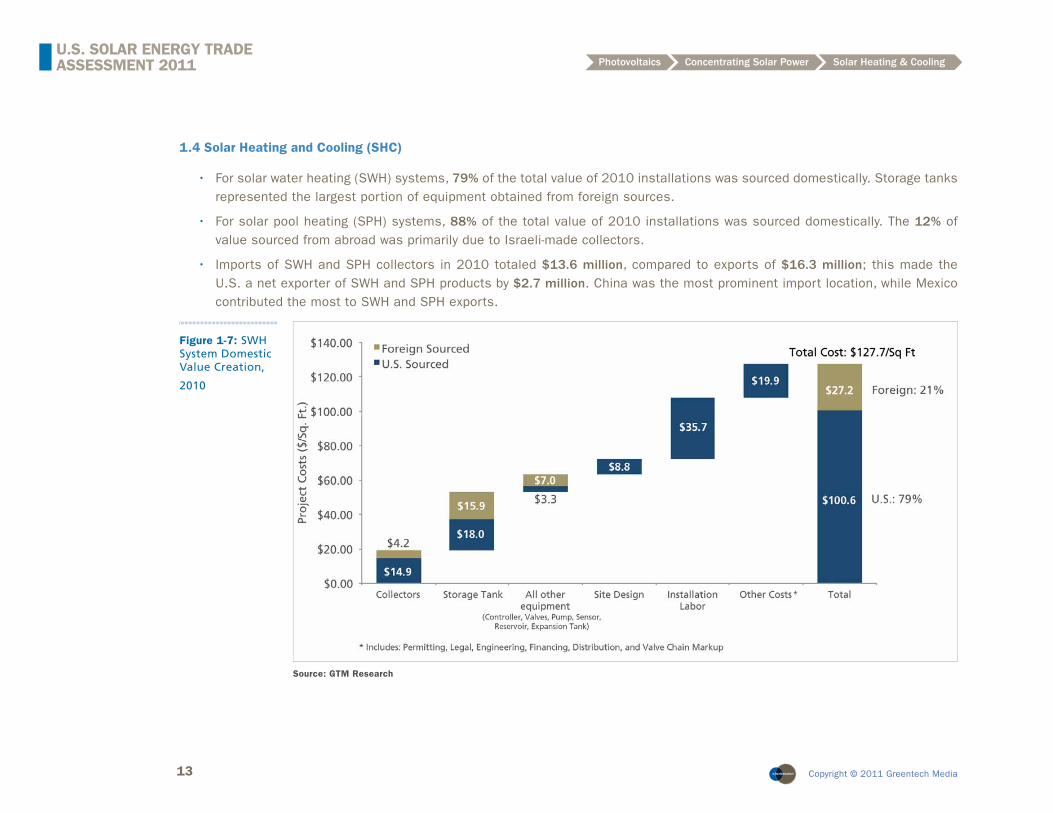
• For solar water heating (SWH) systems, 79% of the total value of 2010 installations was sourced domestically. Storage tanks represented the largest portion of equipment obtained from foreign sources.
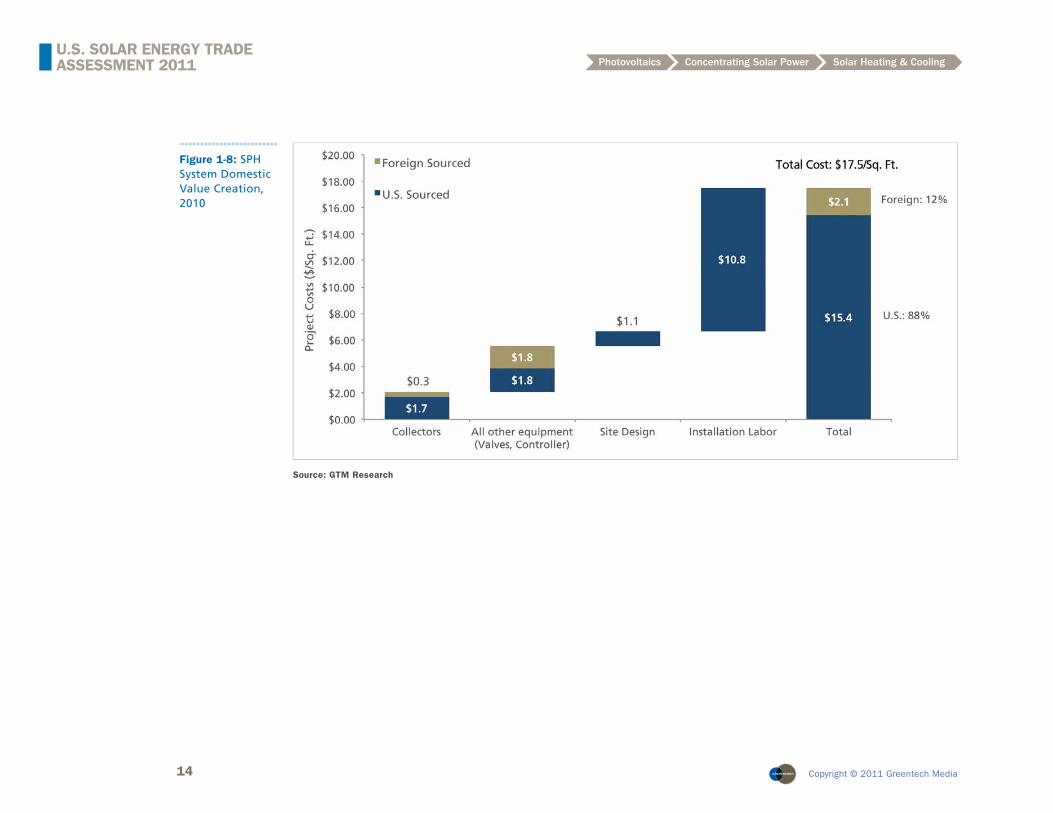
• For solar pool heating (SPH) systems, 88% of the total value of 2010 installations was sourced domestically. The 12% of value sourced from abroad was primarily due to Israeli-made collectors.
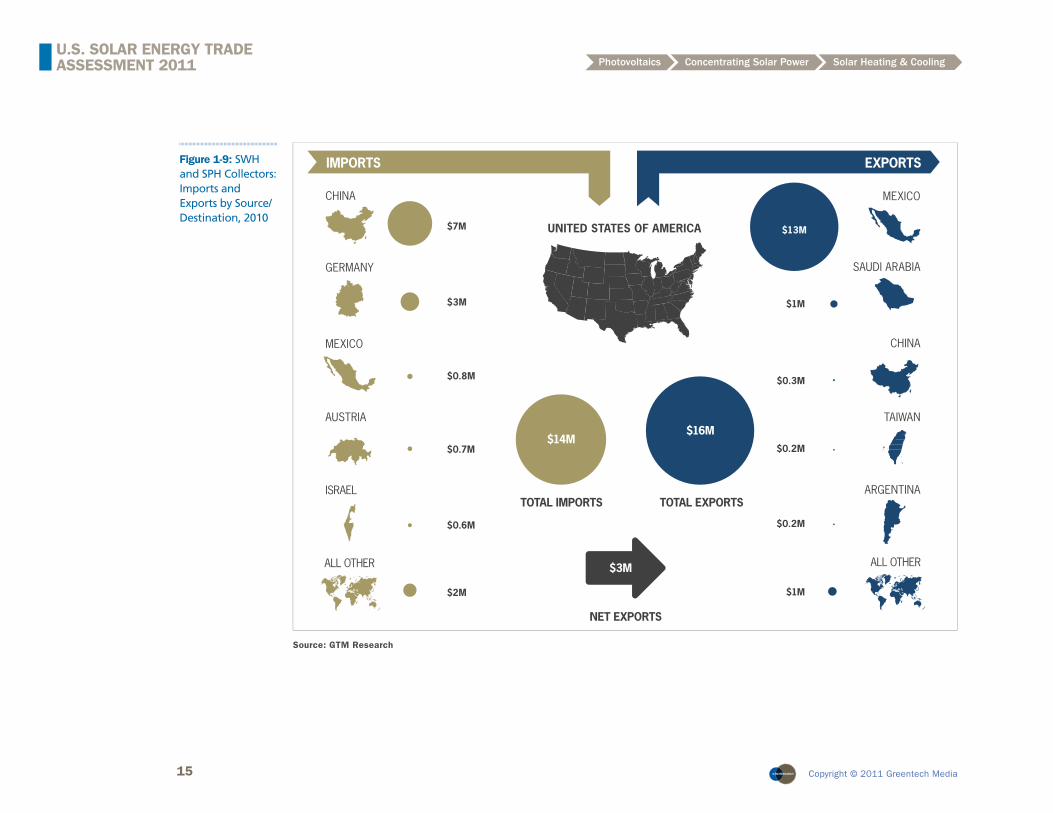
• Imports of SWH and SPH collectors in 2010 totaled $13.6 million, compared to exports of $16.3 million; this made the U.S. a net exporter of SWH and SPH products by $2.7 million. China was the most prominent import location, while Mexico contributed the most to SWH and SPH exports.
Figure 1-7: SWH System Domestic Value Creation,
2010
Source: GTM Research
14 Copyright © 2011 Greentech Media
U.S. SOLAR ENERGY TRADE ASSESSMENT 2011 Photovoltaics Concentrating Solar Power Solar Heating & Cooling
Figure 1-8: SPH System Domestic Value Creation, 2010
Source: GTM Research
15 Copyright © 2011 Greentech Media
U.S. SOLAR ENERGY TRADE ASSESSMENT 2011 Photovoltaics Concentrating Solar Power Solar Heating & Cooling
TOTAL IMPORTS
CHINA
GERMANY
MEXICO
AUSTRIA
ISRAEL
IMPORTS
$3M
$0.8M
$0.7M
$0.6M
TOTAL EXPORTS
EXPORTS
MEXICO
SAUDI ARABIA
CHINA
TAIWAN
ARGENTINA
$1M
$0.3M
$0.2M
$0.2M
NET EXPORTS
UNITED STATES OF AMERICA $13M
ALL OTHER
$7M
$2M
$16M$14M
$3M ALL OTHER
$1M
Figure 1-9: SWH and SPH Collectors: Imports and Exports by Source/Destination, 2010
Source: GTM Research
16 Copyright © 2011 Greentech Media
U.S. SOLAR ENERGY TRADE ASSESSMENT 2011 Photovoltaics Concentrating Solar Power Solar Heating & Cooling
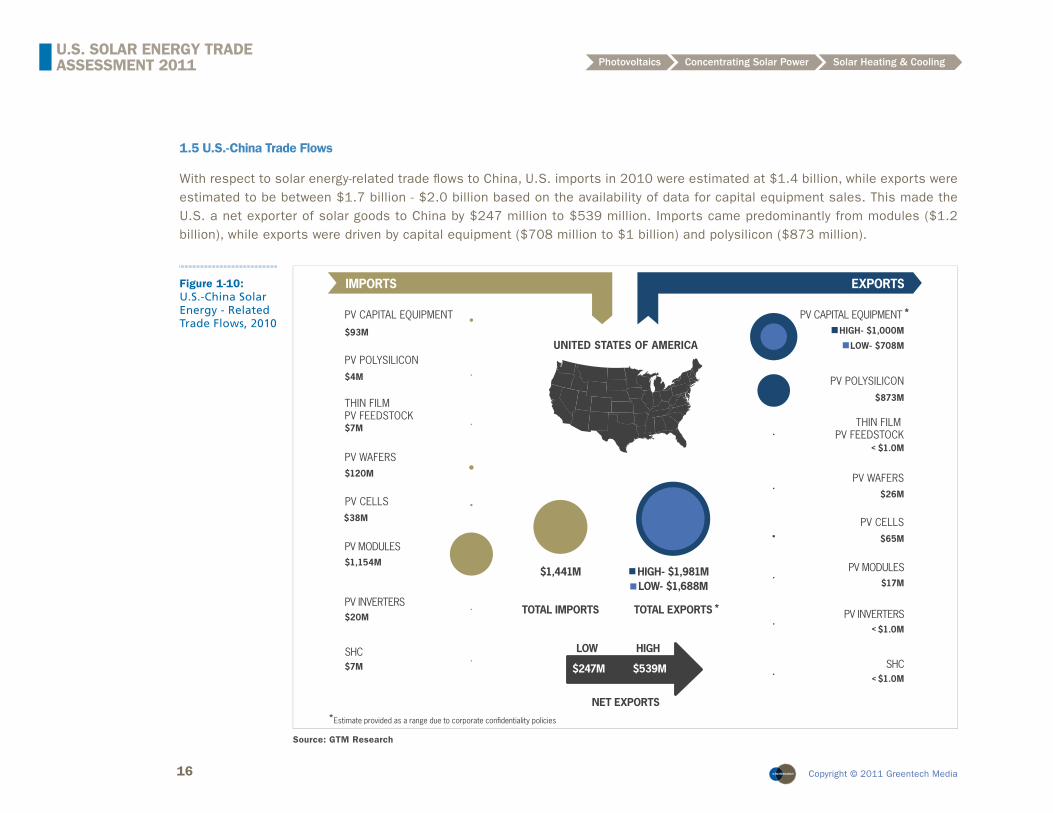
1.5 U.S.-China Trade Flows
With respect to solar energy-related trade fl ows to China, U.S. imports in 2010 were estimated at $1.4 billion, while exports were estimated to be between $1.7 billion - $2.0 billion based on the availability of data for capital equipment sales. This made the U.S. a net exporter of solar goods to China by $247 million to $539 million. Imports came predominantly from modules ($1.2 billion), while exports were driven by capital equipment ($708 million to $1 billion) and polysilicon ($873 million).
Figure 1-10: U.S.-China Solar Energy - Related Trade Flows, 2010
TOTAL IMPORTS
PV CAPITAL EQUIPMENT
PV POLYSILICON
THIN FILM PV FEEDSTOCK
PV WAFERS
PV MODULES
IMPORTS
TOTAL EXPORTS
EXPORTS
NET EXPORTS
UNITED STATES OF AMERICA
PV INVERTERS
HIGH- $1,981M$1,441M
SHC
PV CAPITAL EQUIPMENT
PV POLYSILICON
THIN FILM PV FEEDSTOCK
PV WAFERS
PV MODULES
PV INVERTERS
SHC
$93MLOW- $708M
$4M
$873M
$7M
$120M
$26M
$1,154M
$17M
$20M
$7M
PV CELLS
PV CELLS$38M
$65M
$1.0M<
$1.0M<
$1.0M<
HIGH- $1,000M
LOW- $1,688M
$247M
LOW
$539M
HIGH
*
*
*Estimate provided as a range due to corporate confidentiality policies
Source: GTM Research
17 Copyright © 2011 Greentech Media
U.S. SOLAR ENERGY TRADE ASSESSMENT 2011 Photovoltaics Concentrating Solar Power Solar Heating & Cooling
2 PHOTOVOLTAICS (PV)
The term photovoltaic (PV) refers to those materials that convert light energy into electrical energy; the operation of these devices is based on the photoelectric effect, wherein light (in the form of photons) striking the surface of a suitable semiconducting material is absorbed by electrons in its atoms. The electrons can then be harnessed to produce electric current. PV technologies are primarily differentiated based on the nature of the absorber material that is responsible for converting light into electricity. The existing technology options can be classifi ed into the following categories:
a. Crystalline silicon
b. Thin fi lms
c. Emerging materials, or next-generation PV
2.1 Domestic Value Created
A total of 887 megawatts (MW) of PV systems were installed in the U.S. in 2010 at a capacity-weighted average price of $5.63/W, indicating a total value of $5.0 billion for the U.S. solar PV market. Driven by the Federal Investment Tax Credit (ITC), the 1603 Treasury program and a variety of new state-level incentives, 2010 installations grew by 104% over 2009. One key question is how much of this value was created domestically versus sourced from abroad.
To determine this, GTM Research estimated the cost structure of a PV system that is representative of installed systems in the U.S. in 2010. Since the two prominent PV technologies (i.e. crystalline silicon and thin fi lm) have markedly different system cost structures, these were estimated separately and then blended together based on the market share of these two technologies in 2010. The primary cost structure elements for a fi nished system are the following:
• Module
• Inverter
• Mounting Structure
• Combiner Box and Misc. Electrical Materials
• Site Preparation, Labor, Soft Costs and Value Chain Markup
18 Copyright © 2011 Greentech Media
U.S. SOLAR ENERGY TRADE ASSESSMENT 2011 Photovoltaics Concentrating Solar Power Solar Heating & Cooling
2.2 Crystalline Silicon PV Modules
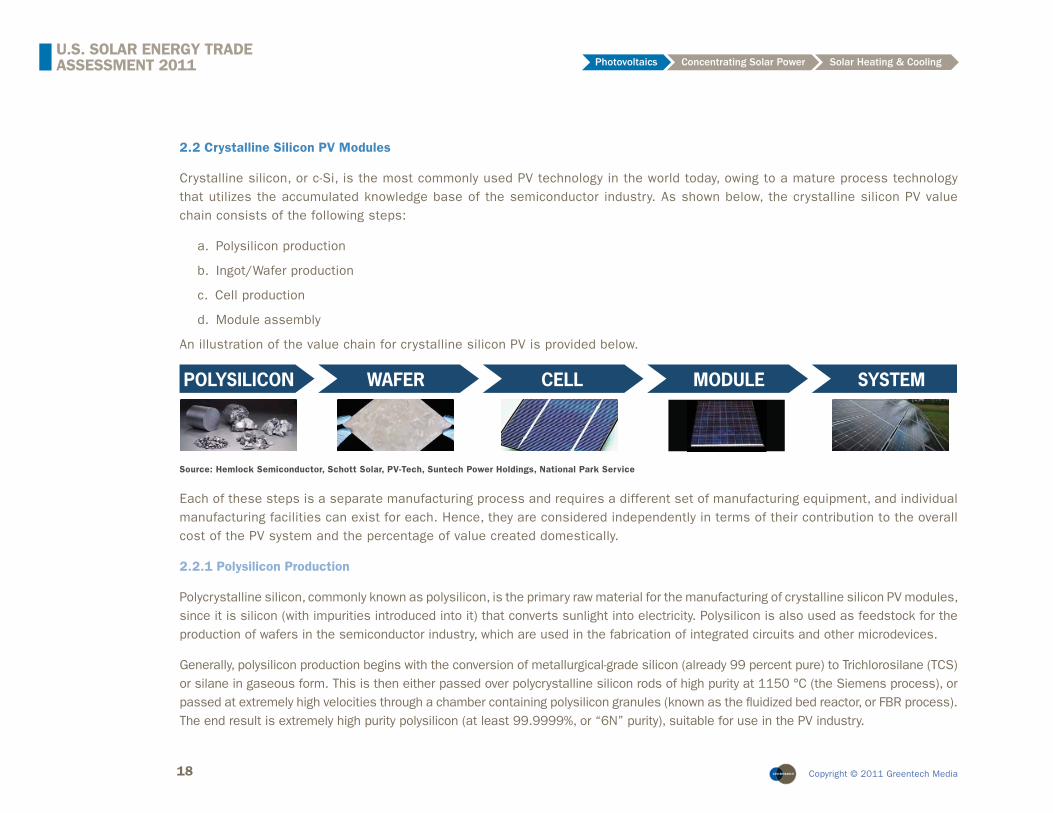
Crystalline silicon, or c-Si, is the most commonly used PV technology in the world today, owing to a mature process technology that utilizes the accumulated knowledge base of the semiconductor industry. As shown below, the crystalline silicon PV value chain consists of the following steps:
a. Polysilicon production
b. Ingot/Wafer production
c. Cell production
d. Module assembly
An illustration of the value chain for crystalline silicon PV is provided below.
Source: Hemlock Semiconductor, Schott Solar, PV-Tech, Suntech Power Holdings, National Park Service
Each of these steps is a separate manufacturing process and requires a different set of manufacturing equipment, and individual manufacturing facilities can exist for each. Hence, they are considered independently in terms of their contribution to the overall cost of the PV system and the percentage of value created domestically.
2.2.1 Polysilicon Production
Polycrystalline silicon, commonly known as polysilicon, is the primary raw material for the manufacturing of crystalline silicon PV modules, since it is silicon (with impurities introduced into it) that converts sunlight into electricity. Polysilicon is also used as feedstock for the production of wafers in the semiconductor industry, which are used in the fabrication of integrated circuits and other microdevices.
Generally, polysilicon production begins with the conversion of metallurgical-grade silicon (already 99 percent pure) to Trichlorosilane (TCS) or silane in gaseous form. This is then either passed over polycrystalline silicon rods of high purity at 1150 °C (the Siemens process), or passed at extremely high velocities through a chamber containing polysilicon granules (known as the fl uidized bed reactor, or FBR process). The end result is extremely high purity polysilicon (at least 99.9999%, or “6N” purity), suitable for use in the PV industry.
WAFER CELL MODULE SYSTEMPOLYSILICON
19 Copyright © 2011 Greentech Media
U.S. SOLAR ENERGY TRADE ASSESSMENT 2011 Photovoltaics Concentrating Solar Power Solar Heating & Cooling
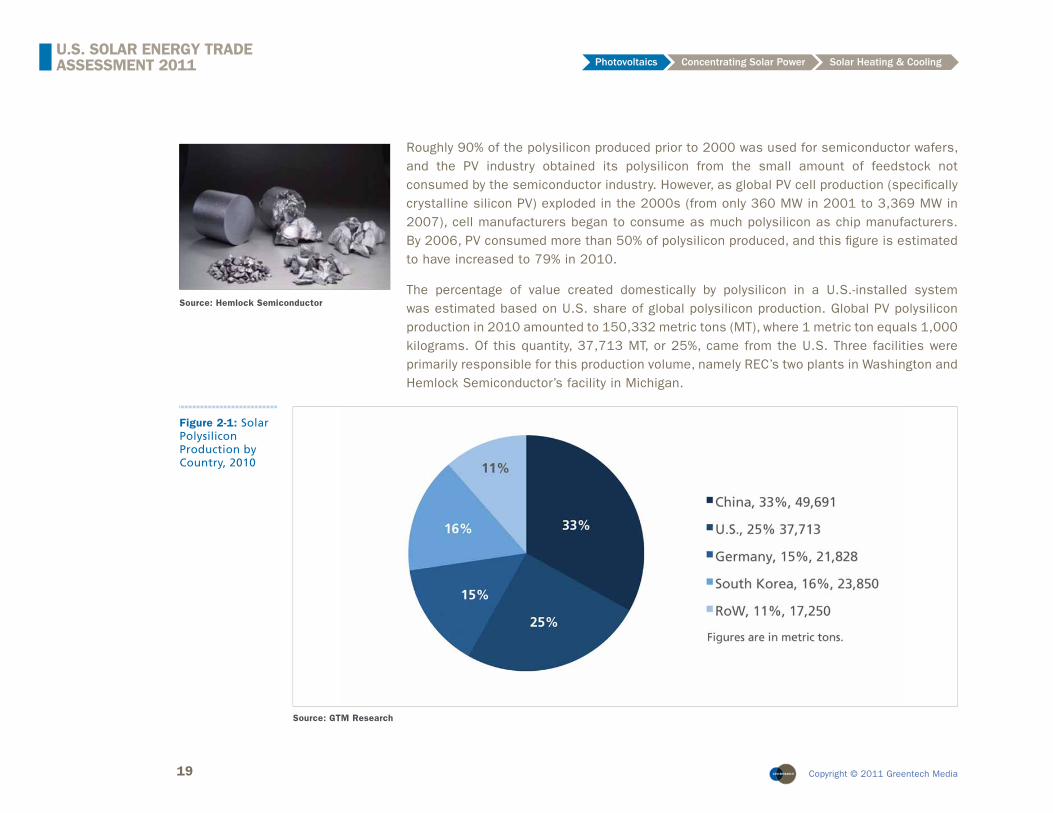
Roughly 90% of the polysilicon produced prior to 2000 was used for semiconductor wafers, and the PV industry obtained its polysilicon from the small amount of feedstock not consumed by the semiconductor industry. However, as global PV cell production (specifi cally crystalline silicon PV) exploded in the 2000s (from only 360 MW in 2001 to 3,369 MW in 2007), cell manufacturers began to consume as much polysilicon as chip manufacturers. By 2006, PV consumed more than 50% of polysilicon produced, and this fi gure is estimated to have increased to 79% in 2010.
The percentage of value created domestically by polysilicon in a U.S.-installed system was estimated based on U.S. share of global polysilicon production. Global PV polysilicon production in 2010 amounted to 150,332 metric tons (MT), where 1 metric ton equals 1,000 kilograms. Of this quantity, 37,713 MT, or 25%, came from the U.S. Three facilities were primarily responsible for this production volume, namely REC’s two plants in Washington and Hemlock Semiconductor’s facility in Michigan.
Source: Hemlock Semiconductor
Source: GTM Research
Figure 2-1: Solar Polysilicon Production by Country, 2010

20 Copyright © 2011 Greentech Media
U.S. SOLAR ENERGY TRADE ASSESSMENT 2011 Photovoltaics Concentrating Solar Power Solar Heating & Cooling
2.2.2 Ingot and Wafer Production
Once high-purity polysilicon is obtained, it is then melted and cast into large bricks or ingots, which are either cylindrical or rectangular in shape. The large ingot is sawed into smaller bars, which are then sliced into thin (180 to 200 micron) wafers using wire saws.
Global wafer production is dominated by Asian manufacturers, particularly those in China and Taiwan, while Western countries such as the U.S. and Germany have seen their market share fall signifi cantly in recent years. Unlike polysilicon, where the U.S. made up 25% of global production, only 3% of PV wafers manufactured worldwide in 2010 were produced in U.S. facilities. Thus, a large percentage of the value of wafers that eventually become part of installed PV systems in the U.S. is estimated to come from foreign sources.Source: Schott Solar
Source: GTM Research
Figure 2-2: Global PV Wafer Market Share, 2010

21 Copyright © 2011 Greentech Media
U.S. SOLAR ENERGY TRADE ASSESSMENT 2011 Photovoltaics Concentrating Solar Power Solar Heating & Cooling
For 2009, the percentage of value created domestically by wafers in a U.S.-installed system was estimated based on U.S. share of global production. However, this assumption proves to be overly conservative, as it does not account for the vertically integrated nature of U.S. module manufacturers that produce wafers, cells, and modules in-house in the U.S. An estimated 57 MW of modules produced by such fi rms was installed in the U.S. in 2010. These modules utilized internally sourced, domestically produced wafers and cells. Accounting for this fact (and utilizing U.S. share of global production for the rest) yields blended domestic content of 11% for U.S.-installed wafers in 2010, as shown in Figure 2-3 below.
DOMESTIC CONTENT OF U.S.-INSTALLED PV WAFERS, 2010
Total consumption in U.S.-installed c-Si modules (MW) 740
Consumption by U.S. wafer-cell-module manufacturers (MW) 61
Consumption by external purchase (MW) 679
U.S. wafer production, 2010 (MW) 595
Production excluding internal consumption (MW) 534
Global wafer production (MW) 20,232
Global wafer production, excluding U.S. internal consumption (MW) 20,171
Market share of remaining production 3%
U.S.-installed, domestically produced, externally purchased wafers (MW) 79
Domestic content of U.S.-installed wafers 11%
Figure 2-3: Estimation of Domestic Content of U.S.-installed PV Wafers, 2010
Source: GTM Research
22 Copyright © 2011 Greentech Media
U.S. SOLAR ENERGY TRADE ASSESSMENT 2011 Photovoltaics Concentrating Solar Power Solar Heating & Cooling
2.2.3 Cell Production
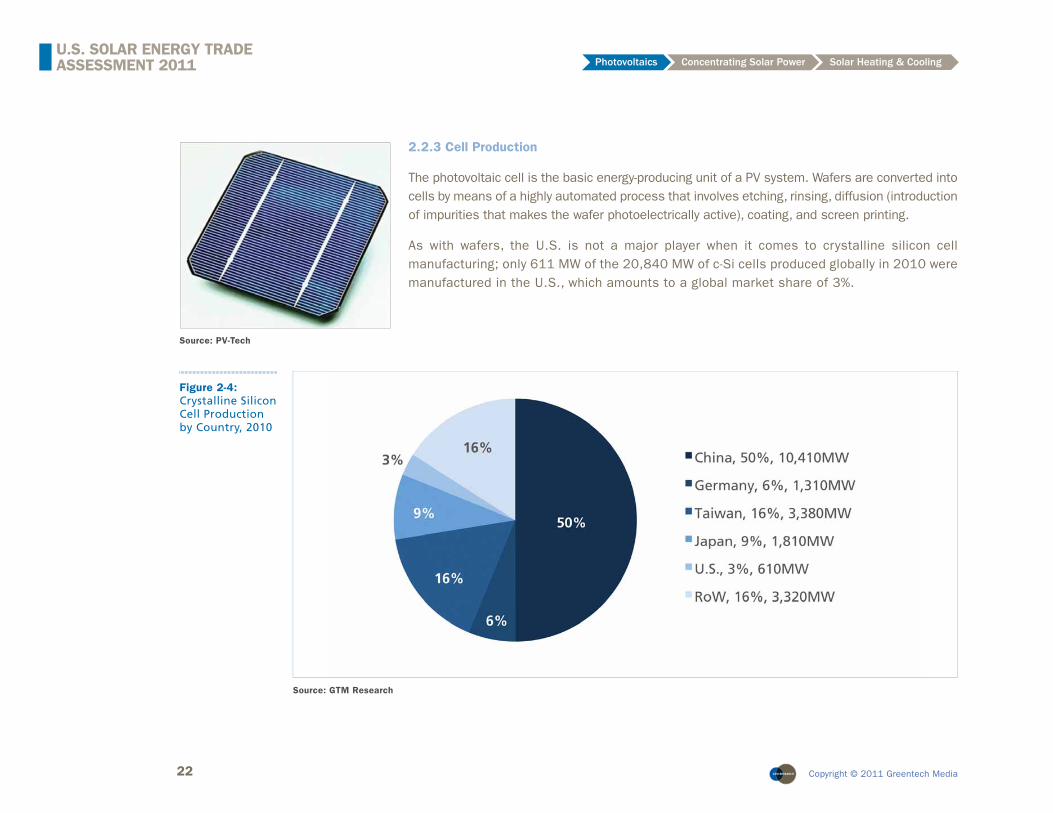
The photovoltaic cell is the basic energy-producing unit of a PV system. Wafers are converted into cells by means of a highly automated process that involves etching, rinsing, diffusion (introduction of impurities that makes the wafer photoelectrically active), coating, and screen printing.
As with wafers, the U.S. is not a major player when it comes to crystalline silicon cell manufacturing; only 611 MW of the 20,840 MW of c-Si cells produced globally in 2010 were manufactured in the U.S., which amounts to a global market share of 3%.
Source: PV-Tech
Figure 2-4: Crystalline Silicon Cell Production by Country, 2010
Source: GTM Research
23 Copyright © 2011 Greentech Media
U.S. SOLAR ENERGY TRADE ASSESSMENT 2011 Photovoltaics Concentrating Solar Power Solar Heating & Cooling
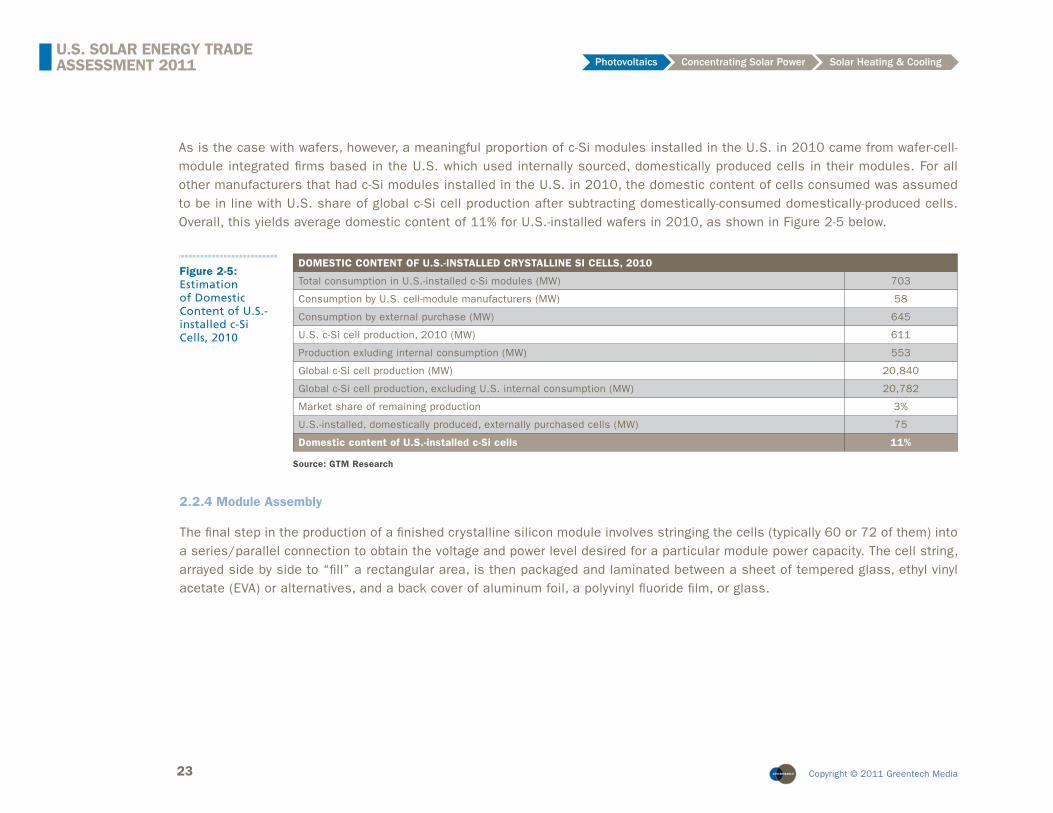
As is the case with wafers, however, a meaningful proportion of c-Si modules installed in the U.S. in 2010 came from wafer-cell-module integrated fi rms based in the U.S. which used internally sourced, domestically produced cells in their modules. For all other manufacturers that had c-Si modules installed in the U.S. in 2010, the domestic content of cells consumed was assumed to be in line with U.S. share of global c-Si cell production after subtracting domestically-consumed domestically-produced cells. Overall, this yields average domestic content of 11% for U.S.-installed wafers in 2010, as shown in Figure 2-5 below.
DOMESTIC CONTENT OF U.S.-INSTALLED CRYSTALLINE SI CELLS, 2010
Total consumption in U.S.-installed c-Si modules (MW) 703
Consumption by U.S. cell-module manufacturers (MW) 58
Consumption by external purchase (MW) 645
U.S. c-Si cell production, 2010 (MW) 611
Production exluding internal consumption (MW) 553
Global c-Si cell production (MW) 20,840
Global c-Si cell production, excluding U.S. internal consumption (MW) 20,782
Market share of remaining production 3%
U.S.-installed, domestically produced, externally purchased cells (MW) 75
Domestic content of U.S.-installed c-Si cells 11%
Figure 2-5: Estimation of Domestic Content of U.S.-installed c-Si Cells, 2010
Source: GTM Research
2.2.4 Module Assembly
The fi nal step in the production of a fi nished crystalline silicon module involves stringing the cells (typically 60 or 72 of them) into a series/parallel connection to obtain the voltage and power level desired for a particular module power capacity. The cell string, arrayed side by side to “fi ll” a rectangular area, is then packaged and laminated between a sheet of tempered glass, ethyl vinyl acetate (EVA) or alternatives, and a back cover of aluminum foil, a polyvinyl fl uoride fi lm, or glass.
24 Copyright © 2011 Greentech Media
U.S. SOLAR ENERGY TRADE ASSESSMENT 2011 Photovoltaics Concentrating Solar Power Solar Heating & Cooling
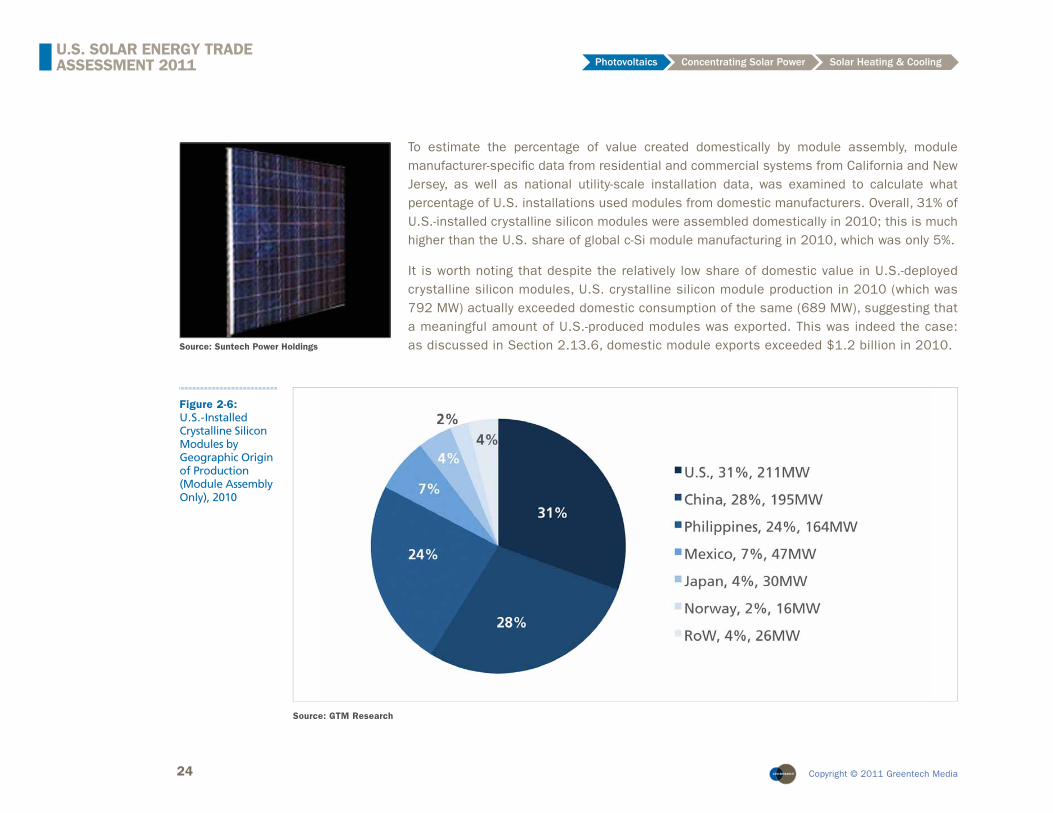
To estimate the percentage of value created domestically by module assembly, module manufacturer-specifi c data from residential and commercial systems from California and New Jersey, as well as national utility-scale installation data, was examined to calculate what percentage of U.S. installations used modules from domestic manufacturers. Overall, 31% of U.S.-installed crystalline silicon modules were assembled domestically in 2010; this is much higher than the U.S. share of global c-Si module manufacturing in 2010, which was only 5%.
It is worth noting that despite the relatively low share of domestic value in U.S.-deployed crystalline silicon modules, U.S. crystalline silicon module production in 2010 (which was 792 MW) actually exceeded domestic consumption of the same (689 MW), suggesting that a meaningful amount of U.S.-produced modules was exported. This was indeed the case: as discussed in Section 2.13.6, domestic module exports exceeded $1.2 billion in 2010.Source: Suntech Power Holdings
Figure 2-6: U.S.-Installed Crystalline Silicon Modules by Geographic Origin of Production (Module Assembly Only), 2010
Source: GTM Research
25 Copyright © 2011 Greentech Media
U.S. SOLAR ENERGY TRADE ASSESSMENT 2011 Photovoltaics Concentrating Solar Power Solar Heating & Cooling
2.2.5 Crystalline Silicon Module
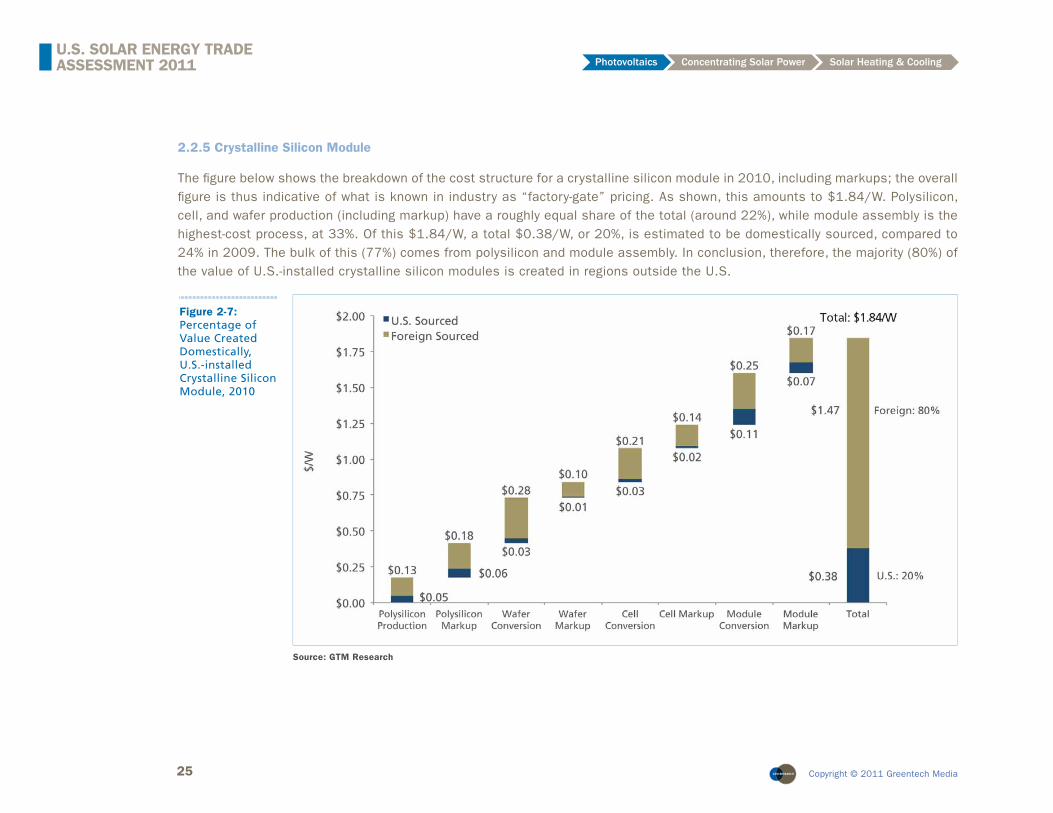
The fi gure below shows the breakdown of the cost structure for a crystalline silicon module in 2010, including markups; the overall fi gure is thus indicative of what is known in industry as “factory-gate” pricing. As shown, this amounts to $1.84/W. Polysilicon, cell, and wafer production (including markup) have a roughly equal share of the total (around 22%), while module assembly is the highest-cost process, at 33%. Of this $1.84/W, a total $0.38/W, or 20%, is estimated to be domestically sourced, compared to 24% in 2009. The bulk of this (77%) comes from polysilicon and module assembly. In conclusion, therefore, the majority (80%) of the value of U.S.-installed crystalline silicon modules is created in regions outside the U.S.
Figure 2-7: Percentage of Value Created Domestically, U.S.-installed Crystalline Silicon Module, 2010
Source: GTM Research
26 Copyright © 2011 Greentech Media
U.S. SOLAR ENERGY TRADE ASSESSMENT 2011 Photovoltaics Concentrating Solar Power Solar Heating & Cooling
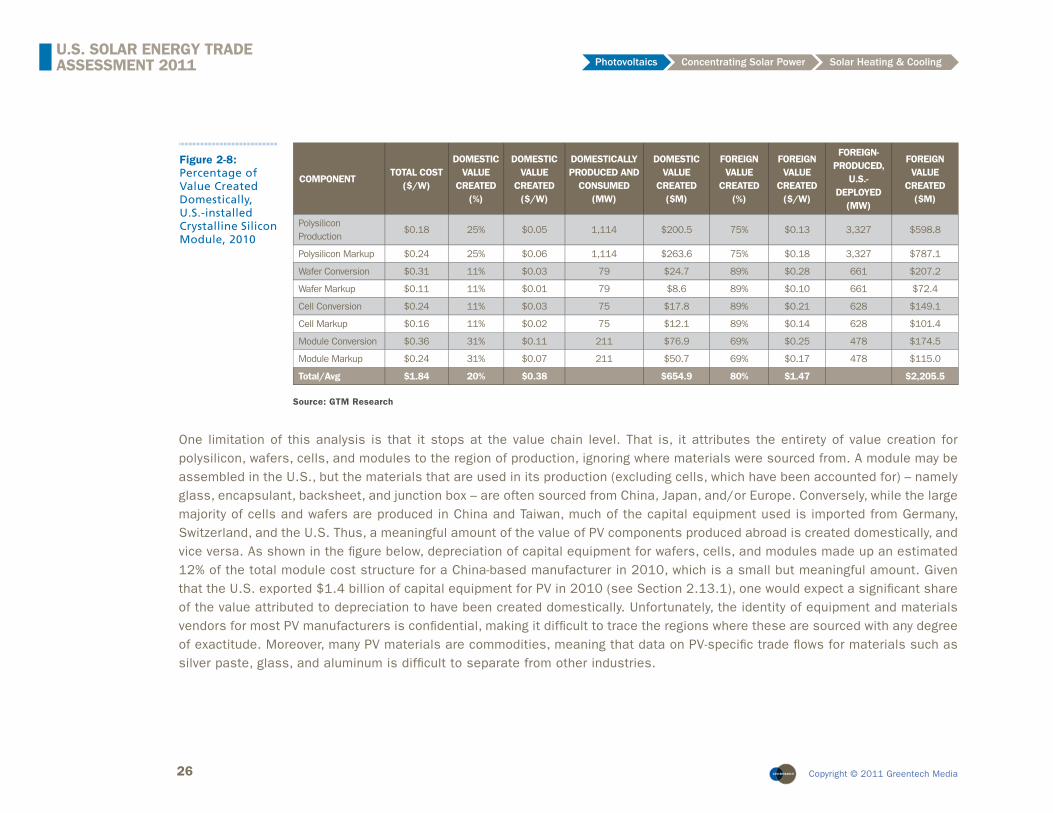
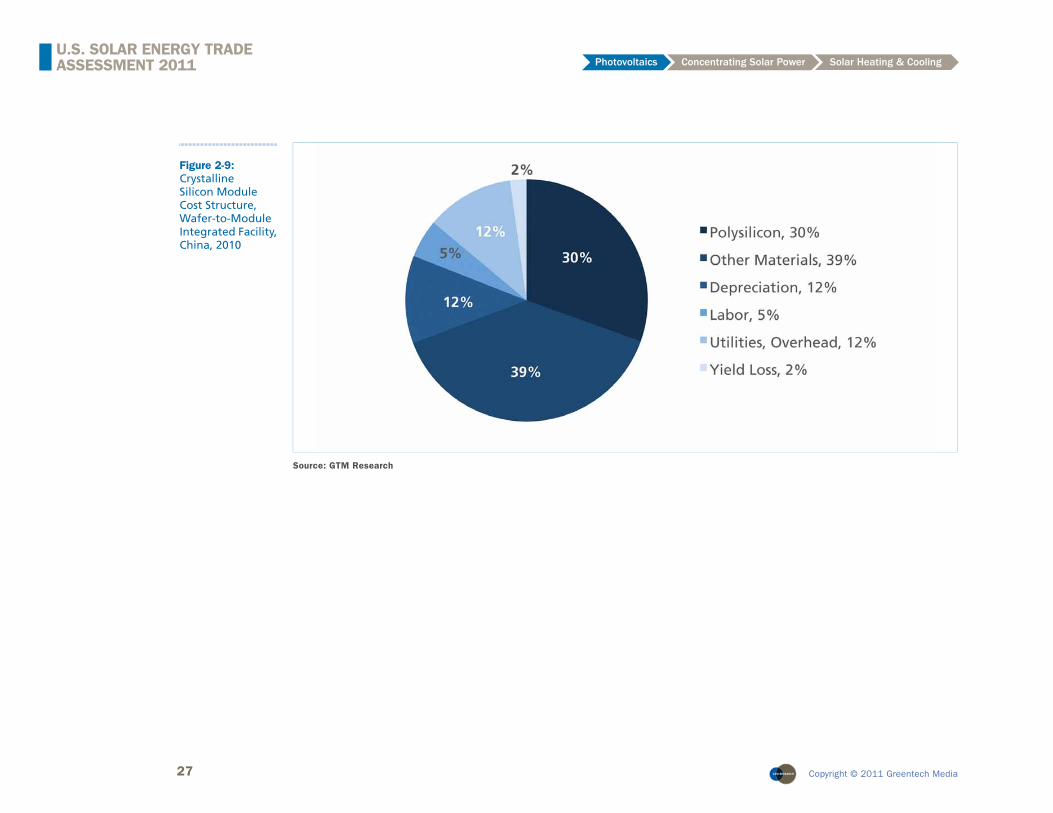
One limitation of this analysis is that it stops at the value chain level. That is, it attributes the entirety of value creation for polysilicon, wafers, cells, and modules to the region of production, ignoring where materials were sourced from. A module may be assembled in the U.S., but the materials that are used in its production (excluding cells, which have been accounted for) – namely glass, encapsulant, backsheet, and junction box – are often sourced from China, Japan, and/or Europe. Conversely, while the large majority of cells and wafers are produced in China and Taiwan, much of the capital equipment used is imported from Germany, Switzerland, and the U.S. Thus, a meaningful amount of the value of PV components produced abroad is created domestically, and vice versa. As shown in the fi gure below, depreciation of capital equipment for wafers, cells, and modules made up an estimated 12% of the total module cost structure for a China-based manufacturer in 2010, which is a small but meaningful amount. Given that the U.S. exported $1.4 billion of capital equipment for PV in 2010 (see Section 2.13.1), one would expect a signifi cant share of the value attributed to depreciation to have been created domestically. Unfortunately, the identity of equipment and materials vendors for most PV manufacturers is confi dential, making it diffi cult to trace the regions where these are sourced with any degree of exactitude. Moreover, many PV materials are commodities, meaning that data on PV-specifi c trade fl ows for materials such as silver paste, glass, and aluminum is diffi cult to separate from other industries.
COMPONENTTOTAL COST
($/W)
DOMESTIC VALUE
CREATED (%)
DOMESTIC VALUE
CREATED($/W)
DOMESTICALLY PRODUCED AND
CONSUMED (MW)
DOMESTIC VALUE
CREATED ($M)
FOREIGN VALUE
CREATED (%)
FOREIGN VALUE
CREATED ($/W)
FOREIGN-PRODUCED,
U.S.-DEPLOYED
(MW)
FOREIGN VALUE
CREATED ($M)
Polysilicon Production
$0.18 25% $0.05 1,114 $200.5 75% $0.13 3,327 $598.8
Polysilicon Markup $0.24 25% $0.06 1,114 $263.6 75% $0.18 3,327 $787.1
Wafer Conversion $0.31 11% $0.03 79 $24.7 89% $0.28 661 $207.2
Wafer Markup $0.11 11% $0.01 79 $8.6 89% $0.10 661 $72.4
Cell Conversion $0.24 11% $0.03 75 $17.8 89% $0.21 628 $149.1
Cell Markup $0.16 11% $0.02 75 $12.1 89% $0.14 628 $101.4
Module Conversion $0.36 31% $0.11 211 $76.9 69% $0.25 478 $174.5
Module Markup $0.24 31% $0.07 211 $50.7 69% $0.17 478 $115.0
Total/Avg $1.84 20% $0.38 $654.9 80% $1.47 $2,205.5
Source: GTM Research
Figure 2-8: Percentage of Value Created Domestically, U.S.-installed Crystalline Silicon Module, 2010
27 Copyright © 2011 Greentech Media
U.S. SOLAR ENERGY TRADE ASSESSMENT 2011 Photovoltaics Concentrating Solar Power Solar Heating & Cooling
Figure 2-9: Crystalline Silicon Module Cost Structure, Wafer-to-Module Integrated Facility, China, 2010
Source: GTM Research

28 Copyright © 2011 Greentech Media
U.S. SOLAR ENERGY TRADE ASSESSMENT 2011 Photovoltaics Concentrating Solar Power Solar Heating & Cooling
2.3 Thin Film PV Modules
Unlike crystalline silicon, where the photovoltaic material is a 180-200 micron thick wafer, thin fi lm technology utilizes layers only a few microns thick as the light-absorbing material, deposited onto a substrate, such as glass or metal foil, and uses a fi lm manufacturing process. To date, three thin fi lm technologies have been commercialized at mass production scale. These are cadmium telluride (CdTe), amorphous silicon (a-Si), and copper indium (gallium) diselenide (CIGS); the names represent the composition of the fi lm that acts as the photoactive layer in the module.
Source: First Solar
• Feedstock• Capital Equipment• Glass• Other Materials (encapsulant, junction box, cables)
• Labor• Utilities• Overhead• Module Markup
Of the estimated 197 MW of thin fi lm modules installed in the U.S. in 2010, 191 MW (97%) were manufactured domestically, with an estimated 87% from a single supplier, CdTe-based First Solar. Because of CdTe’s dominant market share of thin fi lm installations and the limitation of data for other manufacturers/technologies, it is assumed that the thin fi lm module and system in question are CdTe for the purpose of this analysis. A pictorial depiction of the manufacturing process for thin fi lm modules is presented below.
Just as with the nature of the absorber layer, the manufacturing process for thin fi lm modules is also markedly different from that of c-Si: most often, a sheet of glass goes in at one end of the production line, to be converted into a fi nished module just a few hours later. This means that the entire production process takes place inside one facility, compared to c-Si, where polysilicon, ingot/wafer, cell, and module production often take place in different factories. Because of this, the thin fi lm module must be broken down by its cost components rather than by value chain segment for the purposes of this analysis. At a high level, these are the following:
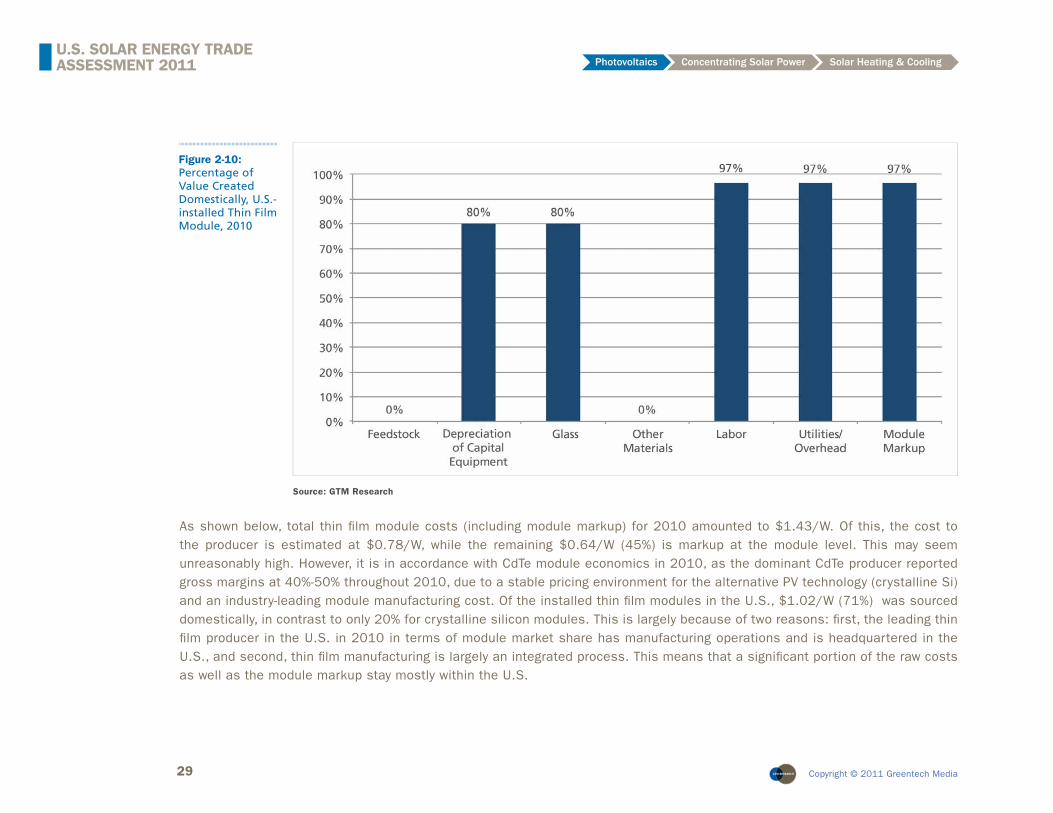
To determine the percentage of value created domestically for an installed thin fi lm module, the cost components above were examined individually. Unlike c-Si, where more than 100 fi rms contributed to U.S.-installed modules, 87% of installed thin fi lm modules were produced by a single vendor (First Solar), making it easier to trace where materials and capital equipment were sourced. Figure 2-10 displays the domestic share estimated for each. As shown, non-glass materials were assumed to be 100% sourced from abroad. On the other hand, glass and capital equipment were assumed to be 80% domestically sourced. For labor, utilities, overhead, and the module markup, domestic content was assumed to correspond to domestic manufacturers’ share of U.S.-installed thin fi lm modules in 2010, which was 97%.
29 Copyright © 2011 Greentech Media
U.S. SOLAR ENERGY TRADE ASSESSMENT 2011 Photovoltaics Concentrating Solar Power Solar Heating & Cooling
Figure 2-10: Percentage of Value Created Domestically, U.S.-installed Thin Film Module, 2010
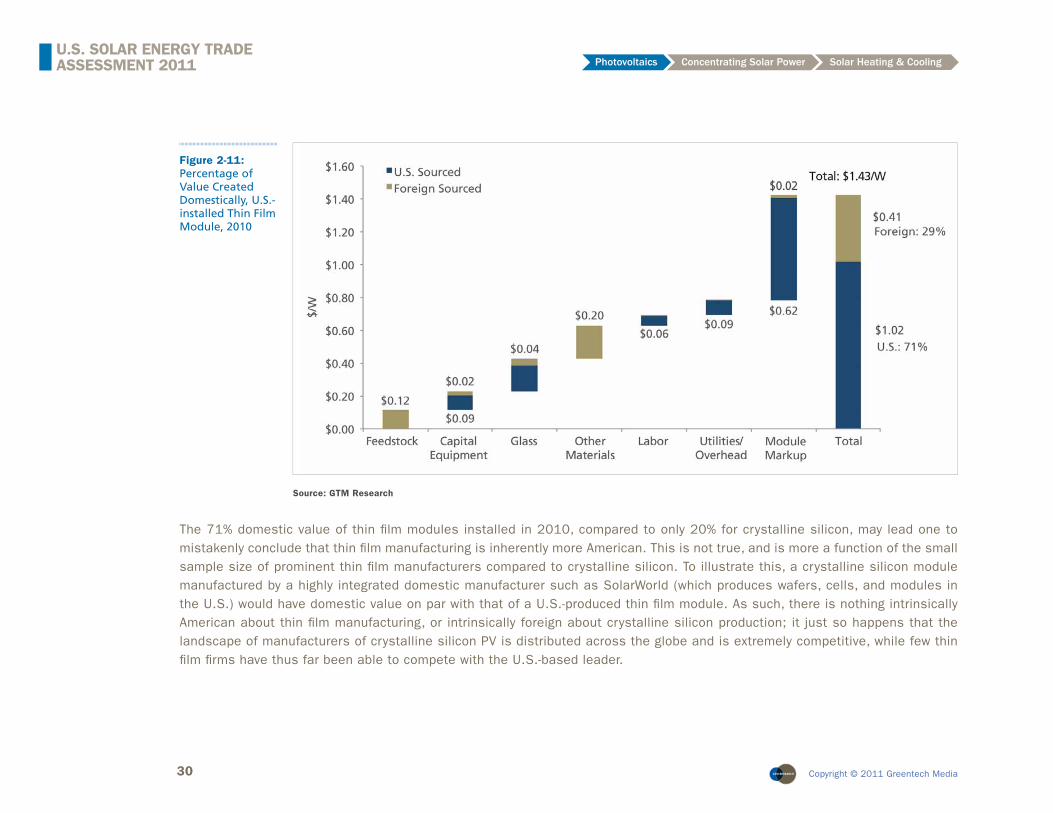
As shown below, total thin fi lm module costs (including module markup) for 2010 amounted to $1.43/W. Of this, the cost to the producer is estimated at $0.78/W, while the remaining $0.64/W (45%) is markup at the module level. This may seem unreasonably high. However, it is in accordance with CdTe module economics in 2010, as the dominant CdTe producer reported gross margins at 40%-50% throughout 2010, due to a stable pricing environment for the alternative PV technology (crystalline Si) and an industry-leading module manufacturing cost. Of the installed thin fi lm modules in the U.S., $1.02/W (71%) was sourced domestically, in contrast to only 20% for crystalline silicon modules. This is largely because of two reasons: fi rst, the leading thin fi lm producer in the U.S. in 2010 in terms of module market share has manufacturing operations and is headquartered in the U.S., and second, thin fi lm manufacturing is largely an integrated process. This means that a signifi cant portion of the raw costs as well as the module markup stay mostly within the U.S.
Source: GTM Research
30 Copyright © 2011 Greentech Media
U.S. SOLAR ENERGY TRADE ASSESSMENT 2011 Photovoltaics Concentrating Solar Power Solar Heating & Cooling
Figure 2-11: Percentage of Value Created Domestically, U.S.-installed Thin Film Module, 2010
The 71% domestic value of thin fi lm modules installed in 2010, compared to only 20% for crystalline silicon, may lead one to mistakenly conclude that thin fi lm manufacturing is inherently more American. This is not true, and is more a function of the small sample size of prominent thin fi lm manufacturers compared to crystalline silicon. To illustrate this, a crystalline silicon module manufactured by a highly integrated domestic manufacturer such as SolarWorld (which produces wafers, cells, and modules in the U.S.) would have domestic value on par with that of a U.S.-produced thin fi lm module. As such, there is nothing intrinsically American about thin fi lm manufacturing, or intrinsically foreign about crystalline silicon production; it just so happens that the landscape of manufacturers of crystalline silicon PV is distributed across the globe and is extremely competitive, while few thin fi lm fi rms have thus far been able to compete with the U.S.-based leader.
Source: GTM Research
31 Copyright © 2011 Greentech Media
U.S. SOLAR ENERGY TRADE ASSESSMENT 2011 Photovoltaics Concentrating Solar Power Solar Heating & Cooling
2.4 Blended PV Module
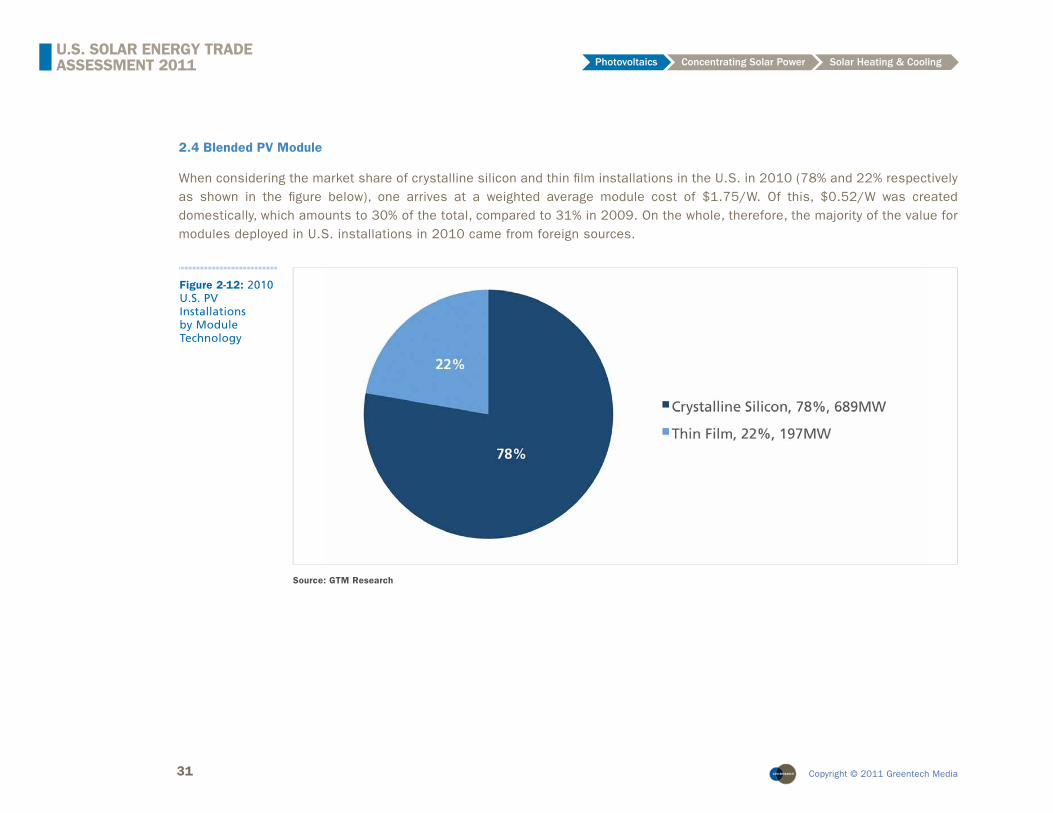
When considering the market share of crystalline silicon and thin fi lm installations in the U.S. in 2010 (78% and 22% respectively as shown in the fi gure below), one arrives at a weighted average module cost of $1.75/W. Of this, $0.52/W was created domestically, which amounts to 30% of the total, compared to 31% in 2009. On the whole, therefore, the majority of the value for modules deployed in U.S. installations in 2010 came from foreign sources.
Figure 2-12: 2010 U.S. PV Installations by Module Technology
Source: GTM Research
32 Copyright © 2011 Greentech Media
U.S. SOLAR ENERGY TRADE ASSESSMENT 2011 Photovoltaics Concentrating Solar Power Solar Heating & Cooling
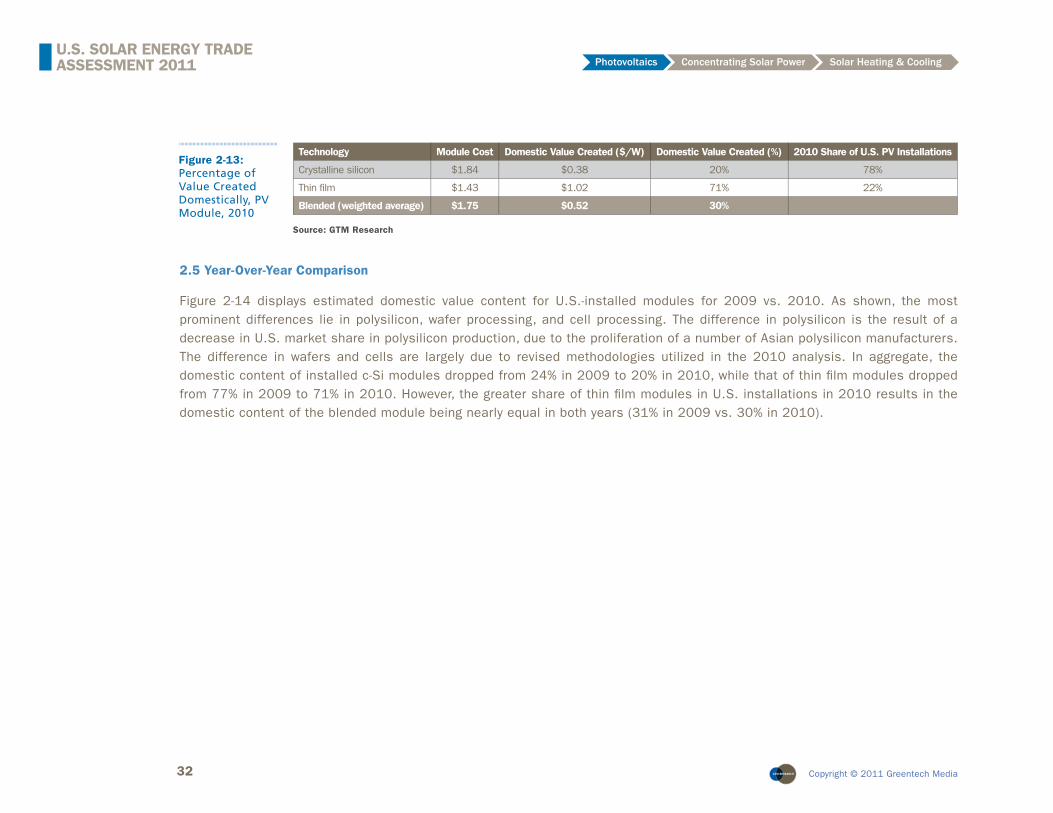
Figure 2-13: Percentage of Value Created Domestically, PV Module, 2010
Technology Module Cost Domestic Value Created ($/W) Domestic Value Created (%) 2010 Share of U.S. PV Installations
Crystalline silicon $1.84 $0.38 20% 78%
Thin fi lm $1.43 $1.02 71% 22%
Blended (weighted average) $1.75 $0.52 30%
2.5 Year-Over-Year Comparison
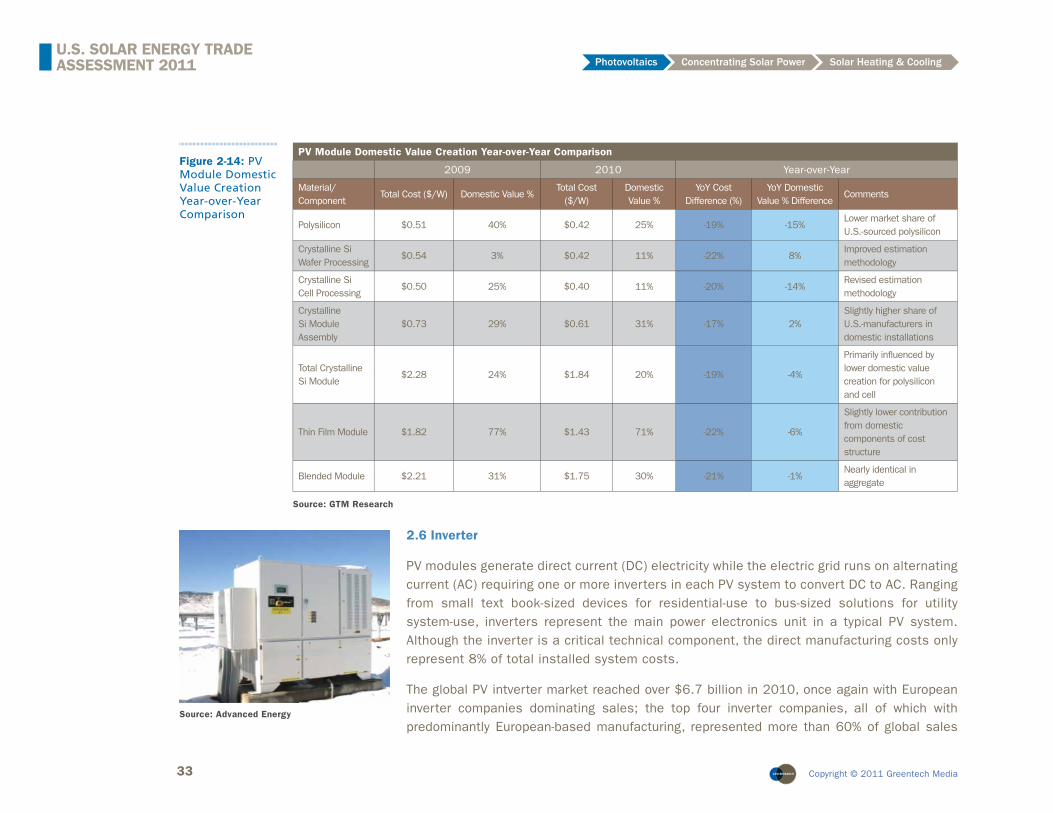
Figure 2-14 displays estimated domestic value content for U.S.-installed modules for 2009 vs. 2010. As shown, the most prominent differences lie in polysilicon, wafer processing, and cell processing. The difference in polysilicon is the result of a decrease in U.S. market share in polysilicon production, due to the proliferation of a number of Asian polysilicon manufacturers. The difference in wafers and cells are largely due to revised methodologies utilized in the 2010 analysis. In aggregate, the domestic content of installed c-Si modules dropped from 24% in 2009 to 20% in 2010, while that of thin fi lm modules dropped from 77% in 2009 to 71% in 2010. However, the greater share of thin fi lm modules in U.S. installations in 2010 results in the domestic content of the blended module being nearly equal in both years (31% in 2009 vs. 30% in 2010).
Source: GTM Research
33 Copyright © 2011 Greentech Media
U.S. SOLAR ENERGY TRADE ASSESSMENT 2011 Photovoltaics Concentrating Solar Power Solar Heating & Cooling
PV Module Domestic Value Creation Year-over-Year Comparison
2009 2010 Year-over-Year
Material/Component
Total Cost ($/W) Domestic Value % Total Cost
($/W) Domestic Value %
YoY Cost Difference (%)
YoY Domestic Value % Difference
Comments
Polysilicon $0.51 40% $0.42 25% -19% -15%Lower market share of U.S.-sourced polysilicon
Crystalline Si Wafer Processing
$0.54 3% $0.42 11% -22% 8%Improved estimation methodology
Crystalline Si Cell Processing
$0.50 25% $0.40 11% -20% -14%Revised estimation methodology
Crystalline Si Module Assembly
$0.73 29% $0.61 31% -17% 2%Slightly higher share of U.S.-manufacturers in domestic installations
Total Crystalline Si Module
$2.28 24% $1.84 20% -19% -4%
Primarily infl uenced by lower domestic value creation for polysilicon and cell
Thin Film Module $1.82 77% $1.43 71% -22% -6%
Slightly lower contribution from domestic components of cost structure
Blended Module $2.21 31% $1.75 30% -21% -1%Nearly identical in aggregate
Figure 2-14: PV Module Domestic Value Creation Year-over-Year Comparison
Source: GTM Research
2.6 Inverter
PV modules generate direct current (DC) electricity while the electric grid runs on alternating current (AC) requiring one or more inverters in each PV system to convert DC to AC. Ranging from small text book-sized devices for residential-use to bus-sized solutions for utility system-use, inverters represent the main power electronics unit in a typical PV system. Although the inverter is a critical technical component, the direct manufacturing costs only represent 8% of total installed system costs.
The global PV intverter market reached over $6.7 billion in 2010, once again with European inverter companies dominating sales; the top four inverter companies, all of which with predominantly European-based manufacturing, represented more than 60% of global sales
Source: Advanced Energy

34 Copyright © 2011 Greentech Media
U.S. SOLAR ENERGY TRADE ASSESSMENT 2011 Photovoltaics Concentrating Solar Power Solar Heating & Cooling
in 2010. The PV demand boom in Europe coupled with a lagging semiconductor component industry caused widespread inverter shortages for major European inverter manufacturers, which allowed leading U.S. inverter manufacturers to gain global market share—from just 3% in 2009 to 5% in 2010. With the predicted slowdown in the main European solar markets and the promise of the U.S. installation market, foreign inverter manufacturers have turned their attention towards U.S.-based production. Year-end capacity grew from 750 MW in 2009 to nearly 3.5 GW in 2010, with close to two-thirds of new capacity built by new U.S. inverter manufacturing entrants. Further investment by both domestic and foreign inverter manufacturers have already been made in 2011.
Figure 2-15: U.S. Market Share of Global Inverter Production, 2010
Source: GTM Research
35 Copyright © 2011 Greentech Media
U.S. SOLAR ENERGY TRADE ASSESSMENT 2011 Photovoltaics Concentrating Solar Power Solar Heating & Cooling
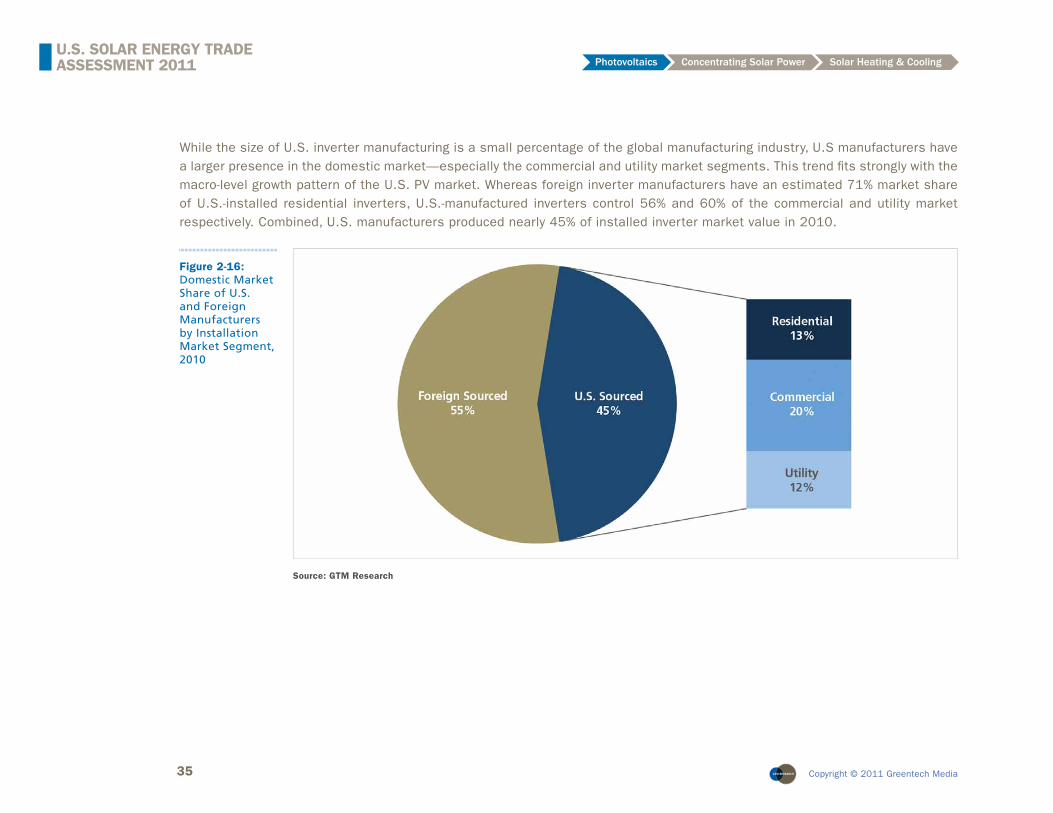
While the size of U.S. inverter manufacturing is a small percentage of the global manufacturing industry, U.S manufacturers have a larger presence in the domestic market—especially the commercial and utility market segments. This trend fi ts strongly with the macro-level growth pattern of the U.S. PV market. Whereas foreign inverter manufacturers have an estimated 71% market share of U.S.-installed residential inverters, U.S.-manufactured inverters control 56% and 60% of the commercial and utility market respectively. Combined, U.S. manufacturers produced nearly 45% of installed inverter market value in 2010.
Figure 2-16: Domestic Market Share of U.S. and Foreign Manufacturers by Installation Market Segment, 2010
Source: GTM Research
36 Copyright © 2011 Greentech Media
U.S. SOLAR ENERGY TRADE ASSESSMENT 2011 Photovoltaics Concentrating Solar Power Solar Heating & Cooling
2.7 Mounting Structure
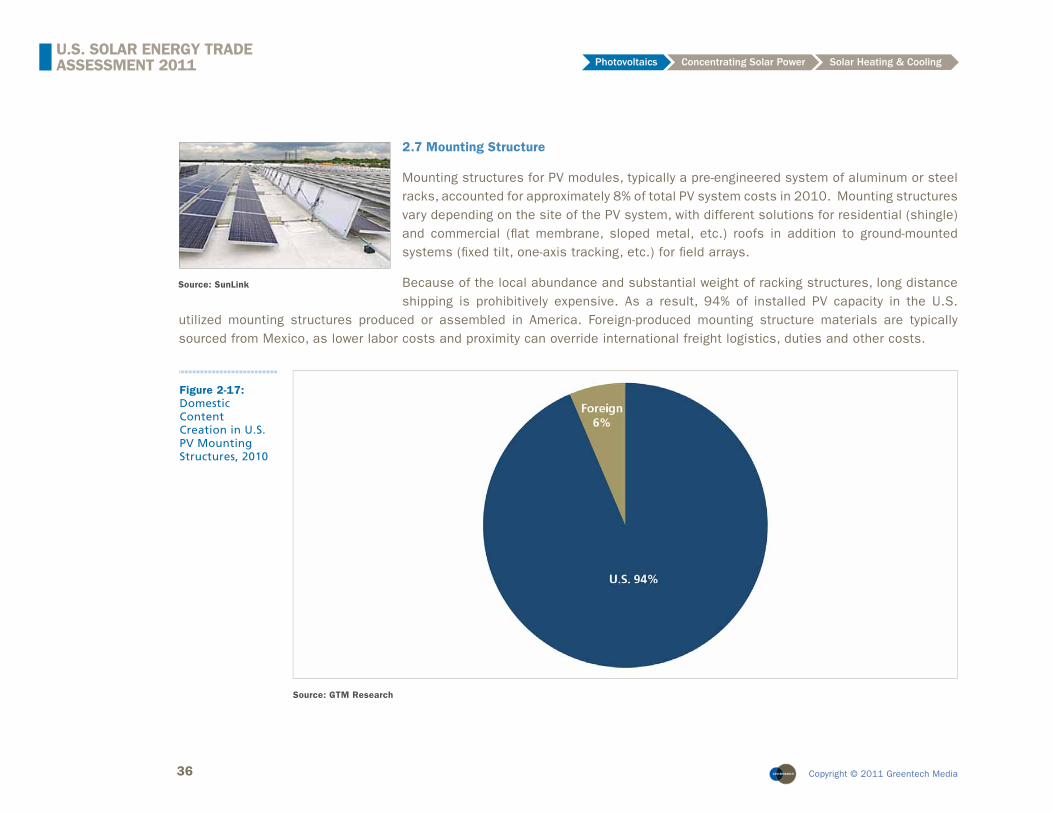
Mounting structures for PV modules, typically a pre-engineered system of aluminum or steel racks, accounted for approximately 8% of total PV system costs in 2010. Mounting structures vary depending on the site of the PV system, with different solutions for residential (shingle) and commercial (fl at membrane, sloped metal, etc.) roofs in addition to ground-mounted systems (fi xed tilt, one-axis tracking, etc.) for fi eld arrays.
Because of the local abundance and substantial weight of racking structures, long distance shipping is prohibitively expensive. As a result, 94% of installed PV capacity in the U.S.
utilized mounting structures produced or assembled in America. Foreign-produced mounting structure materials are typically sourced from Mexico, as lower labor costs and proximity can override international freight logistics, duties and other costs.
Source: SunLink
Figure 2-17: Domestic Content Creation in U.S. PV Mounting Structures, 2010
Source: GTM Research
37 Copyright © 2011 Greentech Media
U.S. SOLAR ENERGY TRADE ASSESSMENT 2011 Photovoltaics Concentrating Solar Power Solar Heating & Cooling
GTM Research estimates mounting structures to account for a blended average of 8% of total system costs, or roughly $0.46/W. This value is slightly higher than the value estimated in 2009 ($0.40/W), but note that this does not necessarily refl ect an upward trend in mounting structure costs. Certainly, the increased adoption of utility-scale tracking system had slight upward pressure on overall blended mounting structure costs. However, the estimation methodology was also adjusted from last year to include a wider network of mounting structure manufacturers and installers with more robust cost blending according to system size and market segment.
2.8 Combiner Box and Miscellaneous Electrical Equipment
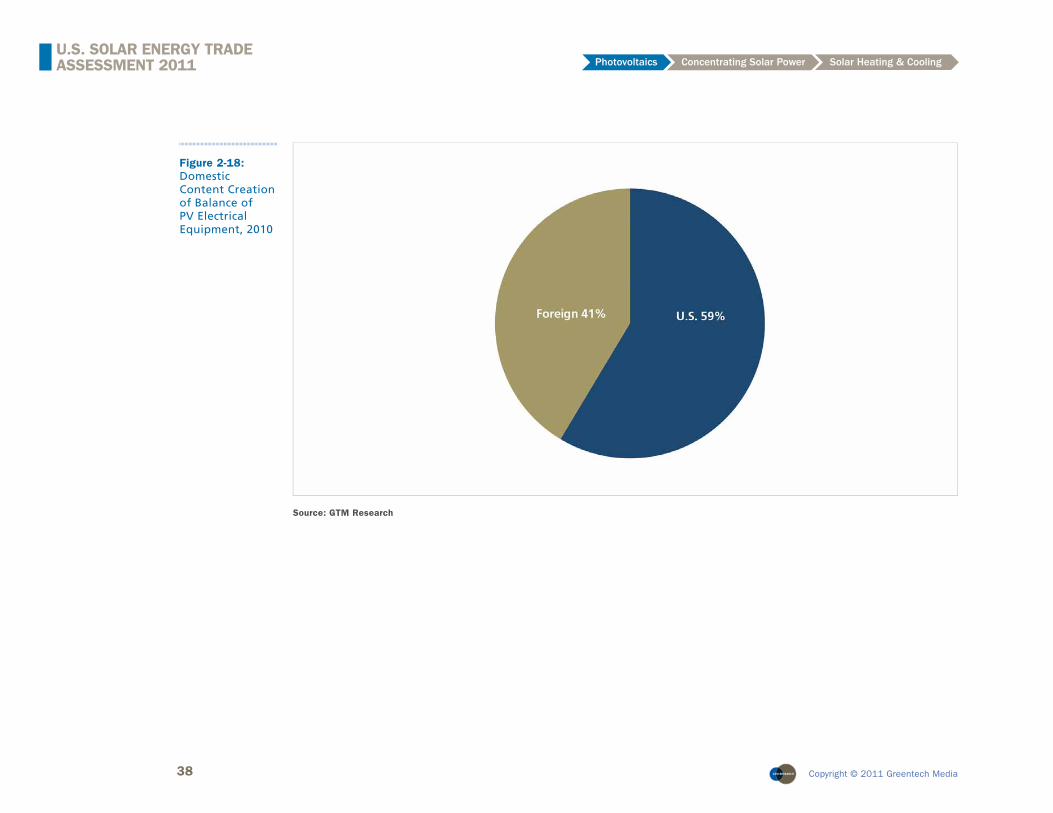
The remainder of installed materials, including combiner boxes, wires/conductors, conduit, data monitoring, and other miscellaneous hardware, are included in this category. Combiner boxes are the only solar-specifi c product included in this category and are estimated to be 69% sourced from U.S. suppliers. Other miscellaneous electrical hardware is defi ned as commodity products and the domestic value proportion is estimated based on the domestic production and international trade fl ows of the general electrical equipment industry, which includes distribution equipment, transformers, electrical motors, switchgear, relays, and controls. While not all of this equipment is applicable to solar installations, data for a solar-
specifi c subset is unavailable at this time. Thus, the domestic value content of miscellaneous balance of electrical equipment for solar PV systems is assumed to follow the trend of the general electrical equipment industry.
U.S. manufacturing of electrical equipment totaled $37.9 billion in revenues in 2010. Imports and exports of electrical equipment during this period totaled $18.3 billion and $13.4 billion respectively. It is thus estimated that the domestic share of the electrical equipment industry to be 57% (see Appendix A for methodology).
These materials are, however, produced in large volumes in the U.S. and imported equipment is typically bought through U.S. wholesalers and integrators, so there is upside potential to the combined estimate that 59% of the total value for balance of electrical equipment comes from the U.S.
Source: Amtec Solar
38 Copyright © 2011 Greentech Media
U.S. SOLAR ENERGY TRADE ASSESSMENT 2011 Photovoltaics Concentrating Solar Power Solar Heating & Cooling
Figure 2-18: Domestic Content Creation of Balance of PV Electrical Equipment, 2010
Source: GTM Research

39 Copyright © 2011 Greentech Media
U.S. SOLAR ENERGY TRADE ASSESSMENT 2011 Photovoltaics Concentrating Solar Power Solar Heating & Cooling
2.9 Site Preparation, Labor, Soft Costs and Value Chain Markup
Site preparation, labor, soft costs and value chain markup constitute the balance and majority of the costs associated with an installed PV system. Site preparation and labor are defi ned as any logistical and physical preparation, coordination and work that must be performed to install a PV system at the site. This includes civil, structural or electrical infrastructure improvements, transporting materials on-site, and mechanical and electrical installation. Labor costs vary widely from project to project depending on the existing site conditions, the mounting structure employed, the size of the installation, labor rates, permitting procedures
and local fi re and safety codes. Site preparation and labor must be done at the site of the installation, ensuring that U.S. workers capture the vast majority value of the estimated cost.
Soft costs include system design and engineering, legal fees, permitting fees, fi nancing preparation, etc., all of which is typically performed by U.S. companies or U.S. subsidiaries of foreign companies. Value chain markup includes overhead and profi t margins captured in the period between equipment manufacturing and fi nal installation. In the U.S., more than half of the modules destined for the commercial and residential market are procured from distributors or wholesalers; only companies that procure in large volume purchase directly from solar equipment manufactures. As a result, installed materials often undergo markups by both the distributor and the system installer. The combination of soft costs and value chain markup accounts for approximately 22% of total system costs.
2.10 Domestic Value Creation of PV System by Module Technology
2.10.1 Crystalline Silicon System
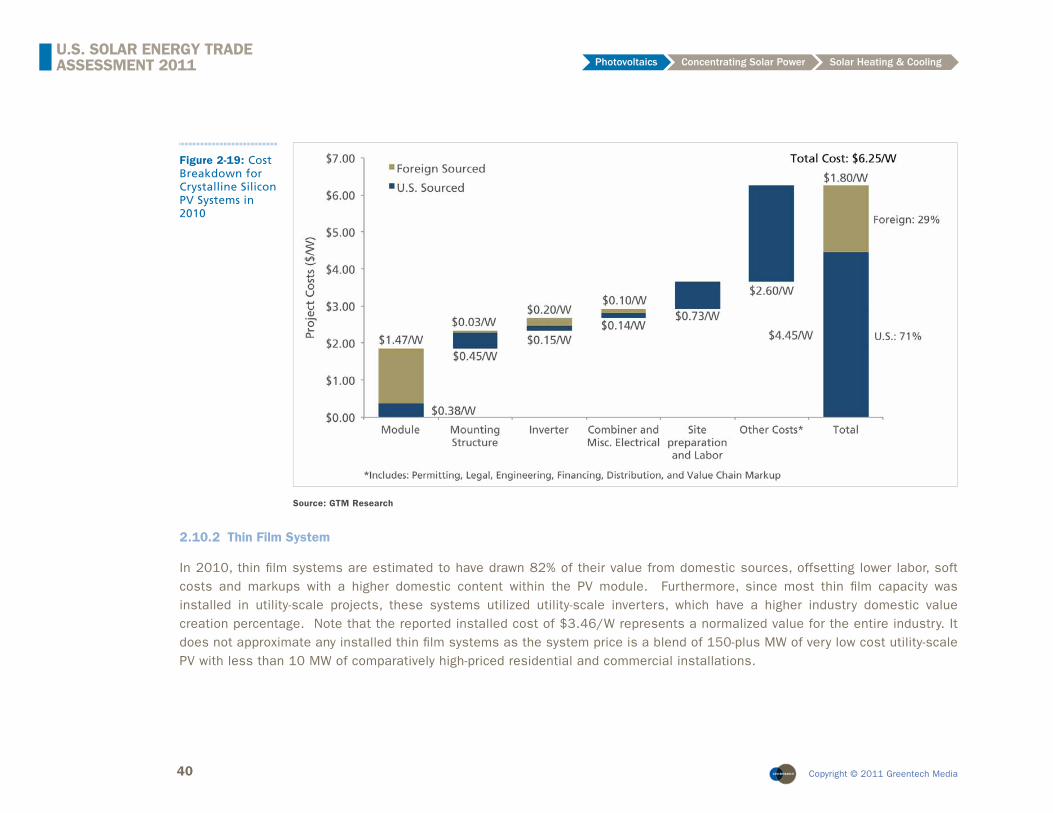
Crystalline silicon-based PV systems accounted for 78% of U.S. PV installed capacity in 2010, with a typical installation cost of $6.25/W. Module costs are adjusted to refl ect average selling prices for crystalline silicon modules; other system costs are calculated with the same methodology as described above. As explained in earlier sections, the total value of crystalline PV modules is predominantly created abroad, with only 20% of the value created from the average module sourced from the U.S. Although the PV module accounts for nearly one-third of total system costs, the bulk of installed costs remain in the U.S. primarily due to the labor and soft costs necessary to transform PV components to a working system.
Source: PV-Tech
40 Copyright © 2011 Greentech Media
U.S. SOLAR ENERGY TRADE ASSESSMENT 2011 Photovoltaics Concentrating Solar Power Solar Heating & Cooling
Figure 2-19: Cost Breakdown for Crystalline Silicon PV Systems in 2010
Source: GTM Research
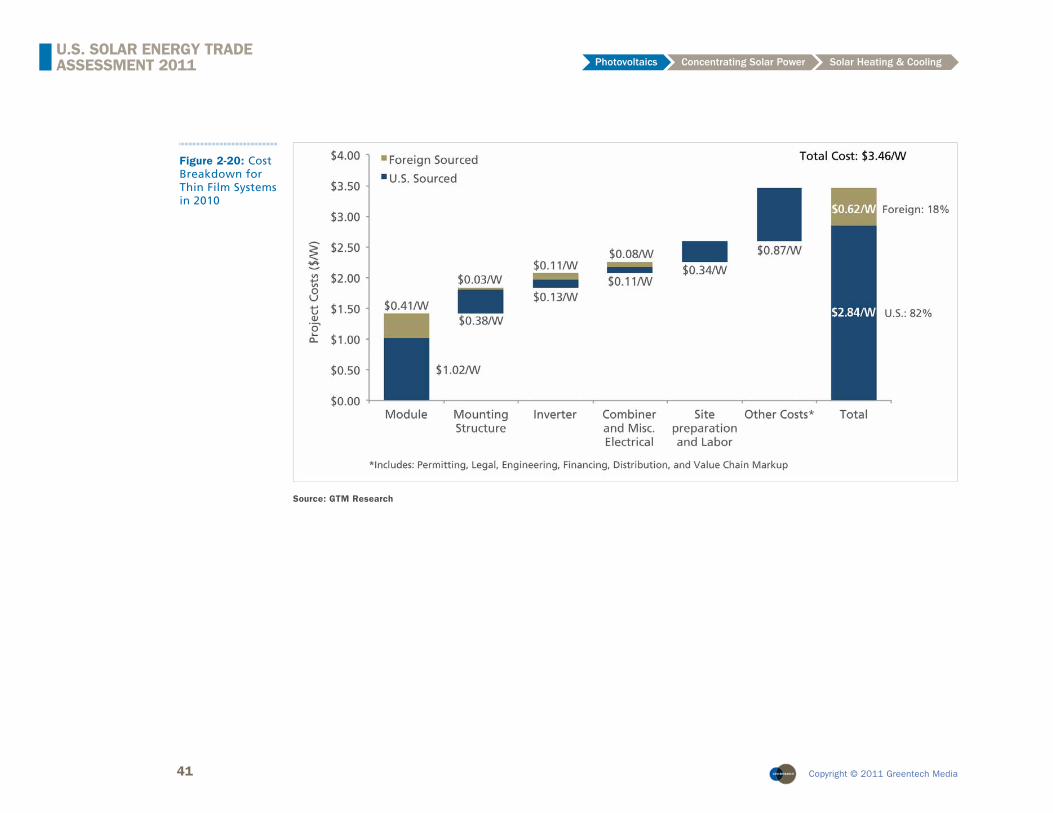
2.10.2 Thin Film System
In 2010, thin fi lm systems are estimated to have drawn 82% of their value from domestic sources, offsetting lower labor, soft costs and markups with a higher domestic content within the PV module. Furthermore, since most thin fi lm capacity was installed in utility-scale projects, these systems utilized utility-scale inverters, which have a higher industry domestic value creation percentage. Note that the reported installed cost of $3.46/W represents a normalized value for the entire industry. It does not approximate any installed thin fi lm systems as the system price is a blend of 150-plus MW of very low cost utility-scale PV with less than 10 MW of comparatively high-priced residential and commercial installations.
41 Copyright © 2011 Greentech Media
U.S. SOLAR ENERGY TRADE ASSESSMENT 2011 Photovoltaics Concentrating Solar Power Solar Heating & Cooling
Figure 2-20: Cost Breakdown for Thin Film Systems in 2010
Source: GTM Research
42 Copyright © 2011 Greentech Media
U.S. SOLAR ENERGY TRADE ASSESSMENT 2011 Photovoltaics Concentrating Solar Power Solar Heating & Cooling
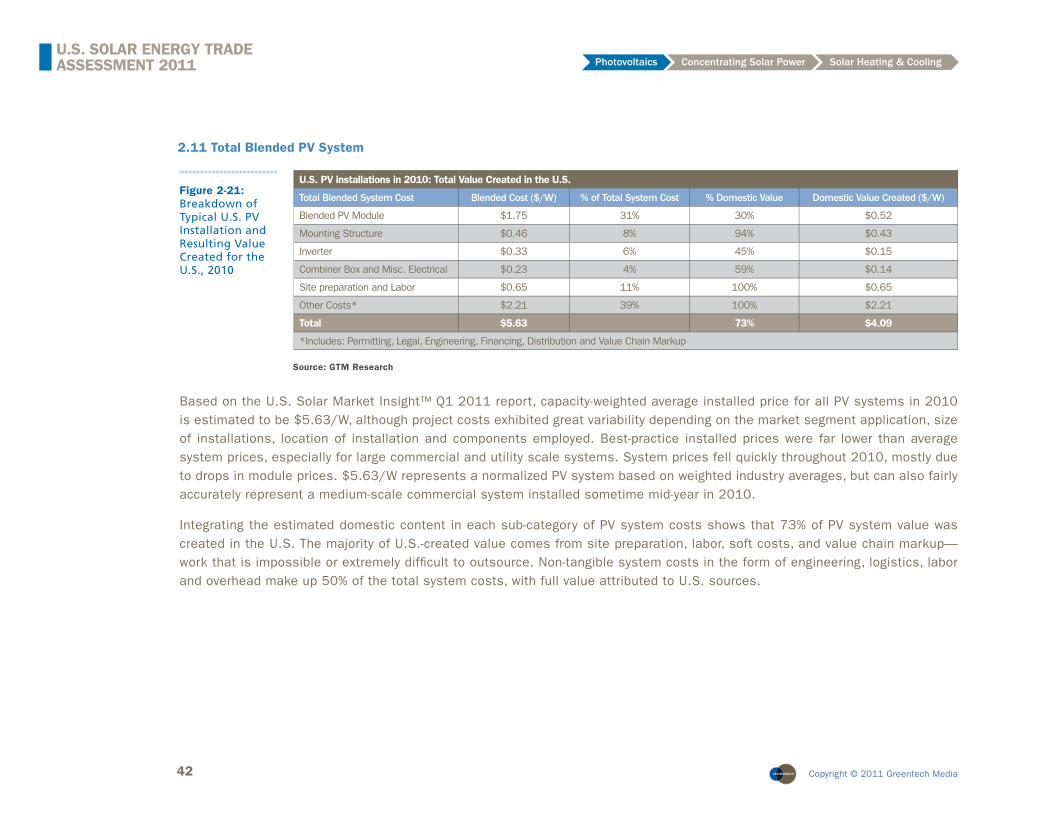
2.11 Total Blended PV System
U.S. PV installations in 2010: Total Value Created in the U.S.
Total Blended System Cost Blended Cost ($/W) % of Total System Cost % Domestic Value Domestic Value Created ($/W)
Blended PV Module $1.75 31% 30% $0.52
Mounting Structure $0.46 8% 94% $0.43
Inverter $0.33 6% 45% $0.15
Combiner Box and Misc. Electrical $0.23 4% 59% $0.14
Site preparation and Labor $0.65 11% 100% $0.65
Other Costs* $2.21 39% 100% $2.21
Total $5.63 73% $4.09
*Includes: Permitting, Legal, Engineering, Financing, Distribution and Value Chain Markup
Figure 2-21: Breakdown of Typical U.S. PV Installation and Resulting Value Created for the U.S., 2010
Source: GTM Research
Based on the U.S. Solar Market Insight™ Q1 2011 report, capacity-weighted average installed price for all PV systems in 2010 is estimated to be $5.63/W, although project costs exhibited great variability depending on the market segment application, size of installations, location of installation and components employed. Best-practice installed prices were far lower than average system prices, especially for large commercial and utility scale systems. System prices fell quickly throughout 2010, mostly due to drops in module prices. $5.63/W represents a normalized PV system based on weighted industry averages, but can also fairly accurately represent a medium-scale commercial system installed sometime mid-year in 2010.
Integrating the estimated domestic content in each sub-category of PV system costs shows that 73% of PV system value was created in the U.S. The majority of U.S.-created value comes from site preparation, labor, soft costs, and value chain markup—work that is impossible or extremely diffi cult to outsource. Non-tangible system costs in the form of engineering, logistics, labor and overhead make up 50% of the total system costs, with full value attributed to U.S. sources.
43 Copyright © 2011 Greentech Media
U.S. SOLAR ENERGY TRADE ASSESSMENT 2011 Photovoltaics Concentrating Solar Power Solar Heating & Cooling
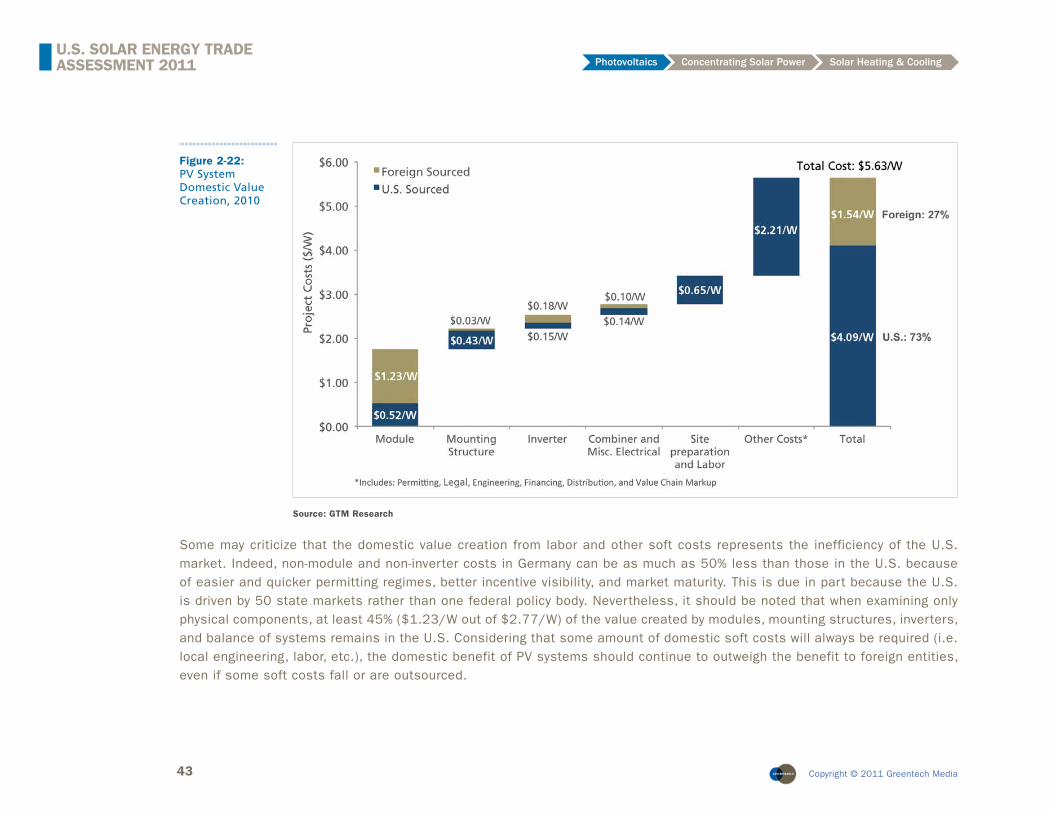
Figure 2-22: PV System Domestic Value Creation, 2010
Source: GTM Research
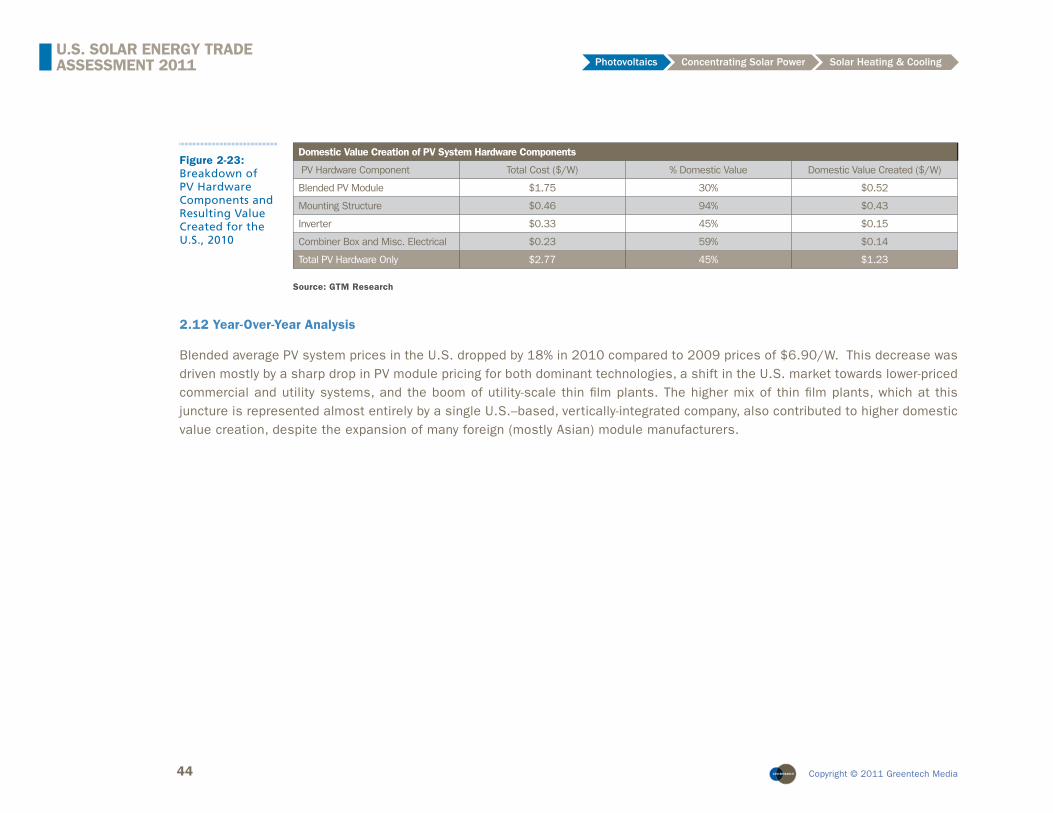
Some may criticize that the domestic value creation from labor and other soft costs represents the inefficiency of the U.S. market. Indeed, non-module and non-inverter costs in Germany can be as much as 50% less than those in the U.S. because of easier and quicker permitting regimes, better incentive visibility, and market maturity. This is due in part because the U.S. is driven by 50 state markets rather than one federal policy body. Nevertheless, it should be noted that when examining only physical components, at least 45% ($1.23/W out of $2.77/W) of the value created by modules, mounting structures, inverters, and balance of systems remains in the U.S. Considering that some amount of domestic soft costs will always be required (i.e. local engineering, labor, etc.), the domestic benefit of PV systems should continue to outweigh the benefit to foreign entities, even if some soft costs fall or are outsourced.
44 Copyright © 2011 Greentech Media
U.S. SOLAR ENERGY TRADE ASSESSMENT 2011 Photovoltaics Concentrating Solar Power Solar Heating & Cooling
Figure 2-23: Breakdown of PV Hardware Components and Resulting Value Created for the U.S., 2010
Domestic Value Creation of PV System Hardware Components
PV Hardware Component Total Cost ($/W) % Domestic Value Domestic Value Created ($/W)
Blended PV Module $1.75 30% $0.52
Mounting Structure $0.46 94% $0.43
Inverter $0.33 45% $0.15
Combiner Box and Misc. Electrical $0.23 59% $0.14
Total PV Hardware Only $2.77 45% $1.23
Source: GTM Research
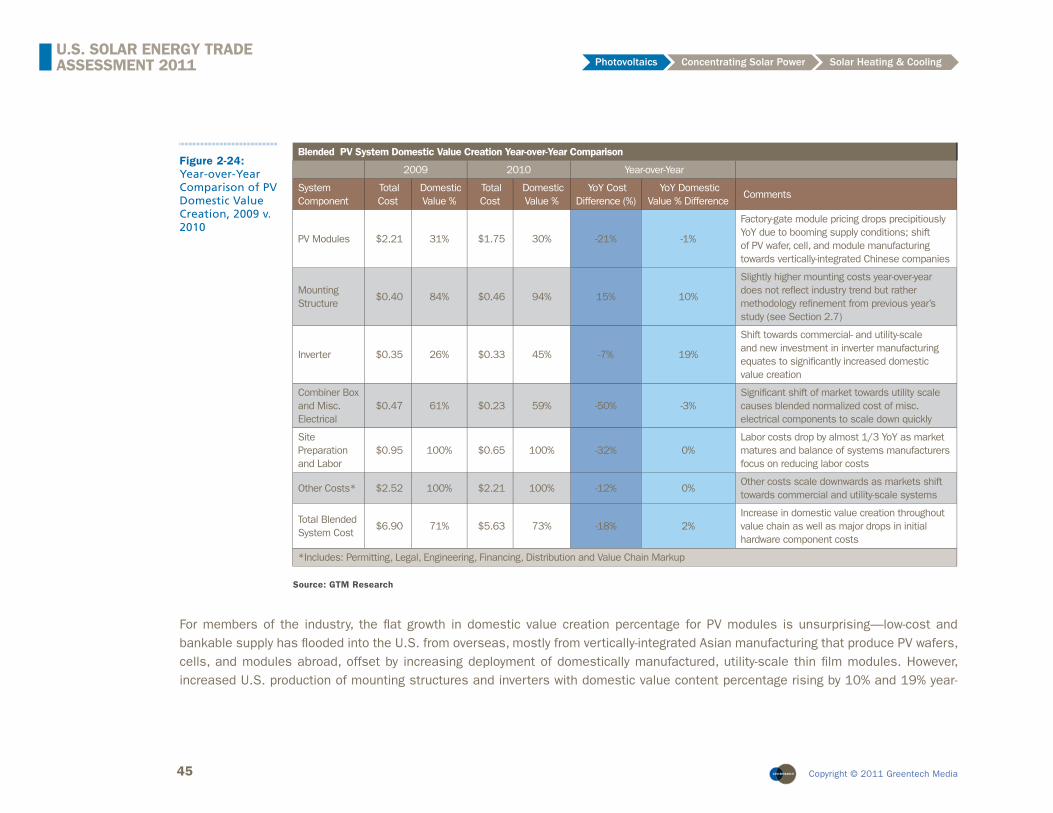
2.12 Year-Over-Year Analysis
Blended average PV system prices in the U.S. dropped by 18% in 2010 compared to 2009 prices of $6.90/W. This decrease was driven mostly by a sharp drop in PV module pricing for both dominant technologies, a shift in the U.S. market towards lower-priced commercial and utility systems, and the boom of utility-scale thin fi lm plants. The higher mix of thin fi lm plants, which at this juncture is represented almost entirely by a single U.S.–based, vertically-integrated company, also contributed to higher domestic value creation, despite the expansion of many foreign (mostly Asian) module manufacturers.
45 Copyright © 2011 Greentech Media
U.S. SOLAR ENERGY TRADE ASSESSMENT 2011 Photovoltaics Concentrating Solar Power Solar Heating & Cooling
Blended PV System Domestic Value Creation Year-over-Year Comparison
2009 2010 Year-over-Year
System Component
Total Cost
Domestic Value %
Total Cost
Domestic Value %
YoY Cost Difference (%)
YoY Domestic Value % Difference
Comments
PV Modules $2.21 31% $1.75 30% -21% -1%
Factory-gate module pricing drops precipitiously YoY due to booming supply conditions; shift of PV wafer, cell, and module manufacturing towards vertically-integrated Chinese companies
Mounting Structure
$0.40 84% $0.46 94% 15% 10%
Slightly higher mounting costs year-over-year does not refl ect industry trend but rather methodology refi nement from previous year’s study (see Section 2.7)
Inverter $0.35 26% $0.33 45% -7% 19%
Shift towards commercial- and utility-scale and new investment in inverter manufacturing equates to signifi cantly increased domestic value creation
Combiner Box and Misc. Electrical
$0.47 61% $0.23 59% -50% -3%Signifi cant shift of market towards utility scale causes blended normalized cost of misc. electrical components to scale down quickly
Site Preparation and Labor
$0.95 100% $0.65 100% -32% 0%Labor costs drop by almost 1/3 YoY as market matures and balance of systems manufacturers focus on reducing labor costs
Other Costs* $2.52 100% $2.21 100% -12% 0%Other costs scale downwards as markets shift towards commercial and utility-scale systems
Total Blended System Cost
$6.90 71% $5.63 73% -18% 2%Increase in domestic value creation throughout value chain as well as major drops in initial hardware component costs
*Includes: Permitting, Legal, Engineering, Financing, Distribution and Value Chain Markup
Figure 2-24: Year-over-Year Comparison of PV Domestic Value Creation, 2009 v. 2010
Source: GTM Research
For members of the industry, the fl at growth in domestic value creation percentage for PV modules is unsurprising—low-cost and bankable supply has fl ooded into the U.S. from overseas, mostly from vertically-integrated Asian manufacturing that produce PV wafers, cells, and modules abroad, offset by increasing deployment of domestically manufactured, utility-scale thin fi lm modules. However, increased U.S. production of mounting structures and inverters with domestic value content percentage rising by 10% and 19% year-
46 Copyright © 2011 Greentech Media
U.S. SOLAR ENERGY TRADE ASSESSMENT 2011 Photovoltaics Concentrating Solar Power Solar Heating & Cooling
over-year respectively means that total domestic value creation as a percent of total system cost actually increased from 71% to 73% for the overall PV industry. As mentioned in Section 2.7, the revised methodology for calculating the market value and domestic value creation of PV mounting structures slightly diminishes the year-over-year domestic value gains, but the overall trend remains positive.
For 2011, similar trends are expected; overall system costs should continue to fall dramatically through a combination of market segment shifts, global module oversupply and market maturity forcing down labor and other soft costs. 2011 will likely also see greater foreign value percentage in modules as once booming European markets begin to slow down and foreign module manufacturers seek greener pastures in the U.S. installation market. Some foreign crystalline silicon companies have invested in domestic manufacturing facilities and increased foreign investment in U.S. inverter manufacturing should continue to push domestic content of inverters up, creating a promising opportunity for U.S.-made PV components. In the longer term, the emergence of U.S. thin fi lm PV module manufacturing could potentially reverse the fl ow of module value overseas and bring U.S. module manufacturing back into global prominence.
2.13 Trade Flow Analysis
Separate from, but related to, the issue of domestic value created is the issue of trade fl ows. The essential question is simple: how much solar energy-related materials and components does the U.S. import vs. export, and to which countries? In keeping with the segmented nature of the PV value chain (crystalline silicon PV technology in particular), trade fl ows are assessed separately for the following aspects, before being combined in the fi nal analysis:
• Capital Equipment
• Polysilicon
• Wafers
• Cells
• Thin fi lm feedstock
• Modules (both crystalline Si and thin fi lm)
• Inverters
47 Copyright © 2011 Greentech Media
U.S. SOLAR ENERGY TRADE ASSESSMENT 2011 Photovoltaics Concentrating Solar Power Solar Heating & Cooling
2.13.1 Capital Equipment
To assess trade fl ows for PV capital equipment in 2010, the following methodology was used:
• Total U.S. sales of capital equipment for 2010 were calculated by aggregating sales across all U.S.-based capital equipment providers.
• Sales of capital equipment to U.S. PV manufacturers by U.S. and foreign equipment vendors were calculated based on geographical sales data provided by publicly traded equipment manufacturers where available. Where this data was not available, U.S. sales were estimated on a variety of factors, primarily 2010 U.S. capacity additions by technology and value chain segment.
• Exports were estimated by taking the difference of total sales of U.S.-based vendors and sales by these fi rms to U.S. PV manufacturers as estimated above.
• Imports were estimated by taking the difference of domestic equipment purchases and U.S. equipment production that was sold domestically, calculated earlier.
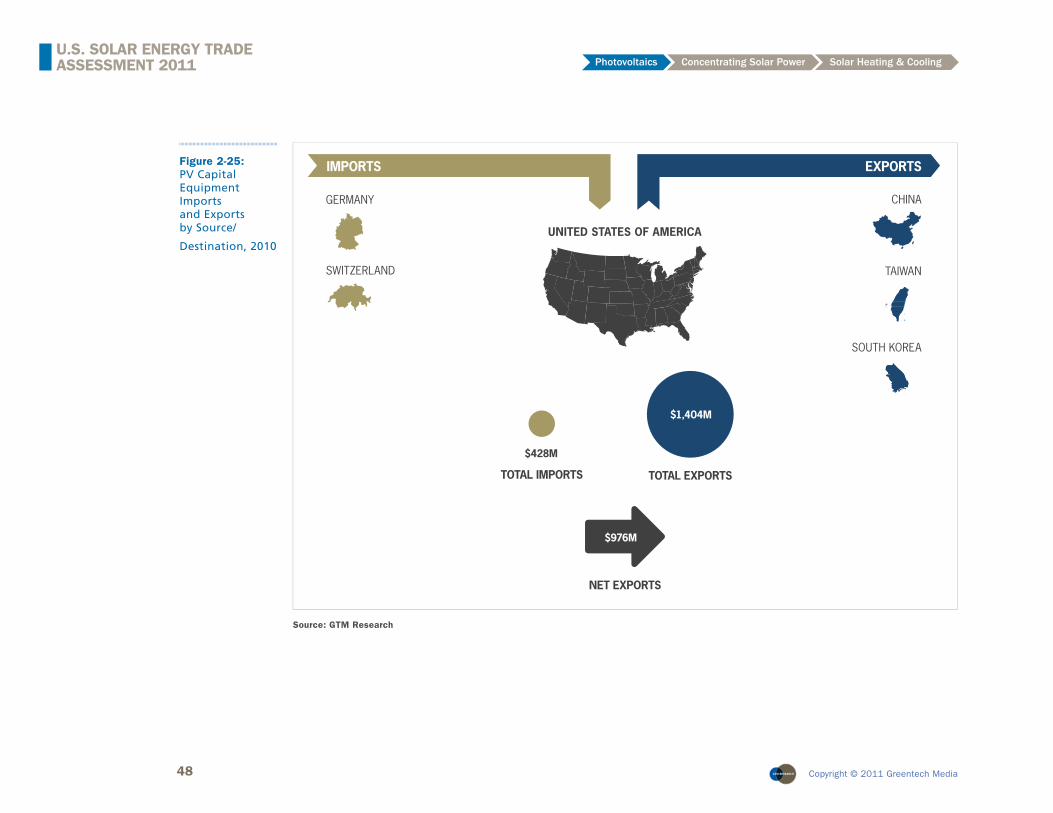
The results of this process are displayed below. As shown, the U.S. exported considerably more capital equipment ($1,404 million) than it imported in 2010 ($428 million). The U.S. leads the world in solar factory equipment manufacturing, but its relatively small PV manufacturing industry yields insuffi cient demand for this equipment, causing substantial U.S. factory equipment exports. While country-specifi c trade fl ows were unavailable due to corporate confi dentiality polices, primary export locations corresponded to global PV manufacturing bases, namely China (including Taiwan) and South Korea, while import locations included Germany and Switzerland.
48 Copyright © 2011 Greentech Media
U.S. SOLAR ENERGY TRADE ASSESSMENT 2011 Photovoltaics Concentrating Solar Power Solar Heating & Cooling
Figure 2-25: PV Capital Equipment Imports and Exports by Source/
Destination, 2010
CHINA
TAIWAN
SOUTH KOREA
IMPORTS EXPORTS
GERMANY
SWITZERLAND
UNITED STATES OF AMERICA
TOTAL EXPORTS
$1,404M
NET EXPORTS
$976M
TOTAL IMPORTS
$428M
Source: GTM Research
49 Copyright © 2011 Greentech Media
U.S. SOLAR ENERGY TRADE ASSESSMENT 2011 Photovoltaics Concentrating Solar Power Solar Heating & Cooling
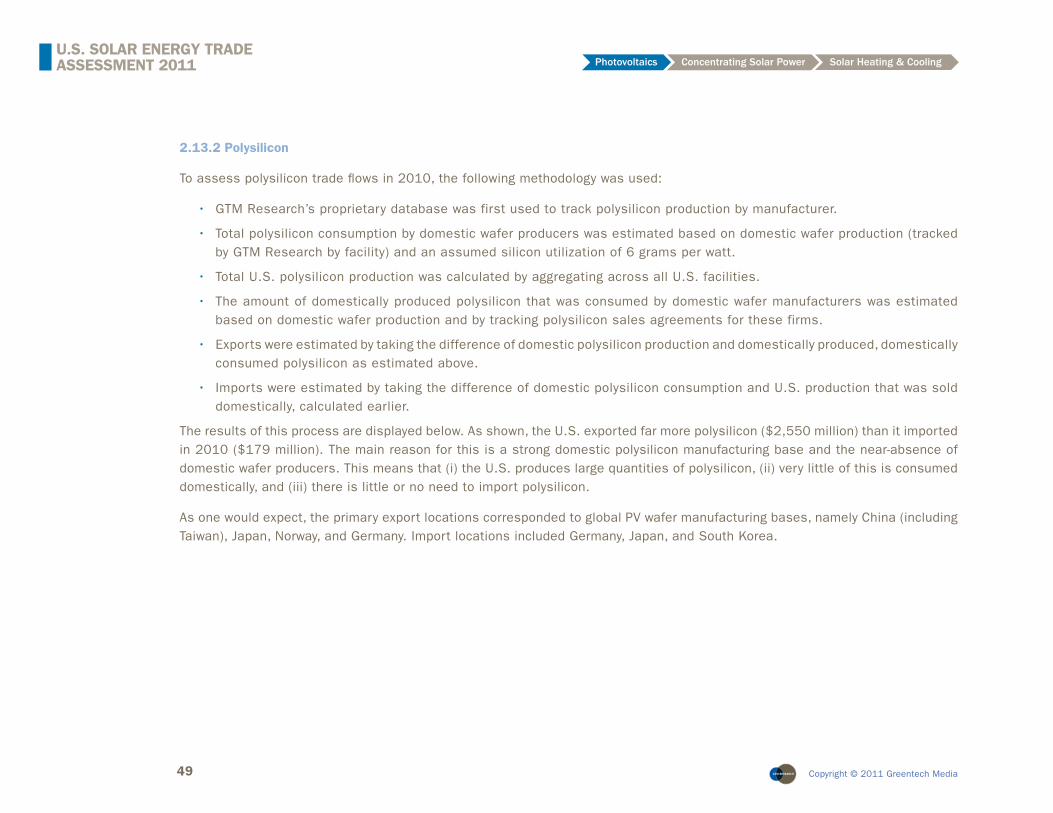
2.13.2 Polysilicon
To assess polysilicon trade fl ows in 2010, the following methodology was used:
• GTM Research’s proprietary database was first used to track polysilicon production by manufacturer.
• Total polysilicon consumption by domestic wafer producers was estimated based on domestic wafer production (tracked by GTM Research by facility) and an assumed silicon utilization of 6 grams per watt.
• Total U.S. polysilicon production was calculated by aggregating across all U.S. facilities.
• The amount of domestically produced polysilicon that was consumed by domestic wafer manufacturers was estimated based on domestic wafer production and by tracking polysilicon sales agreements for these firms.
• Exports were estimated by taking the difference of domestic polysilicon production and domestically produced, domestically consumed polysilicon as estimated above.
• Imports were estimated by taking the difference of domestic polysilicon consumption and U.S. production that was sold domestically, calculated earlier.
The results of this process are displayed below. As shown, the U.S. exported far more polysilicon ($2,550 million) than it imported in 2010 ($179 million). The main reason for this is a strong domestic polysilicon manufacturing base and the near-absence of domestic wafer producers. This means that (i) the U.S. produces large quantities of polysilicon, (ii) very little of this is consumed domestically, and (iii) there is little or no need to import polysilicon.
As one would expect, the primary export locations corresponded to global PV wafer manufacturing bases, namely China (including Taiwan), Japan, Norway, and Germany. Import locations included Germany, Japan, and South Korea.
50 Copyright © 2011 Greentech Media
U.S. SOLAR ENERGY TRADE ASSESSMENT 2011 Photovoltaics Concentrating Solar Power Solar Heating & Cooling
Figure 2-26: PV Polysilicon Imports and Exports by Source/Destination, 2010
TOTAL IMPORTS
GERMANY
JAPAN
KOREA
ITALY
ALL OTHER
IMPORTS
$96M
$27M
$20M
$12M
$24M
TOTAL EXPORTS
EXPORTS
CHINA
JAPAN
NORWAY
GERMANY
ALL OTHER
$609M
$258M
$245M
$565M
NET EXPORTS
UNITED STATES OF AMERICA
$179M
$873M
$2,550M
$2,371M
Source: GTM Research
51 Copyright © 2011 Greentech Media
U.S. SOLAR ENERGY TRADE ASSESSMENT 2011 Photovoltaics Concentrating Solar Power Solar Heating & Cooling
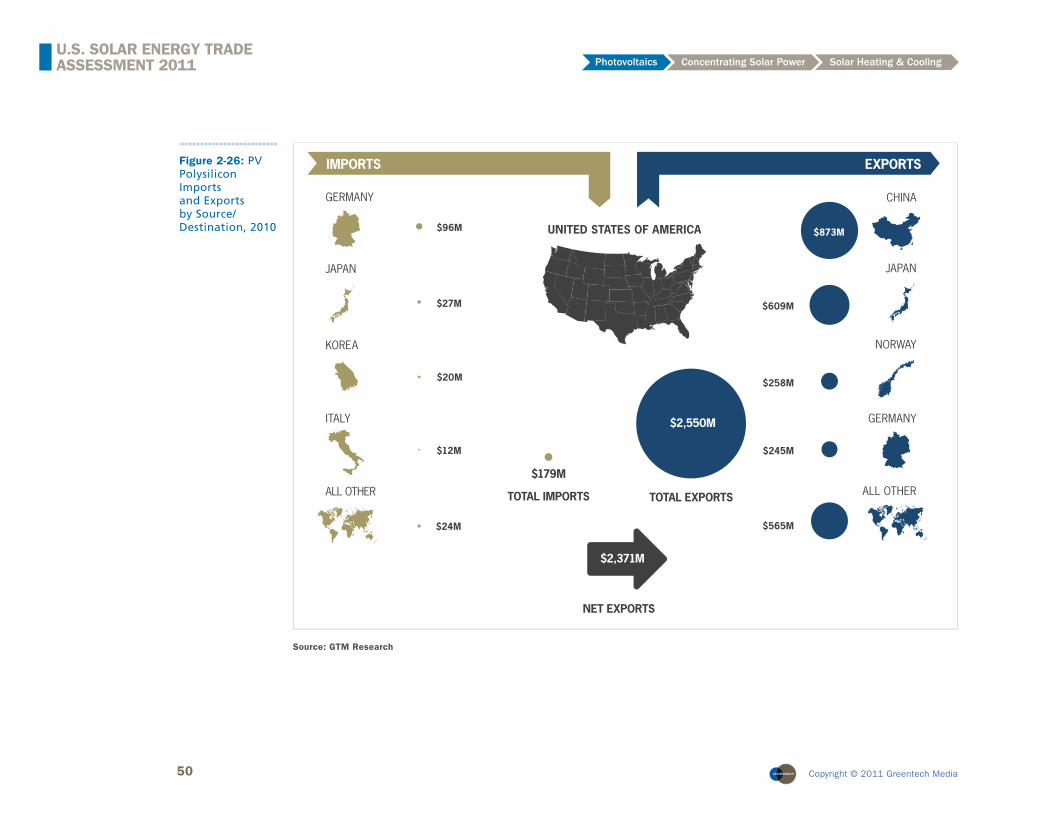
2.13.3 Thin Film Feedstock
Thin fi lm feedstock includes cadmium and tellurium for CdTe-based modules; copper, indium, gallium, and selenium for CIGS-based modules; and silane for thin fi lm silicon-based modules. Trade fl ows for thin fi lm feedstock were estimated based on domestic thin fi lm module production and U.S. International Trade Commission data on metal imports and exports. Overall, exports totaled less than $1 million, while imports amounted to $56.3 million, yielding a net import fi gure of around $56 million. Although exact country-specifi c breakdowns were unavailable, primary import locations included China and Canada.
TOTAL IMPORTS
CHINA
CANADA
IMPORTS
TOTAL EXPORTS
EXPORTS
CANADA
NET IMPORTS
UNITED STATES OF AMERICA
$56.4M
$55.4 MILLION
$1.0 MILLION
Figure 2-27: PV Thin Film Feedstock Imports and Exports by Source/Destination, 2010
Source: GTM Research
52 Copyright © 2011 Greentech Media
U.S. SOLAR ENERGY TRADE ASSESSMENT 2011 Photovoltaics Concentrating Solar Power Solar Heating & Cooling
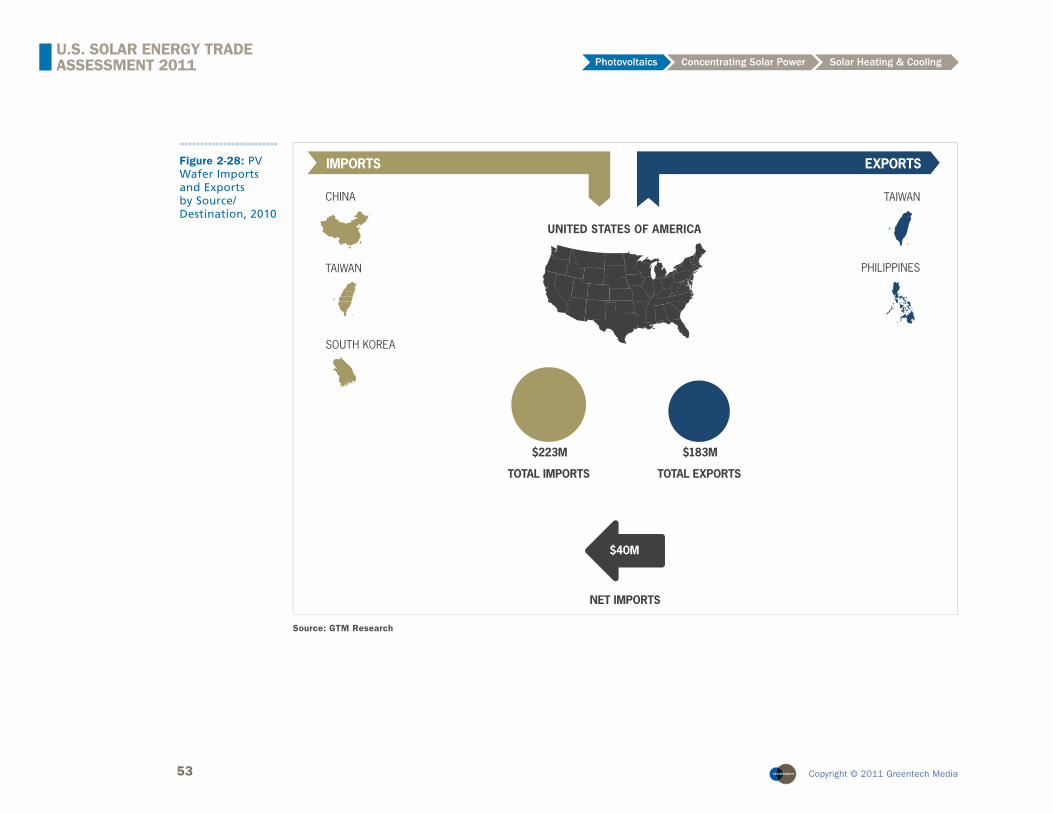
2.13.4 Wafer
To assess PV wafer trade fl ows in 2010, the following methodology was used:
• GTM Research’s proprietary database was first used to track wafer and c-Si cell production by manufacturer and estimate total U.S. wafer and c-Si cell production.
• Total U.S. wafer consumption was estimated based on U.S. c-Si cell production, assuming a yield of 95%.
• The amount of U.S. wafer production sold domestically was then estimated based on available data and interviews with wafer vendors.
• Exports were estimated by taking the difference of U.S. wafer production and U.S. wafer production that was sold domestically.
• Imports were estimated by taking the difference of U.S. wafer consumption and U.S. wafer production that was sold domestically, calculated earlier.
As shown below, the U.S. was a slight net importer of PV wafers ($40.4 million) in 2010. Since it is not a major wafer or crystalline silicon cell manufacturing center, neither exports ($183.0 million) nor imports ($223.4 million) are large in magnitude. While quantitative data for country-specific imports and exports was not available for wafers, major importers to the U.S. are China and Taiwan according to analysis of major sales contracts and data on global wafer and cell production. Major wafer exports were shipped to Taiwan and the Philippines.
53 Copyright © 2011 Greentech Media
U.S. SOLAR ENERGY TRADE ASSESSMENT 2011 Photovoltaics Concentrating Solar Power Solar Heating & Cooling
Figure 2-28: PV Wafer Imports and Exports by Source/Destination, 2010
TOTAL IMPORTS
CHINA
TAIWAN
SOUTH KOREA
IMPORTS
TOTAL EXPORTS
EXPORTS
TAIWAN
PHILIPPINES
NET IMPORTS
UNITED STATES OF AMERICA
$223M $183M
$40M
Source: GTM Research
54 Copyright © 2011 Greentech Media
U.S. SOLAR ENERGY TRADE ASSESSMENT 2011 Photovoltaics Concentrating Solar Power Solar Heating & Cooling
2.13.5 Cell
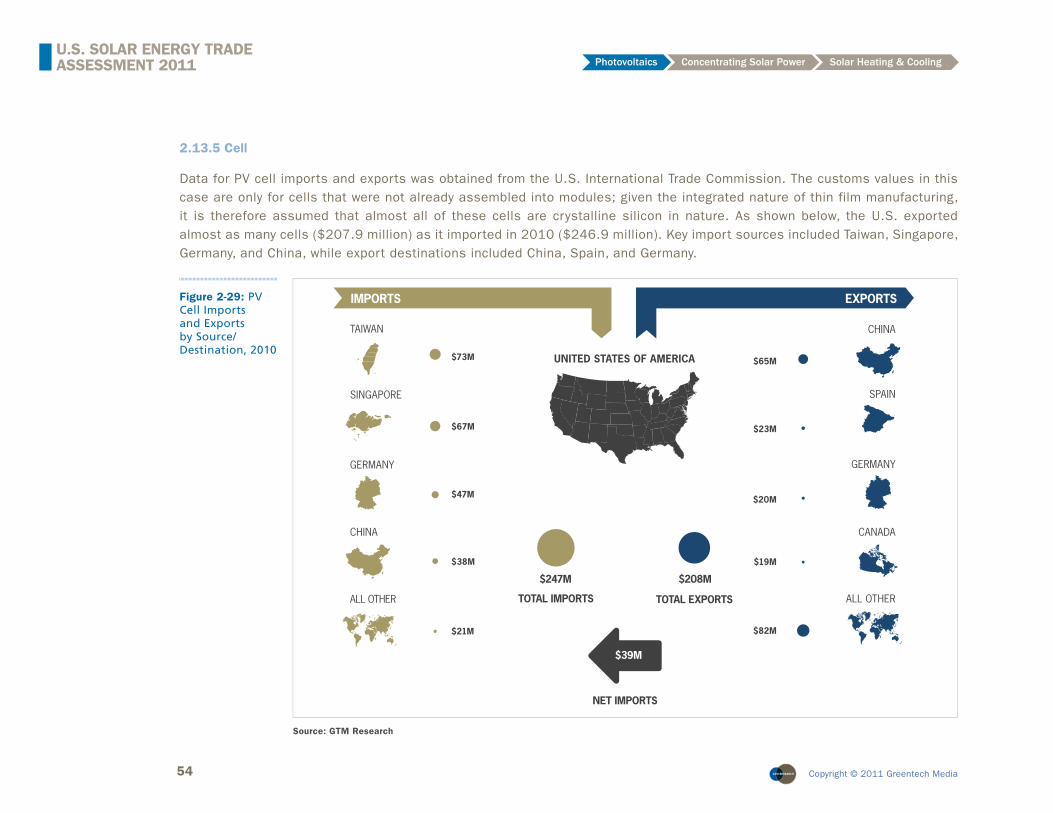
Data for PV cell imports and exports was obtained from the U.S. International Trade Commission. The customs values in this case are only for cells that were not already assembled into modules; given the integrated nature of thin film manufacturing, it is therefore assumed that almost all of these cells are crystalline silicon in nature. As shown below, the U.S. exported almost as many cells ($207.9 million) as it imported in 2010 ($246.9 million). Key import sources included Taiwan, Singapore, Germany, and China, while export destinations included China, Spain, and Germany.
TOTAL IMPORTS
TAIWAN
SINGAPORE
GERMANY
CHINA
ALL OTHER
IMPORTS
$73M
$67M
$47M
$38M
$21M
TOTAL EXPORTS
EXPORTS
CHINA
SPAIN
GERMANY
CANADA
ALL OTHER
$23M
$20M
$19M
$82M
NET IMPORTS
UNITED STATES OF AMERICA
$247M
$65M
$208M
$39M
Figure 2-29: PV Cell Imports and Exports by Source/Destination, 2010
Source: GTM Research
55 Copyright © 2011 Greentech Media
U.S. SOLAR ENERGY TRADE ASSESSMENT 2011 Photovoltaics Concentrating Solar Power Solar Heating & Cooling
2.13.6 Module
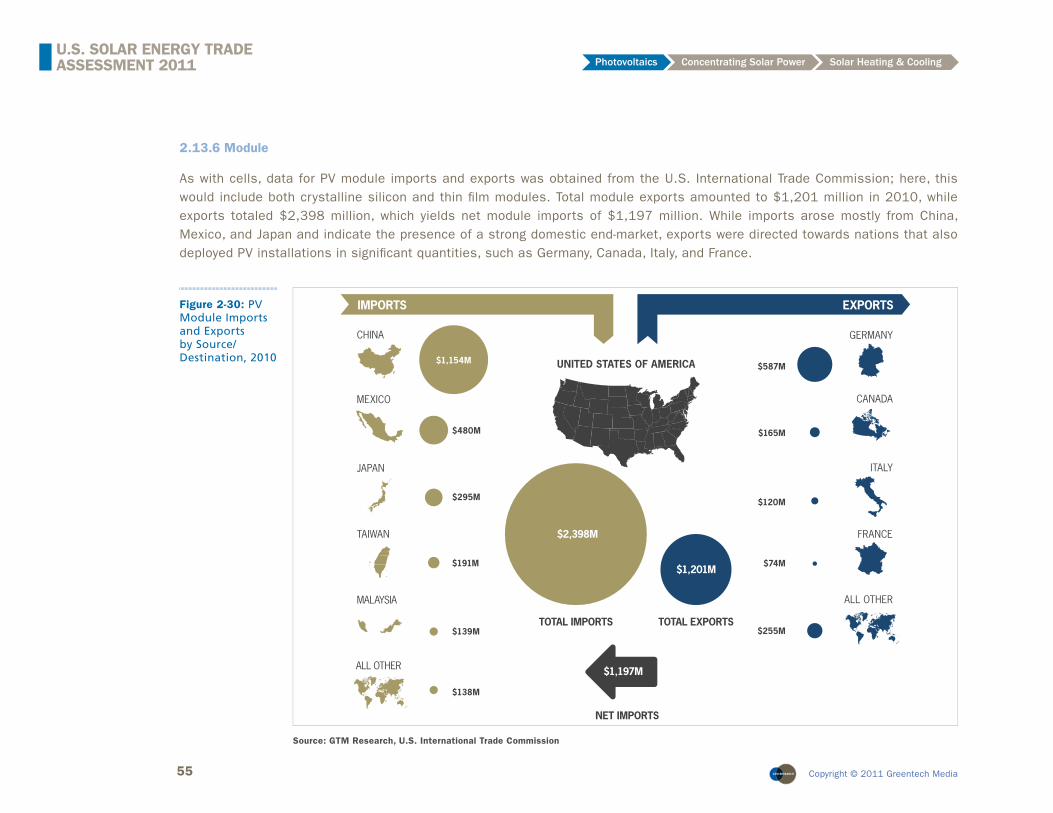
As with cells, data for PV module imports and exports was obtained from the U.S. International Trade Commission; here, this would include both crystalline silicon and thin fi lm modules. Total module exports amounted to $1,201 million in 2010, while exports totaled $2,398 million, which yields net module imports of $1,197 million. While imports arose mostly from China, Mexico, and Japan and indicate the presence of a strong domestic end-market, exports were directed towards nations that also deployed PV installations in signifi cant quantities, such as Germany, Canada, Italy, and France.
CHINA
MEXICO
JAPAN
TAIWAN
MALAYSIA
IMPORTS
$480M
$295M
$191M
$139M
EXPORTS
GERMANY
CANADA
ITALY
FRANCE
ALL OTHER
$165M
$120M
$74M
$255M
NET IMPORTS
UNITED STATES OF AMERICA $587M
ALL OTHER
$1,154M
$138M
TOTAL EXPORTS
$1,201M
TOTAL IMPORTS
$2,398M
$1,197M
Figure 2-30: PV Module Imports and Exports by Source/Destination, 2010
Source: GTM Research, U.S. International Trade Commission
56 Copyright © 2011 Greentech Media
U.S. SOLAR ENERGY TRADE ASSESSMENT 2011 Photovoltaics Concentrating Solar Power Solar Heating & Cooling
2.13.7 Inverter
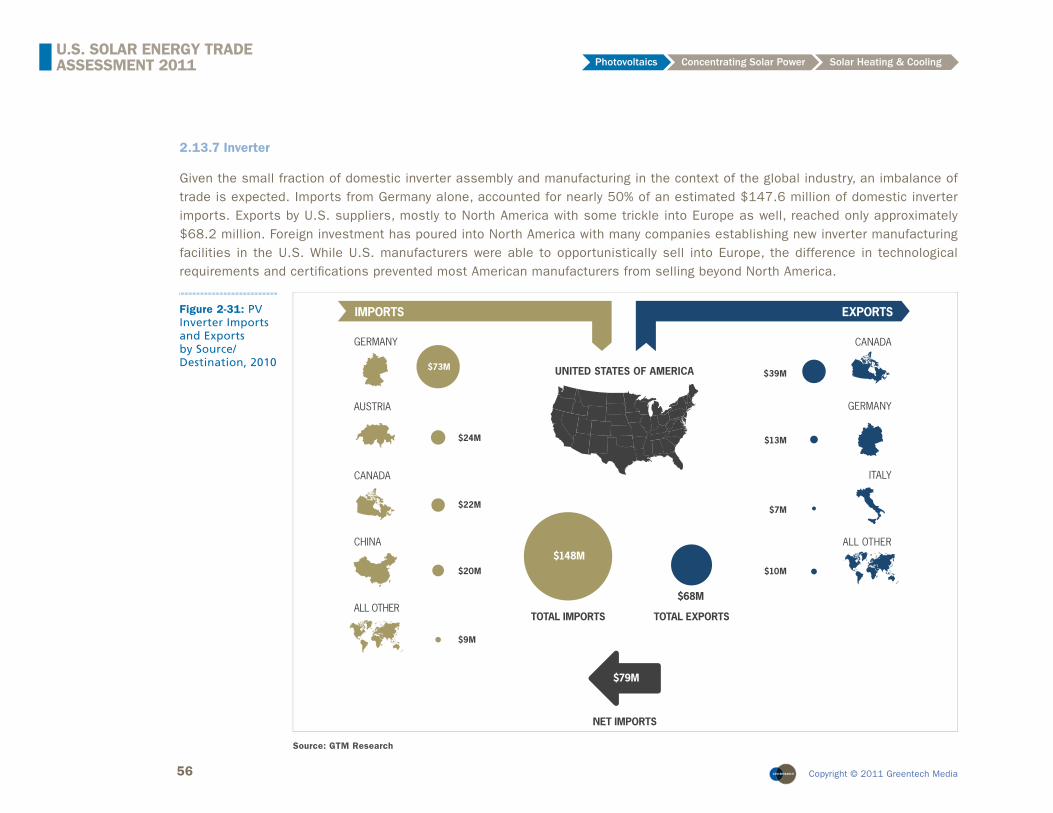
Given the small fraction of domestic inverter assembly and manufacturing in the context of the global industry, an imbalance of trade is expected. Imports from Germany alone, accounted for nearly 50% of an estimated $147.6 million of domestic inverter imports. Exports by U.S. suppliers, mostly to North America with some trickle into Europe as well, reached only approximately $68.2 million. Foreign investment has poured into North America with many companies establishing new inverter manufacturing facilities in the U.S. While U.S. manufacturers were able to opportunistically sell into Europe, the difference in technological requirements and certifi cations prevented most American manufacturers from selling beyond North America.
TOTAL IMPORTS
GERMANY
AUSTRIA
CANADA
CHINA
ALL OTHER
IMPORTS
$24M
$22M
$20M
$9M
TOTAL EXPORTS
EXPORTS
CANADA
GERMANY
ITALY
ALL OTHER
$13M
$7M
$10M
NET IMPORTS
UNITED STATES OF AMERICA $39M$73M
$68M
$148M
$79M
Figure 2-31: PV Inverter Imports and Exports by Source/Destination, 2010
Source: GTM Research

57 Copyright © 2011 Greentech Media
U.S. SOLAR ENERGY TRADE ASSESSMENT 2011 Photovoltaics Concentrating Solar Power Solar Heating & Cooling
2.13.8 Total PV Trade Flows
By summing trade fl ows for the individual components assessed, one arrives at total PV import and export volumes, which puts 2010 PV exports at $5,613 million. This compares to imports of $3,679 million, which yields net PV exports of $1,934 million. As shown, the primary export goods for PV in 2010 were capital equipment, polysilicon, and modules, while modules were by far the main components imported. In terms of net exports, polysilicon and capital equipment had the highest surplus for 2010, while modules had the highest trade defi cit.
Figure 2-32: U.S. PV Trade Flows by Value Chain Segment, 2010
Source: GTM Research

58 Copyright © 2011 Greentech Media
U.S. SOLAR ENERGY TRADE ASSESSMENT 2011 Photovoltaics Concentrating Solar Power Solar Heating & Cooling
Figure 2-33: U.S. PV Net Exports by Value Chain Segment, 2010
Source: GTM Research
China was the number one source and destination of PV products, driven mainly by exports of polysilicon and capital equipment, whereas PV modules served as the primary imports. The U.S.-China trade balance for PV-specific products is estimated to range from $250 million to $550 million, indicating that the U.S. is a net exporter of PV products to China. Mexico was the second highest source of imports, with three PV module facilities as the origin of much of these imports. Similarly, Germany was the number two destination for U.S. exports, as PV module manufacturers were able to sell into a booming 2010 German PV market. Unsurprisingly, countries with robust PV end markets (aside from China) serve as top destinations for exports and well developed PV manufacturing regions were the primary sources for imports.

59 Copyright © 2011 Greentech Media
U.S. SOLAR ENERGY TRADE ASSESSMENT 2011 Photovoltaics Concentrating Solar Power Solar Heating & Cooling
Figure 2-34: U.S. PV Trade Flows by Country, 2010
Source: GTM Research
TOTAL IMPORTS
CHINA
MEXICO
JAPAN
TAIWAN
GERMANY
IMPORTS
TOTAL EXPORTS
EXPORTS
NET EXPORTS
UNITED STATES OF AMERICA
$5,614M
$3,679M
AUSTRIA
CANADA
KOREA
ITALY
ALL OTHER
UNDISCLOSED*
CHINA
*Non-China Capital Equipment, Thin Film Feedstock, and PV Wafers; estimates provided as a range due to corporate confidentiality policies.
$1,431M
$480M
$322M
$264M
$215M
$24M
$22M
$20M
$12M
$194M
$695M
JAPAN$609M
NORWAY$258M
GERMANY$865M
SPAIN$23M
CANADA$223M
ITALY$126M
FRANCE$74M
ALL OTHER$912M
UNDISCLOSED*
$1,934M
HIGH- $1,963MLOW- $1,671M
HIGH- $853MLOW- $561M
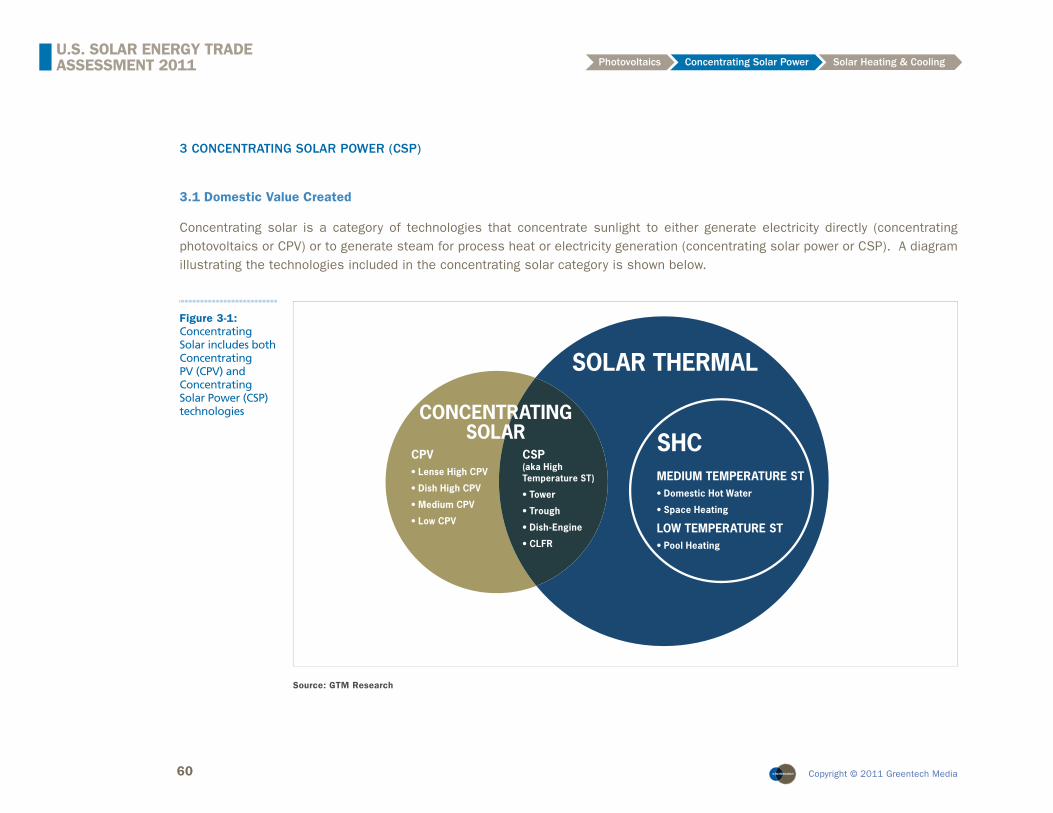
60 Copyright © 2011 Greentech Media
U.S. SOLAR ENERGY TRADE ASSESSMENT 2011 Photovoltaics Concentrating Solar Power Solar Heating & Cooling
3 CONCENTRATING SOLAR POWER (CSP)
3.1 Domestic Value Created
Concentrating solar is a category of technologies that concentrate sunlight to either generate electricity directly (concentrating photovoltaics or CPV) or to generate steam for process heat or electricity generation (concentrating solar power or CSP). A diagram illustrating the technologies included in the concentrating solar category is shown below.
CONCENTRATINGSOLAR
SOLAR THERMAL
SHCCPV
Lense High CPV
CSP (aka High
Figure 3-1: Concentrating Solar includes both Concentrating PV (CPV) and Concentrating Solar Power (CSP) technologies
Source: GTM Research
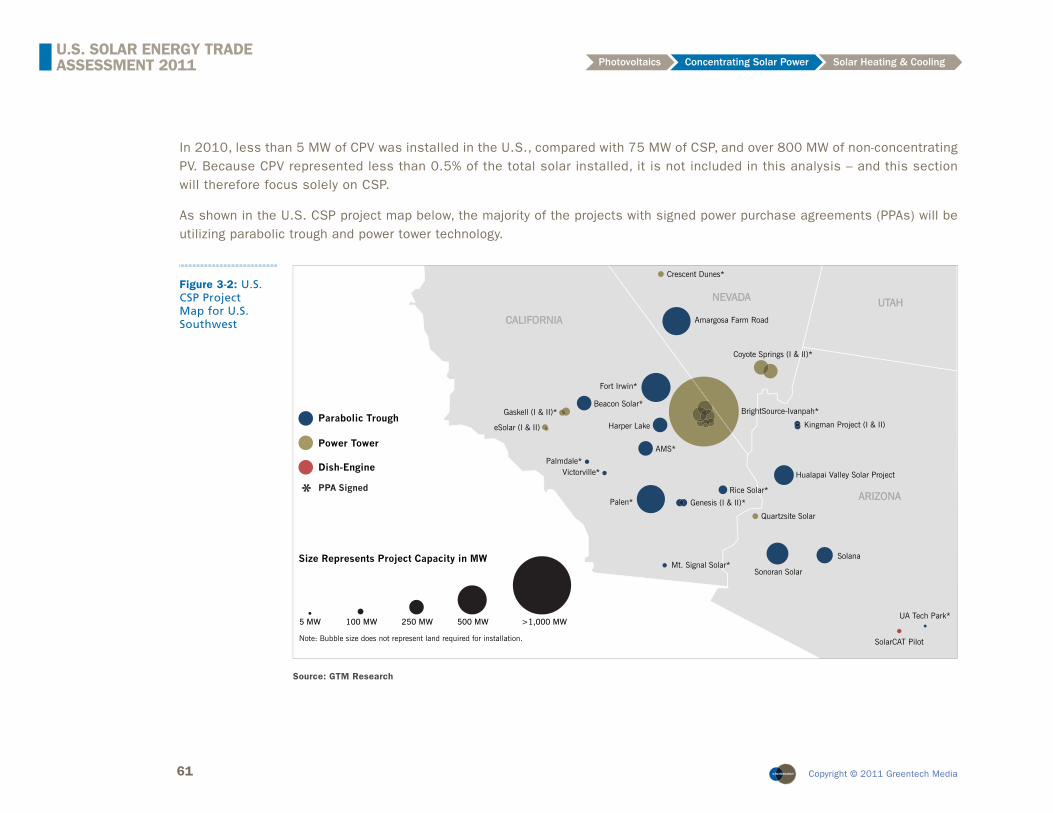
61 Copyright © 2011 Greentech Media
U.S. SOLAR ENERGY TRADE ASSESSMENT 2011 Photovoltaics Concentrating Solar Power Solar Heating & Cooling
In 2010, less than 5 MW of CPV was installed in the U.S., compared with 75 MW of CSP, and over 800 MW of non-concentrating PV. Because CPV represented less than 0.5% of the total solar installed, it is not included in this analysis – and this section will therefore focus solely on CSP.
As shown in the U.S. CSP project map below, the majority of the projects with signed power purchase agreements (PPAs) will be utilizing parabolic trough and power tower technology.
CALIFORNIA
NEVADA UTAH
ARIZONA
Parabolic Trough
Power Tower
Dish-Engine
Kingman Project (I & II)
Hualapai Valley Solar Project
Amargosa Farm Road
Crescent Dunes*
BrightSource-Ivanpah*
Coyote Springs (I & II)*
Solana
Sonoran Solar
Quartzsite Solar
Rice Solar*
Mt. Signal Solar*
Victorville* Palmdale*
Gaskell (I & II)*
eSolar (I & II)
Beacon Solar*
Fort Irwin*
AMS*
Palen* Genesis (I & II)*
UA Tech Park*
SolarCAT Pilot
Harper Lake
Size Represents Project Capacity in MW
100 MW 250 MW 500 MW >1,000 MW 5 MW
PPA Signed *
Note: Bubble size does not represent land required for installation.
Figure 3-2: U.S. CSP Project Map for U.S. Southwest
Source: GTM Research
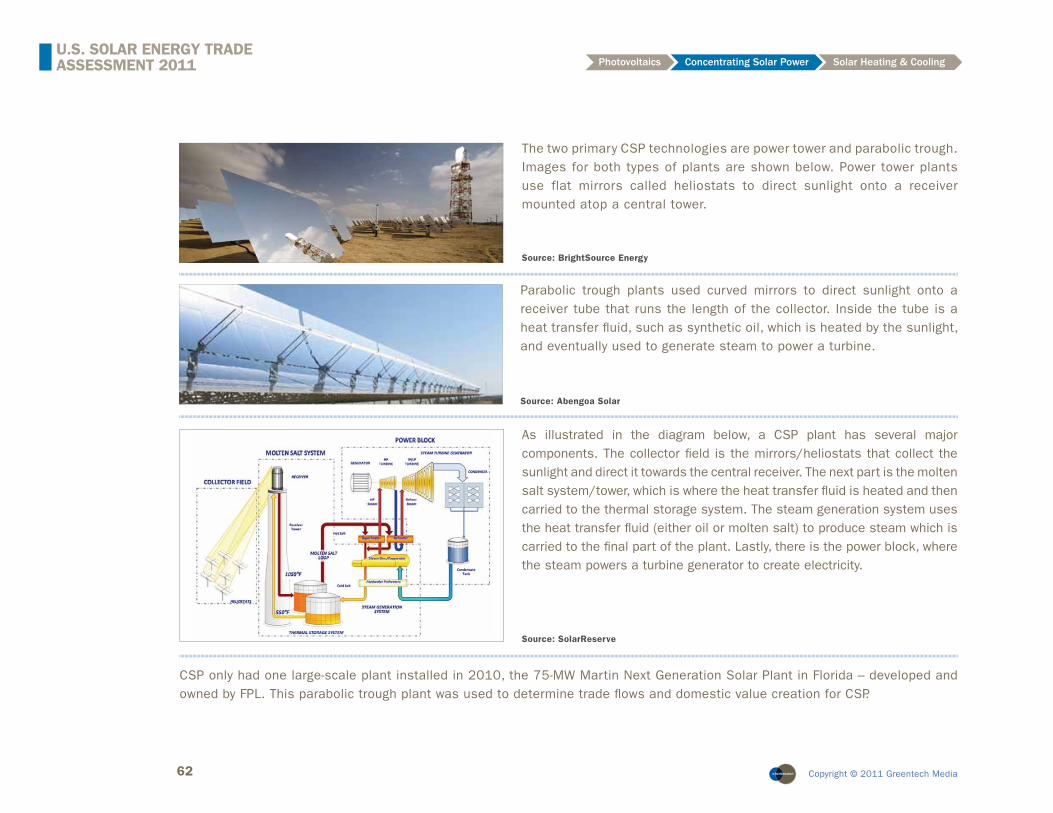
62 Copyright © 2011 Greentech Media
U.S. SOLAR ENERGY TRADE ASSESSMENT 2011 Photovoltaics Concentrating Solar Power Solar Heating & Cooling
The two primary CSP technologies are power tower and parabolic trough. Images for both types of plants are shown below. Power tower plants use flat mirrors called heliostats to direct sunlight onto a receiver mounted atop a central tower.
Parabolic trough plants used curved mirrors to direct sunlight onto a receiver tube that runs the length of the collector. Inside the tube is a heat transfer fl uid, such as synthetic oil, which is heated by the sunlight, and eventually used to generate steam to power a turbine.
Source: BrightSource Energy
As illustrated in the diagram below, a CSP plant has several major components. The collector fi eld is the mirrors/heliostats that collect the sunlight and direct it towards the central receiver. The next part is the molten salt system/tower, which is where the heat transfer fl uid is heated and then carried to the thermal storage system. The steam generation system uses the heat transfer fl uid (either oil or molten salt) to produce steam which is carried to the fi nal part of the plant. Lastly, there is the power block, where the steam powers a turbine generator to create electricity.
Source: Abengoa Solar
Source: SolarReserve
CSP only had one large-scale plant installed in 2010, the 75-MW Martin Next Generation Solar Plant in Florida – developed and owned by FPL. This parabolic trough plant was used to determine trade fl ows and domestic value creation for CSP.

63 Copyright © 2011 Greentech Media
U.S. SOLAR ENERGY TRADE ASSESSMENT 2011 Photovoltaics Concentrating Solar Power Solar Heating & Cooling
U.S. CSP PROJECTS IN 2010: TOTAL VALUE CREATED IN THE U.S.
CSP Component Total Project Cost ($/W-ac) % of Total Cost % U.S. Sourced U.S. Content ($/W-ac)
Mirrors $0.76 12% 0% $0.00
Receivers $0.80 13% 100% $0.80
Turbine $0.00 0% 100% $0.00
Heat Transfer Fluid $0.25 4% 100% $0.25
Storage Tanks $0.00 0% 100% $0.00
Frames & Balance of Plant $1.70 27% 100% $1.70
Labor $1.06 17% 100% $1.06
Other Costs $1.78 28% 100% $1.78
Total $6.35 88% $5.59
Figure 3-3: CSP Percent of Value Created in the U.S.
Source: GTM Research. Cost breakdown estimated using NREL and UC Berkeley data, and was not provided by FPL.
Figure 3-4: CSP Project Domestic Value Creation, 2010
Source: GTM Research. Cost breakdown estimated using NREL and UC Berkeley data, and was not provided by FPL.

64 Copyright © 2011 Greentech Media
U.S. SOLAR ENERGY TRADE ASSESSMENT 2011 Photovoltaics Concentrating Solar Power Solar Heating & Cooling
Total system costs of $6.35/W-ac are 88% sourced domestically, which equates to $5.59/W-ac. All CSP costs are shown in cost per watt-AC (alternating current). Whereas PV plants produce direct current (DC) power that needs to be converted to AC, CSP plants produce AC directly. For an apples-to-apples comparison between CSP and PV cost per watt, the PV cost should be multiplied by roughly 1.18 to convert to cost per watt-ac. The cost of $6.35/W-ac is not typical for a CSP plant, as the Martin plant required much more expensive tempered glass and heavy-duty frames to resist the hurricane-force winds which occasionally visit Florida. But it also benefi ted on the cost side, as no new turbine was required, since the plant feeds steam into an existing fossil fuel plant. In the U.S. in 2010, there was $476 million spent on CSP projects (FPL’s Martin plant), of which $419 million in value was retained in the U.S. CSP plants have a higher domestic value creation percentage than PV, as many of the components for CSP are commodity items and therefore have low value per pound (aluminum, cement, gravel, etc.). Therefore, it is more economical for CSP plants to use domestic suppliers to avoid transport costs.
3.1.1 Mirrors
Mirrors represent 12% of the total cost of a CSP project. In the case of the Martin Solar Project, mirrors were sourced from Rioglass in Spain, as no domestic manufacturer could produce parabolic trough mirrors from tempered glass. Mirrors are therefore considered to be 100% imported. Note that Rioglass recently established a facility in Arizona that could impact future import/export trends.
3.1.2 Receivers
Glass receiver tubes represent 13% of the total cost of a CSP project. For this analysis, we assume the receiver tubes were sourced domestically, as there was suffi cient domestic capacity to supply the 75 MW project. The image to the left depicts a row of receiver tubes mounted above a parabolic trough collector.
3.1.3 Turbine
The steam turbine generator traditionally comprises 6% of the total cost for a CSP plant. In the case of Martin, however, the solar fi eld feeds steam to an existing steam turbine for the adjacent natural gas power plant – and therefore no additional turbine was required. A diagram of the major elements in a steam turbine is pictured below.
Source: Desertec-UK
Source: Geothermal Education Office
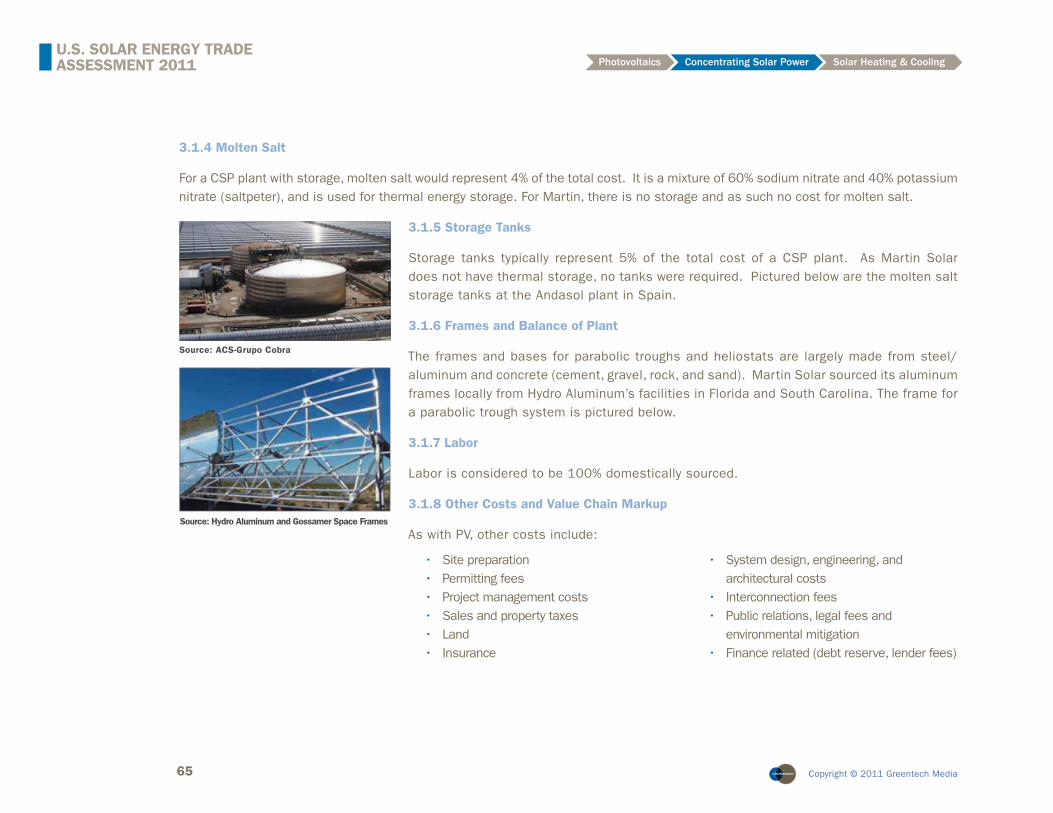
65 Copyright © 2011 Greentech Media
U.S. SOLAR ENERGY TRADE ASSESSMENT 2011 Photovoltaics Concentrating Solar Power Solar Heating & Cooling
3.1.4 Molten Salt
For a CSP plant with storage, molten salt would represent 4% of the total cost. It is a mixture of 60% sodium nitrate and 40% potassium nitrate (saltpeter), and is used for thermal energy storage. For Martin, there is no storage and as such no cost for molten salt.
3.1.5 Storage Tanks
Storage tanks typically represent 5% of the total cost of a CSP plant. As Martin Solar does not have thermal storage, no tanks were required. Pictured below are the molten salt storage tanks at the Andasol plant in Spain.
3.1.6 Frames and Balance of Plant
The frames and bases for parabolic troughs and heliostats are largely made from steel/aluminum and concrete (cement, gravel, rock, and sand). Martin Solar sourced its aluminum frames locally from Hydro Aluminum’s facilities in Florida and South Carolina. The frame for a parabolic trough system is pictured below.
3.1.7 Labor
Labor is considered to be 100% domestically sourced.
3.1.8 Other Costs and Value Chain Markup
As with PV, other costs include:
Source: ACS-Grupo Cobra
Source: Hydro Aluminum and Gossamer Space Frames
• Site preparation• Permitting fees• Project management costs• Sales and property taxes• Land• Insurance
• System design, engineering, and architectural costs
• Interconnection fees• Public relations, legal fees and
environmental mitigation • Finance related (debt reserve, lender fees)
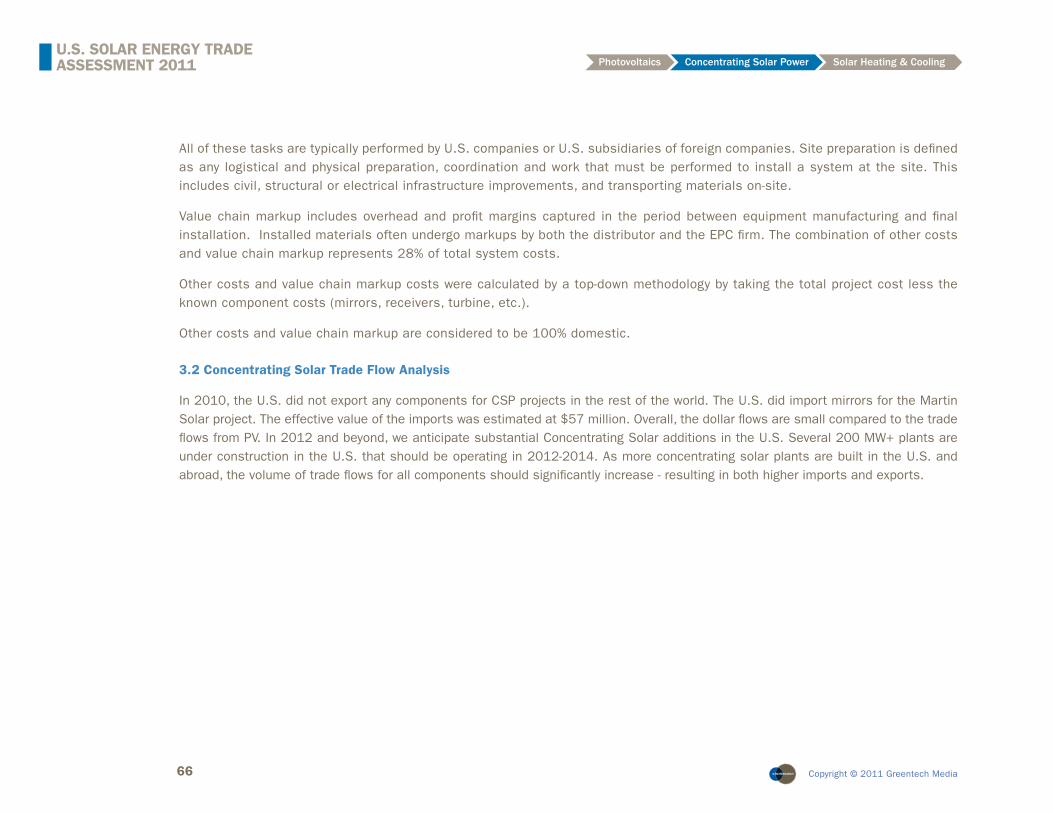
66 Copyright © 2011 Greentech Media
U.S. SOLAR ENERGY TRADE ASSESSMENT 2011 Photovoltaics Concentrating Solar Power Solar Heating & Cooling
All of these tasks are typically performed by U.S. companies or U.S. subsidiaries of foreign companies. Site preparation is defi ned as any logistical and physical preparation, coordination and work that must be performed to install a system at the site. This includes civil, structural or electrical infrastructure improvements, and transporting materials on-site.
Value chain markup includes overhead and profi t margins captured in the period between equipment manufacturing and fi nal installation. Installed materials often undergo markups by both the distributor and the EPC fi rm. The combination of other costs and value chain markup represents 28% of total system costs.
Other costs and value chain markup costs were calculated by a top-down methodology by taking the total project cost less the known component costs (mirrors, receivers, turbine, etc.).
Other costs and value chain markup are considered to be 100% domestic.
3.2 Concentrating Solar Trade Flow Analysis
In 2010, the U.S. did not export any components for CSP projects in the rest of the world. The U.S. did import mirrors for the Martin Solar project. The effective value of the imports was estimated at $57 million. Overall, the dollar fl ows are small compared to the trade fl ows from PV. In 2012 and beyond, we anticipate substantial Concentrating Solar additions in the U.S. Several 200 MW+ plants are under construction in the U.S. that should be operating in 2012-2014. As more concentrating solar plants are built in the U.S. and abroad, the volume of trade fl ows for all components should signifi cantly increase - resulting in both higher imports and exports.
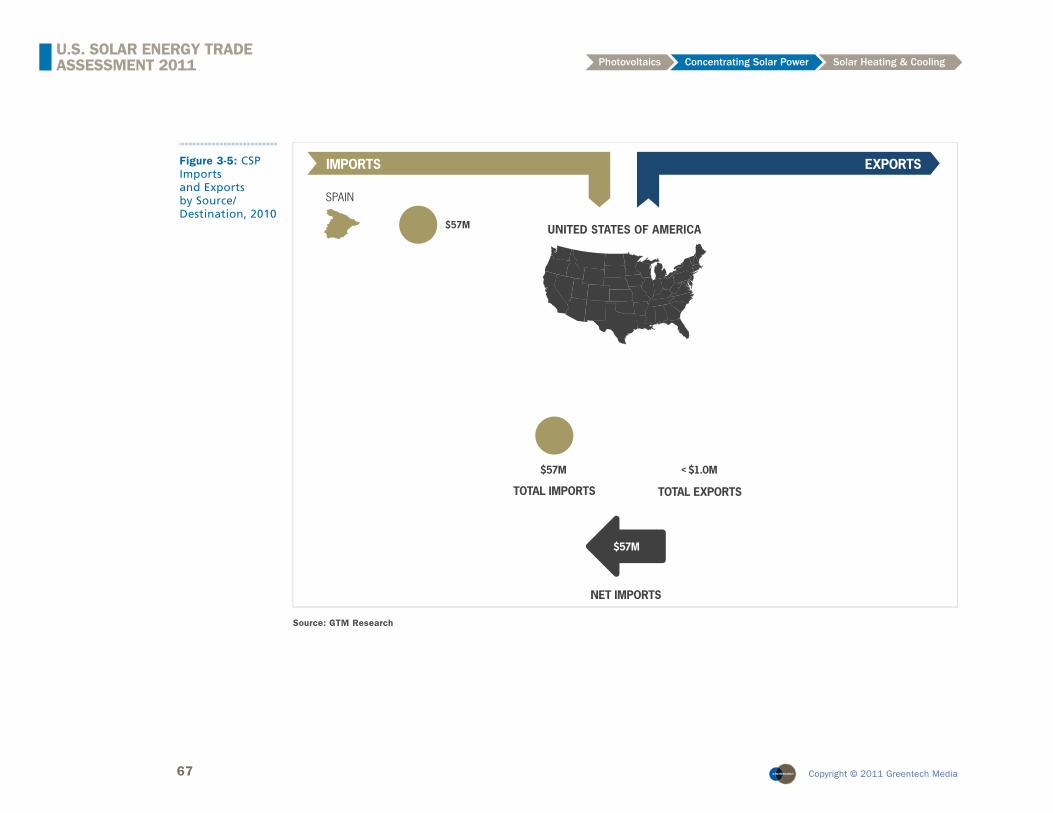
67 Copyright © 2011 Greentech Media
U.S. SOLAR ENERGY TRADE ASSESSMENT 2011 Photovoltaics Concentrating Solar Power Solar Heating & Cooling
Figure 3-5: CSP Imports and Exports by Source/Destination, 2010
TOTAL IMPORTS
SPAIN
IMPORTS
$57M
TOTAL EXPORTS
EXPORTS
UNITED STATES OF AMERICA
$57M
NET IMPORTS
$57M
$1.0M<
Source: GTM Research
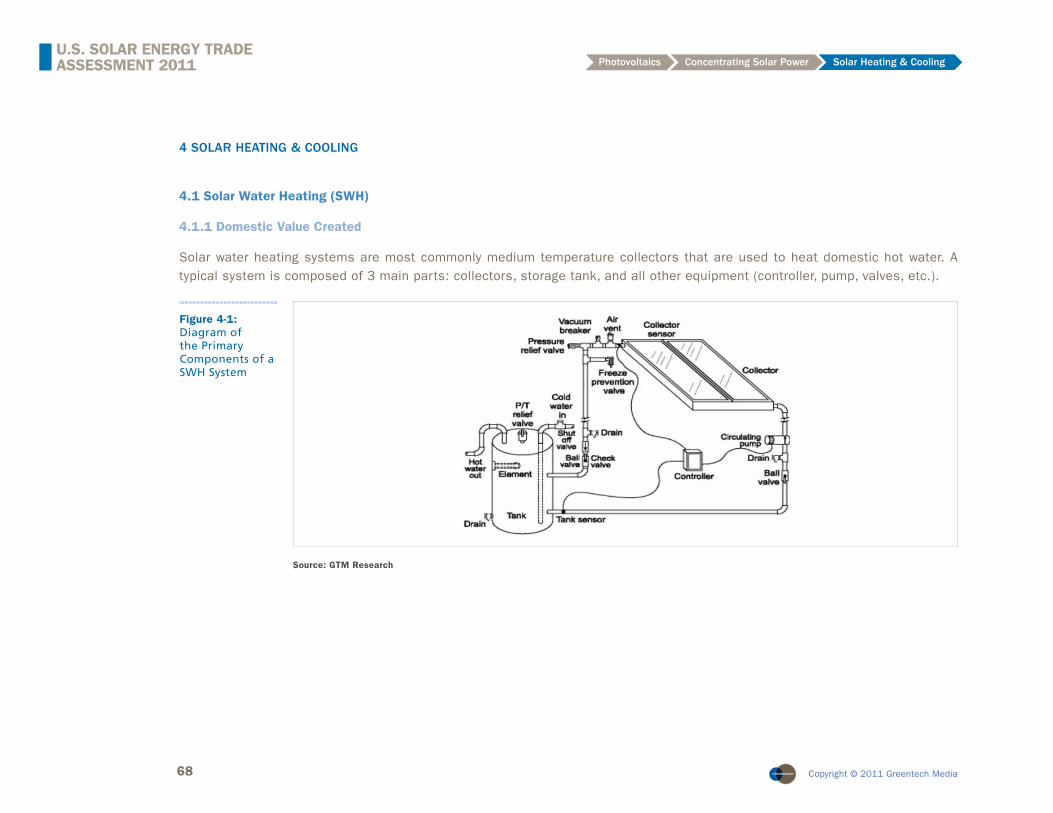
68 Copyright © 2011 Greentech Media
U.S. SOLAR ENERGY TRADE ASSESSMENT 2011 Photovoltaics Concentrating Solar Power Solar Heating & Cooling
4 SOLAR HEATING & COOLING
4.1 Solar Water Heating (SWH)
4.1.1 Domestic Value Created
Solar water heating systems are most commonly medium temperature collectors that are used to heat domestic hot water. A typical system is composed of 3 main parts: collectors, storage tank, and all other equipment (controller, pump, valves, etc.).
Figure 4-1: Diagram of the Primary Components of a SWH System
Source: GTM Research
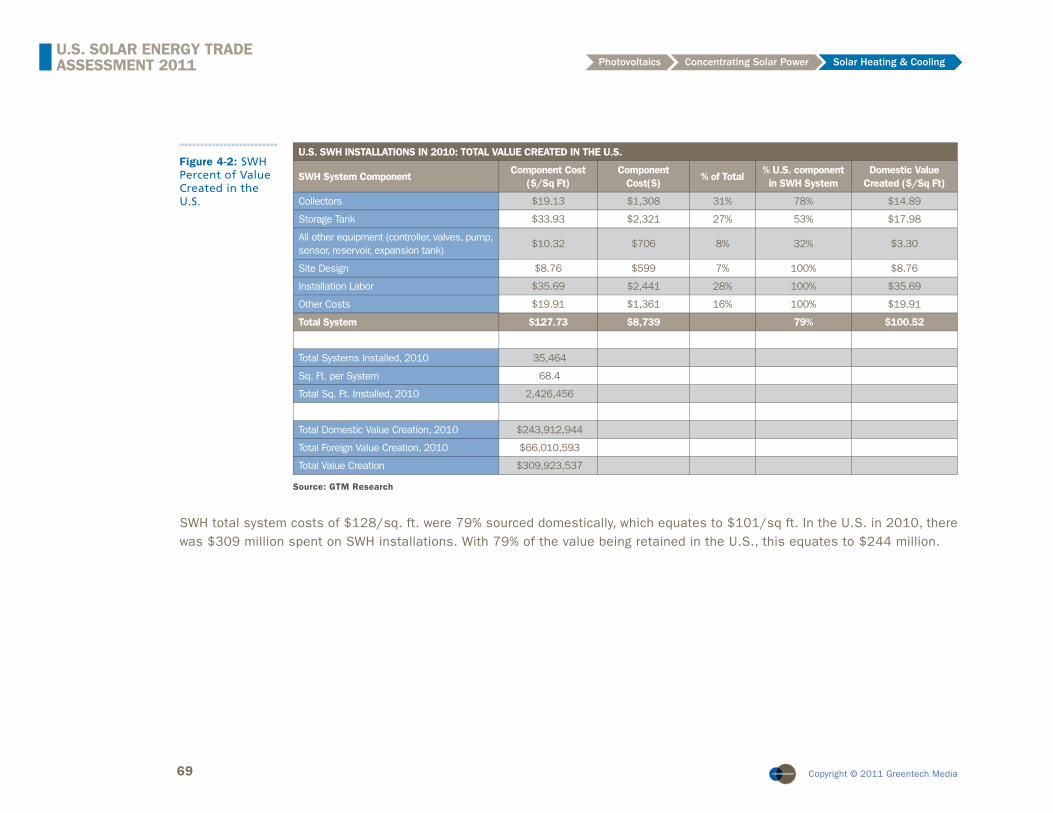
69 Copyright © 2011 Greentech Media
U.S. SOLAR ENERGY TRADE ASSESSMENT 2011 Photovoltaics Concentrating Solar Power Solar Heating & Cooling
Figure 4-2: SWH Percent of Value Created in the U.S.
U.S. SWH INSTALLATIONS IN 2010: TOTAL VALUE CREATED IN THE U.S.
SWH System ComponentComponent Cost
($/Sq Ft)Component
Cost($)% of Total
% U.S. component in SWH System
Domestic Value Created ($/Sq Ft)
Collectors $19.13 $1,308 31% 78% $14.89
Storage Tank $33.93 $2,321 27% 53% $17.98
All other equipment (controller, valves, pump, sensor, reservoir, expansion tank)
$10.32 $706 8% 32% $3.30
Site Design $8.76 $599 7% 100% $8.76
Installation Labor $35.69 $2,441 28% 100% $35.69
Other Costs $19.91 $1,361 16% 100% $19.91
Total System $127.73 $8,739 79% $100.52
Total Systems Installed, 2010 35,464
Sq. Ft. per System 68.4
Total Sq. Ft. Installed, 2010 2,426,456
Total Domestic Value Creation, 2010 $243,912,944
Total Foreign Value Creation, 2010 $66,010,593
Total Value Creation $309,923,537
Source: GTM Research
SWH total system costs of $128/sq. ft. were 79% sourced domestically, which equates to $101/sq ft. In the U.S. in 2010, there was $309 million spent on SWH installations. With 79% of the value being retained in the U.S., this equates to $244 million.
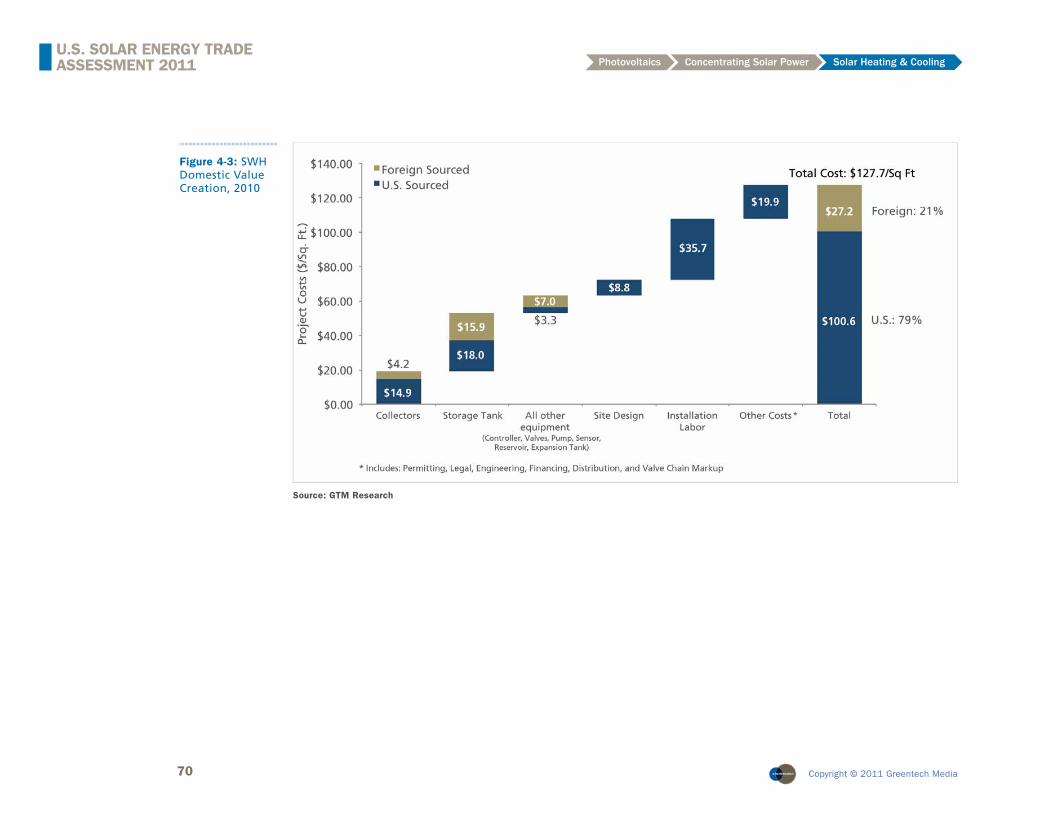
70 Copyright © 2011 Greentech Media
U.S. SOLAR ENERGY TRADE ASSESSMENT 2011 Photovoltaics Concentrating Solar Power Solar Heating & Cooling
Figure 4-3: SWH Domestic Value Creation, 2010
Source: GTM Research

71 Copyright © 2011 Greentech Media
U.S. SOLAR ENERGY TRADE ASSESSMENT 2011 Photovoltaics Concentrating Solar Power Solar Heating & Cooling
4.1.1.1 SWH Collectors
Collector price per square foot is based on EIA data for medium-temperature collectors (ICS/thermosiphon, fl at plate, and evacuated tube). This is a factory-gate price, which excludes distributor/wholesaler markup. Overall, 78% of collectors were domestically sourced. This is calculated by dividing the 1.89 million square feet of U.S.-made collectors installed in the U.S. by the 2.43 million square feet of total collectors installed in the U.S. in 2010.
4.1.1.2 Storage Tank
Storage tanks represented 27% of the total cost of a SWH system in 2010, or around $2,321 for a blended system (mix of open and closed loop, mix of residential and non-residential). Storage tank price is based on data from state rebate agencies which provide system cost breakdowns. The price is a blend of one and two tank systems, and stainless and non-stainless tanks. Based on a survey of solar water heating tank manufacturers, it was estimated that 53% of tanks were sourced domestically. For systems installed on the East Coast, many tanks are manufactured domestically of stainless steel. For Western states, a signifi cant percentage of the tanks used are assembled in Mexico and shipped to the U.S.
4.1.1.3 All Other Equipment
All other equipment includes:
Source: TiSUN
Source: TiSUN
• Controller• Valves• Pump
• Sensor• Reservoir• Expansion tank
Costs were based on published online pricing, and work out to $706 per system – or 8% of total system cost. The percent sourced domestically was based on conversations with pump and controller manufacturers, and was estimated at 32%.
4.1.1.4 Site Design and Installation Labor
Costs were based on installation data sourced from state rebate agencies. They represent 35% of the total system cost, or a blended cost of around $3,041 per installation (residential and non-residential). Costs were considered to be 100% domestic.
Source: Thermo Technologies
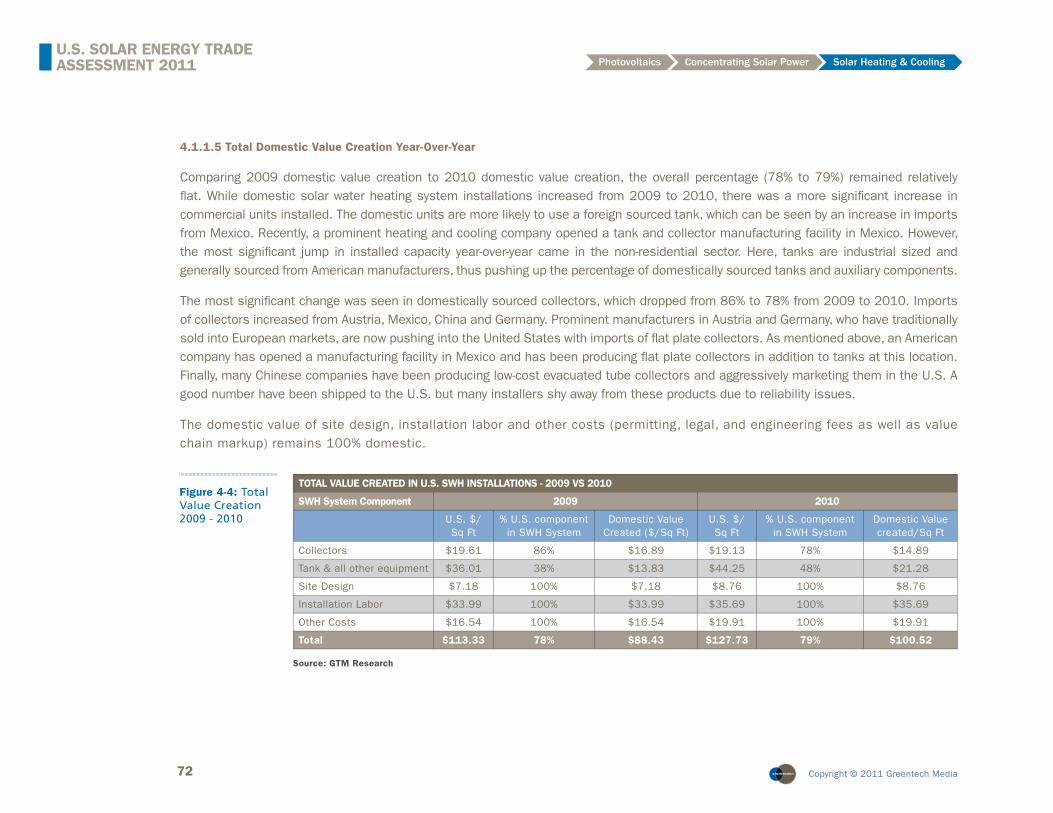
72 Copyright © 2011 Greentech Media
U.S. SOLAR ENERGY TRADE ASSESSMENT 2011 Photovoltaics Concentrating Solar Power Solar Heating & Cooling
4.1.1.5 Total Domestic Value Creation Year-Over-Year
Comparing 2009 domestic value creation to 2010 domestic value creation, the overall percentage (78% to 79%) remained relatively fl at. While domestic solar water heating system installations increased from 2009 to 2010, there was a more signifi cant increase in commercial units installed. The domestic units are more likely to use a foreign sourced tank, which can be seen by an increase in imports from Mexico. Recently, a prominent heating and cooling company opened a tank and collector manufacturing facility in Mexico. However, the most signifi cant jump in installed capacity year-over-year came in the non-residential sector. Here, tanks are industrial sized and generally sourced from American manufacturers, thus pushing up the percentage of domestically sourced tanks and auxiliary components.
The most signifi cant change was seen in domestically sourced collectors, which dropped from 86% to 78% from 2009 to 2010. Imports of collectors increased from Austria, Mexico, China and Germany. Prominent manufacturers in Austria and Germany, who have traditionally sold into European markets, are now pushing into the United States with imports of fl at plate collectors. As mentioned above, an American company has opened a manufacturing facility in Mexico and has been producing fl at plate collectors in addition to tanks at this location. Finally, many Chinese companies have been producing low-cost evacuated tube collectors and aggressively marketing them in the U.S. A good number have been shipped to the U.S. but many installers shy away from these products due to reliability issues.
The domestic value of site design, installation labor and other costs (permitting, legal, and engineering fees as well as value chain markup) remains 100% domestic.
TOTAL VALUE CREATED IN U.S. SWH INSTALLATIONS - 2009 VS 2010
SWH System Component 2009 2010
U.S. $/Sq Ft
% U.S. component in SWH System
Domestic Value Created ($/Sq Ft)
U.S. $/Sq Ft
% U.S. component in SWH System
Domestic Value created/Sq Ft
Collectors $19.61 86% $16.89 $19.13 78% $14.89
Tank & all other equipment $36.01 38% $13.83 $44.25 48% $21.28
Site Design $7.18 100% $7.18 $8.76 100% $8.76
Installation Labor $33.99 100% $33.99 $35.69 100% $35.69
Other Costs $16.54 100% $16.54 $19.91 100% $19.91
Total $113.33 78% $88.43 $127.73 79% $100.52
Source: GTM Research
Figure 4-4: Total Value Creation 2009 - 2010
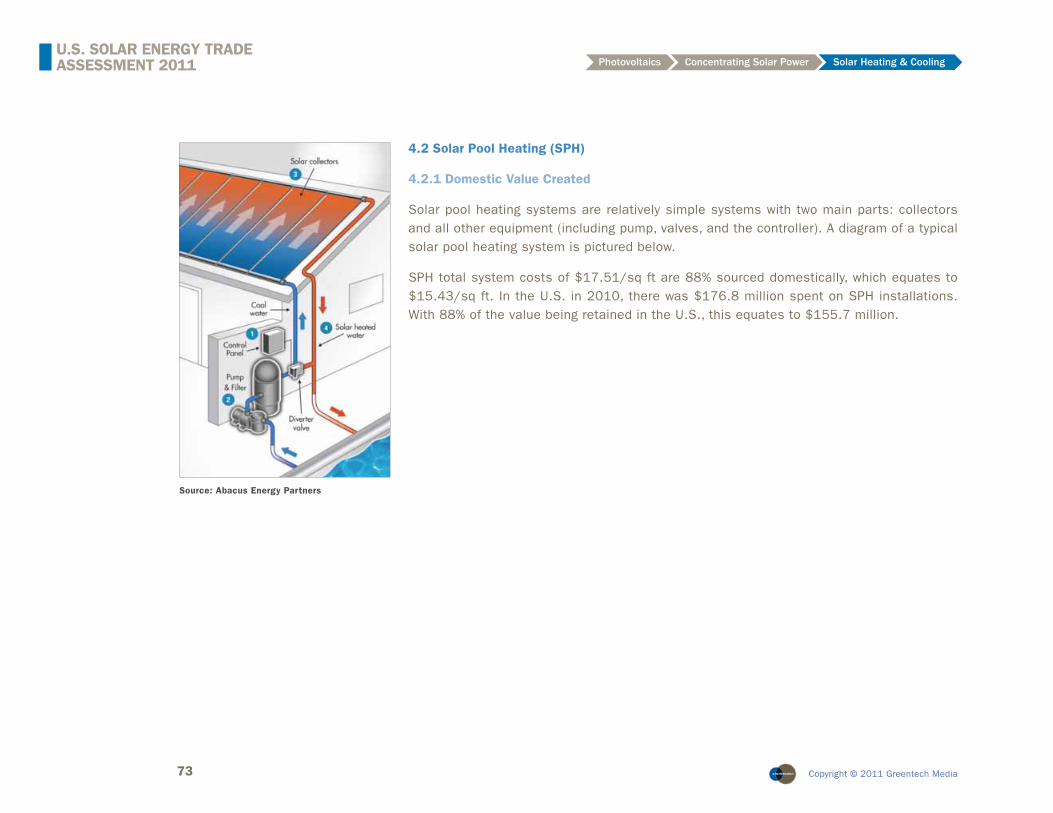
73 Copyright © 2011 Greentech Media
U.S. SOLAR ENERGY TRADE ASSESSMENT 2011 Photovoltaics Concentrating Solar Power Solar Heating & Cooling
4.2 Solar Pool Heating (SPH)
4.2.1 Domestic Value Created
Solar pool heating systems are relatively simple systems with two main parts: collectors and all other equipment (including pump, valves, and the controller). A diagram of a typical solar pool heating system is pictured below.
SPH total system costs of $17.51/sq ft are 88% sourced domestically, which equates to $15.43/sq ft. In the U.S. in 2010, there was $176.8 million spent on SPH installations. With 88% of the value being retained in the U.S., this equates to $155.7 million.
Source: Abacus Energy Partners
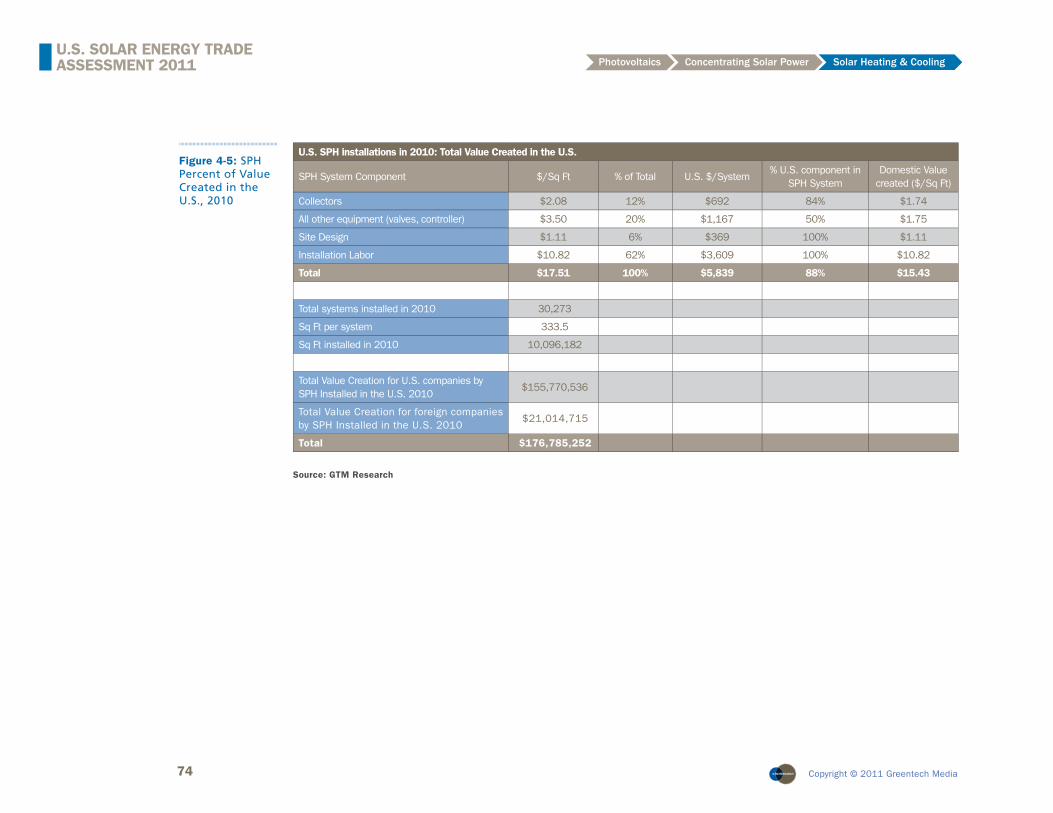
74 Copyright © 2011 Greentech Media
U.S. SOLAR ENERGY TRADE ASSESSMENT 2011 Photovoltaics Concentrating Solar Power Solar Heating & Cooling
Figure 4-5: SPH Percent of Value Created in the U.S., 2010
Source: GTM Research
U.S. SPH installations in 2010: Total Value Created in the U.S.
SPH System Component $/Sq Ft % of Total U.S. $/System% U.S. component in
SPH SystemDomestic Value
created ($/Sq Ft)
Collectors $2.08 12% $692 84% $1.74
All other equipment (valves, controller) $3.50 20% $1,167 50% $1.75
Site Design $1.11 6% $369 100% $1.11
Installation Labor $10.82 62% $3,609 100% $10.82
Total $17.51 100% $5,839 88% $15.43
Total systems installed in 2010 30,273
Sq Ft per system 333.5
Sq Ft installed in 2010 10,096,182
Total Value Creation for U.S. companies by SPH Installed in the U.S. 2010
$155,770,536
Total Value Creation for foreign companies by SPH Installed in the U.S. 2010
$21,014,715
Total $176,785,252
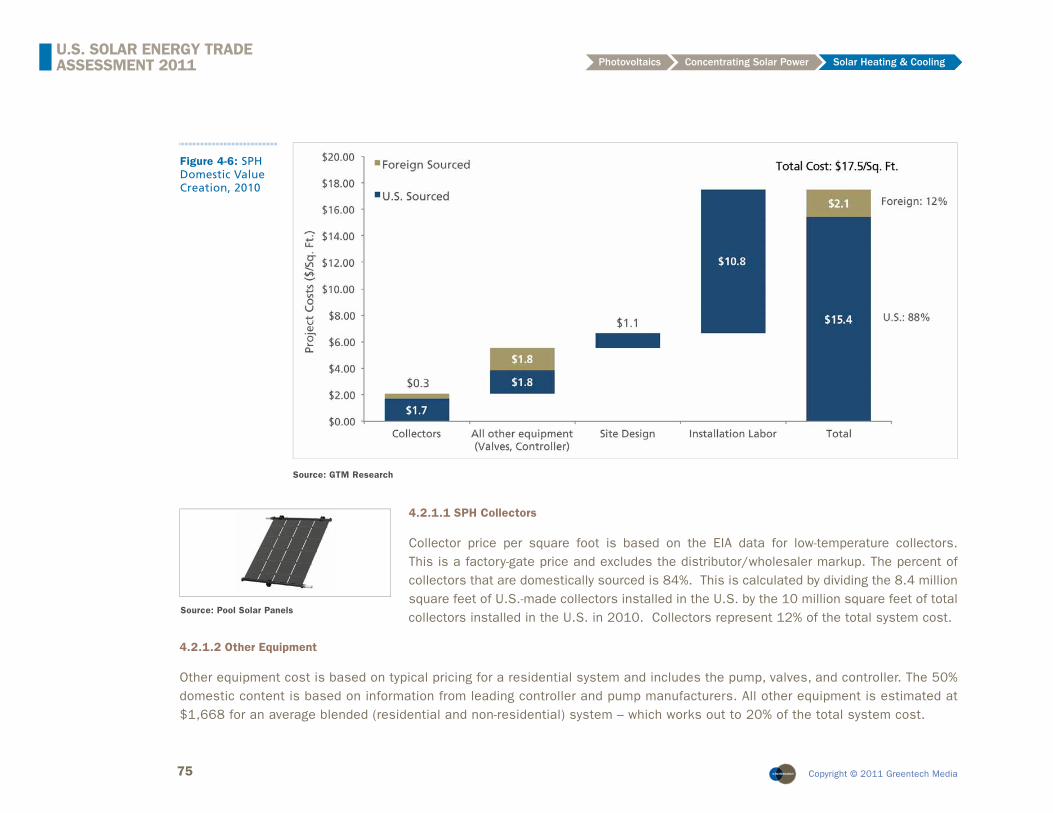
75 Copyright © 2011 Greentech Media
U.S. SOLAR ENERGY TRADE ASSESSMENT 2011 Photovoltaics Concentrating Solar Power Solar Heating & Cooling
Figure 4-6: SPH Domestic Value Creation, 2010
Source: GTM Research
4.2.1.1 SPH Collectors
Collector price per square foot is based on the EIA data for low-temperature collectors. This is a factory-gate price and excludes the distributor/wholesaler markup. The percent of collectors that are domestically sourced is 84%. This is calculated by dividing the 8.4 million square feet of U.S.-made collectors installed in the U.S. by the 10 million square feet of total collectors installed in the U.S. in 2010. Collectors represent 12% of the total system cost.
4.2.1.2 Other Equipment
Other equipment cost is based on typical pricing for a residential system and includes the pump, valves, and controller. The 50% domestic content is based on information from leading controller and pump manufacturers. All other equipment is estimated at $1,668 for an average blended (residential and non-residential) system – which works out to 20% of the total system cost.
Source: Pool Solar Panels
76 Copyright © 2011 Greentech Media
U.S. SOLAR ENERGY TRADE ASSESSMENT 2011 Photovoltaics Concentrating Solar Power Solar Heating & Cooling
4.2.1.3 Site Design and Installation Labor
Site design costs were based on the percentage of total installation cost for a SWH system (which was derived from installation data from state rebate agencies). Combined, site design and installation labor comprise 68% of the total system cost.
4.3 SWH and SPH Trade Flow Analysis
The U.S. imported $13.6 million of SWH and SPH collectors, with evacuated tube SWH collectors coming from China, fl at plate SWH collectors coming from Germany and Austria, and unglazed plastic SPH collectors from Israel. As mentioned previously, imports from Austria and Mexico jumped signifi cantly due to greater interest in the U.S. market and new manufacturing facilities, respectively. Israel’s imports dropped due to a weakness in the domestic SPH market, which is tied to the poor economy and slow new home sales.
The U.S. exported $16.3 million of SWH and SPH collectors, primarily unglazed plastic SPH collectors to Mexico. There was also an increase in shipments of unglazed collectors to Saudi Arabia. The country’s climate is hot and sunny enough that these low-cost collectors normally intended for SPH applications can suffi ciently heat water for domestic use. Exports to China slowed as that country’s domestic manufacturing capacity has ramped up to better meet domestic demand.
Even with a 23% increase in imports and only a 6% increase in exports, the U.S. still has a positive trade balance of $2.7 million, making the country a net exporter of SWH and SPH collectors.
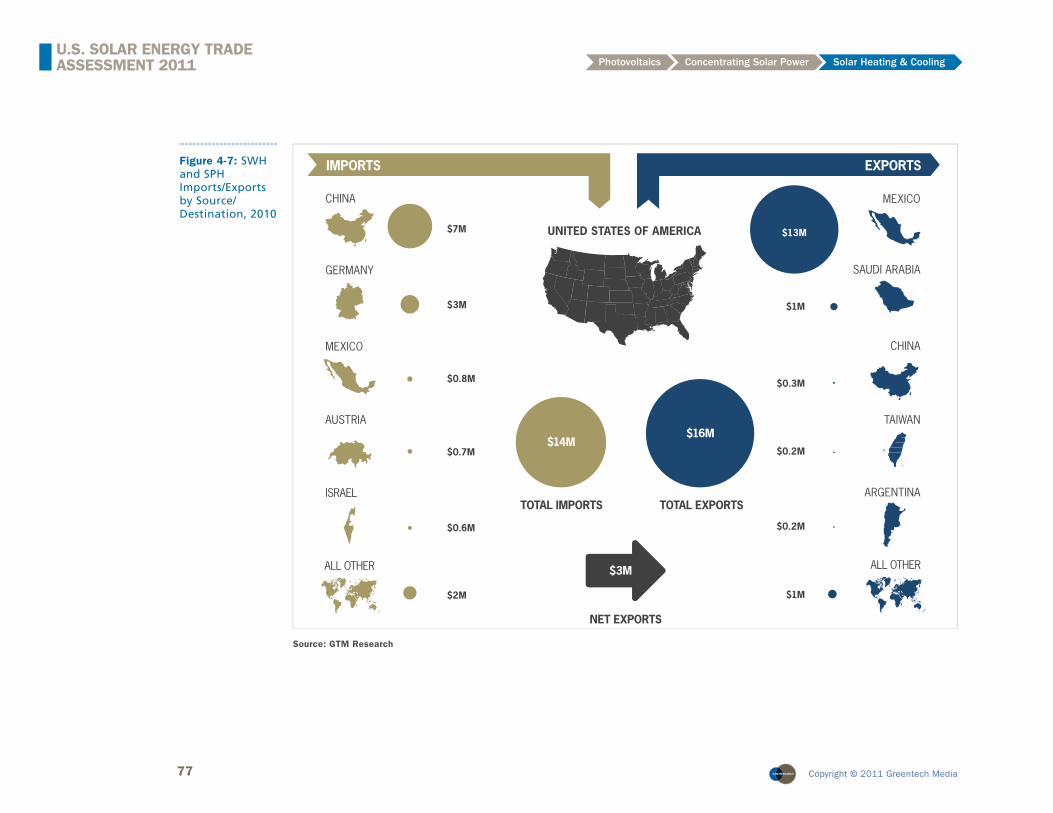
77 Copyright © 2011 Greentech Media
U.S. SOLAR ENERGY TRADE ASSESSMENT 2011 Photovoltaics Concentrating Solar Power Solar Heating & Cooling
Figure 4-7: SWH and SPH Imports/Exports by Source/Destination, 2010
TOTAL IMPORTS
CHINA
GERMANY
MEXICO
AUSTRIA
ISRAEL
IMPORTS
$3M
$0.8M
$0.7M
$0.6M
TOTAL EXPORTS
EXPORTS
MEXICO
SAUDI ARABIA
CHINA
TAIWAN
ARGENTINA
$1M
$0.3M
$0.2M
$0.2M
NET EXPORTS
UNITED STATES OF AMERICA $13M
ALL OTHER
$7M
$2M
$16M$14M
$3M ALL OTHER
$1M
Source: GTM Research

78 Copyright © 2011 Greentech Media
U.S. SOLAR ENERGY TRADE ASSESSMENT 2011 Photovoltaics Concentrating Solar Power Solar Heating & Cooling
Figure 4-8: SWH and SPH Imports and Exports by Source/Destination, 2010
SWH and SPH Trade Flows by Source/Destination Country
Exports (in Thousands $) Imports (in Thousands $)
Country Value 2009 Value 2010 % Change Country Value 2009 Value 2010 % Change
Mexico $10,074 $13,312 32% China $4,122 $6,660 62%
Saudi Arabia $284 $1,055 271% Germany $1,814 $2,849 57%
China $749 $257 -66% Mexico $189 $796 322%
Taiwan $190 $205 8% Austria $95 $675 610%
Argentina $0 $189 Israel $1,558 $601 -61%
ROW $4,058 $1,311 -68% ROW $3,312 $2,033 -39%
Total $15,355 $16,329 6% Total $11,090 $13,614 23%
Source: GTM Research
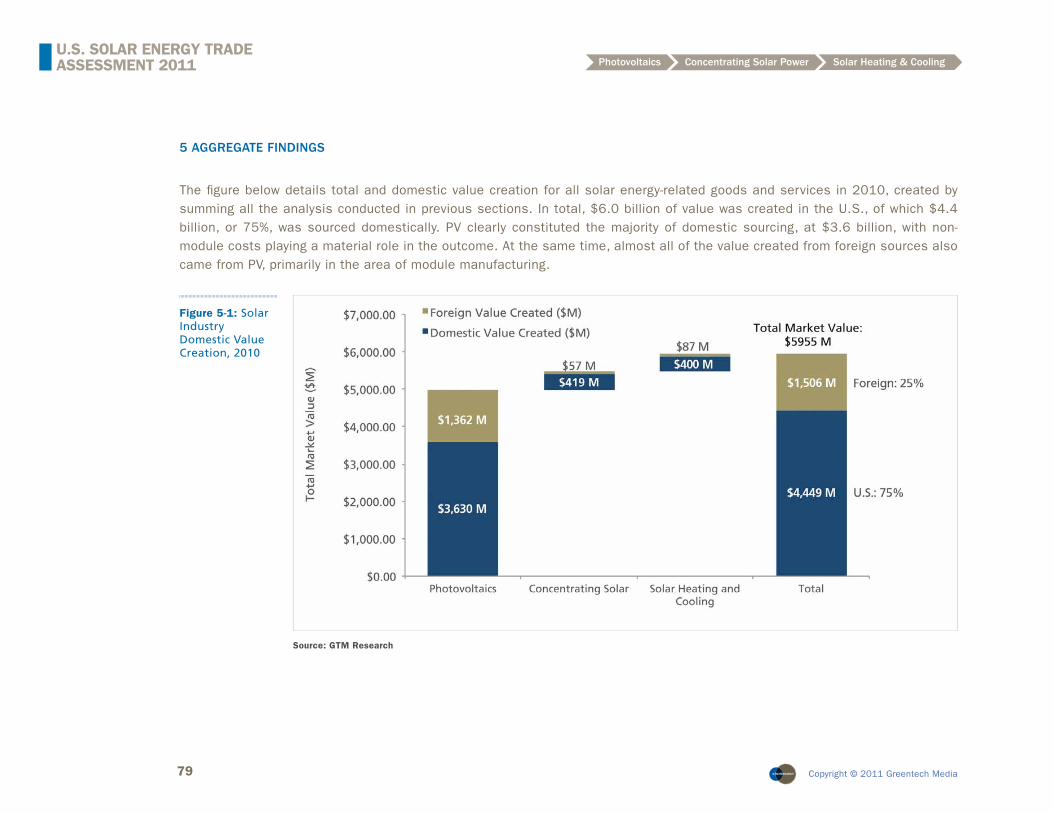
79 Copyright © 2011 Greentech Media
U.S. SOLAR ENERGY TRADE ASSESSMENT 2011 Photovoltaics Concentrating Solar Power Solar Heating & Cooling
Figure 5-1: Solar Industry Domestic Value Creation, 2010
Source: GTM Research
5 AGGREGATE FINDINGS
The fi gure below details total and domestic value creation for all solar energy-related goods and services in 2010, created by summing all the analysis conducted in previous sections. In total, $6.0 billion of value was created in the U.S., of which $4.4 billion, or 75%, was sourced domestically. PV clearly constituted the majority of domestic sourcing, at $3.6 billion, with non-module costs playing a material role in the outcome. At the same time, almost all of the value created from foreign sources also came from PV, primarily in the area of module manufacturing.
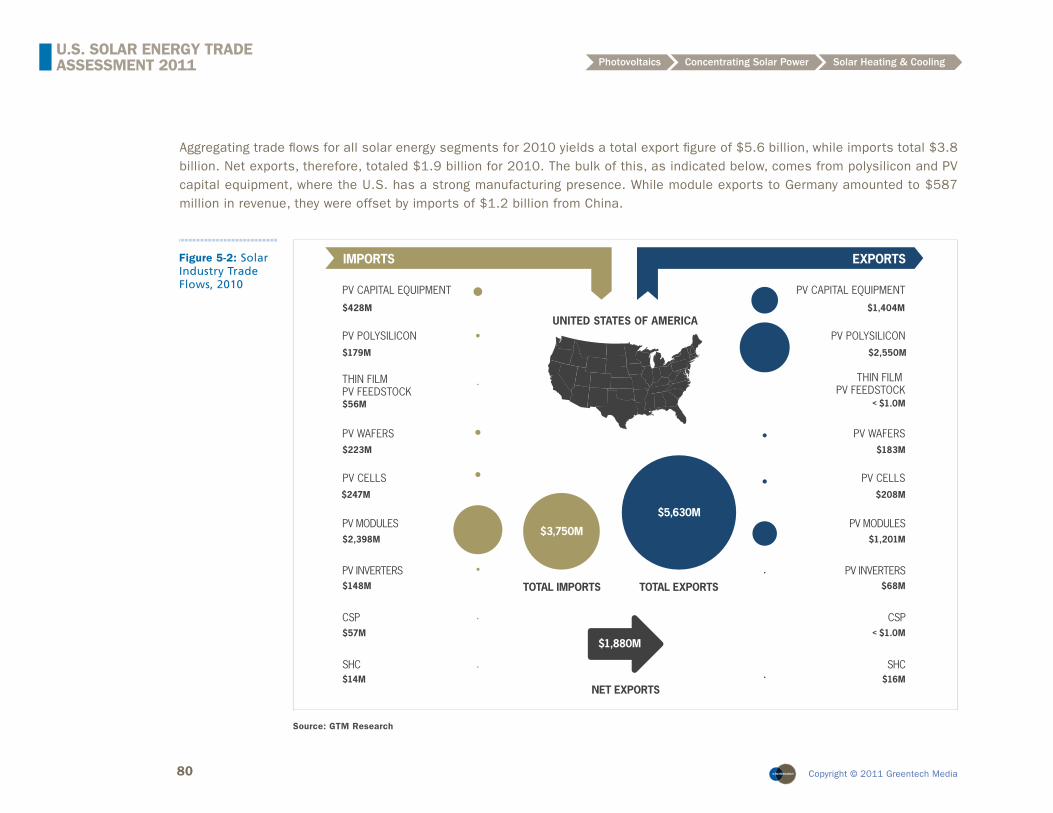
80 Copyright © 2011 Greentech Media
U.S. SOLAR ENERGY TRADE ASSESSMENT 2011 Photovoltaics Concentrating Solar Power Solar Heating & Cooling
Figure 5-2: Solar Industry Trade Flows, 2010
TOTAL IMPORTS
PV CAPITAL EQUIPMENT
PV POLYSILICON
THIN FILM PV FEEDSTOCK
PV WAFERS
PV MODULES
IMPORTS
TOTAL EXPORTS
EXPORTS
NET EXPORTS
UNITED STATES OF AMERICA
PV INVERTERS
$5,630M
$3,750M
CSP
SHC
PV CAPITAL EQUIPMENT
PV POLYSILICON
THIN FILM PV FEEDSTOCK
PV WAFERS
PV MODULES
PV INVERTERS
CSP
SHC
$1,880M
$428M $1,404M
$179M $2,550M
$56M
$223M $183M
$2,398M $1,201M
$148M $68M
$57M
$14M $16M
PV CELLS PV CELLS
$247M $208M
$1.0M<
$1.0M<
Source: GTM Research
Aggregating trade fl ows for all solar energy segments for 2010 yields a total export fi gure of $5.6 billion, while imports total $3.8 billion. Net exports, therefore, totaled $1.9 billion for 2010. The bulk of this, as indicated below, comes from polysilicon and PV capital equipment, where the U.S. has a strong manufacturing presence. While module exports to Germany amounted to $587 million in revenue, they were offset by imports of $1.2 billion from China.
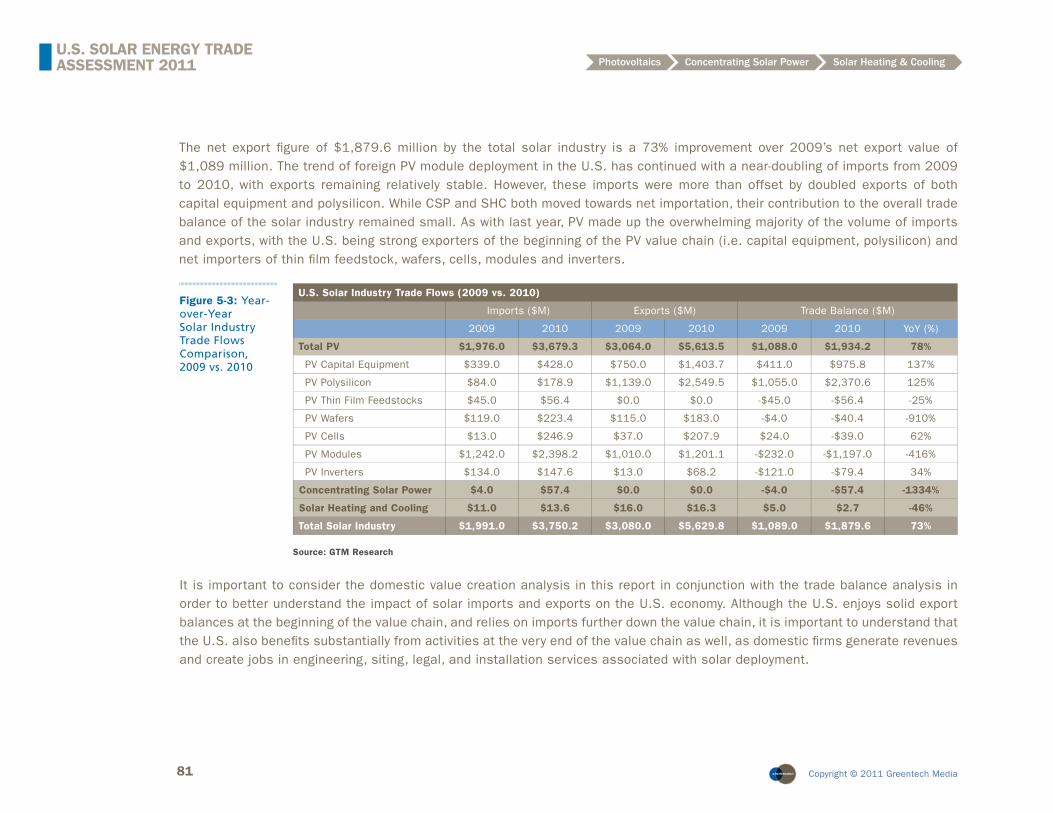
81 Copyright © 2011 Greentech Media
U.S. SOLAR ENERGY TRADE ASSESSMENT 2011 Photovoltaics Concentrating Solar Power Solar Heating & Cooling
The net export fi gure of $1,879.6 million by the total solar industry is a 73% improvement over 2009’s net export value of $1,089 million. The trend of foreign PV module deployment in the U.S. has continued with a near-doubling of imports from 2009 to 2010, with exports remaining relatively stable. However, these imports were more than offset by doubled exports of both capital equipment and polysilicon. While CSP and SHC both moved towards net importation, their contribution to the overall trade balance of the solar industry remained small. As with last year, PV made up the overwhelming majority of the volume of imports and exports, with the U.S. being strong exporters of the beginning of the PV value chain (i.e. capital equipment, polysilicon) and net importers of thin fi lm feedstock, wafers, cells, modules and inverters.
U.S. Solar Industry Trade Flows (2009 vs. 2010)
Imports ($M) Exports ($M) Trade Balance ($M)
2009 2010 2009 2010 2009 2010 YoY (%)
Total PV $1,976.0 $3,679.3 $3,064.0 $5,613.5 $1,088.0 $1,934.2 78%
PV Capital Equipment $339.0 $428.0 $750.0 $1,403.7 $411.0 $975.8 137%
PV Polysilicon $84.0 $178.9 $1,139.0 $2,549.5 $1,055.0 $2,370.6 125%
PV Thin Film Feedstocks $45.0 $56.4 $0.0 $0.0 -$45.0 -$56.4 -25%
PV Wafers $119.0 $223.4 $115.0 $183.0 -$4.0 -$40.4 -910%
PV Cells $13.0 $246.9 $37.0 $207.9 $24.0 -$39.0 62%
PV Modules $1,242.0 $2,398.2 $1,010.0 $1,201.1 -$232.0 -$1,197.0 -416%
PV Inverters $134.0 $147.6 $13.0 $68.2 -$121.0 -$79.4 34%
Concentrating Solar Power $4.0 $57.4 $0.0 $0.0 -$4.0 -$57.4 -1334%
Solar Heating and Cooling $11.0 $13.6 $16.0 $16.3 $5.0 $2.7 -46%
Total Solar Industry $1,991.0 $3,750.2 $3,080.0 $5,629.8 $1,089.0 $1,879.6 73%
Figure 5-3: Year-over-Year Solar Industry Trade Flows Comparison, 2009 vs. 2010
Source: GTM Research
It is important to consider the domestic value creation analysis in this report in conjunction with the trade balance analysis in order to better understand the impact of solar imports and exports on the U.S. economy. Although the U.S. enjoys solid export balances at the beginning of the value chain, and relies on imports further down the value chain, it is important to understand that the U.S. also benefi ts substantially from activities at the very end of the value chain as well, as domestic fi rms generate revenues and create jobs in engineering, siting, legal, and installation services associated with solar deployment.
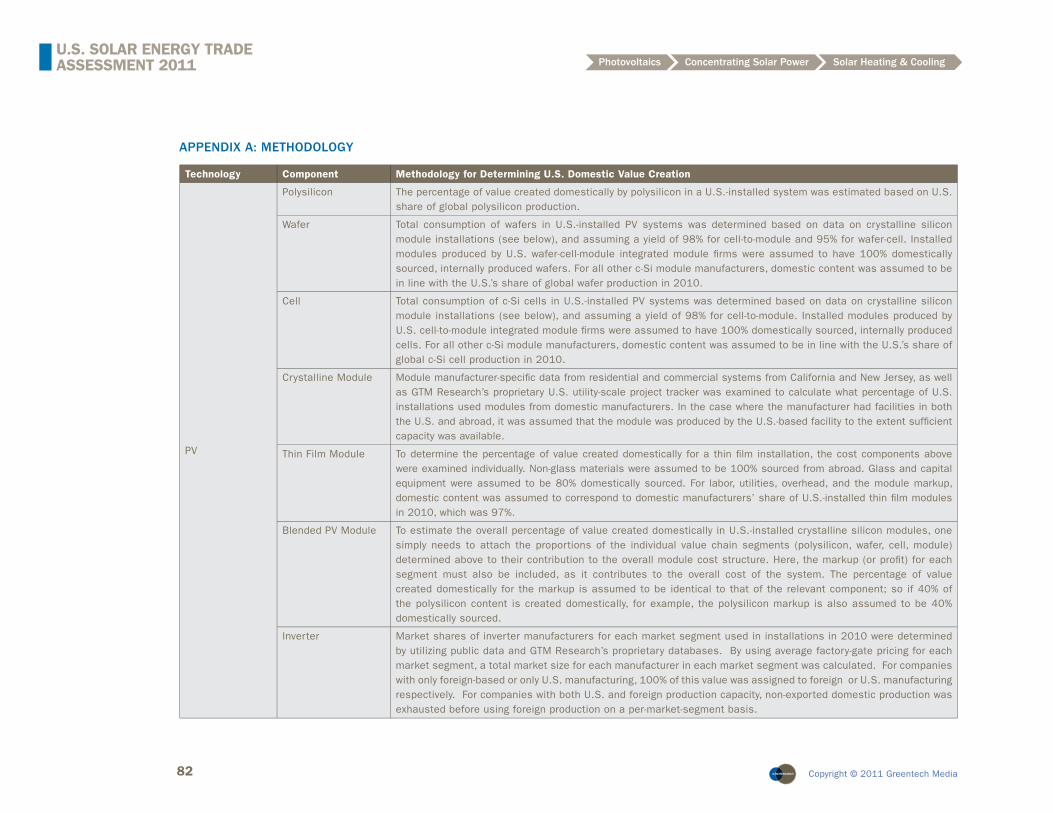
82 Copyright © 2011 Greentech Media
U.S. SOLAR ENERGY TRADE ASSESSMENT 2011 Photovoltaics Concentrating Solar Power Solar Heating & Cooling
APPENDIX A: METHODOLOGY
Technology Component Methodology for Determining U.S. Domestic Value Creation
PV
Polysilicon The percentage of value created domestically by polysilicon in a U.S.-installed system was estimated based on U.S. share of global polysilicon production.
Wafer Total consumption of wafers in U.S.-installed PV systems was determined based on data on crystalline silicon module installations (see below), and assuming a yield of 98% for cell-to-module and 95% for wafer-cell. Installed modules produced by U.S. wafer-cell-module integrated module fi rms were assumed to have 100% domestically sourced, internally produced wafers. For all other c-Si module manufacturers, domestic content was assumed to be in line with the U.S.’s share of global wafer production in 2010.
Cell Total consumption of c-Si cells in U.S.-installed PV systems was determined based on data on crystalline silicon module installations (see below), and assuming a yield of 98% for cell-to-module. Installed modules produced by U.S. cell-to-module integrated module fi rms were assumed to have 100% domestically sourced, internally produced cells. For all other c-Si module manufacturers, domestic content was assumed to be in line with the U.S.’s share of global c-Si cell production in 2010.
Crystalline Module Module manufacturer-specifi c data from residential and commercial systems from California and New Jersey, as well as GTM Research’s proprietary U.S. utility-scale project tracker was examined to calculate what percentage of U.S. installations used modules from domestic manufacturers. In the case where the manufacturer had facilities in both the U.S. and abroad, it was assumed that the module was produced by the U.S.-based facility to the extent suffi cient capacity was available.
Thin Film Module To determine the percentage of value created domestically for a thin fi lm installation, the cost components above were examined individually. Non-glass materials were assumed to be 100% sourced from abroad. Glass and capital equipment were assumed to be 80% domestically sourced. For labor, utilities, overhead, and the module markup, domestic content was assumed to correspond to domestic manufacturers’ share of U.S.-installed thin fi lm modules in 2010, which was 97%.
Blended PV Module To estimate the overall percentage of value created domestically in U.S.-installed crystalline silicon modules, one simply needs to attach the proportions of the individual value chain segments (polysilicon, wafer, cell, module) determined above to their contribution to the overall module cost structure. Here, the markup (or profi t) for each segment must also be included, as it contributes to the overall cost of the system. The percentage of value created domestically for the markup is assumed to be identical to that of the relevant component; so if 40% of the polysilicon content is created domestically, for example, the polysilicon markup is also assumed to be 40% domestically sourced.
Inverter Market shares of inverter manufacturers for each market segment used in installations in 2010 were determined by utilizing public data and GTM Research’s proprietary databases. By using average factory-gate pricing for each market segment, a total market size for each manufacturer in each market segment was calculated. For companies with only foreign-based or only U.S. manufacturing, 100% of this value was assigned to foreign or U.S. manufacturing respectively. For companies with both U.S. and foreign production capacity, non-exported domestic production was exhausted before using foreign production on a per-market-segment basis.
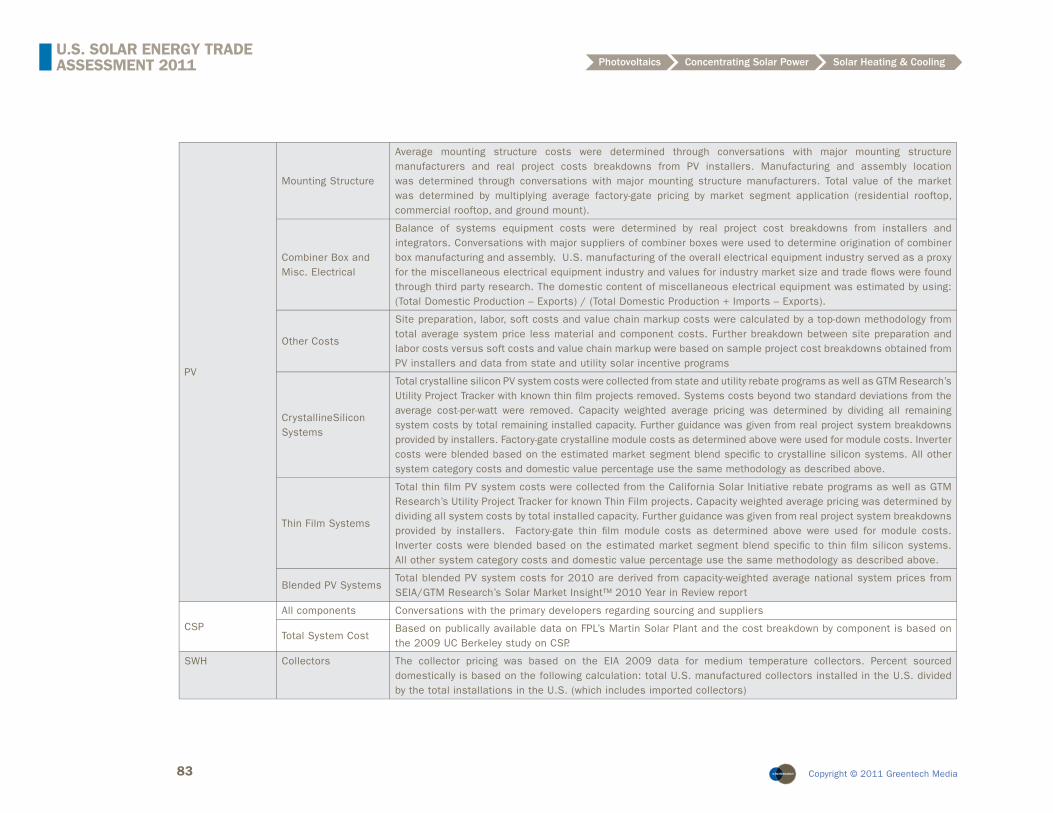
83 Copyright © 2011 Greentech Media
U.S. SOLAR ENERGY TRADE ASSESSMENT 2011 Photovoltaics Concentrating Solar Power Solar Heating & Cooling
PV
Mounting Structure
Average mounting structure costs were determined through conversations with major mounting structure manufacturers and real project costs breakdowns from PV installers. Manufacturing and assembly location was determined through conversations with major mounting structure manufacturers. Total value of the market was determined by multiplying average factory-gate pricing by market segment application (residential rooftop, commercial rooftop, and ground mount).
Combiner Box and Misc. Electrical
Balance of systems equipment costs were determined by real project cost breakdowns from installers and integrators. Conversations with major suppliers of combiner boxes were used to determine origination of combiner box manufacturing and assembly. U.S. manufacturing of the overall electrical equipment industry served as a proxy for the miscellaneous electrical equipment industry and values for industry market size and trade fl ows were found through third party research. The domestic content of miscellaneous electrical equipment was estimated by using: (Total Domestic Production – Exports) / (Total Domestic Production + Imports – Exports).
Other Costs
Site preparation, labor, soft costs and value chain markup costs were calculated by a top-down methodology from total average system price less material and component costs. Further breakdown between site preparation and labor costs versus soft costs and value chain markup were based on sample project cost breakdowns obtained from PV installers and data from state and utility solar incentive programs
CrystallineSilicon Systems
Total crystalline silicon PV system costs were collected from state and utility rebate programs as well as GTM Research’s Utility Project Tracker with known thin fi lm projects removed. Systems costs beyond two standard deviations from the average cost-per-watt were removed. Capacity weighted average pricing was determined by dividing all remaining system costs by total remaining installed capacity. Further guidance was given from real project system breakdowns provided by installers. Factory-gate crystalline module costs as determined above were used for module costs. Inverter costs were blended based on the estimated market segment blend specifi c to crystalline silicon systems. All other system category costs and domestic value percentage use the same methodology as described above.
Thin Film Systems
Total thin fi lm PV system costs were collected from the California Solar Initiative rebate programs as well as GTM Research’s Utility Project Tracker for known Thin Film projects. Capacity weighted average pricing was determined by dividing all system costs by total installed capacity. Further guidance was given from real project system breakdowns provided by installers. Factory-gate thin fi lm module costs as determined above were used for module costs. Inverter costs were blended based on the estimated market segment blend specifi c to thin fi lm silicon systems. All other system category costs and domestic value percentage use the same methodology as described above.
Blended PV SystemsTotal blended PV system costs for 2010 are derived from capacity-weighted average national system prices from SEIA/GTM Research’s Solar Market Insight™ 2010 Year in Review report
CSP
All components Conversations with the primary developers regarding sourcing and suppliers
Total System CostBased on publically available data on FPL’s Martin Solar Plant and the cost breakdown by component is based on the 2009 UC Berkeley study on CSP.
SWH Collectors The collector pricing was based on the EIA 2009 data for medium temperature collectors. Percent sourced domestically is based on the following calculation: total U.S. manufactured collectors installed in the U.S. divided by the total installations in the U.S. (which includes imported collectors)

84 Copyright © 2011 Greentech Media
U.S. SOLAR ENERGY TRADE ASSESSMENT 2011 Photovoltaics Concentrating Solar Power Solar Heating & Cooling
SWH
TanksStorage tank price is based on data from state rebate agencies which provide system cost breakdowns. The price is a blend of one and two tank systems, and stainless and non-stainless tanks. The percent of tanks sourced domestically is based on a survey of solar water heating tank manufacturers
All other equipmentPrice is based on data from state rebate agencies which provide system cost breakdowns. The percent sourced domestically was based on conversations with pump and controller manufacturers
System CostThe total system cost came from installer data and state rebate agency data as published in the SEIA/GTM Research Solar Market Insight™ report
SPH
CollectorsThe collector pricing was based on the EIA 2009 data for low temperature collectors. Percent sourced domestically is based on the following calculation: total U.S. manufactured collectors installed in the U.S. divided by the total installations in the U.S. (which includes imported collectors)
All other equipmentOther equipment cost is based on typical system pricing and includes the pump, valves, and controller. Domestic content percentage is based on conversations with leading controller and pump manufacturers
System CostThe total system cost came from installer data and state rebate agency data as published in the SEIA/GTM Research Solar Market Insight™ report
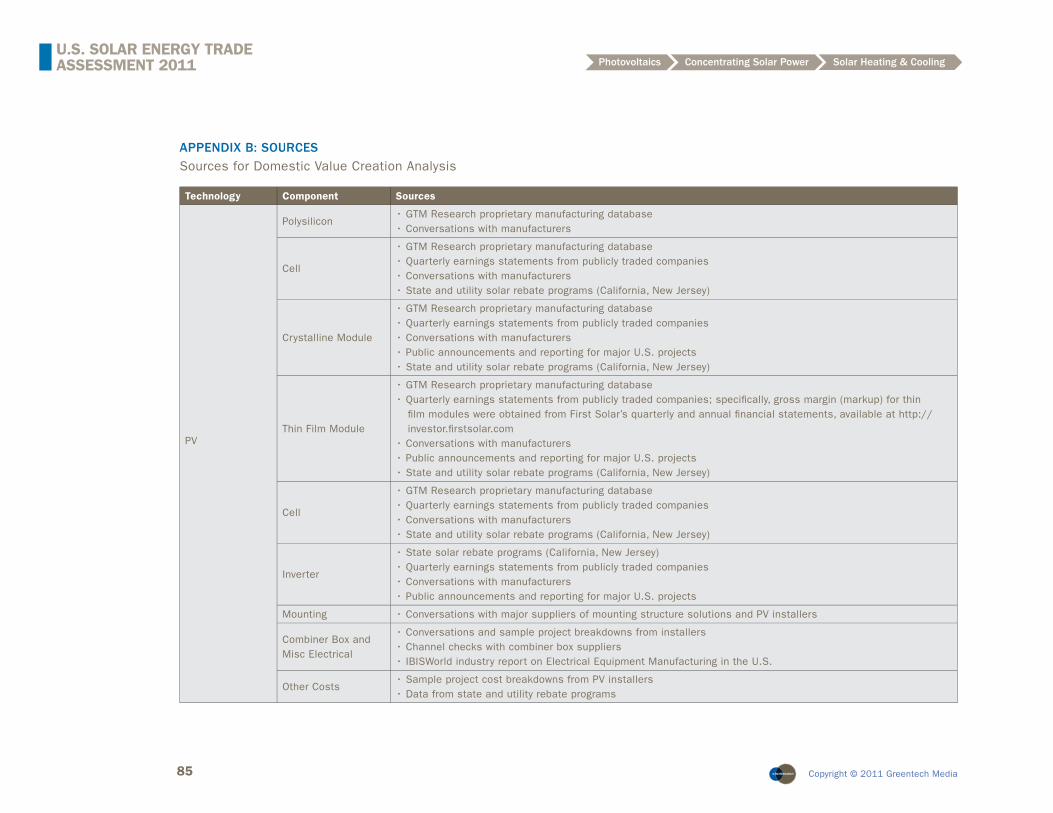
85 Copyright © 2011 Greentech Media
U.S. SOLAR ENERGY TRADE ASSESSMENT 2011 Photovoltaics Concentrating Solar Power Solar Heating & Cooling
APPENDIX B: SOURCESSources for Domestic Value Creation Analysis
Technology Component Sources
PV
Polysilicon• GTM Research proprietary manufacturing database• Conversations with manufacturers
Cell
• GTM Research proprietary manufacturing database• Quarterly earnings statements from publicly traded companies• Conversations with manufacturers• State and utility solar rebate programs (California, New Jersey)
Crystalline Module
• GTM Research proprietary manufacturing database• Quarterly earnings statements from publicly traded companies• Conversations with manufacturers• Public announcements and reporting for major U.S. projects• State and utility solar rebate programs (California, New Jersey)
Thin Film Module
• GTM Research proprietary manufacturing database• Quarterly earnings statements from publicly traded companies; specifi cally, gross margin (markup) for thin
fi lm modules were obtained from First Solar’s quarterly and annual fi nancial statements, available at http://investor.fi rstsolar.com
• Conversations with manufacturers• Public announcements and reporting for major U.S. projects• State and utility solar rebate programs (California, New Jersey)
Cell
• GTM Research proprietary manufacturing database• Quarterly earnings statements from publicly traded companies• Conversations with manufacturers• State and utility solar rebate programs (California, New Jersey)
Inverter
• State solar rebate programs (California, New Jersey)• Quarterly earnings statements from publicly traded companies• Conversations with manufacturers• Public announcements and reporting for major U.S. projects
Mounting • Conversations with major suppliers of mounting structure solutions and PV installers
Combiner Box and Misc Electrical
• Conversations and sample project breakdowns from installers• Channel checks with combiner box suppliers• IBISWorld industry report on Electrical Equipment Manufacturing in the U.S.
Other Costs• Sample project cost breakdowns from PV installers• Data from state and utility rebate programs
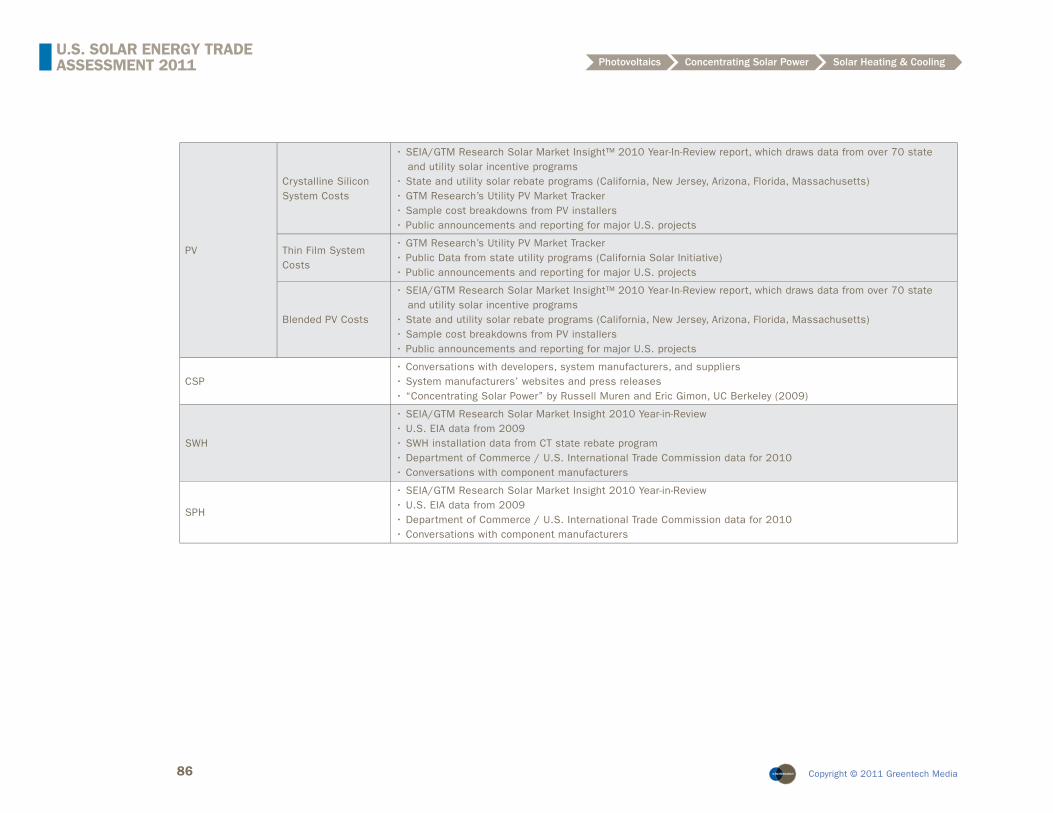
86 Copyright © 2011 Greentech Media
U.S. SOLAR ENERGY TRADE ASSESSMENT 2011 Photovoltaics Concentrating Solar Power Solar Heating & Cooling
PV
Crystalline Silicon System Costs
• SEIA/GTM Research Solar Market Insight™ 2010 Year-In-Review report, which draws data from over 70 state and utility solar incentive programs
• State and utility solar rebate programs (California, New Jersey, Arizona, Florida, Massachusetts)• GTM Research’s Utility PV Market Tracker• Sample cost breakdowns from PV installers• Public announcements and reporting for major U.S. projects
Thin Film System Costs
• GTM Research’s Utility PV Market Tracker• Public Data from state utility programs (California Solar Initiative)• Public announcements and reporting for major U.S. projects
Blended PV Costs
• SEIA/GTM Research Solar Market Insight™ 2010 Year-In-Review report, which draws data from over 70 state and utility solar incentive programs
• State and utility solar rebate programs (California, New Jersey, Arizona, Florida, Massachusetts)• Sample cost breakdowns from PV installers• Public announcements and reporting for major U.S. projects
CSP• Conversations with developers, system manufacturers, and suppliers• System manufacturers’ websites and press releases• “Concentrating Solar Power” by Russell Muren and Eric Gimon, UC Berkeley (2009)
SWH
• SEIA/GTM Research Solar Market Insight 2010 Year-in-Review• U.S. EIA data from 2009• SWH installation data from CT state rebate program• Department of Commerce / U.S. International Trade Commission data for 2010• Conversations with component manufacturers
SPH
• SEIA/GTM Research Solar Market Insight 2010 Year-in-Review• U.S. EIA data from 2009• Department of Commerce / U.S. International Trade Commission data for 2010• Conversations with component manufacturers
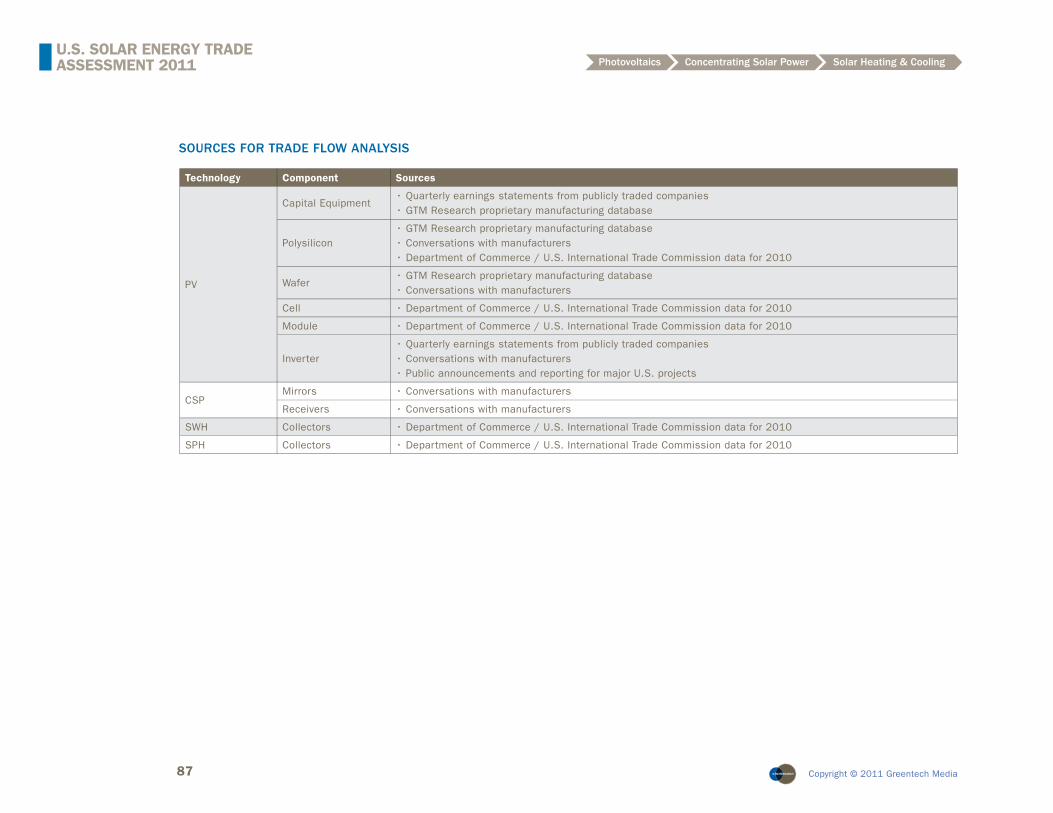
87 Copyright © 2011 Greentech Media
U.S. SOLAR ENERGY TRADE ASSESSMENT 2011 Photovoltaics Concentrating Solar Power Solar Heating & Cooling
SOURCES FOR TRADE FLOW ANALYSIS
Technology Component Sources
PV
Capital Equipment• Quarterly earnings statements from publicly traded companies• GTM Research proprietary manufacturing database
Polysilicon• GTM Research proprietary manufacturing database• Conversations with manufacturers• Department of Commerce / U.S. International Trade Commission data for 2010
Wafer• GTM Research proprietary manufacturing database• Conversations with manufacturers
Cell • Department of Commerce / U.S. International Trade Commission data for 2010
Module • Department of Commerce / U.S. International Trade Commission data for 2010
Inverter• Quarterly earnings statements from publicly traded companies• Conversations with manufacturers• Public announcements and reporting for major U.S. projects
CSPMirrors • Conversations with manufacturers
Receivers • Conversations with manufacturers
SWH Collectors • Department of Commerce / U.S. International Trade Commission data for 2010
SPH Collectors • Department of Commerce / U.S. International Trade Commission data for 2010
88 Copyright © 2011 Greentech Media
U.S. SOLAR ENERGY TRADE ASSESSMENT 2011 Photovoltaics Concentrating Solar Power Solar Heating & Cooling
OWNERSHIP RIGHTS
All Reports are owned by Greentech Media protected by United States Copyright and international copyright/intellectual property laws under applicable treaties and/or conventions. User agrees not to export any Report into a country that does not have copyright/intellectual property laws that will protect Greentech Media’s rights therein.
GRANT OF LICENSE RIGHTS
Greentech Media hereby grants User a personal, non-exclusive, non-refundable, non-transferable license to use the Report for research purposes only pursuant to the terms and conditions of this Agreement. Greentech Media retains exclusive and sole ownership of each Report disseminated under this Agreement. User agrees not to permit any unauthorized use, reproduction, distribution, publication or electronic transmission of any Report or the information/forecasts therein without the express written permission of Greentech Media. Users purchasing this report may make a Report available to other persons from their organization at the specifi c physical site covered by the agreement, but are prohibited from distributing the report to people outside the organization, or to other sites within the organization.
DISCLAIMER OF WARRANTY AND LIABILITY
Greentech Media has used its best efforts in collecting and preparing each Report.
GREENTECH MEDIA, ITS EMPLOYEES, AFFILIATES, AGENTS, AND LICENSORS DO NOT WARRANT THE ACCURACY, COMPLETENESS, CURRENTNESS, NON INFRINGEMENT, MERCHANTABILITY, OR FITNESS FOR A PARTICULAR PURPOSE OF ANY REPORTS COVERED BY THIS AGREEMENT. GREENTECH MEDIA, ITS EMPLOYEES, AFFILIATES, AGENTS, OR LICENSORS SHALL NOT BE LIABLE TO User OR ANY THIRD PARTY FOR LOSSES OR INJURY CAUSED IN WHOLE OR PART BY OUR NEGLIGENCE OR CONTINGENCIES BEYOND GREENTECH MEDIA’S CONTROL IN COMPILING, PREPARING OR DISSEMINATING ANY REPORT OR FOR ANY DECISION MADE OR ACTION TAKEN BY User OR ANY THIRD PARTY IN RELIANCE ON SUCH INFORMATION OR FOR ANY CONSEQUENTIAL, SPECIAL, INDIRECT OR SIMILAR DAMAGES, EVEN IF GREENTECH MEDIA WAS ADVISED OF THE POSSIBILITY OF THE SAME. User AGREES THAT THE LIABILITY OF GREENTECH MEDIA, ITS EMPLOYEES, AFFILIATES, AGENTS AND LICENSORS, IF ANY, ARISING OUT OF ANY KIND OF LEGAL CLAIM (WHETHER IN CONTRACT, TORT OR OTHERWISE) IN CONNECTION WITH ITS GOODS/SERVICES UNDER THIS AGREEMENT SHALL NOT EXCEED THE AMOUNT YOU PAID TO GREENTECH MEDIA FOR USE OF THE REPORT IN QUESTION.