Embed Size (px)
Citation preview

U.S. Pharmaceutical Pricing in Context:A comparison of U.S. pharmaceutical trends to U.S. health care trends, and pharmaceutical trends in major OECD countries
Wayne Winegarden, Ph.D.

Pacific Research Institute101 Montgomery Street, Suite 1300San Francisco, CA 94104Tel: 415-989-0833Fax: 415-989-2411www.pacificresearch.org
Download copies of this study at www.pacificresearch.org.
Nothing contained in this report is to be construed as necessarily reflecting the views of the Pacific Research Institute or as an attempt to thwart or aid the passage of any legislation.
©2017 Pacific Research Institute. All rights reserved. No part of this publication may be re-produced, stored in a retrieval system, or transmitted in any form or by any means, electronic, mechanical, photocopy, recording, or otherwise, without prior written consent of the publisher.

ContentS
executive Summary ..................................................................... 4
Introduction ................................................................................ 7
Pharmaceutical Pricing Complexities ............................................ 9
Inflation and expenditure trends in the U.S.: the Pharmaceutical Market Compared to the overall Health Care Industry .................. 12
the troubles with International Price Comparisons ...................... 21
Conclusion ............................................................................... 28
endnotes .................................................................................. 30

4
The growing problem of health care affordabili-ty requires prompt and effective policy solutions. However, just as the wrong medical diagnosis will not cure a patient, and may make the patient worse, the wrong policy solution will not address the U.S. health care affordability problem, and may even create additional unintended complications. Targeting pharmaceuticals as the driving force be-hind the health care affordability problem is the wrong policy solution. Such policies will not ad-dress health care affordability, and will diminish the beneficial innovations created by the pharma-ceutical industry.
the problem of list prices versus transaction prices
The misnomer that drug prices are a primary cause of the health care affordability problem persists, in part, due to the overly complex pricing system for pharmaceuticals. For example, the list prices for pharmaceuticals in the U.S. market vary, often sig-nificantly, from the drugs’ actual transaction prices. The actual transaction price (also known as the net price) are the prices including the large discounts, negotiated payments, and retrospective price re-bates that, relative to the total expenditures, are quite sizable.
For example, in 2015, retrospective rebates and discounts accounted for nearly 31 percent of to-tal drug expenditures on branded pharmaceuti-
cals.1 For comparison, the total amount of reve-nues branded manufacturers received in 2015 was 62.6 percent, with the difference being earned by wholesalers and retailers. Further, the manufac-turer’s share has been in decline – total branded manufacturers’ share of expenditures declined 4.4 percentage points between 2013 and 2015.
Due to this differentiation, evaluations that rely on the list price of pharmaceuticals, rather than the transactions price, provide a distorted view of the pharmaceutical market; just as relying on a home’s list price, as opposed to the actual sales price, can lead to misinformation regarding the housing mar-ket. Despite the importance of relying on transac-tion prices to inform policy solutions, many evalu-ations, which are often driving the pharmaceutical pricing debate, erroneously rely upon the non-rep-resentative list prices.
Pharmaceutical inflation trends are similar to health care inflation trends
Over the long term (since January 1969) health care inflation has outpaced pharmaceutical infla-tion. However, more recently, there has been an acceleration in pharmaceutical inflation relative to health care inflation. The increase in pharma-ceutical inflation is being driven by the prices of pharmaceuticals administered in hospitals, and are associated with an increase in the introduction of novel medicines.
exeCUtIve SUMMary

U.S. Pharmaceutical Pricing in Context 5
Pharmaceutical prices typically increase at a faster rate when there is an acceleration in the number of new pharmaceutical innovations, which should be expected. The data for 2016 illustrate a reduction in pharmaceutical innovations that are also associ-ated with a reduction in the pharmaceutical price increases. In other words, the recent acceleration in pharmaceutical prices is consistent with the his-torical norm of an innovation driven price accel-eration; and, as the surge in innovations is waning, the trend in pharmaceutical inflation is decelerat-ing toward its historical norm vis-à-vis health care inflation.
With respect to overall expenditures (as opposed to prices), the growth in total health care expen-ditures generally outpaced the growth in total U.S. expenditures (or GDP) since 1960; but, the total expenditures on pharmaceuticals relative to overall health care expenditures have risen and fallen in an unrelated manner. This inconsistent relationship between the change in expenditures on prescription drugs and the growth in national health care expenditures is an indication that there is no definitive association between rising phar-maceutical expenditures and rising total health care expenditures.
Taken together, these trends indicate that phar-maceuticals are not driving the health care afford-ability problem, instead systemic problems must be addressed in order to improve overall health care affordability.
Compared to pharmaceutical prices interna-tionally, higher U.S. pharmaceutical prices reflect higher U.S. health care prices
Just as insights regarding the growth in expen-ditures and prices of pharmaceuticals require the inclusion of broader perspectives, studies that compare U.S. pharmaceutical prices to the prices of pharmaceuticals in other major OECD coun-tries must also be put into proper context.
For example, there is no differentiation between list prices and transaction prices in international drug markets, while there is a significant differ-ence between these prices in the U.S. Therefore, evaluations must ensure that actual transaction prices in the U.S. are compared to actual transac-tion prices in the other major OECD countries. Unfortunately, many evaluations will compare the transaction prices in the OECD markets to the list prices in the U.S. Such evaluations pro-vide a distorted comparison between these mar-kets.
Additionally, while the U.S. health care inflation problem distorts the prices for all medical goods and services (e.g. the prices for many medical services are higher in the U.S. than the compari-son countries), many evaluations do not account for the unique health care inflation problem in the U.S.
Since January 1969, health care inflation has outpaced pharmaceutical inflation. However, more recently, there has been an acceleration in pharmaceutical inflation relative to health care inflation, which is likely being driven by the prices of pharmaceuticals administered in hospitals.

6
Beyond these issues, simple international phar-maceutical price comparisons suffer from other flaws that include relying on small subsets of drugs for the study that do not effectively rep-resent the pharmaceutical market. They also fail to account for the different market structures be-tween the U.S. and other countries such as the greater use of generic medicines in the U.S.
Based on an apples-to-apples comparison of transaction prices in the U.S., adjusted for the higher overall medical price inflation, to the transaction drug prices in the comparison coun-tries, the data indicate that the relatively higher drug prices in the U.S. simply reflect the relative-ly higher medical prices in the U.S.
the pharmaceutical pricing process needs simplification
While it is important for analyses to account for the pricing complexities in the U.S. health care market, ultimately the complicated pricing struc-ture for pharmaceuticals is problematic and di-minishes the beneficial role prices typically play in a market economy. As a consequence, reforms to the current U.S. pricing environment should es-tablish a simpler, more transparent, pricing model for pharmaceuticals that remove the current ad-verse incentives that proliferate.
For instance, currently intermediaries (i.e. Phar-macy Benefit Managers, or PBMs) have a strong financial incentive for manufacturers to charge higher list prices, but then encourage large rebates
and discounts. Eliminating the added obstacles created by the PBM model will help simplify the pricing structure and enable the list prices to more accurately reflect the actual transaction price. As another example, reimbursements for hospitals under Medicare Part B are currently connected to the price of the drug, also creating perverse incen-tives. Instead, reimbursements should be a flat fee based on the value of the services provided, not the cost of the drug administered. Reforms such as these will improve the incentives to efficiently price pharmaceuticals and improve the informa-tion available to doctors, pharmacists, and patients.
the health care affordability problem is sys-temic, and requires systemic reforms
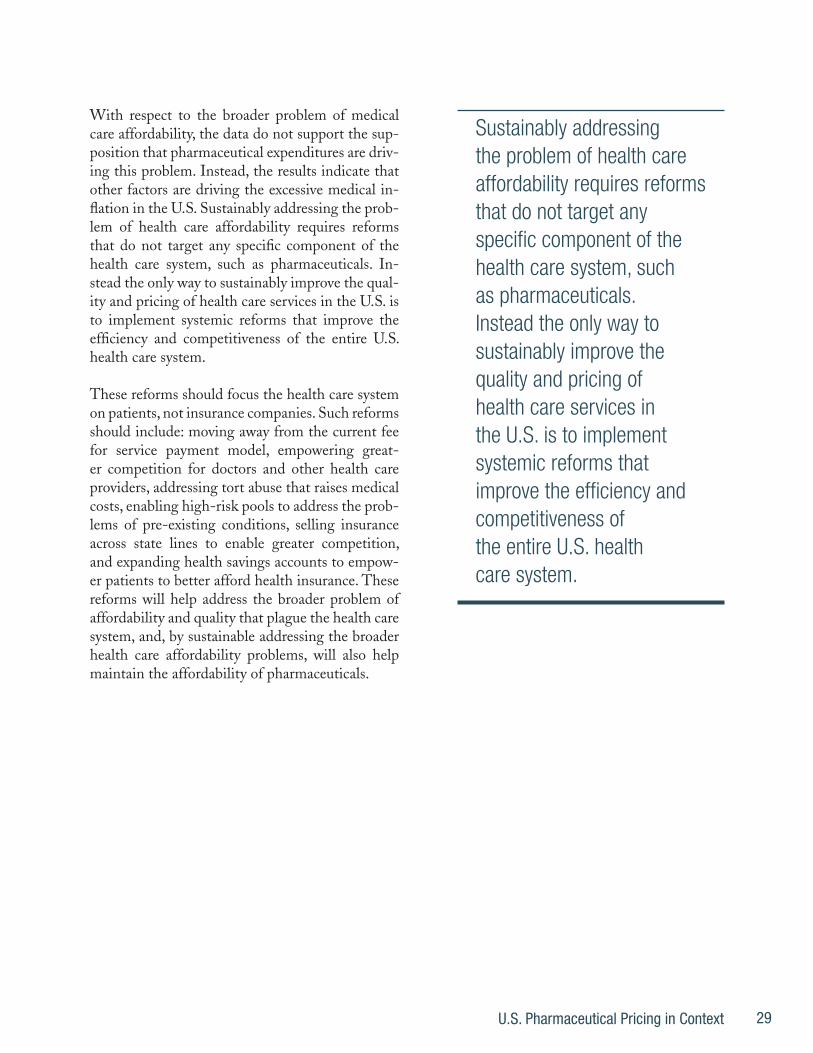
With respect to the broader medical care af-fordability problem, the data do not support the supposition that pharmaceutical expenditures are the driving factor. Sustainably addressing the problem of health care affordability requires re-forms that do not target any specific component of the health care system, but instead implement systemic reforms that improve the efficiency and competitiveness of the entire U.S. health care system.
These reforms should focus the health care sys-tem on patients, not insurance companies. Such reforms should include: moving away from the current fee for service payment model, empow-ering greater competition for doctors and other health care providers, addressing tort abuse that raises medical costs, enabling high-risk pools to address the problems of pre-existing condi-tions, selling insurance across state lines to en-able greater competition, and expanding health savings accounts to empower patients to better afford health insurance. These reforms will help address the broader problem of affordability and quality that plague the health care system. By sustainably addressing the broader health care af-fordability problems, they will also help maintain the affordability of pharmaceuticals.
relatively higher drug prices in the U.S. simply reflect the relatively higher medical prices in the U.S.

U.S. Pharmaceutical Pricing in Context 7
The growth in health care prices continues to outpace inflation; similarly, the growth in total health care expenditures outpaces overall economic growth. While an aging demographic argues that a rising share of expenditures should be devoted to-ward health care, the extreme growth discrepancies between health care expenditures and growth in the economy cannot be explained by demograph-ics alone. Instead, the U.S. health care system is plagued with a growing affordability problem.
The health care affordability problem is the exces-sive rise in overall health care costs relative to peo-ple’s ability to pay. Addressing this problem is a top policy priority that dominates health care debates; as it should. However, solutions to the affordabil-ity problem cannot be grounded in the wrong di-agnosis. Just as health care professionals can only help patients by correctly diagnosing their medical problems, health care reforms can only implement effective solutions by correctly diagnosing the root causes of the policy problems. Implementing poli-cies based on the wrong diagnosis will not only fail to address the affordability problem, it can make the bad situation worse. And this is why the argu-ments that pharmaceutical price increases are driv-ing the affordability problem are detrimental.
The growing unaffordability of health care has been a recurring problem for many years. One way to view this problem is through the excessive increases in overall medical prices. During some
of those years the growth rate of pharmaceutical prices has exceeded the growth in overall medical prices; in other years, the growth in overall medical prices has exceeded the growth in pharmaceutical prices. This lack of consistency is an indication that the affordability problem is not being driven by one sub-sector of the health care industry.
Instead, the affordability problem is caused by sys-temic flaws that afflict the entire health care system. Blaming the pharmaceutical industry, a sub-sector of the health care industry, for a structural problem that afflicts the entire health care system, will not lead to sustainable solutions to the health care af-fordability problem. It will, however, risk the inno-vations and benefits created by the pharmaceutical industry.
If the rising prices for pharmaceuticals are not the root cause of the affordability problem, then an important question arises: Why is the misnomer that drug prices are a primary cause of the medical care affordability problem widely held? Part of the answer is the complexities of the pharmaceutical pricing process. Current pricing practices encour-age misunderstandings because it is difficult to observe the actual transaction prices. Therefore, a better understanding of the pharmaceutical pricing process is a precondition for understanding why increasing expenditures on pharmaceuticals are not causing the overall health care affordability prob-lem.
IntroDUCtIon
8
The first section of this paper reviews the phar-maceutical pricing process in order to provide this perspective. Analyses typically use list prices to evaluate the growth in pharmaceutical prices, but list prices do not represent the transaction price a payer or patient paid to receive the medicine. The actual transaction prices paid reflect the manufac-turer discounts and rebates that substantially re-duce the list prices paid and substantially alters the overall price growth trend.
The next section examines domestic data on health care inflation and expenditures to illustrate the similarity between the growth in overall health care expenditures and prices, and the growth in phar-maceutical expenditures and prices. This similarity between pharmaceutical spending and total health care spending holds when applied to international health care expenditure comparisons, which is ex-amined in the third section.
Comparing U.S. prices for pharmaceuticals to pric-es for pharmaceuticals in other major economies is a common research practice. However, these com-parisons suffer from important flaws. Typical flaws that plague the international comparisons include: relying on a small subset of drugs for the study; comparing list prices in the U.S. (which do not reflect actual transaction prices paid) to the actual transaction prices in other countries; and, failing to account for the different market structures between the U.S. and other countries (e.g. the greater use of generic medicines in the U.S. compared to other countries). Adjusting for these flaws illustrates that the excessively high pharmaceutical prices in the U.S. are consistent with the excessively high prices for health care more broadly.
There are several important implications for the pharmaceutical market, and for the broader health care industry, based on these insights, which are summarized in the conclusion to the paper.
Measuring pharmaceutical prices is complex and care must be taken to ensure that the prices eval-uated reflect the actual transaction prices paid by payers and patients. Similarly, the aforementioned flaws that often arise when comparing pharmaceu-tical prices internationally need to be addressed, otherwise international comparisons provide more misinformation than information.
While it is important to account for these pricing complexities, the unjustifiably complicated pricing structure for pharmaceuticals is problematic and diminishes the beneficial role prices play in a mar-ket economy. Typically, in a vibrant market, pric-es convey essential information regarding scarcity and value. Instead of providing this information clearly, the current complex pricing structures ob-fuscate this vital information. Reforms to the cur-rent pricing environment that focus on establishing a simpler, more transparent, pricing structure for pharmaceuticals would, consequently, improve the efficiency of the pharmaceutical market.
With respect to the broader problem of medi-cal care affordability, the data do not support the supposition that pharmaceutical expenditures are driving this problem. Instead, the results indicate that other factors are driving the excessive med-ical inflation in the U.S. Sustainably addressing the problem of health care affordability requires reforms that do not target any specific component of the health care system, such as pharmaceuti-cals. Instead the only way to sustainably improve the quality and affordability of health care services in the U.S. is to implement systemic reforms that improve the efficiency and competitiveness of the entire U.S. health care system.

U.S. Pharmaceutical Pricing in Context 9
In some ways, the pharmaceutical industry looks like any other market. Manufacturers produce pharmaceuticals and sell these medicines to whole-salers (or very large retailers), who sell the product to retail pharmacies (if the medicine was originally sold to a wholesaler), who then sells the product to the ultimate consumer. Along this retail chain, each player performs a specific value-added task. In other words, manufacturers produce the product, wholesalers distribute the product, and retail phar-macies sell the product to the consumer.
Unlike this normal supply chain for the product, the payment flows in the U.S. pharmaceutical mar-ket have little in common with most other markets, due in part to the third-party payer system. The Kaiser Family Foundation (2005) created a useful illustration of the complex pharmaceutical finan-cial flows, which is reproduced as Figure 1.
Unlike this normal supply chain for the product, the payment flows in the U.S. pharmaceutical market have little in common with most other markets, due in part to the third-party payer system.
PHarMaCeUtICal PrICIng CoMPlexItIeS

10
As opposed to a simple flow of payments from consumers to producers, Figure 1 illustrates a com-plex web of payment sources, discounts, and re-bates that obscures the actual prices of medicines. Specifically, while some consumers may directly pay for their medicines, most consumers will pay only a small portion of the medicine’s cost via a copay. Insurers (either private or public) will then pay the lion’s share of the cost. The insurer then re-ceives its income from either the premiums paid by the consumers or their employers (if the consumer has private insurance), or from tax revenues paid by taxpayers (if the consumer has public insurance, not illustrated in Figure 1).
While insurers will pay for the majority of the costs, they will not typically pay the pharmacy or drug manufacturer directly. Instead, insurers will typically work through a pharmacy benefit man-ager (or PBM) who negotiates prices on behalf of the insurer and will physically pay the pharmacies and manufacturers. Both wholesalers and retail pharmacies will also directly pay manufacturers for medicines, as would be the case in a typical market.
Further complicating these relationships, drug manufacturers will often directly offset the list price of the medicines sold with discounts, negoti-ated payments, and retrospective price rebates that
Figure 1 Flows of Goods and Financial Transactions in the U.S. Commercial Pharmaceutical Supply Chain
EMPLOYER/PLAN SPONSOR OR HEALTH
INSURER
PHARMACY BENEFIT MANAGER
PHARMACY (Retail, Mail-order)
DRUG MANUFACTURER
DRUG WHOLESALER/DISTRIBUTOR
Payment Flow Rebate Flow
Product Flow
Premium
Negotiated Paym
ent
Mem
ber Cost Share or Paym
ent for Drug if Cash Pay
Prompt Pay,
Volume Discounts
Negotiated Paym
ent
CONSUMER
Reproduced from: The Health Strategies Consultancy (2005) “Follow the Pill: Understanding the U.S. Commercial Pharmaceutical Supply Chain” The Kaiser Family Foundation, March.

U.S. Pharmaceutical Pricing in Context 11
are paid to the pharmacy benefit managers, whole-salers, and retailers. Relative to the total gross ex-penditures, these payments and discounts are siz-able.
In 2015, retrospective rebates and discounts ac-counted for nearly 31 percent of total gross drug expenditures on branded pharmaceuticals, or $106.4 billion out of gross expenditures of $349.1 billion.2 For comparison, the total amount of reve-nues branded manufacturers received in 2015 was $218.6 billion, or 62.6 percent of total gross drug expenditures, with the difference being earned by wholesalers and retailers. The manufacturer’s share of gross expenditures has been in decline over the past several years. Total branded manufacturer’s share of gross expenditures in 2013 was 67.0 per-cent – 4.4 percentage points lower today than in 2013. Including both branded and generic medi-cines non-manufacturing entities received 42 per-cent of the initial gross drug expenditures in 2015. This figure has also been rising for the past three years.3
With respect to pharmaceutical price inflation, us-ing the trends in gross (or list) price changes ver-sus the trends in net (or transaction) price changes make a large difference. For example, according to Express Scripts (the largest pharmacy benefit manager in the U.S.),
average list prices for brand drugs rose 10.7 percent in 2016. How-ever, unit prices for medications purchased by our clients rose just 2.5 percent, 22 percent less than the rate of increase seen in 2015 and more than 60 percent lower than the increase in prices, net of rebates, recently reported by major drug makers.4
In other words, an analyst calculating the increase in pharmaceutical prices in 2016 based on the list prices of medicines would claim that there was in-flation of 10.7 percent. The inflation rate that these
patients actually experienced was 75 percent small-er – only 2.5 percent.
A similar pattern holds with respect to expendi-tures. According to Express Scripts, their “clients … saw spending on prescription drugs in 2016 in-crease 3.8 percent per person.”5 Again, a 3.8 per-cent increase is smaller than the headline list price increases would seem to indicate.
The discrepancy between the net price increase Express Scripts clients experienced (the actual transaction price) and the average list price in-crease Express Script cited exemplifies that the amount of measured inflation will vary depending upon which price is examined. However, as the Express Scripts quote indicates, the prices that im-pact consumers, payers, and manufacturers are the net prices, not the list prices.
As a consequence, when examining the cost trends for pharmaceuticals, it is the trends in net prices that are relevant, not the trends in list prices. Un-fortunately, because effective net prices are more difficult to calculate than list prices, often it is the trends in list prices that are driving the pharma-ceutical pricing debate. These prices provide inac-curate information regarding the pharmaceutical market.
as a consequence, when examining the cost trends for pharmaceuticals, it is the trends in net prices that are relevant, not the trends in list prices.

12
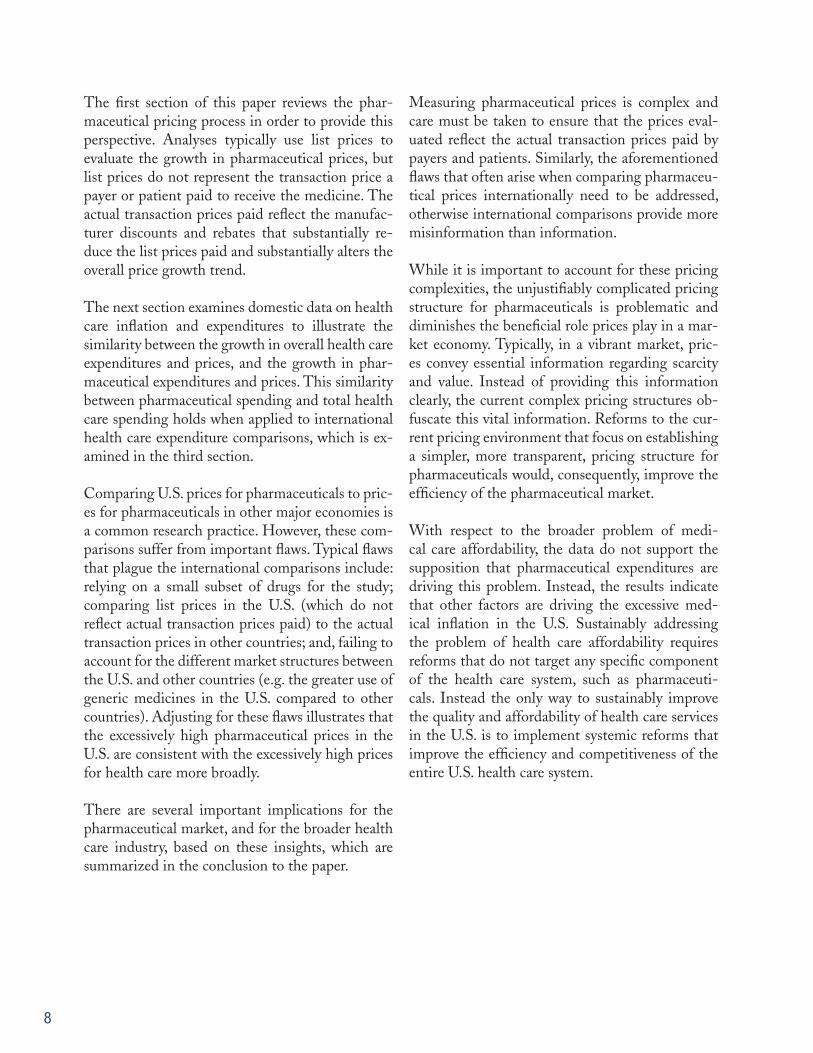
Health care price increases have continually outpaced the growth in overall inflation for many years. Between 1969 and 1981, the average growth in medical care inflation was slightly higher (0.3 percentage points more) than the average growth in overall consumer inflation (Consumer Price Index, CPI). How-ever, starting around 1981 medical care inflation accelerated relative to overall inflation, and consequent-ly, grew 2.3 percentage points faster than overall inflation, on average, between 1981 and 2016. Thus, by December 2016, medical prices were 1,400 percent higher than January 1969, compared to overall prices being up by 578 percent, see Figure 2.
Figure 2 Cumulative Medical Price Inflation Compared to Cumulative Consumer Inflation January 1969 through December 2016
578.2%
1419.2%
CPI-All Items CPI-Medical Care
Source: Bureau of Labor Statistics
InflatIon anD exPenDItUre trenDS In tHe U.S.: tHe PHarMaCeUtICal Market CoMPareD to tHe overall HealtH Care InDUStry

U.S. Pharmaceutical Pricing in Context 13
It is also instructive to break down the trends in overall health care inflation to compare the infla-tion trends of pharmaceuticals to the overall medi-cal care inflation rate. If the growth in pharmaceu-tical prices are driving overall medical care inflation over the long term, then it should be the case that pharmaceutical price increases are larger than over-all medical care inflation, over the long term. Data collected by the Bureau of Labor Statistics (BLS) indicate that this is not the case.
The BLS tracks the growth of prices for pharma-ceuticals as part of the CPI. With respect to mea-suring the change in pharmaceutical prices, the BLS
…collects transaction prices re-ceived by the retail pharmacy. If a particular prescription observation is paid for by a third-party payer, then the total price used in index calculation will include both the patient’s copayment as well as the insurance reimbursed portion. The three eligible types of payers are: 1) cash, 2) insurance, and 3) Medicare Part D. Medicaid is not eligible be-cause there are typically no insur-ance premiums required to obtain care as a Medicaid beneficiary.6
However, “prescription drugs that are administered in a hospital setting and billed by the hospital as a component part of a larger service will not be priced in the CPI prescription drug index.”7 The pharmaceutical component of the Producer Price Index (PPI), which measures the manufacturer’s first transaction price accounting for rebates, does incorporate prescription drugs administered in a hospital setting. Biologic medicines are measured separately, however.
Due to the slightly different coverage between the CPI and the PPI, tracking the pharmaceuti-cal component of both the CPI and the PPI pro-vides important, but slightly different, information regarding the trends in pharmaceutical inflation. Figure 3 compares the growth of the overall med-ical care component of the CPI to the growth of the pharmaceutical component of the CPI, as well as the pharmaceutical component of the PPI to in-corporate the impact from in-hospital drug pricing. Figure 3 illustrates that over the long term (since January 1969) overall medical inflation, which has outpaced overall inflation, also outpaced inflation in pharmaceutical drugs as measured by the CPI (which excludes hospital administered drugs) and the PPI (which includes hospital administered drugs).
thus, by December 2016, medical prices were 1,400 percent higher than January 1969, compared to overall prices being up by 578 percent, see figure 2.
14
Figure 3 Cumulative Medical Price Inflation (CPI) Compared to Cumulative Pharmaceutical Inflation (CPI & PPI) January 1969 through December 2016
1419.2%
1010.1% 1048.9%
CPI-Medical Care CPI-Prescription Drugs
PPI Drugs and pharmaceuticals
Source: Bureau of Labor Statistics
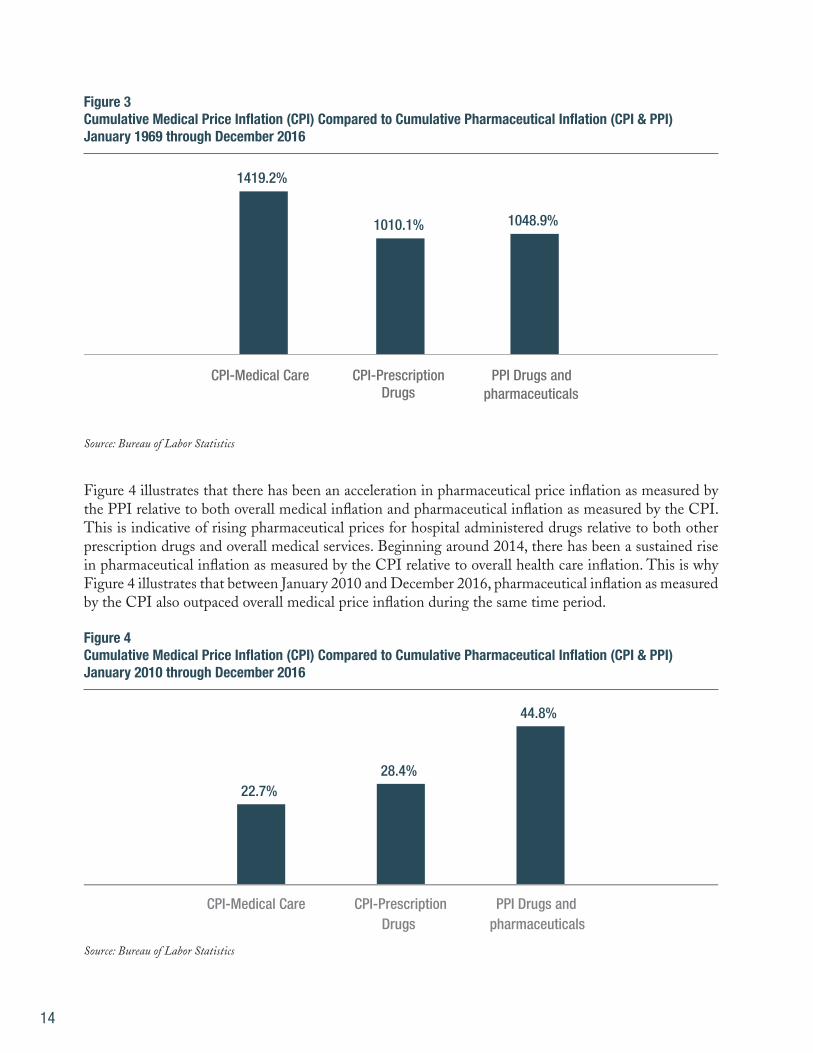
Figure 4 illustrates that there has been an acceleration in pharmaceutical price inflation as measured by the PPI relative to both overall medical inflation and pharmaceutical inflation as measured by the CPI. This is indicative of rising pharmaceutical prices for hospital administered drugs relative to both other prescription drugs and overall medical services. Beginning around 2014, there has been a sustained rise in pharmaceutical inflation as measured by the CPI relative to overall health care inflation. This is why Figure 4 illustrates that between January 2010 and December 2016, pharmaceutical inflation as measured by the CPI also outpaced overall medical price inflation during the same time period.
Figure 4 Cumulative Medical Price Inflation (CPI) Compared to Cumulative Pharmaceutical Inflation (CPI & PPI) January 2010 through December 2016
22.7% 28.4%
44.8%
CPI-Medical Care CPI-Prescription Drugs
PPI Drugs and pharmaceuticals
Source: Bureau of Labor Statistics

U.S. Pharmaceutical Pricing in Context 15
Figure 5 Total National Health Care Expenditures as a Percentage of GDP 1960 through 2015
5.0% 6.2%
7.2% 8.3%
10.1%
13.3%
15.4%
17.3% 17.8%
1960
19
62
1964
19
66
1968
19
70
1972
19
74
1976
19
78
1980
19
82
1984
19
86
1988
19
90
1992
19
94
1996
19
98
2000
20
02
2004
20
06
2008
20
10
2012
20
14
Total NHE % GDP
Source: Centers for Medicare and Medicaid Services
Figure 4 illustrates that the recent acceleration in pharmaceutical inflation as measured by the PPI is significantly larger than the even more recent ac-celeration in pharmaceutical inflation as measured by the CPI. The acceleration in pharmaceutical inflation as measured by the PPI began in 2012, whereas the acceleration in pharmaceutical infla-tion as measured by the CPI began in 2014. These trends indicate that the acceleration in pharmaceu-tical inflation is likely being driven by the prices of pharmaceuticals administered in hospitals rather than pharmaceuticals taken at home. Concurrent with the rising prices, and perhaps partly respon-sible, the trend for hospitals to acquire physician practices increased, shifting more in-practice med-icines to the costlier hospital billing system.8 More broadly, these data also indicate that, taking a long-term view (since 1969), pharmaceutical inflation is smaller than overall medical care inflation.
A similar dynamic also holds for expenditures (see Figure 5). The growth in total health care expen-ditures has been, generally, outpacing the growth in total U.S. expenditures (or GDP) since 1960. Figure 5 also presents the average growth rate in national health care expenditures as a percentage of GDP (represented by the yellow dotted line in Figure 3). The growth rate in national health care expenditures has, obviously, not been constant over time. During some periods, particularly the mid- to late-1990s, national health expenditures shrank relative to GDP. However, each period of moder-ating health expenditures has been followed by a return to the long-term growth trend. As report-ed by the Altarum Institute, total national health care expenditures continued to grow relative to the economy through 2016, reaching 18.2 percent as of December, 2016.9

16
Preliminary data for 2016 indicate that the accel-eration in pharmaceutical expenditures that began in 2012 may be slowing down. The health care ex-penditure data as of December 2016 collected by the Altarum Institute found that prescription drug expenditures grew 4.0 percent through December 2016, a deceleration from the 2015 growth rate of 5.8 percent, and less than the overall growth in na-tional health care expenditures of 4.9 percent. For comparison, the growth rate of hospital expendi-
tures as of December 2016 was 5.3 percent, and the growth rate of physician expenditures was 4.8 percent.10
Figures 5 and 6, in combination, illustrate that there have been many inconsistencies between in-creased expenditures on pharmaceuticals and ris-ing overall health care expenditures. For instance, while pharmaceutical expenditures as a share of
Consistent with the recent relative rise in pharma-ceutical inflation, total expenditures on pharma-ceuticals have been rising relative to total national health care expenditures as of late, see Figure 6. But, this rise followed several years of a decline in pharmaceuticals share of national health care ex-penditures. In fact, Figure 6 illustrates that there have been several distinct trends with respect to pharmaceuticals’ relative share of national health expenditures. Between 1960 and 1981, pharma-ceuticals’ share of national health expenditures was
generally declining – from 9.8 percent of national health care expenditures in 1960 to a 55-year low of 4.5 percent of expenditures in 1981. Pharmaceu-tical expenditures then generally grew relative to national health expenditures, with a pause during the 1990s and rising to a peak of 10.4 percent in 2006. Following another decline through 2013, pharmaceutical spending began increasing relative to overall national health care expenditures. This is consistent with the increase in pharmaceutical inflation relative to overall medical inflation.
Figure 6 Pharmaceutical Expenditures as a Percentage of National Health Care Expenditures 1960 through 2015
0.0%
2.0%
4.0%
6.0%
8.0%
10.0%
12.0%
1960
1962
1964
1966
1968
1970
1972
1974
1976
1978
1980
1982
1984
1986
1988
1990
1992
1994
1996
1998
2000
2002
2004
2006
2008
2010
2012
2014
Prescription drugs % national health expenditures
Source: Centers for Medicare and Medicaid Services and the Bureau of Economic Analysis
U.S. Pharmaceutical Pricing in Context 17
Figure 7 Growth in Pharmaceutical Expenditures as a Share of National Health Care Expenditures Compared to Growth in National Health Care Expenditures as a Share of GDP 1960 through 2015
(1.00)
(0.50)
-
0.50
1.00
1.50
2.00
2.50
3.00
1960
19
62
1964
19
66
1968
19
70
1972
19
74
1976
19
78
1980
19
82
1984
19
86
1988
19
90
1992
19
94
1996
19
98
2000
20
02
2004
20
06
2008
20
10
2012
20
14
Cumulative Change in National Health Expenditures as a % of GDP Cumulative Change in Prescription Drugs % National Health Expenditures
Source: Centers for Medicare and Medicaid Services and the Bureau of Economic Analysis
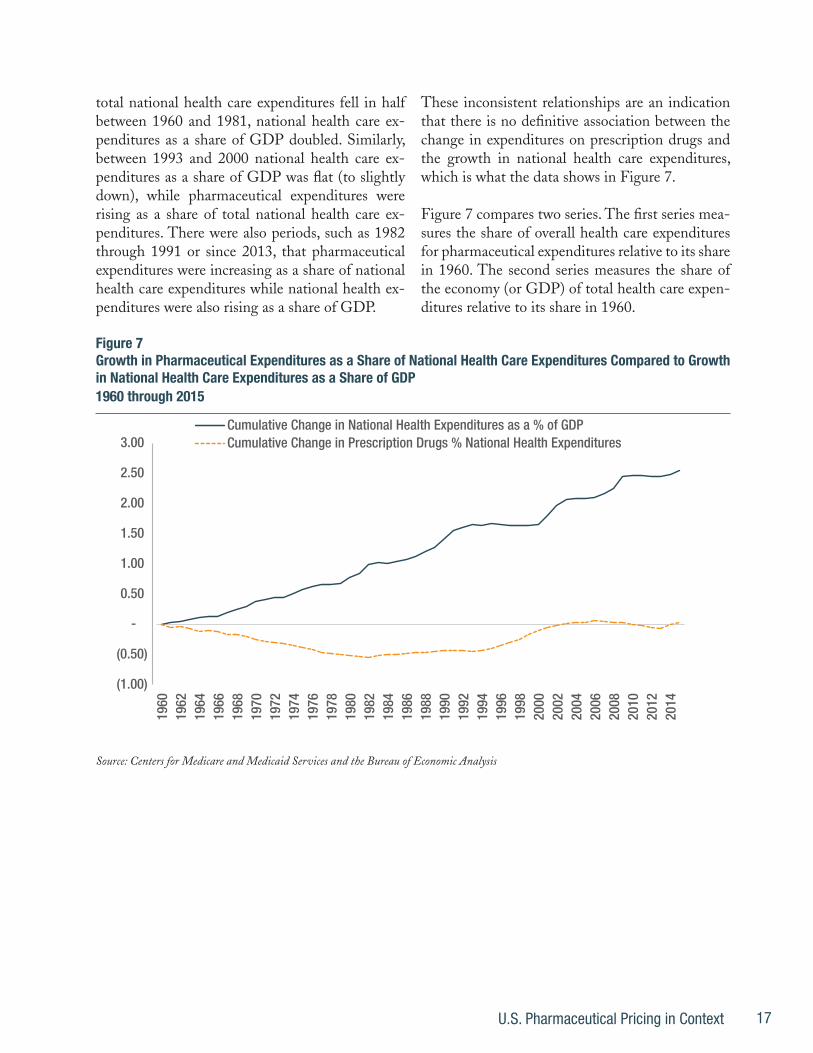
total national health care expenditures fell in half between 1960 and 1981, national health care ex-penditures as a share of GDP doubled. Similarly, between 1993 and 2000 national health care ex-penditures as a share of GDP was flat (to slightly down), while pharmaceutical expenditures were rising as a share of total national health care ex-penditures. There were also periods, such as 1982 through 1991 or since 2013, that pharmaceutical expenditures were increasing as a share of national health care expenditures while national health ex-penditures were also rising as a share of GDP.
These inconsistent relationships are an indication that there is no definitive association between the change in expenditures on prescription drugs and the growth in national health care expenditures, which is what the data shows in Figure 7.
Figure 7 compares two series. The first series mea-sures the share of overall health care expenditures for pharmaceutical expenditures relative to its share in 1960. The second series measures the share of the economy (or GDP) of total health care expen-ditures relative to its share in 1960.

18
If expenditures on prescription drugs were driving the affordability problem, then there should be a positive relationship between these two lines – as national health expenditures continue to grow as a share of the economy, prescription drug expen-ditures should be growing as a share of national health expenditures. Instead, the two series are experiencing completely different patterns over time. Whereas a consistent growth pattern in na-tional health expenditures’ share of the economy is evident in Figure 7, pharmaceutical expenditures share of health expenditures are around their 1960 level. The lack of an association between these two series is an indication that rising relative pharma-ceutical expenditures are not driving the growth in rising overall health care expenditures.
The data reviewed above illustrate another im-portant trend. While there are periods where ex-penditures and prices on pharmaceuticals acceler-ate, they are generally followed by periods where expenditures and prices on pharmaceuticals are flat or declining. Importantly, the typical period of a deceleration in pharmaceutical expenditures appears to be forming following the upsurge that began in 2012. Assuming this pattern holds, then pharmaceutical expenditures appear to be return-ing to their long-term trend of following the pat-terns for overall medical care spending.
This long-term consistency between the growth in pharmaceutical prices and the growth in over-all health care prices makes theoretical sense as well. The prices of pharmaceuticals, like the prices of most economic goods, reflect the value of the product to consumers. This value is dependent upon the costs of the alternatives, which in the case of pharmaceuticals will include the costs of other treatment options. These alternative treatment options are broadly represented by the growth in overall health care prices. As a consequence, the-oretically speaking, the growth in pharmaceutical prices should be connected to the growth in over-all health care prices. What holds for pharmaceu-tical prices also holds for other sub-components of the health care system as well.
The implication from these domestic price and expenditure trends, which is discussed further in the conclusion, is that sustainably addressing the excessive health care inflation problem requires reforms that address the health care system’s sys-temic problems. Focusing on the costs of any indi-vidual component is a distraction that encourages policies that will not address the root causes of the broader health care affordability problem.
a Quick Digression on Innovation
While there is no definitive relationship between rising pharmaceutical expenditures and the health care affordability problem, there is a relationship between rising pharmaceutical expenditures (and rising pharmaceutical prices) and increases in pharmaceutical innovation that are important to note. Figure 8 illustrates the correlation between excess growth in pharmaceutical price increases relative to overall medical inflation and a relatively higher number of novel new medicines approved by the FDA.11 Figure 9 illustrates this relationship with respect to expenditures.
the implication from these domestic price and expenditure trends, is that sustainably addressing the excessive health care inflation problem requires reforms that address the health care system’s systemic problems.

U.S. Pharmaceutical Pricing in Context 19
Figure 8 Excess Growth in Pharmaceutical Inflation Relative to Overall Medical Inflation Compared to New Molecular Entities (NME) Approved Relative to Average Approvals 1960 through 2016
(20.00)
(10.00)
-
10.00
20.00
30.00
-10.0%
-5.0%
0.0%
5.0%
10.0%
15.0% 19
60
1962
19
64
1966
19
68
1970
19
72
1974
19
76
1978
19
80
1982
19
84
1986
19
88
1990
19
92
1994
19
96
1998
20
00
2002
20
04
2006
20
08
2010
20
12
2014
20
16
Inflation: Pharmaceutical Less All Medical Care (LHS)
NMEs Approved Relative to Average Approved (RHS)
Source: FDA and Bureau of Labor Statistics
Figure 9 Excess Growth in Pharmaceutical Expenditures Relative to Overall Medical Expenditures Compared to New Molecular Entities (NME) Approved Relative to Average Approvals 1960 through 2016
(20.00)
(10.00)
-
10.00
20.00
30.00
-10.0%
-5.0%
0.0%
5.0%
10.0%
15.0%
1960
19
62
1964
19
66
1968
19
70
1972
19
74
1976
19
78
1980
19
82
1984
19
86
1988
19
90
1992
19
94
1996
19
98
2000
20
02
2004
20
06
2008
20
10
2012
20
14
2016
Expenditure: Pharmaceutical Less All Medical Care (LHS)
NMEs Approved Relative to Average Approved (RHS)
Source: FDA and Bureau of Labor Statistics
Figures 8 and 9 illustrate a close association between rising prices (Figure 8) and rising expenditures (Figure

20
9) compared to increased pharmaceutical innovation (measured as the number of new molecular entities (NMEs) approved in a year relative to the average number of NMEs approved across the entire 1960 – 2016 period). Since 1960, when there has been an uptick in NMEs approved, there also tends to be an acceleration in pharmaceutical prices and pharmaceu-tical expenditures. Such a relationship makes sense. Novel medicines will tend to be higher value branded medicines, without generic competition. Therefore, price and expenditure growth would be expected to accelerate following periods where large numbers of new therapies are approved.
Consistent with this pattern, the recent upsurge in pharmaceutical prices and pharmaceutical expen-ditures since 2012 are associated with an upsurge in new NME approvals. Further, as the number of NME approvals declined in 2016, the acceleration in pharmaceutical prices and expenditures appears to have declined as well based on the preliminary 2016 data reported by the Altarum Institute. Therefore, the preliminary data indicate that, consistent with the slowdown in NME approvals, the growth in pre-scription drug expenditures fell in 2016 relative to the 2015 growth rate and are now, relative to other health care expenditures, growing slowly.
Accounting for the impact from innovation on phar-maceutical prices, and pharmaceutical expenditures, provides additional perspective on the lack of associ-ation between the growth in pharmaceutical expen-ditures and the growth in overall health care expen-ditures.
Overall health care expenditures will decrease during periods of increased pharmaceutical innovation if the innovations (and the resulting higher pharmaceutical expenditures) lead to larger reductions in non-phar-maceutical expenditures. For example, innovations in hepatitis C medicines can reduce the need for more expensive transplant surgeries. Due to the very large costs of these surgeries, the increased pharmaceutical expenditures may be smaller than the overall health care cost savings (due to the reduced number of sur-
geries), thereby leading to a reduction in overall health care expenditures. Importantly, under these circum-stances, it is the higher pharmaceutical expenditures that enable lower overall health care expenditures. The rising share of pharmaceutical expenditures are a sign of greater health care efficiency and savings.
It is important to note that sometimes, as in the case of hepatitis C medications, the timing of the costs and savings may differ. For instance, the costs of hep-atitis C drugs are incurred today, but the savings will occur in the future as the new medications prevent the need for future surgeries, not necessarily the need for surgeries today.
The 1990s exemplify a time when increased phar-maceutical innovation was associated with declining health care expenditures relative to GDP. Under such circumstances, pharmaceutical expenditures increase as a share of overall health care expenditures, but overall health care expenditures decline relative to the growth in the economy.
There are also other periods, such as the increase in innovation during the early 1980s and innovation be-tween 2012 and 2015, that accelerating pharmaceuti-cal expenditures were associated with accelerating to-tal health care expenditures relative to GDP. In these cases there are either no offsetting medical expenses, the offsetting expenses are less than the higher ex-penditures on the new innovative medicines, or the savings are experienced in the future.
Of course, it is unclear that these rising expenditures are a problem if the greater pharmaceutical innova-tion is associated with improved health outcomes. To the extent that the rising overall health expenditures are a sign that health outcomes are improving, this situation is not problematic. It is only if the acceler-ation in expenditures do not lead to improved health outcomes that the acceleration is problematic.

U.S. Pharmaceutical Pricing in Context 21
tHe troUbleS WItH InternatIonal PrICe CoMParISonS
Just as the domestic expenditure and price growth trends of pharmaceuticals require the broader affordability perspective, so do the studies that compare U.S. pharmaceutical prices to the prices of pharmaceuticals in other major OECD countries. Yet, many studies will make these comparisons without accounting for the broader affordabili-ty perspective. Lacking this broader perspective, the studies become a distraction from the under-lying drivers of the U.S. health care affordability problem. Ultimately, an effective apples-to-apples compari-son of prices compares net drug prices (the trans-action prices) in the U.S., adjusted for the higher overall medical price inflation in the U.S., to the transaction drug price in the comparison country. When these adjustments are made, the data indi-cate that the relatively higher drug prices in the U.S. simply reflect the relatively higher medical prices in the U.S.
Accounting for the overall medical inflation prob-lem in the U.S. is important because the rising cost problems that plague the U.S. health care system do not impact other countries to the same ex-tent.12 While expenditures and prices can differ, broadly speaking the relatively larger health care inflation problem in the U.S. can be visualized by comparing the growth in total U.S. health expenditures per capita to the growth in aver-age health expenditures per capita in the other OECD countries. Since 1970, the expenditures per capita in the U.S. have been significantly higher than the aver-age of the other OECD countries, see Figure 10. As of 1970, for example, per capita expenditures on health care in the U.S. were the second high-est among the OECD economies, and 96 percent larger than the median per capita expenditures for the other OECD countries ($327 in the U.S. com-pared to a median per capita expenditure of $167).

22
Following a decline in the U.S.’ relatively higher expenditure burden through 1975, the growth in health expenditures per capita in the U.S. has sig-nificantly outpaced the growth in health expendi-tures per capita in the other major OECD coun-tries. By 1977, U.S. expenditures per capita became the highest of the OECD countries (overtaking Switzerland), and this accelerated growth persist-ed through the 1990s. U.S. health care expenditure levels then generally maintained their inflated levels (albeit a slight downward trend) through 2015. As of 2015, U.S. per capita expenditures were $9,451 or 150 percent larger than the average OECD ex-penditures per capita of $3,787.
Due to this broad cost differential, it should be ex-pected that expenditures on any specific category of health care spending should be higher in the U.S. compared to the expenditures in other major OECD countries. And, not surprisingly, the phar-
maceutical expenditure discrepancy is consistent with these overall medical expenditure trends, as indicated in Figure 11.
Figure 11 illustrates that, while both total U.S. health care expenditures per capita and U.S. phar-maceutical expenditures per capita are significantly higher than the median OECD country, the exces-sive spending is much larger for overall health care expenditures than expenditures on pharmaceuti-cals. And, while a significant spike in per capita pharmaceutical expenditures are evident in 2014 (the latest data available for pharmaceutical spend-ing from the OECD), the declining expenditure trends in the U.S. in 2016 indicate that it is un-likely that this trend has persisted through today. Therefore, on a per capita expenditure basis, the excessive expenditures on pharmaceuticals in the U.S. are, at most, consistent with the overall U.S. health care affordability problem.
Figure 10 U.S. Total Health Care Expenditures per capita Relative to Median Health Care Expenditures per capita for OECD Countries 1970 through 2015
0.0%
20.0%
40.0%
60.0%
80.0%
100.0%
120.0%
140.0%
160.0%
180.0%
200.0%
1970
1972
1974
1976
1978
1980
1982
1984
1986
1988
1990
1992
1994
1996
1998
2000
2002
2004
2006
2008
2010
2012
2014
Source: OECD

U.S. Pharmaceutical Pricing in Context 23
This comparison of the overall expenditure trends indicates that studies that compare U.S. pharma-ceutical expenditures to pharmaceutical expendi-tures in the other OECD countries, but do not account for the higher costs endemic to the entire U.S. health care system, are suspect at best. For ex-ample, PBS NewsHour reported in 2014 that the OECD per capita expenditure data shows the U.S. spends more than double the amount on phar-maceuticals than the OECD average “around 40 percent more than the next highest spender, Can-ada, and more than twice as much as countries like France and Germany spend.”13 The story cites greater use of pharmaceuticals in the U.S., as well as greater access to medicines, as reasons for the U.S. expenditure discrepancy.14
True enough. But, what is also relevant is the over-all excessive health care expenditures paid in the U.S. Per capita health expenditures in the U.S. were
139 percent more expensive (more than double) than the OECD average. In other words, the PBS NewsHour story was citing the pharmaceutical data presented in Figure 11 without mentioning the rest of the story. The rest of the story indicates that total U.S. spending on health care, both pharma-ceuticals and overall health care expenditures, were more than double the per capita spending in the average OECD country.
Beyond the international expenditure comparisons, studies also directly compare prices international-ly; however, many of these comparisons will com-mit errors that overstate the price discrepancies between the U.S. and other countries. Similar to the problem of expenditure comparisons, one error that arises is failing to account for the price dis-crepancies for overall health care services between the U.S. and other OECD countries.
Figure 11 U.S. Total Health Care Expenditures Relative to OECD Total Health Care Expenditures Compared to U.S. Phar-maceutical Expenditures Relative to OECD Pharmaceutical Expenditures 1970 through 2015
0.0%
20.0%
40.0%
60.0%
80.0%
100.0%
120.0%
140.0%
160.0%
180.0%
200.0%
1970
1972
1974
1976
1978
1980
1982
1984
1986
1988
1990
1992
1994
1996
1998
2000
2002
2004
2006
2008
2010
2012
2014
U.S. Expenditure Premium: Total Health Care
U.S. Expenditure Premium: Pharmaceuticals
Source: OECD
24
Squires and Anderson (2015) corrected for this flaw by documenting the price discrepancies be-tween the U.S. and other countries across a wide range of medical services, including pharmaceuti-cals. With respect to the prices for non-pharma-ceutical medical services, Squires and Anderson (2015) noted that the
data published by the Interna-tional Federation of Health Plans suggest that hospital and physi-cian prices for procedures were highest in the U.S. in 2013. The average price of bypass surgery was $75,345 in the U.S. This is more than $30,000 higher than in the second-highest country, Australia, where the procedure costs $42,130. According to the same data source, MRI and CT scans were also most expensive in the U.S. While these pricing data are subject to significant method-ological limitations, they illustrate a pattern of significantly higher prices in many areas of U.S. health care.15
Squires and Anderson (2015) also confirmed that the price discrepancies for pharmaceuticals are within range of the price discrepancies in overall health care noting that:
Other studies have observed high U.S. prices for pharmaceuticals. A 2013 investigation by Kanavos and colleagues created a cross-national price index for a basket of wide-ly used in-patent pharmaceuti-cals. In 2010, all countries studied had lower prices than the U.S. In Australia, Canada, and the Unit-ed Kingdom, prices were about 50 percent lower.16
Pharmaceutical prices that are 50 percent lower in other countries are similar to the price gaps cited for MRIs and CT scans. Put more simply, Squires and Anderson (2015), confirming results from Squires (2012), are illustrating that the pricing is-sues between the U.S. and other countries are a systemic problem.17 Since higher health care pric-es are not unique to the pharmaceutical market, focusing solely on a comparison of pharmaceuti-cal prices provides a distorted picture of the actual affordability problems facing the U.S. health care system.
Beyond the broader pricing trends, simple inter-national pharmaceutical price comparisons suffer from other flaws that include comparing interna-tional transaction prices to list prices in the U.S. that do not reflect actual transaction prices. They rely upon a small subset of drugs for the study that either do not effectively represent the pharmaceu-tical market. Additionally, they fail to account for the different market structures between the U.S. and other countries such as the greater use of ge-neric medicines in the U.S.
Danzon (2000) leveled similar critiques against two government-sponsored studies (a congressio-nal report by the minority staff and a Government Accountability Office, GAO, report) that com-pared U.S. pharmaceutical prices to the pharma-ceutical prices in other countries. Referring to the government studies Danzon (2000) argued that the results
…are misleading because those studies are seriously flawed. First, the studies relied on small samples of leading branded products….
A second serious flaw in the mi-nority staff report and the GAO studies was their failure to fully ac-count for volume discounts in the United States. The studies general-

U.S. Pharmaceutical Pricing in Context 25
ly used U.S. prices for single packs of products, ignoring the deep dis-counts given for the largest packs.
Finally, the minority staff report and the GAO studies arrived at their findings about relative prices by calculating the arithmetic (un-weighted) average of the prices of the 10 drugs in the United States, Canada, and Mexico. The use of unweighted averages is inconsistent with accepted indexing methods.18
Danzon (2000) found that price comparisons that do not adjust for these flaws will provide a distorted view of the discrepancies between U.S. pharmaceutical prices and pharmaceutical prices in other countries. Importantly, Danzon showed that adjusting for these flaws significantly reduced the average price discrepancies between the U.S. and other countries.
Similarly, Kanavos and Vandoros (2011) found that “the evidence shows that retail prices for branded prescription medicines in the Unit-ed States are higher than those in key Europe-an and other OECD countries, but not as high as widely thought. Large differences in prices are mainly observed at an ex-factory level, but these are not the prices that consumers and payers pay. Cross-country differences in retail prices are actu-ally not as high as expected and, when controlling for exchange rates, these differences can be even smaller.”19
In a more recent analysis, Kanavos et al. (2013) found “…that depending on how prices were weighted for volume across the countries, brand-name prescription drug prices were 5–198 per-cent higher in the United States than in the other countries in all three study years [2005, 2007, and 2010]. (A limitation is that many negotiated price discounts obtained in the United States may not be fully reflected in the results of this study.)”20 Since the U.S. prices do not fully reflect the price dis-
counts, the Kanavos et al. (2013) price discrepan-cies likely overstate the price differences between the U.S. and other OECD countries. Even with the price overstatements, the price discrepancies the authors found are in line with the broader ex-penditure differences between the U.S. and other OECD countries during these years.21
Other market differences also materially impact international pricing comparisons. For example, generic medicines in 2013 accounted for 84 per-cent of the total pharmaceuticals sold in the U.S.22 The average generic market share for the OECD in 2013 was 48 percent, and the generics share of the market was even smaller in countries typically used to benchmark U.S. prices including France (30 percent) and Japan (26 percent).23 Interna-tional price comparisons, which generally focus on patented medicines, therefore provide a distorted view of the actual prices patients are paying for their medicines since a majority of patients in the U.S. will take a generic medicine compared to a small minority of patients that take generic medi-cines in France and Japan.
Another important difference, often overlooked in international comparisons is the formulation dif-ferences across countries. As described by Danzon and Furukawa (2005),
Countries differ in their mix of for-mulations and in average strength (milligrams of active ingredient) per dose. Some comparison coun-tries use more liquids, parenterals,
Pharmaceutical prices that are 50 percent lower in other countries are similar to the price gaps cited for MrIs and Ct scans.

26
ophthalmics, and dermatologi-cal formulations, which typically have lower strength per unit than oral solids (tablets and capsules), the predominant form in most countries and particularly in the United States. The United States also tends to use more long-act-ing formulations, which sub-stitute “quality” for quantity of doses, leading to lower aggregate unit volume—and perhaps better patient compliance. Long-acting forms are almost 8 percent of all units in the United States, com-pared with 1–7 percent in the other countries.24
In other words, pharmaceuticals in the U.S. mar-ket tend to have a higher average strength per dose than other countries. It is important to ac-count for these strength differentiations when comparing prices because all doses are not creat-ed equal. Adjusting for this dosing differentiation across markets, as well as other important differ-ences including therapeutic mix, generic market shares, and age of compounds used, Danzon and Furukawa (2005) conclude that
A simple analysis of pharmaceu-tical spending might conclude that because U.S. per capita drug spending is higher but unit volume is lower, “it’s the prices, stupid.” For example, since Canada’s drug spending is 46 percent of U.S. spending but its unit volume is 123 percent of U.S. volume, a simple residual price calculation would conclude that Canadian prices are 37 percent of U.S. pric-es. But this analysis has shown that differences in types of drugs used confound such simple infer-ences. In fact, Canadian prices are 81 percent of U.S. prices: The residual estimate of price differ-
ences is biased upward because it ignores the U.S. tendency to use more new, expensive products.25
Unfortunately, these analyses that fail to account for the issues raised garner a great deal of atten-tion. As an example, an analysis from the Wall Street Journal dated December 1, 2015, compared prices paid internationally for select drugs to prices paid by Medicare Part B as of the third quarter of 2015 excluding “…drugs that faced generic competition in 2015 and those for which prices elsewhere weren’t available, ... The analy-sis didn’t examine Medicare’s coverage of phar-macy-dispensed drugs, known as Part D, which is run by insurance companies that don’t reveal their pricing.”26 The comparison found that the U.S. paid more for the vast majority of the drugs examined.
As is common with such comparisons, the re-sults cannot be understood without perspective. First, Medicare Part B primarily pays for drugs administered in a hospital or institutional setting. Therefore, by definition, the results cannot be applicable to the broader pharmaceutical market, only to the market for drugs administered in a hospital setting. Second, since the U.S. market relies much heavier on generic medicines than other markets, the comparison was biased to-ward those drugs that cost more in the U.S. and biased against those drugs that (because the ge-neric version is used more often in the U.S.) will cost more elsewhere. Third, excluding drugs “for which prices elsewhere weren’t available” has an unknown impact on the results – maybe making U.S. drugs look more expensive, maybe making U.S. drugs look cheaper. The impact is unknow-able because the data “weren’t available”.
Accounting for these factors, it is clear that, even assuming the comparisons were done correctly, the results cannot be extrapolated to the broader U.S. versus OECD pharmaceutical cost trends. The evaluation was solely based on randomly se-lected in-hospital drugs whose broader applica-bility is unknown.

U.S. Pharmaceutical Pricing in Context 27
As another example, a Bloomberg story dated De-cember 18, 2015 compared U.S. prices, including discounts, for eight “top-selling drugs” to the prices for these drugs in other countries.27 The analysis found that even after accounting for the price dis-counts, the prices were significantly more in the U.S. than the other countries. Of course, the price of the eight top-selling drugs are not representative of the overall prices of pharmaceutical drugs in any market – particularly due to the much larger use of generic drugs in the U.S. relative to the other coun-tries evaluated. But, even if these issues are over-looked, some of the price gaps are not unexpected given the overall U.S. affordability problem.
For instance, according to the Bloomberg report, “the analysis found that Roche Holding AG’s Her-ceptin breast cancer drug, after rebates of rough-ly 15 percent, still cost about 85 percent more in the U.S. than in other high-income countries.” As of 2015, total health care expenditures in the U.S. were 98 percent higher than the average per capita health expenditures of the higher income OECD countries that researchers will typically use for comparisons.28 The higher prices in the U.S. relative to other countries cited in Bloomberg is actually less than the higher overall health care expenditure burden in the U.S. compared to these countries. Therefore, more analysis is needed be-fore Bloomberg can conclude that there is a unique problem of excessive pharmaceutical prices in the U.S. that is separate from the broader U.S. health care affordability problem.
This synchronicity also applies to a 1991 New York Times article that reported, “according to one study, Americans paid an average of 54 percent more than Europeans for 25 commonly prescribed drugs.”29 However, based on data from the OECD, the per capita health expenditures in the U.S. was 144 percent higher than the average per capita health expenditures of the OECD countries in 1991, and 98 percent higher than the average per capita health expenditures of the higher income OECD countries in 1991.30 As a consequence, as with the Bloomberg analysis, the higher prices cited was less
than the higher overall health care expenditures in the U.S.
Comparing pharmaceutical prices across coun-tries requires adjustments. While the purpose of these comparisons is, typically, to argue that there are unique problems with the U.S. pharmaceutical market, without adjusting for the important mar-ket differences, international price comparisons do not provide useful information. When adjustments for these differences are made, the price discrepan-cy between U.S. pharmaceuticals and pharmaceu-ticals sold in other OECD countries are consistent with the overall affordability problem that plagues the U.S. health care system.

28
It is popular to assert there is drug price goug-ing based on simple comparisons between phar-maceutical prices in the U.S. and pharmaceutical prices in other countries. Such comparisons are often combined with anecdotes of large pharma-ceutical prices that, supposedly, substantiates the price gouging story further. Such simple compar-isons provide a distorted view of a very import-ant problem, however, due to the overly complex pharmaceutical pricing process.
The current third-party payer system, when com-bined with the policy of paying discounts, rebates, and other manufacturer price repayments, indi-cates that there is an important distinction be-tween list prices and actual transaction prices. While it is the transaction price that is econom-ically relevant, many of these comparisons and anecdotes focus on the list prices. Further, when making comparisons internationally, even more adjustments are necessary to account for the dif-ferent market structures and different consump-tion patterns across countries. Once these adjust-ments are made, the U.S. pharmaceutical prices reflect the same inflation problem that plagues overall health care prices in the U.S.
While it is important for analyses to account for these pricing complexities in the U.S. health care market, ultimately the complicated pricing struc-ture for pharmaceuticals is problematic and is di-minishing the beneficial role prices typically play in a market economy. As a consequence, reforms to the current pricing environment should estab-lish a simpler, more transparent, pricing structure for pharmaceuticals.
These reforms should remove the adverse in-centives that pervade the current pricing struc-tures. For instance, under the current structure, intermediaries (i.e. pharmacy benefit managers, PBMs) have an incentive for manufacturers to charge a higher list price, but offer large rebates and discounts. Eliminating the added obstacles created by the PBM model will help simplify the pricing structure and enable the list prices to more accurately reflect the actual transaction price. As another example, reimbursements for hospitals under Medicare Part B are currently connected to the price of the drug, also creating perverse in-centives. Instead, reimbursements should be a flat fee based on the value of the services provided, not the cost of the drug administered. Reforms such as these are necessary to incent the entire pharmaceutical chain to offer a simpler pricing structure.
ConClUSIon
U.S. Pharmaceutical Pricing in Context 29
With respect to the broader problem of medical care affordability, the data do not support the sup-position that pharmaceutical expenditures are driv-ing this problem. Instead, the results indicate that other factors are driving the excessive medical in-flation in the U.S. Sustainably addressing the prob-lem of health care affordability requires reforms that do not target any specific component of the health care system, such as pharmaceuticals. In-stead the only way to sustainably improve the qual-ity and pricing of health care services in the U.S. is to implement systemic reforms that improve the efficiency and competitiveness of the entire U.S. health care system.
These reforms should focus the health care system on patients, not insurance companies. Such reforms should include: moving away from the current fee for service payment model, empowering great-er competition for doctors and other health care providers, addressing tort abuse that raises medical costs, enabling high-risk pools to address the prob-lems of pre-existing conditions, selling insurance across state lines to enable greater competition, and expanding health savings accounts to empow-er patients to better afford health insurance. These reforms will help address the broader problem of affordability and quality that plague the health care system, and, by sustainable addressing the broader health care affordability problems, will also help maintain the affordability of pharmaceuticals.
Sustainably addressing the problem of health care affordability requires reforms that do not target any specific component of the health care system, such as pharmaceuticals. Instead the only way to sustainably improve the quality and pricing of health care services in the U.S. is to implement systemic reforms that improve the efficiency and competitiveness of the entire U.S. health care system.

30
enDnoteS
1 Vandervelde, A. and Blalock, E. (2017) “The Pharmaceutical Supply Chain: Gross Drug Expen-ditures Realized by Stakeholders” Berkeley Research Group.
2 Vandervelde, A. and Blalock, E. (2017) “The Pharmaceutical Supply Chain: Gross Drug Expen-ditures Realized by Stakeholders” Berkeley Research Group.
3 Vandervelde, A. and Blalock, E. (2017) “The Pharmaceutical Supply Chain: Gross Drug Expen-ditures Realized by Stakeholders” Berkeley Research Group.
4 (2017) “Express Scripts 2016 Drug Trend Report” Express Scripts.
5 Ibid.
6 (2011) “The pharmaceutical industry: an overview of CPI, PPI, and IPP methodology” U.S. Bu-reau of Labor Statistics Office of Prices & Living Conditions, October; https://www.bls.gov/ppi/pharmpricescomparison.pdf.
7 Ibid.
8 For documentation on the higher costs of medicines in hospital settings see: Jain, R.H., Schleich-er, S.M., Aotria, C.L. and Bach, P.B. (2016) “Part B payment for drugs in Medicare: Phase 1 of CMS’ proposed pilot and its impact on oncology care” Memorial Sloan Kettering Cancer Center, April 11; (2016) “Global Oncology Trend Report: A review of 2015 and outlook to 2020” IMS Institute for Healthcare Informatics, June.
9 (2017) “Health Sector Economic Indicators: Insights from Monthly National Health Spending Data through December 2016” Altarum Institute, February 10.
10 (2017) “Health Sector Economic Indicators: Insights from Monthly National Health Spending Data through December 2016” Altarum Institute, February 10; see Exhibit 6.
11 The correlation coefficient between excess pharmaceutical inflation and the excess NMEs intro-duced relative to the average is +0.51. With respect to excess pharmaceutical expenditure growth and the excess NMEs introduced to the average, the correlation coefficient is +0.59.
12 It is important to note that although other OECD countries do not have an affordability problem similar to the U.S., these countries implement price controls and other regulations that create different problems (such as problems of access or delays in receiving current technologies). It is beyond the scope of this paper to discuss the costs and benefits from these alternative tradeoffs, the purpose of this paper is to only discuss the varying expenditure trends.
13 Paris, V. (2014) “Why do Americans spend so much on pharmaceuticals?” PBS NewsHour, Feb-ruary 7.

U.S. Pharmaceutical Pricing in Context 31
14 For example, the average number of prescription drugs of a person over 18 taken regularly in the U.S. is 2.2, compared to 1.8 in Canada and 1.3 in the U.K., see: Squires, D. and Anderson, C. (2015) “U.S. Health Care from a Global Perspective: Spending, Use of Services, Prices, and Health in 13 Countries” The Commonwealth Foundation, October. Other reports documenting the higher usage of drugs in the U.S. compared to other OECD countries include: Richards, M. (2010) “Extent and Causes of International Variations in Drug Usage: A Report for the Secretary of State for Health Department of Health; and, O’Neill P, Sussex J. (2014) “International Comparison of Medicines Us-age: Quantitative Analysis” Office for Health Economics.
15 Squires, D. and Anderson, C. (2015) “U.S. Health Care from a Global Perspective: Spending, Use of Services, Prices, and Health in 13 Countries” The Commonwealth Foundation, October.
16 Ibid.
17 Squires, D.A. (2012) “Explaining High Health Care Spending in the United States: An Internation-al Comparison of Supply, Utilization, Prices, and Quality” The Commonwealth Fund, May.
18 Danzon, P.M. (2000) “Making Sense of Drug Prices” Cato Regulation, Volume 23, No. 1.
19 Kanavos, P. and Vandoros, S. (2011) “Determinants of branded prescription medicine prices in OECD countries” Health Economics, Policy and Law, July, Vol. 6 Issue 3.
20 Kanavos, P., Ferrario, A., Vandoros, S., and Anderson, G.F. (2013) “Higher US Branded Drug Pric-es And Spending Compared To Other Countries May Stem Partly From Quick Uptake Of New Drugs” Health Affairs 32, No. 4.
21 The U.S. expenditures per capita were 161 percent, 162 percent, and 158 percent larger in the U.S. than the average of the OECD countries during 2005, 2007, and 2010, respectively.
22 OECD (2015), “Share of generic market”, in Health at a Glance 2015: OECD Indicators, OECD Publishing.
23 Ibid.
24 Danzon, P.M. and Furukawa, M.F. (2008) “International Prices And Availability Of Pharmaceuti-cals in 2005” Health Affairs 27, no.1:221-233.
25 Ibid.
26 Whalen, J. (2015) “Why the U.S. Pays More Than Other Countries for Drugs” the Wall Street Journal, December 1; http://www.wsj.com/articles/whytheuspaysmorethanothercountriesfor-drugs1448939481.
27 Langreth, R., Migliozzi, B., and Gokhale, K. (2015) “The U.S. Pays a Lot More for Top Drugs Than Other Countries” Bloomberg, December 18; https://www.bloomberg.com/graphics/2015-drug-pric-es/.
32
28 The subset of countries evaluated include: Canada, Denmark, Finland, France, Germany, Japan, Netherlands, Norway, Sweden, Switzerland, and the United Kingdom.
29 Kolata, G. (1991) “Why Drugs cost More in U.S.” the New York Times, May 24.
30 The subset of countries evaluated include: Canada, Denmark, Finland, France, Germany, Japan, Netherlands, Norway, Sweden, Switzerland, and the United Kingdom.


