Embed Size (px)
Citation preview

© 2017 iCIMS Inc. All Rights Reserved.
U.S. Hiring Trends Q1 2016The New Reality for Entry-level Workers and Where in the U.S. Companies are Hiring
Q1 2016 | U.S. Hiring Trends Report
© 2016 iCIMS Inc. All Rights Reserved.2
One of the most remarkable aspects of this phenomenon is
it sits at odds with the headline numbers for the U.S. labor
market. Job growth has been unusually steady for several
years now – normally, even during a robust expansion,
there are one-off months when job gains go in reverse – yet
stories of economic insecurity are widespread. For some
time now, there has been an unusual discrepancy between
media narratives of the U.S. jobs market and some of the
standard macroeconomic data, but this is not just a media
myth. Step back even further to the broader picture of
overall U.S. economic growth, and it has been substantially
more modest than many recent economic expansions,
fueling fears that the new normal in the U.S. economy will
be lower and slower growth.
How to explain the discrepancy? One possibility is that it
is all about the demand side of the labor market, whereby
it is simply a question of relatively low-quality jobs being
created. For instance, Fed Chair Janet Yellen has been
outspoken in calling attention to the relatively high number
of workers accepting part-time work because they
cannot find full-time jobs. A recent study by economists
at Princeton and Harvard suggests that many of the jobs
created since the Great Recession have provided less
economic security than jobs created in the past because
they provide only temporary, freelance, or otherwise
alternative employment. iCIMS system data adds another
piece to this puzzle, showing negligible net progress over
the last two years in the proportion of full-time jobs created
relative to part-time or contract workers whose hours are
not guaranteed.
There is also the possibility that we are witnessing
a shift in the supply side of the labor market. Some
commentators have raised the possibility that job
seekers and workers today, especially millennials, want
something different out of their careers. Still others point
to a potential skills gap – not only that the nature of new
jobs is changing, but that as labor force participation rises
and discouraged workers are tempted back into the job
search, their skills may have deteriorated.
Naturally, it could be a little of both. The excess demand
for internships evident from iCIMS’ elevated talent supply/
demand ratio suggests a shortage of either internships
or high-quality entry-level opportunities. While iCIMS
system data focuses on the demand side of the labor
market, we have conducted a survey that shows high
levels of willingness to accept alternative forms of
employment on the supply side as well. All of this
suggests that as people re-enter the labor force or enter
it for the first time, they may or may not go straight to
regular full-time jobs.
- Josh WrightiCIMS Chief Economist
A foot in the door. Pounding the pavement.Our metaphors for finding a job emphasize the arduousness of the task and its chanciness.
And these days, it’s not getting any easier. Glance at a newsstand – or your social media
newsfeeds – and you’re bound to see stories of economic transition and dislocation.
© 2017 iCIMS Inc. All Rights Reserved.3
Q1 2016 | U.S. Hiring Trends Report
Table of Contents
The Big Picture – Insights from Our Findings 4
Section 1: Is the Path to the American Dream Becoming Harder to Start? 5
Section 2: Increase Your Odds of Success – The Best Cities to Find a Job in the U.S. 10
Methodology 12
About Us 13

© 2017 iCIMS Inc. All Rights Reserved.4
Q1 2016 | U.S. Hiring Trends Report
Job growth alone does not tell the full story of today’s labor market. There is an ongoing
conversation about the nature and quality of the jobs that the U.S. economy is creating. While
concerns about job security have been rising for many years, more fundamental concerns
have recently emerged, such as whether enough full-time jobs are being created.
Furthermore, iCIMS system data appears to be consistent with an increased desire to seek
internships as a first step to finding a job. This raises some new questions about today’s labor
market, especially for entry-level candidates. For anyone trying to find their way to a great job,
or even a good one, it is important to consider not only alternative types of employment, but
alternative locations. With that in mind, this report also provides indicators of which U.S. cities
are seeing the most rapid growth in jobs.
The Big Picture – Insights from Our Findings
Data from iCIMS’ system for tracking job applicants indicates that while job growth remains strong, full-time positions are not outpacing the creation of part-time and contractor work enough to meaningfully increase their share of total jobs created.

© 2017 iCIMS Inc. All Rights Reserved.5
Q1 2016 | U.S. Hiring Trends Report
Millennials are entering the workforce at rapid rates and play a critical role in today’s workplace.
According to the Pew Research Center, more than one in three American workers today
are millennials (adults ages 18 to 34). But do college seniors face the right opportunities after
graduation to build a long-lasting career? Recent trends could be pointing to a lack of traditional
entry-level, climb-to-the-top type of roles. With hidden weakness in the job market, today’s
entry-level workers might be forced to compromise their dream of landing that perfect job.
Section 1:
Is the Path to the American Dream Becoming Harder to Start?
To investigate this further, we took a look at our system data
and found that the talent supply/demand ratio, meaning the
number of people applying per position, is much higher for
internships than for full-time positions. As seen in Figure 1,
in Q1 of 2016, internship positions had an average of about
37 applicants per job filled, while full-time positions had only
26 applicants per job filled. While we do not know what
level of experience these full-time positions were hiring
Demand for Internships is High and Competition is Intense
for, if recent graduates are realistic enough not to apply
for senior-level positions, then this decrease in the ratio
could indicate a shortage of entry-level opportunities
for recent college graduates. Such a shortage could be
depressing the number of applicants per full-time position
if the number of applications submitted by people looking
for their first job is larger than the number of applications
submitted by people with previous work experience.
Ap
plic
ants
Per
Job
Fill
ed
Figure 1: Talent Supply/Demand Ratio
Full-Time Part-Time Contingent Intern
Source: iCIMS System Data
In the beginning of each year since 2014, the number of applicants per internship position has consistently grown while the same ratio for full-time positions has declined.
Q1 2014 Q1 2015 Q1 2016
30
25
20
15
10
5
0
31.7
23.7
18.9
31.5
26.6
17.715.8
31.9
26.3
18.214.8
37.2

© 2017 iCIMS Inc. All Rights Reserved.6
Q1 2016 | U.S. Hiring Trends Report
Increases in iCIMS job postings, displayed in Figure 2, are consistent with the reported overall strong job growth in the U.S.
Figure 3 displays the steady nonfarm payroll growth as reported by the Bureau of Labor Statistics (BLS). With 66 straight
months of positive nonfarm payroll growth through March 2016, this is the longest streak of monthly job gains since
World War II.
The Overall Job Market is Improving but Millennials Are Being Left Out in the Cold
Figure 2: Monthly Job Postings
Figure 3: Unusually Steady Nonfarm Payroll Growth
Month Year
0
50,000
60,000
70,000
80,000
90,000
100,000
110,000
120,000
Dec ‘13
Mar ‘14
Jun ‘14Sep ‘14
Dec ‘14
Mar ‘15
Jun ‘15Sep ‘15
Dec ‘15
Mar ‘16
1994
-400,000
-300,000
-200,000
-100,000
0
100,000
200,000
300,000
400,000
500,000
600,000
1994 1996 1998 2000 2002 2004 2006
Observation Date
2008 2010 2012 2014 2016
Nonfarm Payrolls 12-Month Moving Average of Nonfarm Payrolls
Source: BLS
Source: iCIMS System Data
Job
Po
stin
gs
Th
ou
san
ds
iCIMS job postings
show strong
overall job growth
continues in the U.S.
Official job gains
have been unusually
steady over the last
few years.

© 2017 iCIMS Inc. All Rights Reserved.7
Q1 2016 | U.S. Hiring Trends Report
However, entry-level workers may not be finding quality jobs. According to the BLS, the
unemployment rate for people ages 20 to 24 was 8.4% in March 2016 compared to the
national unemployment rate of 5%. As Brandee McHale, president of Citi Foundation,
discovered, U.S. census data shows that 40 percent of the unemployed are millennials,
implying at least 4.6 million young people are out of work. For the young workers who
do find work, they may be working a job that is below their skill level, doesn’t require a
degree, or pays a low salary. According to the BLS as displayed in Figure 4, workers ages
20 – 24 are earning a median weekly wage of $514, which roughly amounts to less than
$25,000 a year.
Plan B: The Class of 2016 is Open to Taking Internships or Part-time Jobs after Graduation
If there is a lack of entry-level full-time positions available,
this could be forcing new college graduates to resort to
“plan B” and find internship work that will hopefully lead
to a full-time opportunity. According to a 2016 iCIMS
survey, 91 percent of college seniors said it was likely that
they would accept a temporary full-time, paid internship,
or contractor position with a company after graduation if
they knew they could potentially receive a permanent job
offer from the company.
Almost All Employers Are Using Internships to Build Entry-level Talent Pools
About 97 percent of recruiting professionals said they
have offered entry-level employees temporary full-time,
paid internships, or contractor positions with the potential
to receive permanent job offers, and 86% said this is a
frequent practice for their company.
This data supports the conventional wisdom that many
employers use internships as a recruitment program,
using the positions as an extended tryout for a full-time
job down the road. Instead of interviewing college
seniors, companies may be hiring directly from their
intern pools.
According to a study by LinkedIn, the industry that hires
the largest percentage of its interns was accounting,
which converts 31 percent of its interns to full-time
workers, followed by management consulting and
computer software converting at a 25 percent and 24
percent, respectively.
Figure 4: Median weekly earnings of full-time wage and salary workers Q1 2016
Ages 20-24 $514
$859Ages 25-54
Source: BLS
© 2017 iCIMS Inc. All Rights Reserved.8
Q1 2016 | U.S. Hiring Trends Report
2014 Q1 2014 Q2 2014 Q3 2014 Q4 2015 Q1 2015 Q2 2015 Q3 2015 Q4 2016 Q1
Quarter
60%
61%
62%
63%
64%
65%
66%
67%
68%
69%
70%
% o
f Tot
al P
ostin
gs
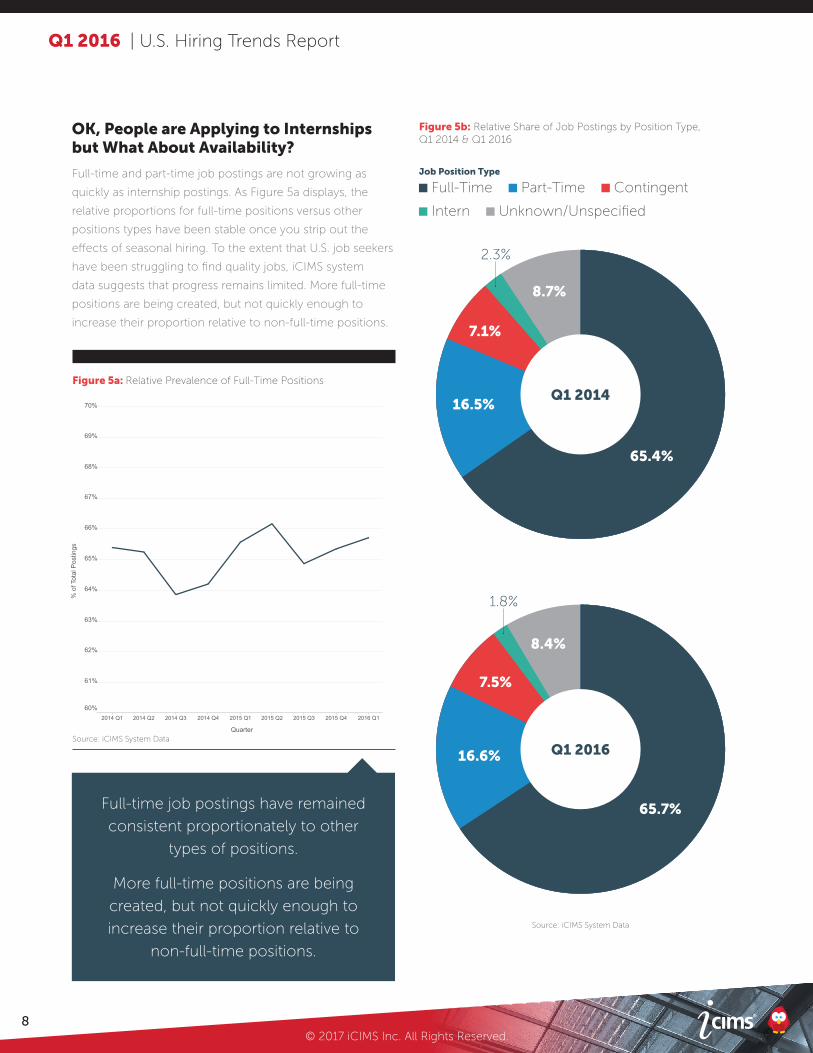
OK, People are Applying to Internships but What About Availability?
Full-time and part-time job postings are not growing as
quickly as internship postings. As Figure 5a displays, the
relative proportions for full-time positions versus other
positions types have been stable once you strip out the
effects of seasonal hiring. To the extent that U.S. job seekers
have been struggling to find quality jobs, iCIMS system
data suggests that progress remains limited. More full-time
positions are being created, but not quickly enough to
increase their proportion relative to non-full-time positions.
Figure 5b: Relative Share of Job Postings by Position Type, Q1 2014 & Q1 2016
Full-time job postings have remained
consistent proportionately to other
types of positions.
More full-time positions are being
created, but not quickly enough to
increase their proportion relative to
non-full-time positions.
Source: iCIMS System Data
Job Position Type
Full-Time Part-Time Contingent
Intern Unknown/Unspecified
Q1 2014
65.4%
16.5%
7.1%
8.7%
2.3%
Q1 2016
1.8%
65.7%
16.6%
7.5%
8.4%
Figure 5a: Relative Prevalence of Full-Time Positions
Source: iCIMS System Data

© 2017 iCIMS Inc. All Rights Reserved.9
Q1 2016 | U.S. Hiring Trends Report
Plan C: The Gig Economy
This new data is raising questions about whether college
seniors will face the right job opportunities after graduation
and what they can do about that. If college seniors aren’t
open to internships after graduation, a lack of entry-
level full-time positions could also persuade new college
graduates to accept non-traditional jobs in the so-called gig
economy. According to a 2014 study commissioned by the
Freelancers Union, 53 million Americans are independent
workers–about 34 percent of the total workforce. A study
from Intuit predicts that by 2020, 40 percent of U.S. workers
will fall into this category.
Additionally, new research from prominent labor
economists Lawrence Katz and Alan Krueger argues that
over the last 10 years the growth in employment has come
from jobs that aren’t what we typically think of as jobs. They
are “gigs” which include on-call workers, temporary roles,
freelancers, and independent contractors. The share of
Americans working these atypical jobs has increased from
10.1% a decade ago to 15.8% as of late 2015. Nearly 40% of
people in these jobs have a bachelor’s degree or higher.
Figure 7: Proportion of Workers in Alternative Work Arrangements, by Industry
Source: Katz and Krueger (2016)
Source: Lawrence Katz and Alan Krueger, “The Rise and Nature of Alternative Work Arrangements in the United States, 1995-2015,” March 29, 2016.
People in alternative work arrangements are spread across many industries and occupations,
as displayed in Figure 7. Public administration has seen the highest jump in percent of
alternative workers, while the construction and business services industries were the two that
most frequently relied on them.
1995 2005 2015
30 %
25 %
20 %
15 %
10 %
5 %
0%
Utilitie
s
Constructio
nMtg
WholesaleRetail
Transp
ortatio
n
Informatio
n/Comms
Finance, Insu
rance, &
Real Esta
te
Professional B
us.
Education, H
ealth
Arts/Enterta
inment
Other Servi
ces
Public Administr
ation
20%
15%
10%
5%
0%1995 2005 2015
Figure 6: Share of U.S. Workers in Alternative Job Arrangements Over the Last 20 Years

© 2017 iCIMS Inc. All Rights Reserved.10
Q1 2016 | U.S. Hiring Trends Report
A New York State of Mind
New York City Posted the Highest Number of Jobs, But Houston had the Highest
Growth Rate Since Q4 2015.
These metro areas posted the highest number of job postings in Q1 of 2016, but how rapidly has their number
of job postings grown since Q4 2015? Figures 8 and 9 list the cities in descending order of total Q1 job postings,
but display their growth rates since the end of the year. In the accompanying maps, the size of the circles is
proportional to the number of job postings in each metro area.
Section 2:
Increase Your Odds of Success – The Best Cities to Find a Job in the U.S.
Figure 8: The Top Ten U.S. Metro Areas for Job Postings
U.S. Metro Areas with the Greatest Number of Job Postings and Their Growth Rates from Q4 2015 to Q1 2016
1. New York, NY +14.4% 6. Detroit, MI +33.3%
2. Phoenix, AZ +27.9% 7. Philadelphia, PA +12.4%
3. Dallas, TX +16.5% 8. Atlanta, GA +9.2%
4. Chicago, IL +32.4% 9. Los Angeles, CA +11.6%
5. Washington DC +8.2% 10. Houston, TX +33.7%
Source: iCIMS System Data

© 2017 iCIMS Inc. All Rights Reserved.11
Q1 2016 | U.S. Hiring Trends Report
Looking for a Job in a Specific Region?
These Cities May Be Your Best Bet.
Figure 9: The Top Three Metro Areas in Each U.S. Region for Job Postings
Source: iCIMS System Data
Mid-Atlantic Midwest Mountain-Plains Southwest
1. Washington DC +8.2%
2. Baltimore, MD +25.4%
3. Philadelphia, PA +12.4%
1. Chicago, IL +32.4%
2. Detroit, MI +33.3%
3. Minneapolis, MN -0.1%
1. Denver, CO +33.6%
2. Salt Lake CIty, UT +27.9%
3. Kansas CIty, MO +56.7%
1. Dallas, TX +16.5%
2. Houston, TX +33.7%
3. Austin, TX +28.7%
New England New York - New Jersey Southeast Western
1. Boston, MA +15.3%
2. Worcester, MA -5.6%
3. Providence, RI -3.9%
1. New York, NY +14.4%
2. Albany, NY +19.2%
3. Syracuse, NY +30.8%
1. Atlanta, GA +9.2%
2. Miami, FL +14.9%
3. Tampa, FL -1.2%
1. Phoenix, AZ +27.9%
2. Los Angeles, CA +11.6%
3. Seattle, WA +22.9%
Metro Areas in Each U.S. Region with the Greatest Number of Job Postings and Their Growth Rates from Q4 2015 to Q1 2016
Q1 2016 | U.S. Hiring Trends Report
© 2016 iCIMS Inc. All Rights Reserved.12
This report presents trends over the course of over two years from January 2014 through
March 2016 in a sample drawn from iCIMS’ customer base of more than 3,200 contracted
customers. The data is generated automatically by user interactions with iCIMS solutions.
The main focus is on what we refer to as the talent supply/demand ratio and the total
number of job postings by employers. The talent supply/demand ratios are presented as an
average across the iCIMS customer base. iCIMS worked with a third-party data analyst firm,
Hanover Research, to arrive at the data conclusions reflected within.
Methodology
© 2017 iCIMS Inc. All Rights Reserved.13
Q1 2016 | U.S. Hiring Trends Report
About iCIMS
iCIMS is the leading provider of talent acquisition solutions
that help businesses win the war for top talent. iCIMS
empowers companies to manage their entire hiring process
within the industry’s most robust Platform-as-a-Service
(PaaS). Built on the foundation of a best-to-market talent
acquisition software suite, iCIMS’ PaaS framework, UNIFi,
allows employers to expand the capabilities of their core
talent acquisition technology by integrating with the largest
partner ecosystem in talent acquisition to help them
attract, find, screen, and manage candidates. Offering
scalable, easy-to-use solutions that are backed by award-
winning customer service, iCIMS supports more than 3,500
contracted customers and is one of the largest and fastest-
growing talent acquisition solution providers.
About iCIMS Chief Economist: Josh Wright
Josh Wright is Chief Economist at iCIMS and oversees the organization’s proprietary research. Prior to joining iCIMS, Josh
served as a U.S. economist with Bloomberg L.P., where he analyzed current macroeconomic trends and was a frequent
guest contributor on Bloomberg Radio and Bloomberg TV.
As Chief Economist at iCIMS, Josh is responsible for analyzing proprietary data in order to produce fresh insights on
emerging trends in the U.S. labor market. He contributes to the publishing of quarterly trends reports, as well as semi-annual
reports and blog posts on ad hoc labor topics. In addition, Josh supports in the development of software that allows clients
to analyze their own performance relative to industry benchmarks by collaborating with data scientists, software developers,
and marketing executives.
A former Federal Reserve staffer, Josh helped build the Fed’s mortgage-backed securities (MBS) portfolio of more than $1
trillion, among other responses to the global financial crisis.
As a researcher, he has published on labor and housing markets, as well as U.S. monetary policy, and advised policymakers
across the legislative and executive branches of government.
About iCIMS Hiring Insights
iCIMS Hiring Insights is an online resource for labor market
insights and hiring trends. Our team of researchers and
writers uses iCIMS’ exclusive data, as well as proprietary
and secondary research, to create reports and articles that
cover the most recent developments in the workforce.
Featuring iCIMS’ Chief Economist, Josh Wright, iCIMS
Hiring Insights helps its readers stay well-informed about
the latest in recruiting, technology, and the labor market.
To learn more visit: www.icims.com/hiring-insights
HIRING INSIGHTS