Embed Size (px)
Citation preview

U.S. Equity Sector 2018 OutlookBest Ideas from Fidelity’s Sector Leaders

People and Resources: The Keys to Fidelity Equity Sector Leadership
Fidelity Investments was founded on the belief that it is possible to research and identify companies that
can outperform their peers, and that by investing in better-performing companies, we can achieve better
returns for investors. That premise is foundational for our equity sector leaders, who recognize that not
every stock within each sector is positioned to deliver better-than-expected earnings growth or stock-
price-multiple expansion.
What matters most is trying to identify those individual companies that appear best-positioned to “win”
over time. That is why we champion a fundamental company-by-company approach to investing, backed
by the vast capabilities of a global research team following nearly 2,300 companies worldwide.
In a perpetually evolving investment landscape, our global equity research capabilities—consisting of
dedicated people, a global perspective, and modern technology tools—remain critical to being current
and proactive in making investment decisions. Each day, our investment teams meet with companies and
evaluate their current businesses and future prospects. We do this by visiting management teams at
manufacturing plants, biotechnology labs, and shale-drilling sites, among other locations. In addition,
dozens of companies visit our multiple office locations in North America, Europe, and Asia on a daily
basis. To ensure that our research insights can be shared, and acted upon, as quickly as possible across
Fidelity’s global investment team, we maintain state-of-the-art technology and communication tools.
For some perspective on our research-driven approach, we recently asked our sector portfolio managers
to share one of their highest-conviction investing ideas for the coming year. We hope you find these
insights valuable as you think about equity sector investing opportunities in 2018 and beyond.
Sincerely,
Tim Cohen
Head of Global Equity Research
Fidelity Investments
Consumer Discretionary 4Peter Dixon
Information Technology 16Charlie Chai
Consumer Staples 6Robert Lee
Materials 18Tobias Welo
Energy 8John Dowd
Real Estate 20Steven Buller l Samuel Wald
Financials 10Christopher Lee
Health Care 12Edward Yoon
Telecommunication Services 22Matthew Drukker
Utilities 24Douglas Simmons
Industrials 14Tobias Welo
Fidelity sector portfolio managers provide their perspectives on disruptors and subsequent investment opportunities in 2018.
4
Consumer DiscretionaryConsumers appear to increasingly favor experiences over things
Katie Shaw l Sector Portfolio Manager
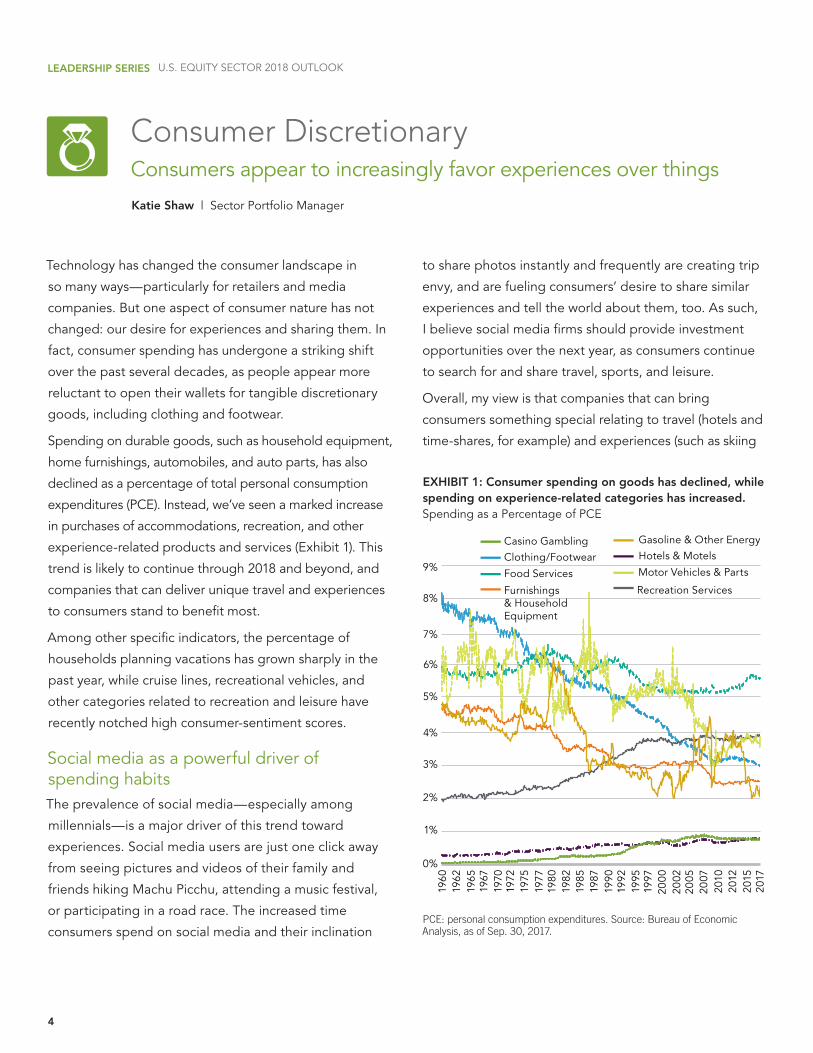
EXHIBIT 1: Consumer spending on goods has declined, while spending on experience-related categories has increased.Spending as a Percentage of PCE
PCE: personal consumption expenditures. Source: Bureau of Economic Analysis, as of Sep. 30, 2017.
Technology has changed the consumer landscape in
so many ways—particularly for retailers and media
companies. But one aspect of consumer nature has not
changed: our desire for experiences and sharing them. In
fact, consumer spending has undergone a striking shift
over the past several decades, as people appear more
reluctant to open their wallets for tangible discretionary
goods, including clothing and footwear.
Spending on durable goods, such as household equipment,
home furnishings, automobiles, and auto parts, has also
declined as a percentage of total personal consumption
expenditures (PCE). Instead, we’ve seen a marked increase
in purchases of accommodations, recreation, and other
experience-related products and services (Exhibit 1). This
trend is likely to continue through 2018 and beyond, and
companies that can deliver unique travel and experiences
to consumers stand to benefit most.
Among other specific indicators, the percentage of
households planning vacations has grown sharply in the
past year, while cruise lines, recreational vehicles, and
other categories related to recreation and leisure have
recently notched high consumer-sentiment scores.
Social media as a powerful driver of spending habitsThe prevalence of social media—especially among
millennials—is a major driver of this trend toward
experiences. Social media users are just one click away
from seeing pictures and videos of their family and
friends hiking Machu Picchu, attending a music festival,
or participating in a road race. The increased time
consumers spend on social media and their inclination
LEADERSHIP SERIES U.S. EQUITY SECTOR 2018 OUTLOOK
to share photos instantly and frequently are creating trip
envy, and are fueling consumers’ desire to share similar
experiences and tell the world about them, too. As such,
I believe social media firms should provide investment
opportunities over the next year, as consumers continue
to search for and share travel, sports, and leisure.
Overall, my view is that companies that can bring
consumers something special relating to travel (hotels and
time-shares, for example) and experiences (such as skiing
0%
1%
2%
3%
4%
5%
6%
7%
8%
9%
1960
1962
1965
1967
1970
1972
1975
1977
1980
1982
1985
1987
1990
1992
1995
1997
2000
2002
2005
2007
2010
2012
2015
2017
Clothing/FootwearCasino Gambling
Motor Vehicles & PartsFood Services
Recreation Services
Gasoline & Other EnergyHotels & Motels
Furnishings & Household Equipment

5
The consumer discretionary industries can be significantly affected by the performance of the overall economy, interest rates, competition, consumer confidence and spending, and changes in demographics and consumer tastes.
U.S. EQUITY SECTOR 2018 OUTLOOK: CONSUMER DISCRETIONARY
and gambling) are best positioned to benefit from this
trend in 2018 and beyond. I’m also positive on cruise lines,
which I believe are another strong play on the expanding
desire to travel. In addition, similar types of companies
in select countries around the globe—particularly
China—stand to benefit from an increase in outbound
travel. Increasing margins as well as return of cash to
shareholders and valuation should remain attractive
components for many of these stocks over the next year.
Katie Shaw, CFA l Sector Portfolio Manager
Katie Shaw is a sector portfolio manager for Fidelity Investments. Ms. Shaw, a CFA charterholder, joined Fidelity in 2008 as an equity research analyst, and has managed multiple consumer discretionary sector and industry portfolios.
Author
6
Consumer StaplesEmerging markets present significant opportunities for multinationals
James McElligott l Sector Portfolio Manager
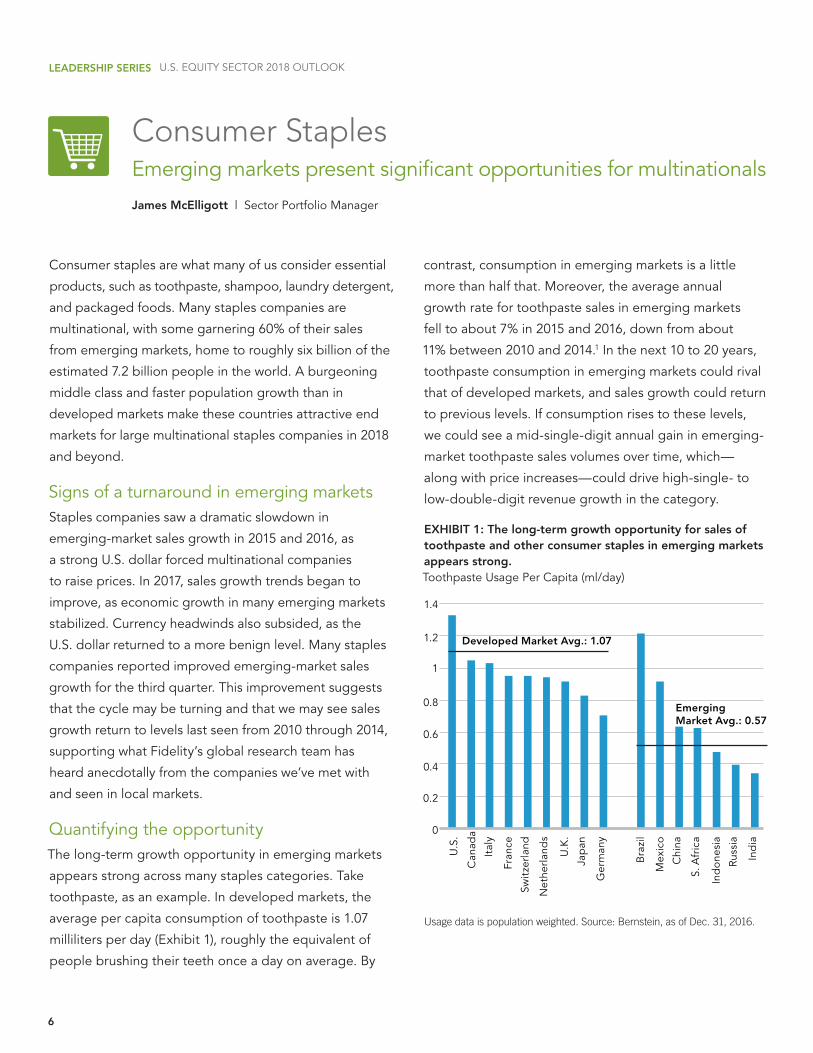
EXHIBIT 1: The long-term growth opportunity for sales of toothpaste and other consumer staples in emerging markets appears strong.Toothpaste Usage Per Capita (ml/day)
Usage data is population weighted. Source: Bernstein, as of Dec. 31, 2016.
Consumer staples are what many of us consider essential
products, such as toothpaste, shampoo, laundry detergent,
and packaged foods. Many staples companies are
multinational, with some garnering 60% of their sales
from emerging markets, home to roughly six billion of the
estimated 7.2 billion people in the world. A burgeoning
middle class and faster population growth than in
developed markets make these countries attractive end
markets for large multinational staples companies in 2018
and beyond.
Signs of a turnaround in emerging marketsStaples companies saw a dramatic slowdown in
emerging-market sales growth in 2015 and 2016, as
a strong U.S. dollar forced multinational companies
to raise prices. In 2017, sales growth trends began to
improve, as economic growth in many emerging markets
stabilized. Currency headwinds also subsided, as the
U.S. dollar returned to a more benign level. Many staples
companies reported improved emerging-market sales
growth for the third quarter. This improvement suggests
that the cycle may be turning and that we may see sales
growth return to levels last seen from 2010 through 2014,
supporting what Fidelity’s global research team has
heard anecdotally from the companies we’ve met with
and seen in local markets.
Quantifying the opportunity The long-term growth opportunity in emerging markets
appears strong across many staples categories. Take
toothpaste, as an example. In developed markets, the
average per capita consumption of toothpaste is 1.07
milliliters per day (Exhibit 1), roughly the equivalent of
people brushing their teeth once a day on average. By
LEADERSHIP SERIES U.S. EQUITY SECTOR 2018 OUTLOOK
contrast, consumption in emerging markets is a little
more than half that. Moreover, the average annual
growth rate for toothpaste sales in emerging markets
fell to about 7% in 2015 and 2016, down from about
11% between 2010 and 2014.1 In the next 10 to 20 years,
toothpaste consumption in emerging markets could rival
that of developed markets, and sales growth could return
to previous levels. If consumption rises to these levels,
we could see a mid-single-digit annual gain in emerging-
market toothpaste sales volumes over time, which—
along with price increases—could drive high-single- to
low-double-digit revenue growth in the category.
0
0.2
0.4
0.6
0.8
1
1.2
1.4
U.S
.
Can
ada
Ital
y
Fran
ce
Swit
zerl
and
Net
herl
and
s
U.K
.
Jap
an
Ger
man
y
Bra
zil
Mex
ico
Chi
na
S. A
fric
a
Ind
one
sia
Russ
ia
Ind
ia
Developed Market Avg.: 1.07
Emerging Market Avg.: 0.57
7
Endnotes1Source: Bernstein, as of Dec. 31, 2016.
The consumer staples industries can be significantly affected by demographic and product trends, competitive pricing, food fads, marketing campaigns, environmental factors, government regulation, the performance of the overall economy, interest rates, and consumer confidence.
U.S. EQUITY SECTOR 2018 OUTLOOK: CONSUMER STAPLES
Focus on multinational staples companies Staples companies with sizable emerging-market exposure
may offer some of the sector’s strongest earnings-growth
prospects. Multinational companies look particularly
attractive because they offer a mix of geographic and
product diversification and, over time, can often gain
market share over local businesses. Multinationals that can
successfully adapt to local preferences—whether putting
natural ingredients in toothpaste in India or strong scents
in laundry detergent in Mexico—are likely to be among
the biggest long-term winners.
James McElligott l Sector Portfolio Manager
James McElligott is a portfolio manager and research analyst for Fidelity Investments. He currently oversees several consumer staples sector portfolios and subportfolios. He joined Fidelity Investments in 2003.
Author
8
EnergyU.S.-based exploration and production companies remain the sector’s sweet spot
John Dowd l Sector Portfolio Manager
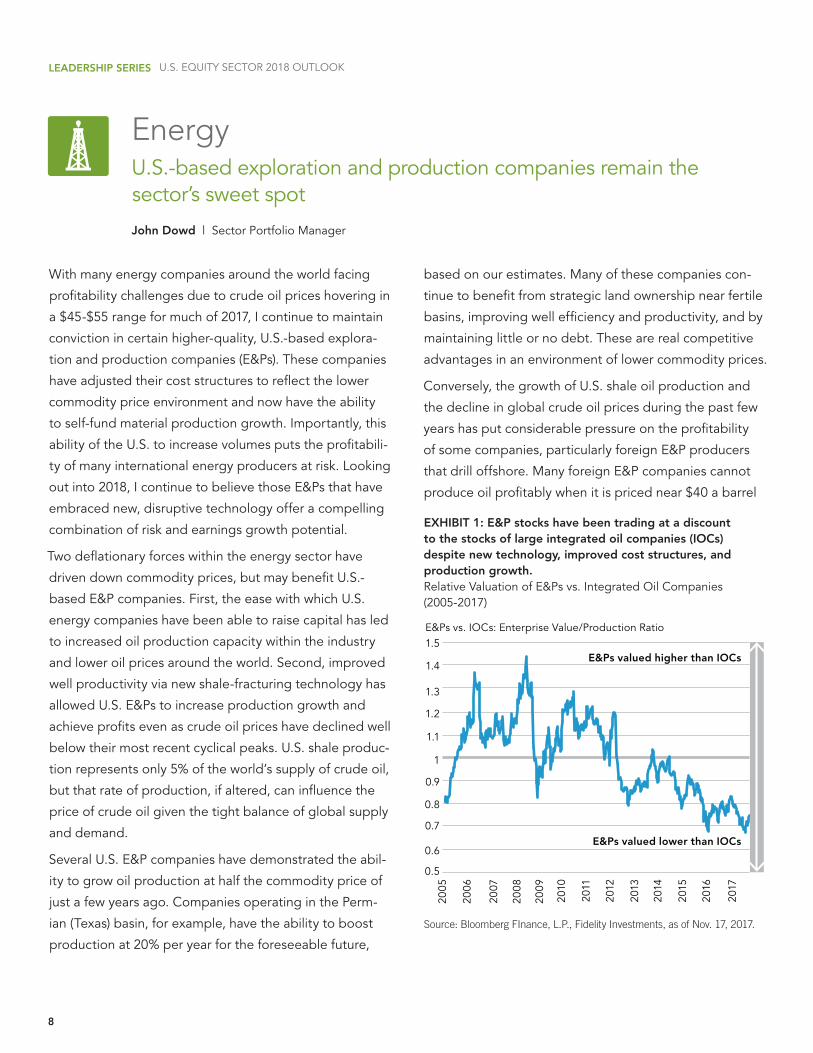
EXHIBIT 1: E&P stocks have been trading at a discount to the stocks of large integrated oil companies (IOCs) despite new technology, improved cost structures, and production growth.Relative Valuation of E&Ps vs. Integrated Oil Companies (2005-2017)
Source: Bloomberg FInance, L.P., Fidelity Investments, as of Nov. 17, 2017.
With many energy companies around the world facing
profitability challenges due to crude oil prices hovering in
a $45-$55 range for much of 2017, I continue to maintain
conviction in certain higher-quality, U.S.-based explora-
tion and production companies (E&Ps). These companies
have adjusted their cost structures to reflect the lower
commodity price environment and now have the ability
to self-fund material production growth. Importantly, this
ability of the U.S. to increase volumes puts the profitabili-
ty of many international energy producers at risk. Looking
out into 2018, I continue to believe those E&Ps that have
embraced new, disruptive technology offer a compelling
combination of risk and earnings growth potential.
Two deflationary forces within the energy sector have
driven down commodity prices, but may benefit U.S.-
based E&P companies. First, the ease with which U.S.
energy companies have been able to raise capital has led
to increased oil production capacity within the industry
and lower oil prices around the world. Second, improved
well productivity via new shale-fracturing technology has
allowed U.S. E&Ps to increase production growth and
achieve profits even as crude oil prices have declined well
below their most recent cyclical peaks. U.S. shale produc-
tion represents only 5% of the world’s supply of crude oil,
but that rate of production, if altered, can influence the
price of crude oil given the tight balance of global supply
and demand.
Several U.S. E&P companies have demonstrated the abil-
ity to grow oil production at half the commodity price of
just a few years ago. Companies operating in the Perm-
ian (Texas) basin, for example, have the ability to boost
production at 20% per year for the foreseeable future,
LEADERSHIP SERIES U.S. EQUITY SECTOR 2018 OUTLOOK
based on our estimates. Many of these companies con-
tinue to benefit from strategic land ownership near fertile
basins, improving well efficiency and productivity, and by
maintaining little or no debt. These are real competitive
advantages in an environment of lower commodity prices.
Conversely, the growth of U.S. shale oil production and
the decline in global crude oil prices during the past few
years has put considerable pressure on the profitability
of some companies, particularly foreign E&P producers
that drill offshore. Many foreign E&P companies cannot
produce oil profitably when it is priced near $40 a barrel
2012
E&Ps vs. IOCs: Enterprise Value/Production Ratio
2005
2006
2007
2008
2009
2010
2011
2013
2014
2015
2016
2017
0.5
0.6
0.7
0.8
0.9
1
1.1
1.2
1.3
1.4
1.5
E&Ps valued lower than IOCs
E&Ps valued higher than IOCs
9
U.S. EQUITY SECTOR 2018 OUTLOOK: ENERGY
or less. The Organization for Oil Exporting Countries
(OPEC), a group of foreign countries that collaborate
to manage their collective exportation of crude oil, has
seen annual net export revenues fall from a peak of $1.18
billion in 2012 to $433 million in 2016. Looking into 2018,
I do believe there are some factors that could provide
support for oil prices to remain at the upper end of its
recent range or even move higher, but I am not optimistic
that crude oil prices will recover to historical peak levels.
In addition, the market has been valuing some U.S.-based
E&P companies as if commodity prices will remain low in
perpetuity, and also as if they will not achieve production
growth going forward (see Exhibit 1). I see that as an op-
portunity. Overall, given these industry dynamics, I have
been allocating capital to the U.S. E&P stocks with better
John Dowd l Sector Portfolio Manager
John Dowd is a portfolio manager for Fidelity Investments. Mr. Dowd currently manages energy sector portfolios and subport-folios. He joined Fidelity in 2005 as an equity research analyst.
Author
cost positions, production growth, and return prospects
than their foreign peers. This strategy wasn’t rewarded
during the first three quarters of 2017, as E&P stocks
underperformed the broader energy sector. Importantly,
this underperformance was due to multiple compression
rather than sub-par cash-flow growth. I remain optimistic
that this group will outperform other areas within the
sector over a longer time horizon.
The energy industries can be significantly affected by fluctuations in energy prices and supply and demand of energy fuels, energy conservation, the success of exploration projects, and taxes and government regulations.
The commodities industries can be significantly affected by commodity prices, world events, import controls, worldwide competition, government regulations, and economic conditions.
10
FinancialsRegulatory relief may boost bank earnings
Christopher Lee l Sector Portfolio Manager
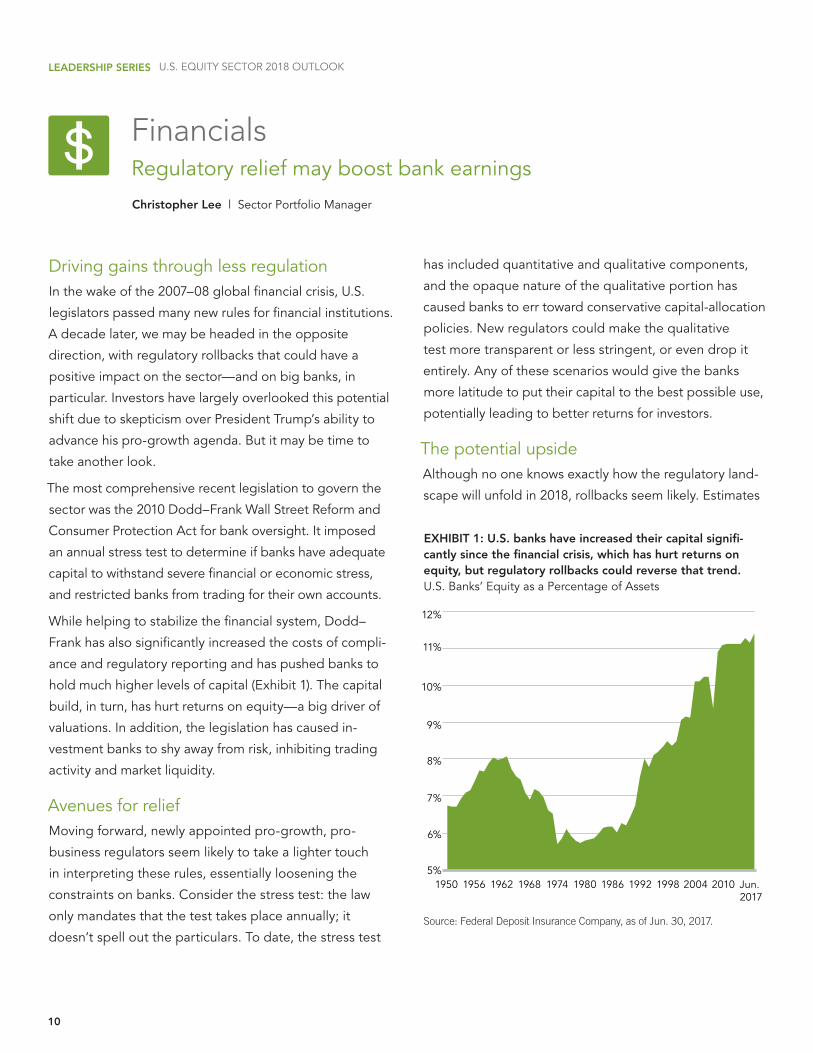
EXHIBIT 1: U.S. banks have increased their capital signifi-cantly since the financial crisis, which has hurt returns on equity, but regulatory rollbacks could reverse that trend.U.S. Banks’ Equity as a Percentage of Assets
Source: Federal Deposit Insurance Company, as of Jun. 30, 2017.
Driving gains through less regulation In the wake of the 2007–08 global financial crisis, U.S.
legislators passed many new rules for financial institutions.
A decade later, we may be headed in the opposite
direction, with regulatory rollbacks that could have a
positive impact on the sector—and on big banks, in
particular. Investors have largely overlooked this potential
shift due to skepticism over President Trump’s ability to
advance his pro-growth agenda. But it may be time to
take another look.
The most comprehensive recent legislation to govern the
sector was the 2010 Dodd–Frank Wall Street Reform and
Consumer Protection Act for bank oversight. It imposed
an annual stress test to determine if banks have adequate
capital to withstand severe financial or economic stress,
and restricted banks from trading for their own accounts.
While helping to stabilize the financial system, Dodd–
Frank has also significantly increased the costs of compli-
ance and regulatory reporting and has pushed banks to
hold much higher levels of capital (Exhibit 1). The capital
build, in turn, has hurt returns on equity—a big driver of
valuations. In addition, the legislation has caused in-
vestment banks to shy away from risk, inhibiting trading
activity and market liquidity.
Avenues for reliefMoving forward, newly appointed pro-growth, pro-
business regulators seem likely to take a lighter touch
in interpreting these rules, essentially loosening the
constraints on banks. Consider the stress test: the law
only mandates that the test takes place annually; it
doesn’t spell out the particulars. To date, the stress test
LEADERSHIP SERIES U.S. EQUITY SECTOR 2018 OUTLOOK
has included quantitative and qualitative components,
and the opaque nature of the qualitative portion has
caused banks to err toward conservative capital-allocation
policies. New regulators could make the qualitative
test more transparent or less stringent, or even drop it
entirely. Any of these scenarios would give the banks
more latitude to put their capital to the best possible use,
potentially leading to better returns for investors.
The potential upsideAlthough no one knows exactly how the regulatory land-
scape will unfold in 2018, rollbacks seem likely. Estimates
5%
6%
7%
8%
9%
10%
11%
12%
1950 1956 1962 1968 1974 1980 1986 1992 1998 2004 2010 Jun. 2017

11
Sector specialist Michael Griffith, CFA, also contributed to this report.
The financials industries are subject to extensive government regulation, can be subject to relatively rapid change due to increasingly blurred distinctions between service segments, and can be significantly affected by availability and cost of capital funds, changes in interest rates, the rate of corporate and consumer debt defaults, and price competition.
U.S. EQUITY SECTOR 2018 OUTLOOK: FINANCIALS
are that big banks with more than $50 billion in assets—
which have seen a disproportionate share of the incre-
mental regulations—could be among the biggest bene-
ficiaries, with an estimated 5% to 15% boost in earnings.
Regional banks, which have tried not to exceed the oner-
ous $50 billion threshold, could become more interested
in mergers and acquisitions (M&A), and investment banks
could benefit from increased trading activity. Within the
sector, stocks with valuations that are not factoring in the
potential benefits of regulatory relief could provide some
of the strongest opportunities for future appreciation.
Christopher Lee l Sector Portfolio Manager
Christopher Lee is a portfolio manager and research analyst for Fidelity Investments. He currently manages several financials sector portfolios and subportfolios. Mr. Lee is responsible for covering global investment bank and universal bank stocks within the financials sector. He joined Fidelity in 2004.
Author
12
Health CareMounting costs have led to consumerism, and favor tech-enabled health care
Edward Yoon l Sector Portfolio Manager
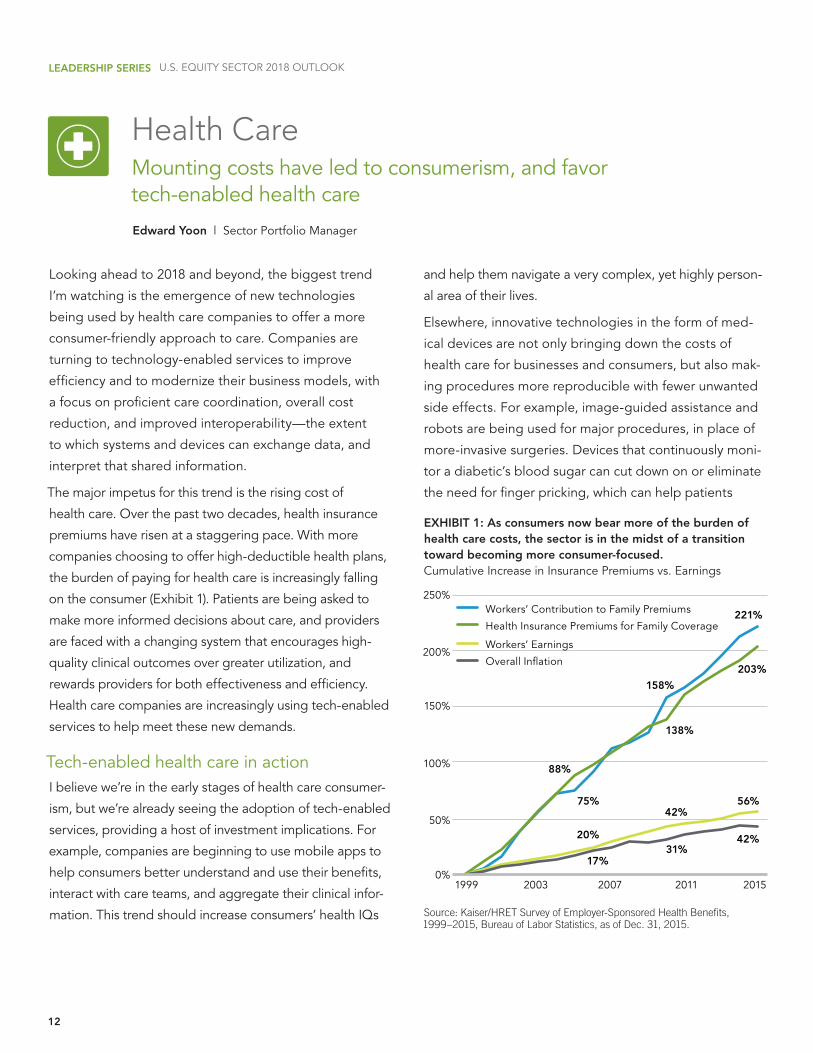
EXHIBIT 1: As consumers now bear more of the burden of health care costs, the sector is in the midst of a transition toward becoming more consumer-focused.Cumulative Increase in Insurance Premiums vs. Earnings
Source: Kaiser/HRET Survey of Employer-Sponsored Health Benefits, 1999–2015, Bureau of Labor Statistics, as of Dec. 31, 2015.
Looking ahead to 2018 and beyond, the biggest trend
I’m watching is the emergence of new technologies
being used by health care companies to offer a more
consumer-friendly approach to care. Companies are
turning to technology-enabled services to improve
efficiency and to modernize their business models, with
a focus on proficient care coordination, overall cost
reduction, and improved interoperability—the extent
to which systems and devices can exchange data, and
interpret that shared information.
The major impetus for this trend is the rising cost of
health care. Over the past two decades, health insurance
premiums have risen at a staggering pace. With more
companies choosing to offer high-deductible health plans,
the burden of paying for health care is increasingly falling
on the consumer (Exhibit 1). Patients are being asked to
make more informed decisions about care, and providers
are faced with a changing system that encourages high-
quality clinical outcomes over greater utilization, and
rewards providers for both effectiveness and efficiency.
Health care companies are increasingly using tech-enabled
services to help meet these new demands.
Tech-enabled health care in actionI believe we’re in the early stages of health care consumer-
ism, but we’re already seeing the adoption of tech-enabled
services, providing a host of investment implications. For
example, companies are beginning to use mobile apps to
help consumers better understand and use their benefits,
interact with care teams, and aggregate their clinical infor-
mation. This trend should increase consumers’ health IQs
LEADERSHIP SERIES U.S. EQUITY SECTOR 2018 OUTLOOK
and help them navigate a very complex, yet highly person-
al area of their lives.
Elsewhere, innovative technologies in the form of med-
ical devices are not only bringing down the costs of
health care for businesses and consumers, but also mak-
ing procedures more reproducible with fewer unwanted
side effects. For example, image-guided assistance and
robots are being used for major procedures, in place of
more-invasive surgeries. Devices that continuously moni-
tor a diabetic’s blood sugar can cut down on or eliminate
the need for finger pricking, which can help patients
1999 2003 2007 2011 20150%
50%
100%
150%
200%
250%Workers’ Contribution to Family Premiums
Health Insurance Premiums for Family Coverage
Workers’ Earnings
Overall Inflation
88%
75%
20%
17%31%
158%
138%
203%
221%
42%56%
42%

13
The health care industries are subject to government regulation and reimbursement rates, as well as government approval of products and services, which could have a significant effect on price and availability, and can be significantly affected by rapid obsolescence and patent expirations.
U.S. EQUITY SECTOR 2018 OUTLOOK: HEALTH CARE
more effectively manage a potentially costly chronic
condition. Telemedicine business models also are on the
rise. Patients can engage in clinical interactions by phone,
video chat, or alternative web applications, instead of at
the doctor’s office. Further, I believe genetics will funda-
mentally change our understanding of disease, and con-
sumers are just beginning to see the benefits of research
in this space, with more to come in the near future.
Going forward, I expect the way consumers interact with
the health care system will continue to evolve, with the
demand for tech-enabled services increasing along with
the sector’s focus on consumer value. Shifting to these
Edward Yoon l Sector Portfolio Manager
Edward Yoon is a portfolio manager and research analyst for Fidelity Investments. Mr. Yoon is responsible for coverage of health care equipment and supplies stocks, and serves as the health care sector leader.
Author
newer services may take time for many consumers, but
adoption has already begun. I’ll continue to keep my
eye on companies that can help consumers make more
informed health care decisions and drive down costs.
14
IndustrialsDigital transformation of the industrials sector holds long-term promise
Tobias Welo l Sector Portfolio Manager
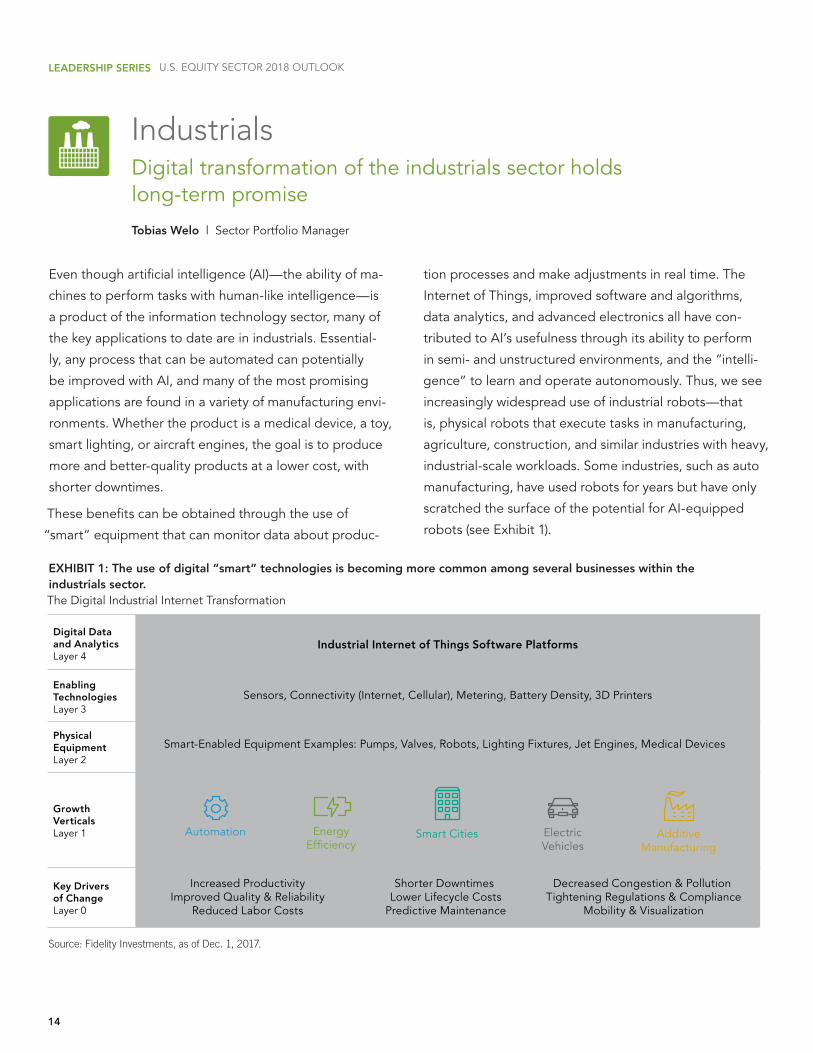
EXHIBIT 1: The use of digital “smart” technologies is becoming more common among several businesses within the industrials sector. The Digital Industrial Internet Transformation
Source: Fidelity Investments, as of Dec. 1, 2017.
Even though artificial intelligence (AI)—the ability of ma-
chines to perform tasks with human-like intelligence—is
a product of the information technology sector, many of
the key applications to date are in industrials. Essential-
ly, any process that can be automated can potentially
be improved with AI, and many of the most promising
applications are found in a variety of manufacturing envi-
ronments. Whether the product is a medical device, a toy,
smart lighting, or aircraft engines, the goal is to produce
more and better-quality products at a lower cost, with
shorter downtimes.
These benefits can be obtained through the use of
“smart” equipment that can monitor data about produc-
LEADERSHIP SERIES U.S. EQUITY SECTOR 2018 OUTLOOK
tion processes and make adjustments in real time. The
Internet of Things, improved software and algorithms,
data analytics, and advanced electronics all have con-
tributed to AI’s usefulness through its ability to perform
in semi- and unstructured environments, and the “intelli-
gence” to learn and operate autonomously. Thus, we see
increasingly widespread use of industrial robots—that
is, physical robots that execute tasks in manufacturing,
agriculture, construction, and similar industries with heavy,
industrial-scale workloads. Some industries, such as auto
manufacturing, have used robots for years but have only
scratched the surface of the potential for AI-equipped
robots (see Exhibit 1).
Key Drivers of ChangeLayer 0
Growth Verticals Layer 1
Physical EquipmentLayer 2
Enabling TechnologiesLayer 3
Digital Data and AnalyticsLayer 4
Increased ProductivityImproved Quality & Reliability
Reduced Labor Costs
Shorter Downtimes Lower Lifecycle Costs
Predictive Maintenance
Decreased Congestion & Pollution Tightening Regulations & Compliance
Mobility & Visualization
Smart-Enabled Equipment Examples: Pumps, Valves, Robots, Lighting Fixtures, Jet Engines, Medical Devices
Sensors, Connectivity (Internet, Cellular), Metering, Battery Density, 3D Printers
Industrial Internet of Things Software Platforms
EnergyEfficiency
Smart CitiesAutomation ElectricVehicles
AdditiveManufacturing
15
U.S. EQUITY SECTOR 2018 OUTLOOK: INDUSTRIALS
Similarly, in the water and electrical industries, hard-
ware manufacturers are expanding their offerings of
software-enabled products, as municipalities increasingly
look to replace their existing infrastructure with solu-
tions that leverage sensors and internet communication.
“Smart” networks, data, and analytics could enable towns
and cities to benefit from greater energy efficiency, re-
duced costs, and real-time monitoring.
Manufacturers of home and office environmental-
control equipment are following a similar path. In “smart”
houses, heating and cooling systems will use predictive
analytics—the use of new and historical information
to forecast future activity, behavior, and trends—to
anticipate what temperature and humidity users prefer in
specific circumstances.
Tobias Welo l Sector Portfolio Manager
Tobias Welo is a portfolio manager and research analyst for Fidelity Investments. Mr. Welo, who joined Fidelity in 2005, is responsible for managing multiple portfolios focused on the industrials and materials sectors. He also serves as sector leader for the industrials and materials sectors.
Author
While the adoption of AI remains in its infancy, areas that
have high and fast return on investments such as light-
ing, robots, and energy efficiency are experiencing rapid
growth and are high-conviction areas for investment
today. I think AI represents a potential long-term growth
driver for the sector, where its presence and significance
will widen significantly in the medium term.
Industrials industries can be significantly affected by general economic trends, changes in consumer sentiment and spending, commodity prices, legislation, government regulation and spending, import controls, and worldwide competition, and can be subject to liability for environmental damage, depletion of resources, and mandated expenditures for safety and pollution control.
16
Information Technology3D-sensing smartphone applications—a potential game-changer
Charlie Chai l Sector Portfolio Manager
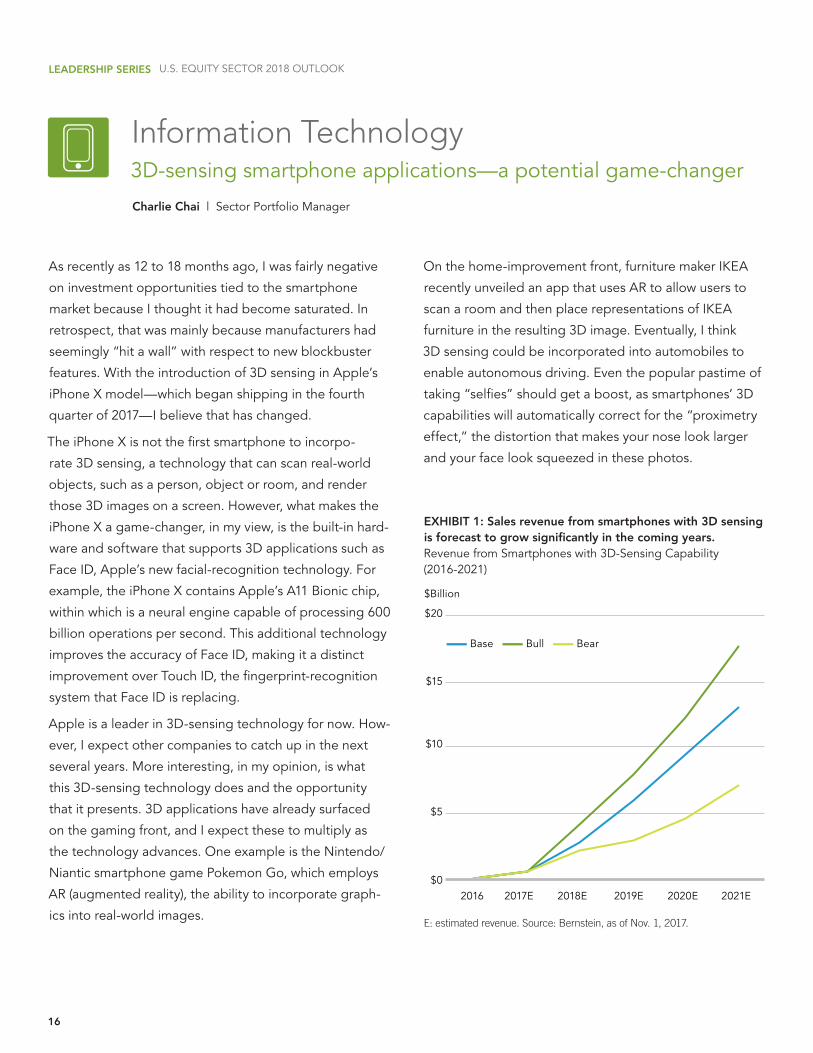
EXHIBIT 1: Sales revenue from smartphones with 3D sensing is forecast to grow significantly in the coming years.Revenue from Smartphones with 3D-Sensing Capability (2016-2021)
E: estimated revenue. Source: Bernstein, as of Nov. 1, 2017.
As recently as 12 to 18 months ago, I was fairly negative
on investment opportunities tied to the smartphone
market because I thought it had become saturated. In
retrospect, that was mainly because manufacturers had
seemingly “hit a wall” with respect to new blockbuster
features. With the introduction of 3D sensing in Apple’s
iPhone X model—which began shipping in the fourth
quarter of 2017—I believe that has changed.
The iPhone X is not the first smartphone to incorpo-
rate 3D sensing, a technology that can scan real-world
objects, such as a person, object or room, and render
those 3D images on a screen. However, what makes the
iPhone X a game-changer, in my view, is the built-in hard-
ware and software that supports 3D applications such as
Face ID, Apple’s new facial-recognition technology. For
example, the iPhone X contains Apple’s A11 Bionic chip,
within which is a neural engine capable of processing 600
billion operations per second. This additional technology
improves the accuracy of Face ID, making it a distinct
improvement over Touch ID, the fingerprint-recognition
system that Face ID is replacing.
Apple is a leader in 3D-sensing technology for now. How-
ever, I expect other companies to catch up in the next
several years. More interesting, in my opinion, is what
this 3D-sensing technology does and the opportunity
that it presents. 3D applications have already surfaced
on the gaming front, and I expect these to multiply as
the technology advances. One example is the Nintendo/
Niantic smartphone game Pokemon Go, which employs
AR (augmented reality), the ability to incorporate graph-
ics into real-world images.
LEADERSHIP SERIES U.S. EQUITY SECTOR 2018 OUTLOOK
On the home-improvement front, furniture maker IKEA
recently unveiled an app that uses AR to allow users to
scan a room and then place representations of IKEA
furniture in the resulting 3D image. Eventually, I think
3D sensing could be incorporated into automobiles to
enable autonomous driving. Even the popular pastime of
taking “selfies” should get a boost, as smartphones’ 3D
capabilities will automatically correct for the “proximetry
effect,” the distortion that makes your nose look larger
and your face look squeezed in these photos.
$0
$5
$10
$15
$20
$Billion
2016 2017E 2018E 2019E 2020E 2021E
Base Bull Bear

17
U.S. EQUITY SECTOR 2018 OUTLOOK: INFORMATION TECHNOLOGY
I see Apple as a driver of innovation, but I believe invest-
ments in certain component manufacturers may offer
compelling growth opportunities going forward. These
are the companies that make the camera lenses, sensors,
speakers, illuminators, microphones and other prod-
ucts required for smartphone operation, and the use of
features such as 3D sensing. I believe the best-positioned
component makers represent attractive investment
opportunities in the coming year, regardless of which
company ultimately wins the smartphone race.
Charlie Chai, CFA l Sector Portfolio Manager
Charlie Chai is a sector portfolio manager for Fidelity Invest-ments. Mr. Chai, a CFA charterholder, joined Fidelity in 1997 as an equity research analyst, and he has managed multiple technology-related sector and industry portfolios since 2003.
Author
The technology industries can be significantly affected by obsolescence of existing technology, short product cycles, falling prices and profits, competition from new market entrants, and general economic condition.
18
MaterialsAgricultural stocks appear ripe for picking
Rick Malnight l Sector Portfolio Manager
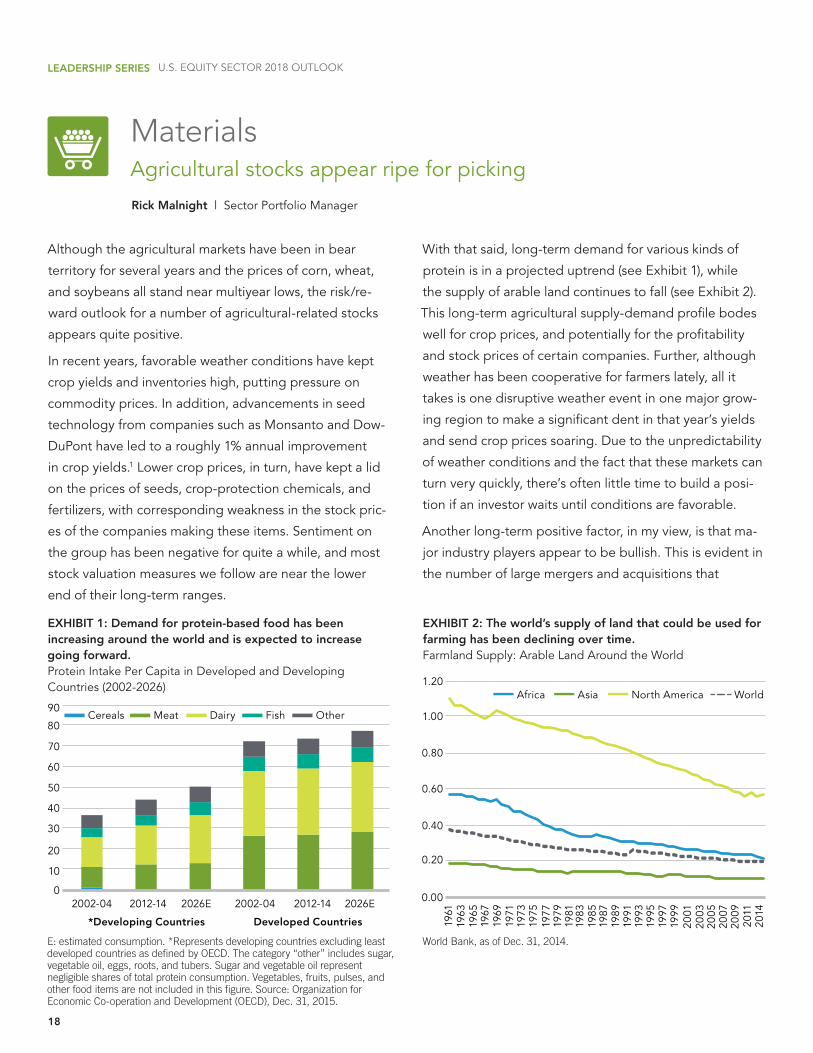
EXHIBIT 1: Demand for protein-based food has been increasing around the world and is expected to increase going forward.Protein Intake Per Capita in Developed and Developing Countries (2002-2026)
EXHIBIT 2: The world’s supply of land that could be used for farming has been declining over time.Farmland Supply: Arable Land Around the World
E: estimated consumption. *Represents developing countries excluding least developed countries as defined by OECD. The category “other” includes sugar, vegetable oil, eggs, roots, and tubers. Sugar and vegetable oil represent negligible shares of total protein consumption. Vegetables, fruits, pulses, and other food items are not included in this figure. Source: Organization for Economic Co-operation and Development (OECD), Dec. 31, 2015.
World Bank, as of Dec. 31, 2014.
Although the agricultural markets have been in bear
territory for several years and the prices of corn, wheat,
and soybeans all stand near multiyear lows, the risk/re-
ward outlook for a number of agricultural-related stocks
appears quite positive.
In recent years, favorable weather conditions have kept
crop yields and inventories high, putting pressure on
commodity prices. In addition, advancements in seed
technology from companies such as Monsanto and Dow-
DuPont have led to a roughly 1% annual improvement
in crop yields.1 Lower crop prices, in turn, have kept a lid
on the prices of seeds, crop-protection chemicals, and
fertilizers, with corresponding weakness in the stock pric-
es of the companies making these items. Sentiment on
the group has been negative for quite a while, and most
stock valuation measures we follow are near the lower
end of their long-term ranges.
LEADERSHIP SERIES U.S. EQUITY SECTOR 2018 OUTLOOK
With that said, long-term demand for various kinds of
protein is in a projected uptrend (see Exhibit 1), while
the supply of arable land continues to fall (see Exhibit 2).
This long-term agricultural supply-demand profile bodes
well for crop prices, and potentially for the profitability
and stock prices of certain companies. Further, although
weather has been cooperative for farmers lately, all it
takes is one disruptive weather event in one major grow-
ing region to make a significant dent in that year’s yields
and send crop prices soaring. Due to the unpredictability
of weather conditions and the fact that these markets can
turn very quickly, there’s often little time to build a posi-
tion if an investor waits until conditions are favorable.
Another long-term positive factor, in my view, is that ma-
jor industry players appear to be bullish. This is evident in
the number of large mergers and acquisitions that
0
10
20
30
40
50
60
70
80
90Cereals Meat Dairy Fish Other
2002-04 2012-14 2026E 2002-04 2012-14 2026E
*Developing Countries Developed Countries
0.00
0.20
0.40
0.60
0.80
1.00
1.20
1961
1963
1965
1967
1969
1971
1973
1975
1977
1979
1981
1983
1985
1987
1989
1991
1993
1995
1997
1999
2001
2003
2005
2007
2009
2011
2014
Africa Asia North America World

19
U.S. EQUITY SECTOR 2018 OUTLOOK: MATERIALS
have occurred lately. In the seed and crop-protection
chemicals categories, we’ve seen a merger between
Dow Chemical and DuPont—which closed at the end of
August—as well as the announced acquisition of Monsan-
to by Germany-based Bayer that is expected to close in
early 2018. Elsewhere, Potash Corporation of Saskatch-
ewan is planning to join with Agrium, combining two
Canada-based makers of fertilizer. This deal is expected
to close in the next few months.
China has also been an active buyer of ag-related compa-
nies. Over the summer, state-owned ChemChina finalized
its purchase of Syngenta, a Swiss maker of pesticides and
seeds. The $44 billion deal was China’s biggest foreign
takeover of all time. Around the same time, Dow Chem-
ical announced that an agriculture fund backed by the
Chinese government would pay $1.1 billion for its Bra-
zilian corn seed and research business. Overall, Chinese
Rick Malnight l Sector Portfolio Manager
Rick Malnight is a portfolio manager and research analyst for Fidelity Investments. Mr. Malnight, who joined Fidelity in 2007, is responsible for managing multiple portfolios focused on the materials sectors.
Author
firms have spent $91 billion over the past decade pur-
chasing nearly 300 foreign companies involved in agricul-
ture, chemicals, and food, according to deal-tracking firm
Dealogic. The acquisitions are part of the nation’s plan to
improve its ability to feed its population of nearly
1.4 billion.2
Given these developments, I remain optimistic that the in-
vestment prospects for higher-quality agricultural-related
stocks over the next several years are quite compelling.
Endnotes1 Fidelity Investments, as of Dec. 1, 2017.2 http://money.cnn.com/2017/07/13/news/china-food-seeds-agriculture/index.html
Materials industries can be significantly affected by the level and volatility of commodity prices, the exchange value of the dollar, import controls, worldwide competition, liability for environmental damage, depletion of resources, and mandated expenditures for safety and pollution control.
20
Real EstateUndervalued retail REITs that are expected to survive the competitive threat posed by online retailers look attractive
Steven Buller l Sector Portfolio Manager
Samuel Wald l Sector Portfolio Manager
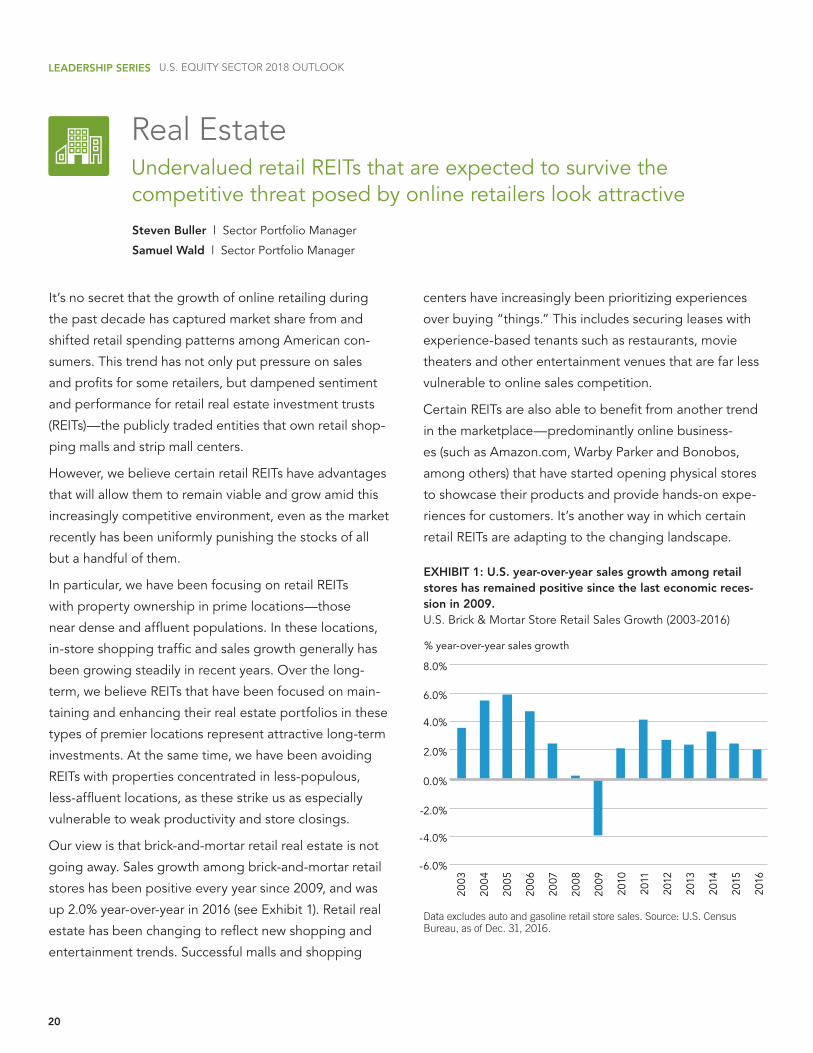
EXHIBIT 1: U.S. year-over-year sales growth among retail stores has remained positive since the last economic reces-sion in 2009.U.S. Brick & Mortar Store Retail Sales Growth (2003-2016)
Data excludes auto and gasoline retail store sales. Source: U.S. Census Bureau, as of Dec. 31, 2016.
It’s no secret that the growth of online retailing during
the past decade has captured market share from and
shifted retail spending patterns among American con-
sumers. This trend has not only put pressure on sales
and profits for some retailers, but dampened sentiment
and performance for retail real estate investment trusts
(REITs)—the publicly traded entities that own retail shop-
ping malls and strip mall centers.
However, we believe certain retail REITs have advantages
that will allow them to remain viable and grow amid this
increasingly competitive environment, even as the market
recently has been uniformly punishing the stocks of all
but a handful of them.
In particular, we have been focusing on retail REITs
with property ownership in prime locations—those
near dense and affluent populations. In these locations,
in-store shopping traffic and sales growth generally has
been growing steadily in recent years. Over the long-
term, we believe REITs that have been focused on main-
taining and enhancing their real estate portfolios in these
types of premier locations represent attractive long-term
investments. At the same time, we have been avoiding
REITs with properties concentrated in less-populous,
less-affluent locations, as these strike us as especially
vulnerable to weak productivity and store closings.
Our view is that brick-and-mortar retail real estate is not
going away. Sales growth among brick-and-mortar retail
stores has been positive every year since 2009, and was
up 2.0% year-over-year in 2016 (see Exhibit 1). Retail real
estate has been changing to reflect new shopping and
entertainment trends. Successful malls and shopping
LEADERSHIP SERIES U.S. EQUITY SECTOR 2018 OUTLOOK
centers have increasingly been prioritizing experiences
over buying “things.” This includes securing leases with
experience-based tenants such as restaurants, movie
theaters and other entertainment venues that are far less
vulnerable to online sales competition.
Certain REITs are also able to benefit from another trend
in the marketplace—predominantly online business-
es (such as Amazon.com, Warby Parker and Bonobos,
among others) that have started opening physical stores
to showcase their products and provide hands-on expe-
riences for customers. It’s another way in which certain
retail REITs are adapting to the changing landscape.
% year-over-year sales growth
2003
2004
2005
2006
2007
2008
2009
2010
2011
2012
2013
2014
2015
2016
-6.0%
-4.0%
-2.0%
0.0%
2.0%
4.0%
6.0%
8.0%

21
Andrew Rubin, an institutional portfolio manager who is a member of the REIT equity and high income real estate debt teams, also contributed to this article.
A REIT issues securities that trade like stock on the major exchanges, and invests in real estate directly, either through properties or mortgages. A REIT is required to invest at least 75% of total assets in real estate and distribute 90% of its taxable income to investors. Stock markets are volatile and can fluctuate significantly in response to company, industry, political, regulatory, market, or economic developments. Investing in stock involves risks, including the loss of principal. Illiquidity is an inherent risk associated with investing in real estate and REITs. There is no guarantee the issuer of a REIT will maintain the secondary market for its shares, and redemptions may be at a price which is more or less than the original price paid.
Changes in real estate values or economic downturns can have a significant negative effect on issuers in the real estate industry. Because of its narrow focus, sector investing tends to be more volatile than investments that diversify across many sectors and companies. Sector investing is also subject to the additional risks associated with its particular industry.
U.S. EQUITY SECTOR 2018 OUTLOOK: REAL ESTATE
Meanwhile, we believe the weakened sentiment for retail
REITs in general has been overly punitive for many of the
better-positioned companies. Depressed valuations for
certain retail REIT stocks provide attractive opportunities
going into 2018, as we look to distinguish between the
potential “winners” and “losers” in the marketplace.
While our portfolios have generally been underweighted
in retail REITs relative to their respective benchmarks, we
have been prioritizing those we believe are positioned
well to address the competitive threat of e-commerce.
Our focus: retail REITs that own the highest-quality,
best-located properties; that are attracting the right mix
Steven Buller l Sector Portfolio Manager
Steven Buller is a portfolio manager at Fidelity Investments. He currently manages several portfolios that invest in REITs and other real estate securities, for both U.S. and foreign investors.
Samuel Wald l Sector Portfolio Manager
Samuel Wald is a portfolio manager at Fidelity Investments. He currently manages several portfolios and subportfolios that invest in REITs and other real estate securities.
Authors
of tenants; and that are trading at undeservedly cheap
valuations due to investors’ skepticism about the future of
brick-and-mortar retail.
22
Telecommunication ServicesCable companies stand to benefit from broadband growth
Matthew Drukker l Sector Portfolio Manager
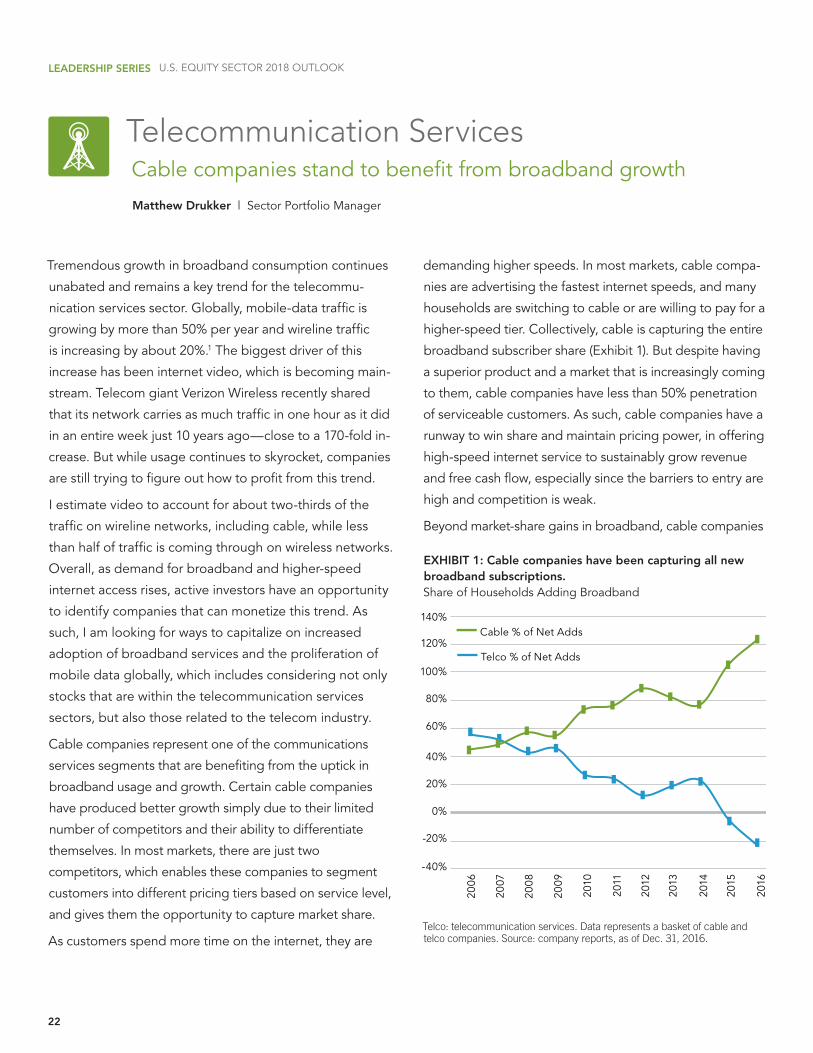
EXHIBIT 1: Cable companies have been capturing all new broadband subscriptions.Share of Households Adding Broadband
Telco: telecommunication services. Data represents a basket of cable and telco companies. Source: company reports, as of Dec. 31, 2016.
Tremendous growth in broadband consumption continues
unabated and remains a key trend for the telecommu-
nication services sector. Globally, mobile-data traffic is
growing by more than 50% per year and wireline traffic
is increasing by about 20%.1 The biggest driver of this
increase has been internet video, which is becoming main-
stream. Telecom giant Verizon Wireless recently shared
that its network carries as much traffic in one hour as it did
in an entire week just 10 years ago—close to a 170-fold in-
crease. But while usage continues to skyrocket, companies
are still trying to figure out how to profit from this trend.
I estimate video to account for about two-thirds of the
traffic on wireline networks, including cable, while less
than half of traffic is coming through on wireless networks.
Overall, as demand for broadband and higher-speed
internet access rises, active investors have an opportunity
to identify companies that can monetize this trend. As
such, I am looking for ways to capitalize on increased
adoption of broadband services and the proliferation of
mobile data globally, which includes considering not only
stocks that are within the telecommunication services
sectors, but also those related to the telecom industry.
Cable companies represent one of the communications
services segments that are benefiting from the uptick in
broadband usage and growth. Certain cable companies
have produced better growth simply due to their limited
number of competitors and their ability to differentiate
themselves. In most markets, there are just two
competitors, which enables these companies to segment
customers into different pricing tiers based on service level,
and gives them the opportunity to capture market share.
As customers spend more time on the internet, they are
LEADERSHIP SERIES U.S. EQUITY SECTOR 2018 OUTLOOK
demanding higher speeds. In most markets, cable compa-
nies are advertising the fastest internet speeds, and many
households are switching to cable or are willing to pay for a
higher-speed tier. Collectively, cable is capturing the entire
broadband subscriber share (Exhibit 1). But despite having
a superior product and a market that is increasingly coming
to them, cable companies have less than 50% penetration
of serviceable customers. As such, cable companies have a
runway to win share and maintain pricing power, in offering
high-speed internet service to sustainably grow revenue
and free cash flow, especially since the barriers to entry are
high and competition is weak.
Beyond market-share gains in broadband, cable companies
-40%
-20%
0%
20%
40%
60%
80%
100%
120%
140%
2006
2007
2008
2009
2010
2011
2012
2013
2014
2015
2016
Cable % of Net Adds
Telco % of Net Adds

23
Endnotes1 Source: Cisco, VNI Forecast Highlights Tool, as of Dec. 31, 2016.
The telecommunication services industries are subject to government regulation of rates of return and services that may be offered, and can be significantly affected by intense competition.
U.S. EQUITY SECTOR 2018 OUTLOOK: TELECOMMUNICATION SERVICES
may also have a better chance of capitalizing on growth
in online video consumption with usage-based pricing. If
done properly, usage-based pricing could more than offset
headwinds from paid-TV cord-cutting—the consumer trend
toward opting out of more expensive cable plans in favor of
streaming services such as Netflix, Amazon Prime, and Hulu.
Online streaming services require high-speed internet, and
cable faces little competition in this area. As more viewing
migrates online, on-demand cable offerings could be-
come the default aggregators of video content. This edge
could offer cable companies yet another way to differenti-
Matthew Drukker l Sector Portfolio Manager
Matthew Drukker is a portfolio manager and research analyst for Fidelity Investments. Mr. Drukker joined Fidelity in 2008 and is responsible for managing multiple sector and industry portfolios related to telecommunications and multimedia.
Author
ate themselves and maintain flexibility in pricing, and the
opportunity to harness long-term revenue growth and
increase free cash flow, both drivers of valuation growth.
24
UtilitiesHigher power prices are supportive of better-than-expected earnings and cash flow for power companies
Douglas Simmons l Sector Portfolio Manager
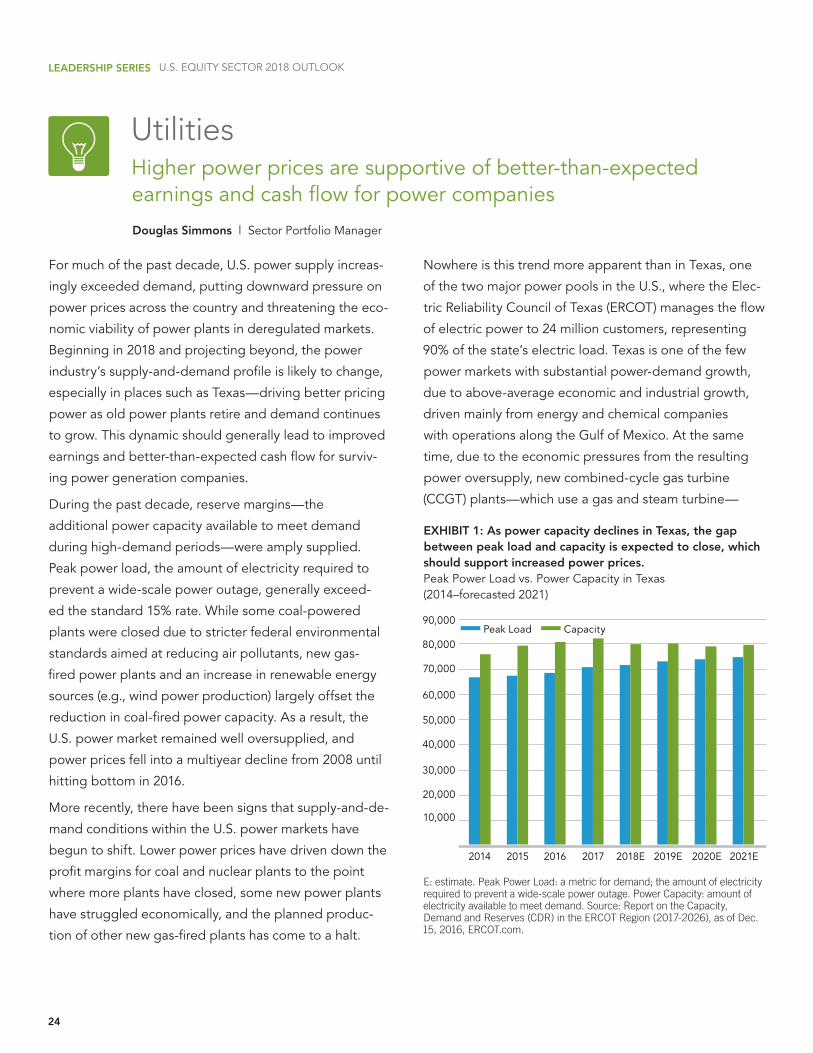
EXHIBIT 1: As power capacity declines in Texas, the gap between peak load and capacity is expected to close, which should support increased power prices.Peak Power Load vs. Power Capacity in Texas (2014–forecasted 2021)
E: estimate. Peak Power Load: a metric for demand; the amount of electricity required to prevent a wide-scale power outage. Power Capacity: amount of electricity available to meet demand. Source: Report on the Capacity, Demand and Reserves (CDR) in the ERCOT Region (2017-2026), as of Dec. 15, 2016, ERCOT.com.
For much of the past decade, U.S. power supply increas-
ingly exceeded demand, putting downward pressure on
power prices across the country and threatening the eco-
nomic viability of power plants in deregulated markets.
Beginning in 2018 and projecting beyond, the power
industry’s supply-and-demand profile is likely to change,
especially in places such as Texas—driving better pricing
power as old power plants retire and demand continues
to grow. This dynamic should generally lead to improved
earnings and better-than-expected cash flow for surviv-
ing power generation companies.
During the past decade, reserve margins—the
additional power capacity available to meet demand
during high-demand periods—were amply supplied.
Peak power load, the amount of electricity required to
prevent a wide-scale power outage, generally exceed-
ed the standard 15% rate. While some coal-powered
plants were closed due to stricter federal environmental
standards aimed at reducing air pollutants, new gas-
fired power plants and an increase in renewable energy
sources (e.g., wind power production) largely offset the
reduction in coal-fired power capacity. As a result, the
U.S. power market remained well oversupplied, and
power prices fell into a multiyear decline from 2008 until
hitting bottom in 2016.
More recently, there have been signs that supply-and-de-
mand conditions within the U.S. power markets have
begun to shift. Lower power prices have driven down the
profit margins for coal and nuclear plants to the point
where more plants have closed, some new power plants
have struggled economically, and the planned produc-
tion of other new gas-fired plants has come to a halt.
LEADERSHIP SERIES U.S. EQUITY SECTOR 2018 OUTLOOK
Nowhere is this trend more apparent than in Texas, one
of the two major power pools in the U.S., where the Elec-
tric Reliability Council of Texas (ERCOT) manages the flow
of electric power to 24 million customers, representing
90% of the state’s electric load. Texas is one of the few
power markets with substantial power-demand growth,
due to above-average economic and industrial growth,
driven mainly from energy and chemical companies
with operations along the Gulf of Mexico. At the same
time, due to the economic pressures from the resulting
power oversupply, new combined-cycle gas turbine
(CCGT) plants—which use a gas and steam turbine—
10,000
20,000
30,000
40,000
50,000
60,000
70,000
80,000
90,000
2014 2015 2016 2017 2018E 2019E 2020E 2021E
Peak Load Capacity

25
U.S. EQUITY SECTOR 2018 OUTLOOK: UTILITIES
have been put on hold, and coal- and gas-fired plants are
being retired.*
In sum, these plant closings are accelerating supply
rationalization in Texas, solidifying our conviction that
not only will power supply and demand tighten in 2018
and beyond, but this contraction will occur more quickly
than the market is anticipating (see Exhibit 1). Further, if
there is severe weather in the summer, combined with
outages—such as extended heat waves that stress older
plants—that gap could tighten even faster. As Texas
regains a more balanced supply-and-demand ratio, we
Douglas Simmons l Sector Portfolio Manager
Douglas Simmons is a portfolio manager for Fidelity Invest-ments. Mr. Simmons currently manages several utilities sector portfolios and subportfolios, and serves as co-manager of diversified equity portfolios. Mr. Simmons joined Fidelity in 2003, covering the environmental sector, as well as electric and gas utilities.
Author
expect other markets will quickly follow, benefiting those
surviving power generation companies that exhibit solid
business fundamentals.
The utilities industries can be significantly affected by government regulation, financing difficulties, supply and demand for services or fuel, and natural resource conservation.
* For example, in a surprising move in mid-October, Texas-based Vistra Energy, the state’s largest provider of electricity and natural gas, announced the retirement of two coal-fired plants, taking 2,300 mega-watts (MW) of coal capacity off-line, citing a lack of economic viability for these plants. This announcement came just one week after the company stated it was closing its three-unit 1,800-MW coal plant. In Texas’s market of 81,000MW in supply, these decisions resulted in 5% of the state’s power supply being removed in just two weeks. Vistra also has plans to close additional plants by 2020, due to marginal economics, inefficiency and/or high pollution levels—all helping to narrow the power supply and demand gap and bolster the company’s bottom line.

Unless otherwise disclosed to you, any investment or management recommendation in this document is not meant to be impartial investment advice or advice in a fiduciary capacity, is intended to be educational, and is not tailored to the investment needs of any specific individual. Fidelity and its representatives have a financial interest in any investment alternatives or transactions described in this document. Fidelity receives compensation from Fidelity funds and products, certain third-party funds and products, and certain investment services. The compensation that is received, either directly or indirectly, by Fidelity may vary based on such funds, products, and services, which can create a conflict of interest for Fidelity and its representatives. Fiduciaries are solely responsible for exercising independent judgment in evaluating any transaction(s) and are assumed to be capable of evaluating investment risks independently, both in general and with regard to particular transactions and investment strategies.
Views expressed are as of Dec. 1, 2017, based on the information available at that time, and may change based on market and other conditions. Unless otherwise noted, the opinions provided are those of the author and not necessarily those of Fidelity Investments or its affiliates. Fidelity does not assume any duty to update any of the information.
References to specific securities or investment themes are for illustrative purposes only and should not be construed as recommendations or investment advice. This information must not be relied upon in making any investment decision. Fidelity cannot be held responsible for any type of loss incurred by applying any of the information presented. These views must not be relied upon as an indication of trading intent of any Fidelity fund or Fidelity advisor. Investment decisions should be based on an individual’s own goals, time horizon, and tolerance for risk.
This piece may contain assumptions that are “forward-looking statements,” which are based on certain assumptions of future events. Actual events are difficult to predict and may differ from those assumed. There can be no assurance that forward-looking statements will materialize or that actual returns or results will not be materially different from those described here.
Past performance and dividend rates are historical and do not guarantee future results.
Diversification and asset allocation do not ensure a profit or guarantee against loss.
Investing involves risk, including risk of loss.
Stock markets are volatile and can decline significantly in response to adverse issuer, political, regulatory, market, or economic developments.Foreign markets can be more volatile than U.S. markets due to increased risks of adverse issuer, political, market or economic developments, all of which are magnified in emerging markets. These risks are particularly significant for funds that focus on a single country or region.
Because of its narrow focus, sector investing tends to be more volatile than investments that diversify across many sectors and companies. Sector investing is also subject to the additional risks associated with its particular industry.
It is not possible to invest directly in an index. All indexes are unmanaged.
Index definitionsThe S&P 500® Index is a market capitalization-weighted index of 500 common stocks chosen for market size, liquidity, and industry group representation to represent U.S. equity performance. S&P 500 is a registered service mark of The McGraw-Hill Companies, Inc., and has been licensed for use by Fidelity Distributors Corporation and its affiliates. The S&P 500® Sector Indices include the standard GICS® sectors that make up the S&P 500® Index. The market capitalization of all 10 S&P 500® Sector Indices together composes the market capitalization of the parent S&P 500® Index; all members of the S&P 500® Index are assigned to one (and only one) sector. The S&P Composite 1500® and its sub-indices combine three leading indices, the S&P 500®, the S&P MidCap 400®, and the S&P SmallCap 600® to cover approximately 90% of the U.S. market capitalization. It is designed for investors seeking to replicate the performance of the U.S. equity market or benchmark against a representative universe of tradable stocks. The Russell 1000® Index is a market capitalization-weighted index representing the largest 1000 stocks of publicly traded companies in the Russell 3000® Index. FTSE National Association of Real Estate Investment Trusts (NAREIT) All Equity REITs Index is a market capitalization-weighted index that is designed to measure the performance of all tax-qualified REITs listed on the NYSE, the American Stock Exchange, or the NASDAQ National Market List. The Cisco® Global Cloud Index (GCI) is an ongoing effort to forecast the growth of global data center and cloud-based IP traffic. The forecast includes trends associated with data center virtualization and cloud computing. The CRB BLS Spot Market Price Index tracks 22 commodities presumed to be among the first influenced by changes in economic conditions.
GlossaryPrice-to-earnings ratio: the market price per share of a stock (or group of stocks) divided by a company’s earnings per share. M1: a measure of the most liquid portions of a country’s money supply. Third-party marks are the property of their respective owners; all other marks are the property of FMR LLC.
The Chartered Financial Analyst (CFA) designation is offered by the CFA Institute. To obtain the CFA charter, candidates must pass three exams demonstrating their competence, integrity, and extensive knowledge in accounting, ethical and professional standards, economics, portfolio management, and security analysis, and must also have at least four years of qualifying work experience, among other requirements.
If receiving this piece through your relationship with Fidelity Institutional Asset Management® (FIAM), this publication may be provided by Fidelity Investments Institutional Services Company, Inc., Fidelity Institutional Asset Management Trust Company, or FIAM LLC, depending on your relationship.
If receiving this piece through your relationship with Fidelity Personal & Workplace Investing (PWI) or Fidelity Family Office Services (FFOS), this publication is provided through Fidelity Brokerage Services LLC, Member NYSE, SIPC.
If receiving this piece through your relationship with Fidelity Clearing & Custody Solutions® or Fidelity Capital Markets, this publication is for institutional investor or investment professional use only. Clearing, custody, or other brokerage services are provided through National Financial Services LLC or Fidelity Brokerage Services LLC, Members NYSE, SIPC.
©2017 FMR LLC. All rights reserved.
818829.1.0