Embed Size (px)
Citation preview


Southern/USEPA-GHG-QAP-32 June 2004
Test and Quality Assurance Plan Paques THIOPAQ and Shell-Paques Gas Purification Technology
Prepared by:
Greenhouse Gas Technology CenterSouthern Research Institute
Under a Cooperative Agreement With U.S. Environmental Protection Agency

EPA REVIEW NOTICE
This report has been peer and administratively reviewed by the U.S. Environmental Protection Agency, and approved for publication. Mention of trade names or commercial products does not constitute endorsement or recommendation for use.
Southern/USEPA-GHG-QAP-32 June 2004
Greenhouse Gas Technology Center( ) A U.S. EPA Sponsored Environmental Technology Verification Organization
Test and Quality Assurance Plan
Paques THIOPAQ and Shell-Paques Gas Purification Technology
Prepared by: Greenhouse Gas Technology Center
Southern Research Institute PO Box 13825
Research Triangle Park, NC 27709 USA Telephone: 919/806-3456
Reviewed by: Natco Group, Inc.
Shell Global Solutions. U.S. EPA Office of Research and Development QA Team
indicates comments are integrated into Test Plan

(This page intentionally left blank)

Greenhouse Gas Technology Center A U.S. EPA Sponsored Environmental Technology Verification ( ) Organization
Test and Quality Assurance Plan
Paques THIOPAQ and Shell-Paques Gas Purification Technology
This Test and Quality Assurance Plan has been reviewed and approved by the Greenhouse Gas Technology Center Project Manager and Director, the U.S. EPA APPCD Project Officer, and the U.S. EPA APPCD Quality Assurance Manager.
Timothy Hansen Date David Kirchgessner Date Deputy Director APPCD Project Officer Greenhouse Gas Technology Center U.S. EPA Southern Research Institute
William Chatterton Date Robert S. Wright Date Project Manager APPCD Quality Assurance Manager Greenhouse Gas Technology Center U.S. EPA Southern Research Institute
Ashley Williamson Date Quality Assurance Manager Greenhouse Gas Technology Center Southern Research Institute
Test Plan Final: June 2004

(This page intentionally left blank)
TABLE OF CONTENTS Page
Appendices ................................................................................................................................................iii List of Figures ................................................................................................................................................iii List of Tables ................................................................................................................................................iii Acronyms/Abbreviations ..................................................................................................................................iv Distribution List ................................................................................................................................................vi
1.0 INTRODUCTION...................................................................................................................................1-11.1 BACKGROUND ..........................................................................................................................1-11.2 THIOPAQ AND SHELL-PAQUES SYSTEMS TECHNOLOGY DESCRIPTION ...................1-2
1.2.1 Paques THIOPAQ Process...............................................................................................1-31.2.2 Shell-Paques Process........................................................................................................1-4
1.3 PLANT DESCRIPTIONS AND SYSTEM INTEGRATION ......................................................1-61.3.1 Host WPCF - (Paques THIOPAQ™) ..............................................................................1-61.3.2 Encana Bantry - (Shell-Paques) .......................................................................................1-8
1.4 PERFORMANCE VERIFICATION PARAMETERS.................................................................1-91.4.1 Environmental Performance Parameters........................................................................1-101.4.2 Operational Performance Parameters.............................................................................1-101.4.3 Shell-Paques Performance .............................................................................................1-11
1.5. ORGANIZATION ......................................................................................................................1-121.6. SCHEDULE................................................................................................................................1-13
2.0 VERIFICATION APPROACH...............................................................................................................2-12.1 OVERVIEW .................................................................................................................................2-12.2 ENVIRONMENTAL PERFORMANCE......................................................................................2-3
2.2.1 Air Emissions of Sulfur Compounds ...............................................................................2-32.2.3 Sulfur in Liquid Effluent..................................................................................................2-6
2.3 OPERATIONAL PERFORMANCE ............................................................................................2-72.3.1 H2S Removal Efficiency and Gas Quality .......................................................................2-72.3.2 NaOH Consumption.........................................................................................................2-92.3.3 Solids and Elemental Sulfur Production ..........................................................................2-9
2.4 PROCESS OPERATIONS MONITORING...............................................................................2-10
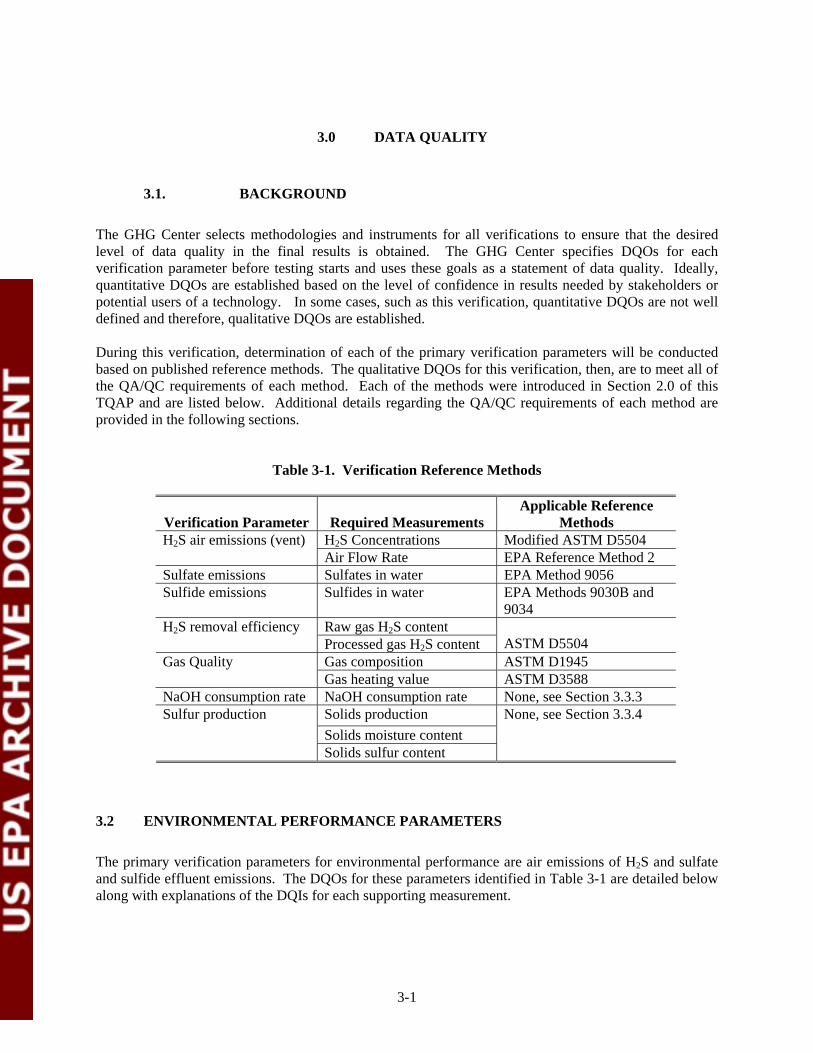
3.0 DATA QUALITY ...................................................................................................................................3-13.1 BACKGROUND ..........................................................................................................................3-13.2 ENVIRONMENTAL PERFORMANCE PARAMETERS ..........................................................3-13.3 OPERATIONAL PERFORMANCE PARAMETERS.................................................................3-4
3.3.1 H2S Removal Efficiency ..................................................................................................3-43.7 INSTRUMENT TESTING, INSPECTION, AND MAINTENANCE .........................................3-6
4.0 DATA ACQUISITION, VALIDATION, AND REPORTING................................................................ 14.1 DATA ACQUISITION AND STORAGE....................................................................................... 1
4.1.2 Laboratory Analyses ........................................................................................................... 14.2 DATA REVIEW, VALIDATION, AND VERIFICATION............................................................ 24.3 RECONCILIATION OF DATA QUALITY OBJECTIVES........................................................... 24.4 ASSESSMENTS AND RESPONSE ACTIONS ............................................................................. 3
4.4.1 Project Reviews .................................................................................................................. 34.4.2 Technical Systems Audit .................................................................................................... 34.4.3 Audit of Data Quality.......................................................................................................... 4
i

4.5 DOCUMENTATION AND REPORTS .......................................................................................... 44.5.1 Field Test Documentation................................................................................................... 44.5.2 QC Documentation ............................................................................................................. 54.5.3 Corrective Action and Assessment Reports ........................................................................ 54.5.4 Verification Report and Verification Statement ................................................................. 5
4.6 TRAINING AND QUALIFICATIONS .......................................................................................... 64.7 HEALTH AND SAFETY REQUIREMENTS ................................................................................ 6
5.0 REFERENCES........................................................................................................................................... 1
ii
APPENDICES Page
APPENDIX A Test Procedures and Field Log Forms ............................................................. A-1
LIST OF FIGURES Page
Figure 1-1 THIOPAQ and Shell-Paques System Schematic .............................................. 1-4 Figure 1-2 Typical THIOPAQ System ............................................................................... 1-7 Figure 1-3 Project Organization ....................................................................................... 1-12 Figure 2-1 Schematic of Verification Boundary and Measurement Locations .................. 2-3
LIST OF TABLES Page
Table 1-1 Host Site THIOPAQTM Monitoring Instrumentation ........................................ 1-8 Table 1-2 Bantry Shell-Paques Sytem Design Cases ........................................................ 1-9 Table 2-1 THIOPAQ and Shell-Paques Verification Test Matrix..................................... 2-2 Table 3-1 Verification Reference Methods ....................................................................... 3-1 Table 3-2 Summary of Vent Air H2S Analyses QA/QC Checks....................................... 3-2 Table 3-3 Summary of Effluent Sulfate Analyses QA/QC Checks................................... 3-3 Table 3-4 Summary of Effluent Sulfide Analyses QA/QC Checks .................................. 3-4 Table 3-5 Summary of Biogas H2S Analyses QA/QC Checks.......................................... 3-5
iii

Abs. Diff. absolute difference ADQ Audit of Data Quality ANSI American National Standards Institute APPCD Air Pollution Prevention and Control Division ASME American Society of Mechanical Engineers ASTM American Society for Testing and Materials Btu British thermal units Btu/scf British thermal units per standard cubic foot C1 quantification of methane C6+ hexanes plus CAR Corrective Action Report CH4 methane °C degrees Celsius oF degrees Fahrenheit oR degrees Rankine DP differential pressure DQI data quality indicator DQO data quality objective dscf/MMBtu dry standard cubic feet per million British thermal units EPA Environmental Protection Agency ETV Environmental Technology Verification fps ft3
feet per second cubic feet
gal U.S. gallons GC gas chromatograph GHG Center Greenhouse Gas Technology Center gal/min gallons per minute gal/day gallons per day hr hour lb pound lb/dscf pounds per dry standard cubic foot lb/hr pounds per hour lb/yr pounds per year LHV lower heating value liters per minute lpm MMBtu/hr million British thermal units per hour MMcf million cubic feet mol molecular NIST National Institute of Standards and Technology O2 oxygen ORD Office of Research and Development PEA Performance Evaluation Audit ppbv parts per billion volume ppmv parts per million volume ppmvd parts per million volume dry
ACRONYMS/ABBREVIATIONS
iv

ACRONYMS/ABBREVIATIONS (continued)
psia pounds per square inch absolute psig pounds per square inch gauge QA/QC Quality Assurance/Quality Control QMP Quality Management Plan Rel. Diff. relative difference Report Environmental Technology Verification Report rms root mean square scfh standard cubic feet per hour scfm standard cubic feet per minute scmd standard cubic meter per day Test Plan Test and Quality Assurance Plan TSA technical systems audit U.S. United States WPCF Water Pollution Control Facilities
v

DISTRIBUTION LIST
Natco Group, Inc. Robert Curcio
David Mirdadian Al Lanning
Shell Global Solutions Michael Golda
Paques Alex Benschop
U.S. EPA – Office of Research and Development David Kirchgessner
Robert S. Wright
Southern Research Institute (GHG Center) Stephen Piccot Robert Richards
William Chatterton Ashley Williamson
vi

1.0 INTRODUCTION
1.1 BACKGROUND
The U.S. Environmental Protection Agency’s Office of Research and Development (EPA-ORD) operates the Environmental Technology Verification (ETV) program to facilitate the deployment of innovative technologies through performance verification and information dissemination. The goal of the ETV program is to further environmental protection by substantially accelerating the acceptance and use of improved and innovative environmental technologies. Congress funds ETV in response to the belief that there are many viable environmental technologies that are not being used for the lack of credible third-party performance data. With performance data developed under this program, technology buyers, financiers, and permitters in the United States and abroad will be better equipped to make informed decisions regarding environmental technology purchase and use.
The Greenhouse Gas Technology Center (GHG Center) is one of six verification organizations operating under the ETV program. The GHG Center is managed by EPA’s partner verification organization, Southern Research Institute (Southern), which conducts verification testing of promising GHG mitigation and monitoring technologies. The GHG Center’s verification process consists of developing verification protocols, conducting field tests, collecting and interpreting field and other data, obtaining independent peer-review input, and reporting findings. Performance evaluations are conducted according to externally reviewed verification Test and Quality Assurance Plans (Test Plans) and established protocols for quality assurance (QA).
The GHG Center is guided by volunteer groups of stakeholders. These stakeholders offer advice on specific technologies most appropriate for testing, help disseminate results, and review Test Plans and Technology Verification Reports. The GHG Center’s Executive Stakeholder Group consists of national and international experts in the areas of climate science and environmental policy, technology, and regulation. It also includes industry trade organizations, environmental technology finance groups, governmental organizations, and other interested groups. The GHG Center’s activities are also guided by industry-specific stakeholders who provide guidance on the verification testing strategy related to their area of expertise and who peer-review key documents prepared by the GHG Center.
A technology area of interest to some GHG Center stakeholders is reliable renewable energy sources. The generation of heat and power at industrial, petrochemical, agricultural, and waste-handling facilities with renewable energy sources such as anaerobic digester gas (biogas) or landfill gas is a particular interest. These gases, when released to atmosphere, contribute millions of tons of methane emissions annually in the U.S. Cost-effective technologies are available that can curb this emission growth by processing the gases to remove harmful constituents, recovering the methane, and using it as an energy source. Removal of the harmful components of biogases (primarily hydrogen sulfide and other sulfurous compounds) while minimizing the creation of secondary waste streams and effluents is essential to development of these renewable energy sources.
NATCO Group, Inc. (NATCO), located in Houston, Texas, has requested that the GHG Center perform an independent performance verification of the Paques THIOPAQ technology – a gas purification system. This technology, developed in The Netherlands by Paques BioSystems, is designed to safely and efficiently remove hydrogen sulfide (H2S) from biogas and other sour gases while minimizing the generation of harmful emissions or effluents. The process is suitable to applications where the practices of venting, incineration, or re-injection of the collected H2S are not desirable options. The system also
1-1
allows the production of elemental sulfur for subsequent sale or use. A variation of this technology is the Shell-Paques system, which operates on the same principles as THIOPAQ, but includes system components that can process low-, medium-, and high-pressure natural gas. The Shell-Paques version is of particular interest to the natural gas, petrochemical, and refining industries. Since the two versions of the technology are very similar in principle and operation, the verification will apply to both. A THIOPAQ system installed and operating at a midwestern water pollution control facility (WPCF) and a Shell-Paques system at the Bantry Gas Plant LSD 8-20-13W4M in Brooks, Alberta, Canada have been selected for this verification.
Field tests will be performed on Paques THIOPAQ and Shell-Paques systems to independently verify the performance of this technology. The verification will include evaluations of both environmental and operational performance of the systems. This document is the Test and Quality Assurance Plan (TQAP) for performance verification of the THIOPAQ and Shell-Paques systems. It contains the rationale for the selection of verification parameters, the verification approach, data quality objectives (DQOs), and Quality Assurance/Quality Control (QA/QC) procedures. The TQAP will guide implementation of the test program, development of the subsequent Verification Report (VR) and Verification Statement (VS), and data analysis.
This TQAP has been reviewed by NATCO, the EPA QA team, and selected members of the Center’s Advanced Energy Stakeholder group. Final approval of the TQAP is indicated by the signatures at the front of the document. This indicates that the TQAP meets the requirements of the GHG Center’s Quality Management Plan (QMP), thereby satisfying the ETV QMP requirements. The final TQAP will be posted on the web sites maintained by the GHG Center (www.sri-rtp.com) and the ETV program (www.epa.gov/etv).
The GHG Center will prepare a VR and VS upon field-test completion. The VR and VS will be reviewed by the same organizations listed above, followed by EPA-ORD technical, QA, and editorial reviews. The GHG Center Director and EPA-ORD Laboratory Director will sign the VS when this review is complete, and the final documents will be posted on the GHG Center and ETV program web sites.
The following section provides a detailed description of the Paques THIOPAQ and Shell-Paques systems and a brief description of the verification test locations. This is followed by a list of performance verification parameters that will be quantified through independent testing at the sites. The section concludes with a discussion of key organizations participating in this verification, their roles, and the verification test schedule. Section 2.0 describes the technical approach for verifying each parameter, including sampling and analytical procedures. Section 3.0 identifies the data quality assessment criteria for critical measurements and states the accuracy, precision, and completeness goals for each measurement. Section 4.0 discusses data acquisition, validation, reporting, and auditing procedures.
1.2 THIOPAQ AND SHELL-PAQUES SYSTEMS TECHNOLOGY DESCRIPTION
Renewable biogas produced from the management of municipal and farm waste is a potentially viable energy source. Operational performance data is needed to verify the ability of technologies to remove contaminants in biologically generated gas streams. Biogas can be made more usable and environmentally benign if contaminants (primarily H2S) are removed prior to their use as an energy source. Conventional H2S removal technologies such as caustic scrubbers are available, but these systems may be costly to operate and produce hazardous effluents. Redox processes are also available, but these require use of chelating agents and generate potentially hazardous effluents.
1-2
1.2.1 Paques THIOPAQ Process
THIOPAQ™ is a biotechnological process for removing H2S from gaseous streams by absorption into a mild alkaline solution followed by the oxidation of the absorbed sulfide to elemental sulfur by naturally occurring microorganisms. THIOPAQ™ is licensed by Paques for biogas application and Shell, Paques, and UOP for refinery gas and other applications. The THIOPAQ™ trademark name is owned by Paques BV. The THIOPAQ™ process is used at the host WPCF.
The Paques desulfurization technology, offered by NATCO, is a caustic scrubber-based system designed to maintain a high level of H2S removal while addressing several shortcomings of conventional technologies. This technology is designed to: (1) reduce hazardous effluents from the scrubber by aerobically digesting the waste into a more benign sulfurous product, and (2) regenerate and recycle sodium hydroxide (NaOH) needed in the scrubber. The THIOPAQ™ system is specifically designed for low-pressure biogas streams. The Shell-Paques process (described in more detail in Section 1.2.2.1) used in Bantry is basically a high-pressure version of the THIOPAQ™ process. H2S to sulfur conversion efficiency for both systems is expected to be between 95 and 97 percent.
The THIOPAQ™ process begins with the input of biogas or sour natural gas into an absorber unit (or scrubber) at ambient pressure. The counter-current scrubber design washes the sour natural gas (or biogas) in three packed beds containing 2-inch Pall rings. A total draw-off tray combined with a liquid redistribution tray in-between the packed beds ensures proper liquid redistribution. Treated natural gas (sweet gas) exits the scrubber top, enters a knockout drum, and is routed to the sales gas stream.
The liquid stream is then sent to the bioreactor (ambient pressure). A blower supplies air to a distribution header in the bottom section of the reactor, enhancing mixing. Some of the oxygen is consumed in reactions with sulfide to produce sulfur by the actions of the Thiobacillus Bacteria. The bacteria are maintained using a continuous feed of proprietary nutrients supplied by Paques. These nutrients are pumped into the bioreactor with a small metering pump.
Regenerated solvent from the bioreactor is pumped back to the scrubber for reuse. A portion of the solvent from the bioreactor is also pumped to a settling tank where solids are separated from the solution and collected gravimetrically. The solution is then recycled back to the bioreactor for reuse.
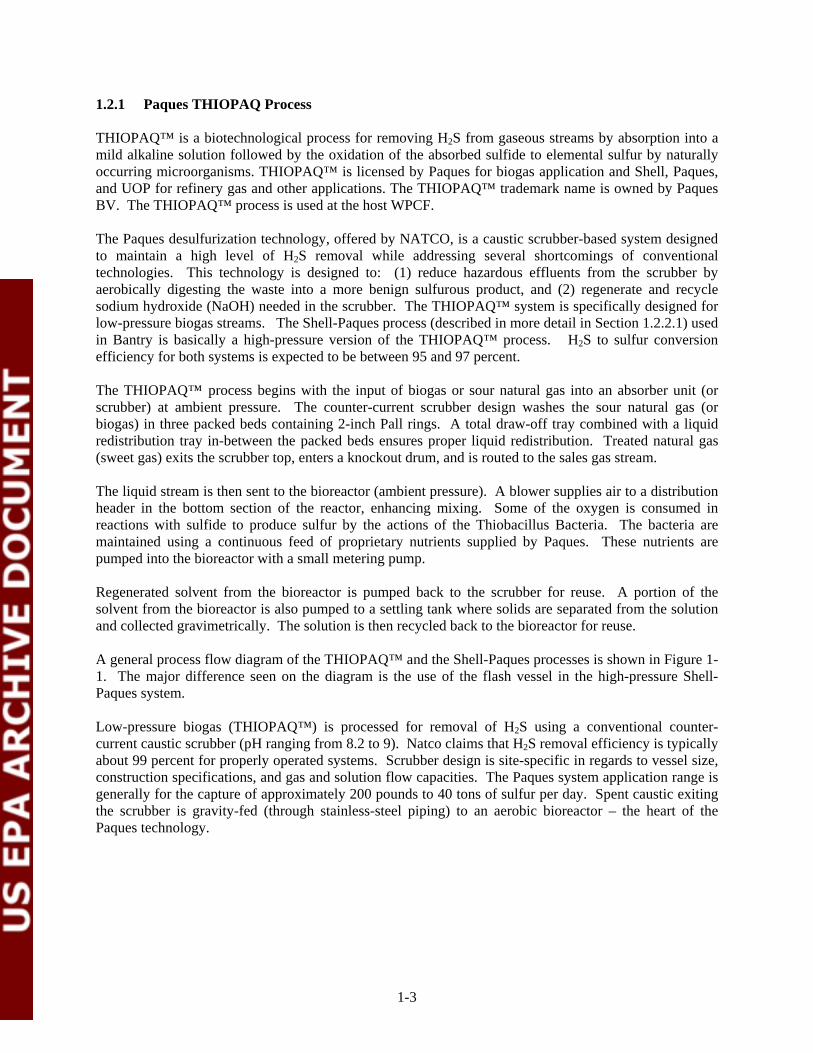
A general process flow diagram of the THIOPAQ™ and the Shell-Paques processes is shown in Figure 11. The major difference seen on the diagram is the use of the flash vessel in the high-pressure Shell-Paques system.
Low-pressure biogas (THIOPAQ™) is processed for removal of H2S using a conventional countercurrent caustic scrubber (pH ranging from 8.2 to 9). Natco claims that H2S removal efficiency is typically about 99 percent for properly operated systems. Scrubber design is site-specific in regards to vessel size, construction specifications, and gas and solution flow capacities. The Paques system application range is generally for the capture of approximately 200 pounds to 40 tons of sulfur per day. Spent caustic exiting the scrubber is gravity-fed (through stainless-steel piping) to an aerobic bioreactor – the heart of the Paques technology.
1-3
Vacuum Filter Press
NaOH
Effluent Bleed:
Water and sodium salts
Sulfur Product
Sour Gas
Scrubber
Circulation Pump
Air
Aerobic Bioreactor
Flash Vessel (Shell-Paques only)
(Shell-Paques only)
Nutrients
pH = 8.2– 9 P = 1 bar
Settling Tank
Processed Flash Gas Gas Out to flare Air
Figure 1-1. Simplified THIOPAQ™ and Shell-Paques System Schematic
1.2.2 Shell-Paques Process
The Shell-Paques process is the name of the technology licensed by Shell and Paques for applications in (1) natural gas, (2) synthesis gas, and (3) Claus tail-gas treatment. Shell-Paques is a variation of the THIOPAQ™ system that is designed for use with high-pressure sour gas streams typically associated with oil/gas and petrochemical industries (it can accommodate inlet gas pressures ranging from 2 to 1,300 psig). The two systems are virtually identical (other than vessel and pipe pressure ratings) except for a flash vessel that is required for the Shell-Paques system. The flash vessel is needed for the high-pressure system to remove dissolved hydrocarbon gases that become entrained in the spent scrubber solution. Figure 1-1 provides a schematic of the Paques technology.
At Bantry, the Shell –Paques process begins with the flow of sour natural gas through a feed gas knockout vessel, a heater, and then the scrubber. The heater was required on the Bantry unit to account for the low feed gas temperature expected. It had the added benefit of allowing for easy control of the feed gas temperature relative to the solvent temperature to prevent hydrocarbon condensation.
The counter-current scrubber design washes the sour gas in multiple beds filled with random packing. A liquid redistribution tray is used in-between the packed beds to ensure proper liquid distribution throughout the scrubber. Treated natural gas (sweet gas) exits the top of the scrubber, enters a knockout drum, and is routed to the sales gas stream.
The loaded THIOPAQ™ solvent leaves the scrubber and goes to the flash vessel. The operating pressure is 3.45 barg (50 psig). The flash gas (MW~19.75), which contains some H2S, is washed in the small
1-4

column on top of the flash vessel. The vent gas flow rate from the flash vessel is 2.8 kg/hr (76 std. m3/d). The flash gas is routed to flare at the Bantry unit.
Flashed, loaded THIOPAQ solvent is then sent to the bioreactor where the pressure is reduced to ambient. A blower supplies air to a distribution header in the bottom section of the bioreactor, enhancing mixing. Some of the oxygen is consumed in reactions with sulfide to produce sulfur by the actions of the Thiobacillus Bacteria. The bacteria are maintained using a continuous feed of proprietary nutrients supplied by Paques. These nutrients are pumped into the bioreactor with a small metering pump.
Regenerated solvent from the bioreactor is pumped back to the scrubbers (main and flash vessel) for reuse. A portion of the solvent from the bioreactor is also pumped to a settling tank where solids are separated from the solution and collected gravimetrically. The solution is then recycled back to the bioreactor for reuse.
The bacteria catalyze the sulfur and sulfate regeneration reactions in the bioreactor to give either elemental sulfur or sulfate. The reaction producing elemental sulfur is desired because:
• It produces a hydroxyl molecule, which can capture a molecule of H2S in the scrubber and • It produces elemental sulfur, which can be separated fairly easily from the solvent.
A continuous bleed stream is taken from a calm section of the bioreactor to minimize the sulfur content. The bleed stream goes to a bleed aeration tank to ensure that all sulfur and sulfide is completely oxidized to sulfate (because BOD demand is zero). An ultraviolet “stabilizer” has been installed after the aeration tank because local legislation required sterilization of the bleed stream. This effluent is collected in a bleed water tank where it is collected and subsequently transported by truck to a nearby water treatment facility.
The vent air leaving the bioreactor can contain trace amounts of H2S (typically less than 1 ppmv). Therefore, it is initially routed to a bio-polisher which is a tank with a layer of compost. The vent air is discharged directly into the atmosphere from the bio-polisher.
The regenerated solvent leaving the bioreactor typically contains 10 kg S/m3 (1% by weight). Sulfur content increases to approximately 10% wt. sulfur content in the solids separator. The clarified water from the separator is returned to the bioreactor. The sulfur slurry from the separator is concentrated into a sulfur paste (~ 65% wt. sulfur content) in a decanter-centrifuge. Until a buyer of the potentially salable paste is found, the sulfur paste is sent to landfill near Bantry.
1.2.3 Process Chemistry
The reactions that drive these processes occur primarily in the scrubber and the bioreactor. The first main reaction in the scrubber (at feed gas pressure) is H2S absorption. The H2S is absorbed by the dilute caustic scrubber solution (sodium hydroxide (NaOH)) in the scrubber according to the following chemical reaction:
H2S + NaOH → NaHS + H2O (a)
Reaction (a) shows that solution alkalinity is consumed during this process. The solution leaving the scrubber (NaHS + H2O) is directed to the bioreactor.
Hydroxide ions are also consumed in the scrubber during a CO2 absorption step:
1-5

CO2 + OH– → HCO3– (b)
and a carbonate formation step:
– HCO3 + OH– → CO32– + H2O (c)
Note: The actual amount of CO2 removed from the sour gas is very small. The carbonate / bicarbonate buffer moderates the solution pH to the appropriate range, providing hydroxide ions for H2S removal and allowing for the selective removal of H2S and the slip of CO2.
The liquid stream loses the OH– ion in the scrubber and gains the OH– ion back in the bioreactor. The bioreactor operates near atmospheric pressure and is aerated (constant mix) with a controlled inflow of ambient air. The bacteria react with the spent scrubber solution and convert the dissolved sulfide to solid elemental sulfur as follows:
NaHS + 1/2O2 → So + NaOH (d)
This step relies on the biological oxidation of the dissolved sulfide into elemental sulfur using aerobic bacteria (Thiobacillus). A small portion of the dissolved sulfide (less than 5 percent) is completely oxidized to sulfate as follows:
2NaHS +4O2 → NaHSO4 ↔ Na2SO4 + H2SO4 (e)
Solution alkalinity is partially regenerated in equation (d). The caustic absorbs the H2S gas and is regenerated during the production of elemental sulfur. Caustic solution regeneration eliminates the need for a large supply of NaOH to maintain pH above 8.2. Solution regeneration is not 100 percent as shown in equation (e), so additional NaOH is required. A controlled amount of dilute NaOH is added to the system continuously using a small metering pump. An automated level sensor detects when bioreactor solution level is high, and a controlled amount of system effluent is bled to the wastewater treatment plant influent stream, restoring proper solution level. This bleed stream also prevents the accumulation of sulfate ions. Air leaving the bioreactor is vented to atmosphere.
The sulfur produced has a hydrophilic nature, which significantly reduces the chance of equipment fouling or blocking. This characteristic also makes the product suitable for agricultural use as fertilizer. Alternatively, the sulfur can be melted to yield a high-purity product which meets international Claus sulfur specifications.
1.3 PLANT DESCRIPTIONS AND SYSTEM INTEGRATION
1.3.1 Host WPCF - (Paques THIOPAQ™)
The WPCF hosting the Thiopaq verification is a 40-million gallons per day (MGD) wastewater treatment facility. The facility is specifically designed to process industrial wastewater streams from numerous local industries including grain- and food-processing plants and a paper mill (corrugated cardboard recycler).
1-6
AerobicBioreactor
Scrubber
Aerobic Bioreactor
Scrubber
A portion of the plant's influent is characterized as low-flow, high biological oxygen demand (BOD)-type waste. This waste stream is approximately 2.5 to 3 MGD and encounters anaerobic pretreatment in Biothane upflow anaerobic sludge blankets (UASBs). The facility uses three UASBs to pre-treat this wastewater stream, each of which generates around 100 to 200 cubic feet per minute (cfm) of biogas (or around 144 to 288 thousand cubic feet per day (cfd)). Biogas composition can vary but is generally 60 percent CH4, 38 percent CO2, and 1 to 1.5 percent H2S. The gas generated in each UASB is collected, combined, compressed, and used to fuel a sludge incinerator within the plant. The sludge incinerator will consume all of the biogas generated on-site under normal plant operations. The biogas is flared during rare occurrences when the incinerator is not operating or is being fueled with natural gas.
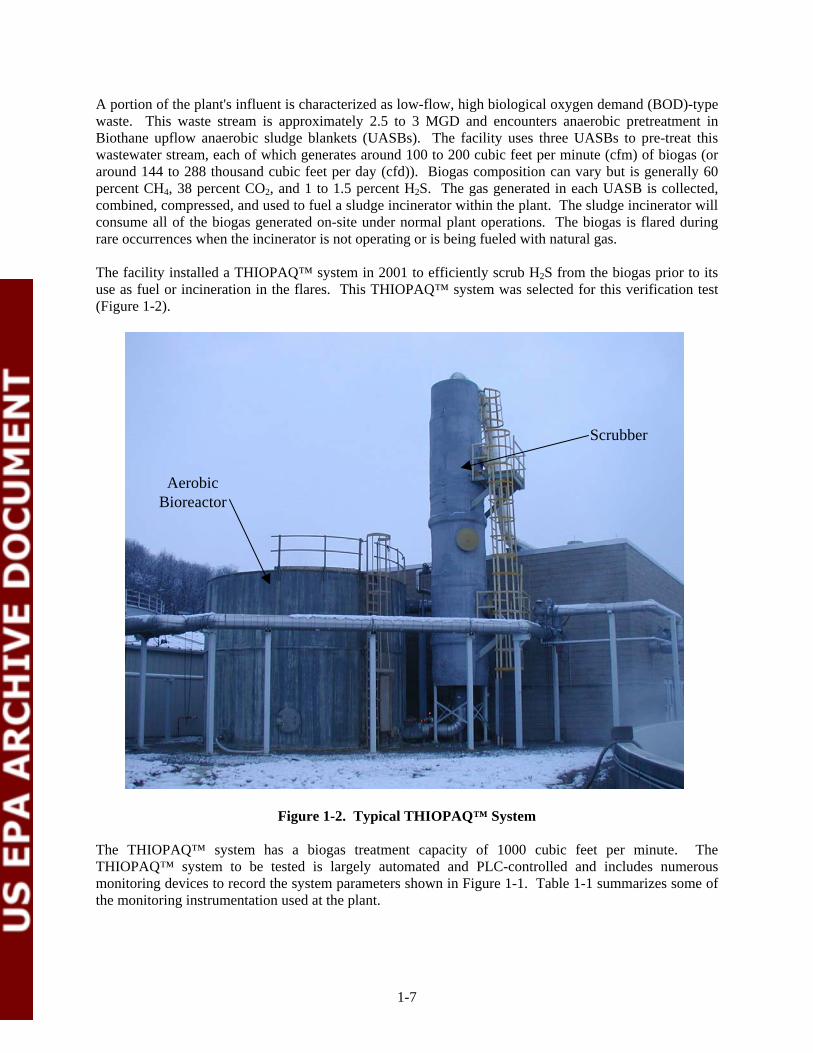
The facility installed a THIOPAQ™ system in 2001 to efficiently scrub H2S from the biogas prior to its use as fuel or incineration in the flares. This THIOPAQ™ system was selected for this verification test (Figure 1-2).
Figure 1-2. Typical THIOPAQ™ System
The THIOPAQ™ system has a biogas treatment capacity of 1000 cubic feet per minute. The THIOPAQ™ system to be tested is largely automated and PLC-controlled and includes numerous monitoring devices to record the system parameters shown in Figure 1-1. Table 1-1 summarizes some of the monitoring instrumentation used at the plant.
1-7

Table 1-1. Host Site THIOPAQ™ Monitoring Instrumentation
Parameter Typical Range Instrumentation Location Biogas flow (generation) rate
100 - 200 acfm per each UASB
Fluid Components International, Model ST98 thermal mass flow meters (3 total)
One on the outlet of each UASB
Scrubber solution flow rate
800 to 1,000 gpm Promag 50/53W electromagnetic flow monitor
Scrubber pump discharge
NaOH consumption rate
Approximately 1,500 lb/day
Milltronics level sensor NaOH holding tank
The system at this facility decants a liquid effluent batch only about once per week. Solids collected in the settling tank are removed by a vacuum filter press (made by Straight-Line Filter Press) approximately once per day. The facility has not yet found a buyer or user of the sulfur, so the solids are collected in a large bin and disposed of in a landfill. The bioreactor vent is a two-foot diameter rain-capped vent emitting directly to atmosphere.
1.3.2 Encana Bantry - (Shell-Paques)
The Bantry Shell-Paques unit is located near the town of Brooks, east of Calgary, in Canada, and is owned and operated by EnCana Resources, a major Canadian and global gas producer. The natural gas is extracted from well sites that are on, or adjacent to, the properties of over forty Canadian landowners around the Bantry North facility.
New Paradigm Gas Processing Ltd. (New Paradigm), a subsidiary of the Canadian technology company (CCR) Technologies Ltd. and the authorized licensor of the Shell-Paques process in Canada, constructed the unit under license.
The Bantry Shell-Paques unit is designed to remove H2S from the sour gas extracted from nine natural gas fields. Basic design specifications for this system including gas flow rates, pressures, and composition are summarized in Table 1-2. The sulfur recovered from the system is currently sent to a landfill.
1-8

Table 1-2. Bantry Shell-Paques System Design Cases
Parameter Units Low Pressure, Winter case
High Pressure, Summer case
Gas Flow 103 Nm3/day 321.5 321.5 mmscfd 12.0 12.0
Pressure Barg 5.9 13.8 Psig 85 200
Temperature °C 4 10 °F 39 50
Gas Composition H2 % vol. 0.005 0.005 He % vol. 0.061 0.061 N2 % vol. 4.112 4.112
CO2 % vol. 2.506 2.506 H2S % vol. 0.202 0.202 C1 % vol. 84.429 84.429 C2 % vol. 4.348 4.348 C3 % vol. 2.041 2.041
i-C4 % vol. 0.496 0.496 n-C4 % vol. 0.862 0.862 i-C5 % vol. 0.330 0.330 n-C5 % vol. 0.281 0.281 C6 % vol. 0.211 0.211
C7-plus % vol. 0.117 0.117
1.4 PERFORMANCE VERIFICATION PARAMETERS
Regulatory and industry stakeholders in the oil and gas, waste-handling, and power production industries have a need and use for independently verified field data on the technical, emissions, and operational performance of gas-processing technologies. The verification approach in this TQAP is intended to provide credible performance data to potential industry users and environmental regulators.
The Paques THIOPAQ™ and Shell-Paques versions of this technology differ only by the need for a flash vessel on the Shell-Paques unit. Since the flash vessel does not change the environmental or operational performance of the system, a detailed verification of each type of Paques system would be redundant and unnecessarily costly. Therefore, a detailed verification will be conducted only on the THIOPAQ™ system at the host WPCF. A significantly abbreviated evaluation will be conducted on the Shell-Paques system in Alberta simply to show comparability with results from the THIOPAQ™ verification. The test will also independently verify that the flash vessel does not introduce an additional system emission point. The THIOPAQ™ testing will include verification of the performance parameters described below. Section 2.0 presents detailed descriptions of measurement and analysis methods and Section 3.0 discusses data quality assessment procedures for each verification parameter.
1-9
1.4.1 Environmental Performance Parameters
Air Emissions. Process information provided by NATCO and THIOPAQ™ indicate that there are no air emissions from the system other than the aerobic bioreactor vent. Fugitive emissions are not expected for the THIOPAQ™ because the system operates near ambient pressure. The bioreactor vent continuously releases vent gases to the atmosphere since this is an aerobic process. The GHG Center will conduct measurements on this vent to independently verify emission rates of H2S or other sulfur compounds, if any, that are liberated from the vent. The GHG Center personnel will collect at least three vent air samples on each of three consecutive days for analysis. Concentrations of H2S or other sulfur compounds will be determined at a laboratory and reported in units of parts per billion by volume (ppbv). Vent gas flow rate will be measured in conjunction with sample collection using a pitot tube and differential pressure gage. Emission rates of H2S from the vent will be calculated in units of pounds per hour (lb/hr) using the reported concentrations and measured vent air flow rates. Vent gas temperature and pressure will be measured to support the conversion of emission rates to standard conditions.
Liquid Effluent. The THIOPAQ™ and Shell-Paques systems include only one liquid effluent point – the effluent bleed stream used to regulate solution conductivity. The THIOPAQ™ reduces the volume of hazardous liquid effluent associated with conventional wet scrubbers but small amounts of effluent must be bled from the system intermittently to maintain proper system pH and conductivity. This effluent, consisting of water and small amounts of sulfate and sulfides, is directed back to the wastewater treatment facility. Under normal plant operations, only one batch of effluent is expected to be bled from the THIOPAQ™ system every week or so. This verification will include only one event during the test period. The Center will quantify the effluent volume and sulfur content in the bleed stream from this event by conducting the following measurements:
(1) Collect a sample to determine the concentrations of sulfates and sulfides (lb/gal). (2) Measure the volume of effluent dispensed during the bleed event (gallons).
The Center will then request the site operator to repeat these measurements during the next two effluent bleed events to establish three replicates of each measurement.
1.4.2 Operational Performance Parameters
H2S Removal Efficiency. The Center will conduct three tests per day to determine the system's H2S removal efficiency. This will be done in conjunction with the environmental testing outlined above. Time-integrated biogas samples will be collected simultaneously at the inlet and outlet of the scrubber during each test. Collected samples will be express-shipped to a laboratory for determination of H2S and 17 other sulfur-based compounds. Results of each species in each sample will be standardized and reported in units of parts per million by volume (ppmv). Removal efficiency will be calculated and reported.
Gas Composition and Quality. Gas processing by the THIOPAQ™ system is not expected to significantly impact gas quality other than removal of H2S. The Center will examine gas quality before and after treatment in the THIOPAQ™ to verify this. A second set of integrated biogas samples will be collected simultaneously at the inlet and outlet of the scrubber and submitted to the laboratory to determine gas composition (C1 through C6+) and lower heating value (LHV). Results of the analysis will be examined to determine if the LHV of the gas is significantly changed by THIOPAQ™ processing.
NaOH Consumption Rate. The THIOPAQ™ system reduces NaOH consumption by the process because of NaOH regeneration in the bioreactor. The host facility uses metering pumps to add NaOH to the
1-10

process. The Center will measure and report the NaOH consumption rate at this facility so that potential THIOPAQTM system users can estimate NaOH savings at their own facilities.
Sulfur Production and Purity. The solids cake generated by the THIOPAQTM system represents a potentially salable product. THIOPAQ™ estimates a potential elemental sulfur purity of 95 percent in the sludge cake from the vacuum filter press. The Center will estimate the average solids and elemental sulfur production rate in units of lb/day using the following procedures.
(1) Each batch of solids collected during the verification period will be weighed and an average daily solids production rate will be calculated.
(2) A sample of each batch will be collected and shipped to a laboratory to determine the moisture content and estimate the purity of the sulfur. An extraction procedure used for sulfur determination, described in Appendix A-7, will be used to remove “foreign matter” (insoluble residue). The sulfur will be defined as the difference between 100 and the percentage of foreign matter to the nearest 0.1 percent. Moisture will be determined simply by desiccation and subsequent calculations for moisture percent.
(3) The percentage of sulfur and the solids production rates will be used to calculate an average daily solids and elemental sulfur production rate.
Process Operations. Operational parameters will be monitored during the testing to document system operations and to aid in post-testing data analysis. These will include biogas flow rate through the system, scrubber water flow rate, and NaOH, nutrient, and air flow rate to the bioreactor. These data, all collected by site metering equipment (Table 1-1), are not used as primary verification parameters but will be included in the report to document system operations during testing. They will also allow the Center to evaluate operational stability or variation during the verification test periods.
1.4.3 Shell-Paques Performance
Completion of the field testing and data analysis on the host THIOPAQ™ system will be followed by the GHG Center conducting the abbreviated verification test on the Shell-Paques system in Alberta. The following samples will be collected in Bantry:
• Two bioreactor vent gas samples to determine H2S concentrations. • Two effluent samples from the bioreactor bleed stream to determine total sulfates and dissolved
sulfides. • One sample from the sludge cake to estimate sulfur purity.
One day’s NaOH consumption and solids production will also be documented. Note that this level may be increased or decreased depending on the variability of the THIOPAQ™ testing results.
1-11

EPAETV GHG Pilot Manager
EPA APPCDDavid Kirchgessner
EPAQuality Assurance Manager
EPA APPCDRobert Wright
Southern Research InstituteQuality Assurance Manager
Ashley Williamson
Southern Research InstituteETV GHG Center Director
Stephen Piccot
Southern Research InstituteETV GHG Center Project Manager
William Chatterton
Southern Research InstituteETV GHG Center Field Team Leader
Robert Richards
GHG Center Stakeholders
NATCO Group, Inc.Process Engineer
Al Lanning
Host FacilityProcess Engineer
1.5. ORGANIZATION
Figure 1-3 presents the project organization chart. The following section discusses functions, responsibilities, and lines of communications for the verification test participants.
Gas Analyses Empact Analytical
Systems, Inc.
Air Analyses Air Toxics, Ltd.
Liquid Analyses CT Laboratories
Solids Analyses Commercial Testing &
Engineering Co.
EPA ETV GHG Pilot Manager
EPA - APPCD David Kirchgessner
EPA Quality Assurance Manager
EPA - APPCD Robert Wright
Southern Research Institute Quality Assurance Manager
Ashley Williamson
Southern Research Institute ETV GHG Center Director
Stephen Piccot
Southern Research Institute ETV GHG Center Project Manager
William Chatterton
Southern Research Institute ETV GHG Center Field Team Leader
Robert Richards
GHG Center Stakeholders
NATCO Group, Inc. Process Engineer
Al Lanning
Host Facility Process Engineer
Gas AnalysesEmpact Analytical
Systems, Inc.
Air AnalysesAir Toxics, Ltd.
Liquid AnalysesCT Laboratories
Solids AnalysesCommercial Testing &
Engineering Co.
Figure 1-3. Project Organization
Southern's GHG Center has overall responsibility for planning and ensuring the successful implementation of this verification test. The GHG Center will ensure that effective coordination occurs, schedules are developed and adhered to, effective planning occurs, and high-quality independent testing and reporting occurs.
Mr. Stephen Piccot is the GHG Center Director. He will ensure that the staff and resources are available to complete this verification as defined in this TQAP. He will ensure effective review of the TQAP and reports occur to ensure they are of high quality and consistent with ETV operating principles. He will oversee the activities of the GHG Center staff and provide management support where needed. Mr. Piccot will sign the VS along with the EPA-NRML Laboratory Director.
Mr. William Chatterton will serve as the project manager. He will be responsible for developing the TQAP and overseeing field data collection activities of the GHG Center’s field team leader, including assessment of the team leader’s accomplishment of DQOs. Mr. Chatterton will ensure the procedures outlined in Sections 2.0 and 3.0 are adhered to during testing unless modification is required.
1-12
Modifications will be completed, explained, and justified in the VR. He is also ultimately responsible for conformation that quality control procedures specified in this TQAP are conducted and criteria met by field testing personnel as well as subcontractors and laboratories. Mr. Chatterton will have authority to suspend testing should a situation arise during testing that could affect the health or safety of any personnel. He will also have the authority to suspend testing if quality problems occur or host site or vendor problems arise. He will also be responsible for maintaining effective communications with NATCO, host facility personnel, Southern QA team members, and ETV document reviewers.
Mr. Robert Richards will serve as the field team leader. Mr. Richards will be responsible for the effective planning, mobilization, and execution of all field-testing activities. He will install and operate measurement instruments, supervise and document activities conducted by the emissions testing contractors, collect gas samples and coordinate sample analysis with the laboratory, and ensure that all QA/QC procedures outlined in Section 2.0 are adhered to. He will also support Mr. Chatterton’s data quality determination and report preparation activities and will submit all results to Mr. Piccot documenting the final reconciliation of DQOs. He will be responsible for ensuring that performance data collected by continuously monitored instruments and manual sampling techniques are based on procedures described in Section 4.0.
Southern’s QA Manager, Dr. Ashley Williamson, has reviewed, approved, and signed this TQAP. He will also review the results from the verification test and conduct an Audit of Data Quality (ADQ), described in Section 4.4. The ADQ will include his independent review of QC documentation and confirmation of DQO attainment. He will also conduct an internal Technical Systems Audit (TSA) of this test. Dr. Williamson will prepare a written report of his findings from internal audits and document reviews. These findings will be used to prepare the VR.
Mr. Al Lanning, Senior Process Engineer, will serve as the primary contact person for NATCO. Mr. Lanning will provide technical assistance and help coordinate this test with the host site as necessary. A process engineer at the host WPCF will be the main contact for the host site and will oversee system operations during the verification testing.
EPA-ORD will provide oversight and QA support for this verification. The APPCD Project Officer, Dr. David Kirchgessner, is responsible for obtaining final approval of the TQAP, VR, and VS. The APPCD QA Manager, Robert Wright, will ensure review of the TQAP and reports occur and that approval is granted once any issues have been resolved satisfactorily.
1.6. SCHEDULE
The THIOPAQ and Shell-Paques systems selected for this verification are installed and operational. The tentative schedule of activities for this verification are listed below.
1-13

Verification Milestone Scheduled Completion
Verification Test Plan Development GHG Center Internal Draft Completed March 12, 2004
NATCO Review/Revision March 31, 2004 Peer Review/Revision May 7, 2004 EPA Review/Revision May 28, 2004 Final Test Plan Posted June 11, 2004
Verification Testing and Analysis Field Testing June 28 – July 2 2004 Data Validation and Analysis June 28 – July 16, 2004
Verification Report Development GHG Center Internal Draft Development June 28 – July 30, 2004 Vendor and Host Site Review/Revision August 13, 2004 EPA and Industry Peer-Review/Revision August 27, 2004
Final Report Posted August 31, 2004
1-14

2.0 VERIFICATION APPROACH
2.1. OVERVIEW
The Paques technology is designed to provide efficient sour gas purification for removal of H2S. The technology is unique in that the bioreactor regenerates the gas scrubbing liquid, eliminating the large quantities of waste effluent generated by conventional gas scrubbing systems. This benefit is accompanied by a significant reduction in treatment chemical consumption. Section 1.4 introduced the verification parameters and basic approach. This section provides the detailed sampling and analytical procedures that will be used to verify performance parameters. The GHG Center will conduct performance testing at normal site conditions to address the following verification parameters:
Environmental Performance (Section 2.2) Air emissions of H2S and other sulfur species, lb/hr Liquid effluent sulfate and sulfide emissions, mg/day
Operational Performance (Section 2.3) H2S removal efficiency, % Gas quality (composition and LHV) NaOH consumption, lb/dayNutrient consumption, gal/daySulfur production, lb/day
Table 2-1 summarizes the testing matrix. The matrix includes the detailed verification testing to be conducted on the THIOPAQ system and the comparability checks that will be conducted on the Shell-Paques system at Bantry. Sections 2.2 and 2.3 detail the sampling and analytical procedures that will be used to verify each performance parameter on the THIOPAQ™ system. Quality assurance and control procedures for each of the determinations are detailed in Section 3.0.
The GHG Center will conduct a one-day test survey for the Shell-Paques system intended to (1) compare this system to the THIOPAQ™ system and (2) confirm that the flash vessel is not an additional emission point. Two samples of vent air from the bioreactor and two samples of liquid effluent from the centrifuge bleed stream will be collected and analyzed. One elemental sulfur sample will be collected from the sludge cake and evaluated. The site monitors raw (sour gas) and processed gas composition and quality (including H2S content and gas composition). This data will be reviewed and reported in the VR but independent verification of these parameters will not be repeated by the Center. Process variables such as gas flow rates and scrubber water flow rate, also monitored by the site, will be reviewed to confirm that typical and steady system operations occur during the short 1-day test period.
2-1
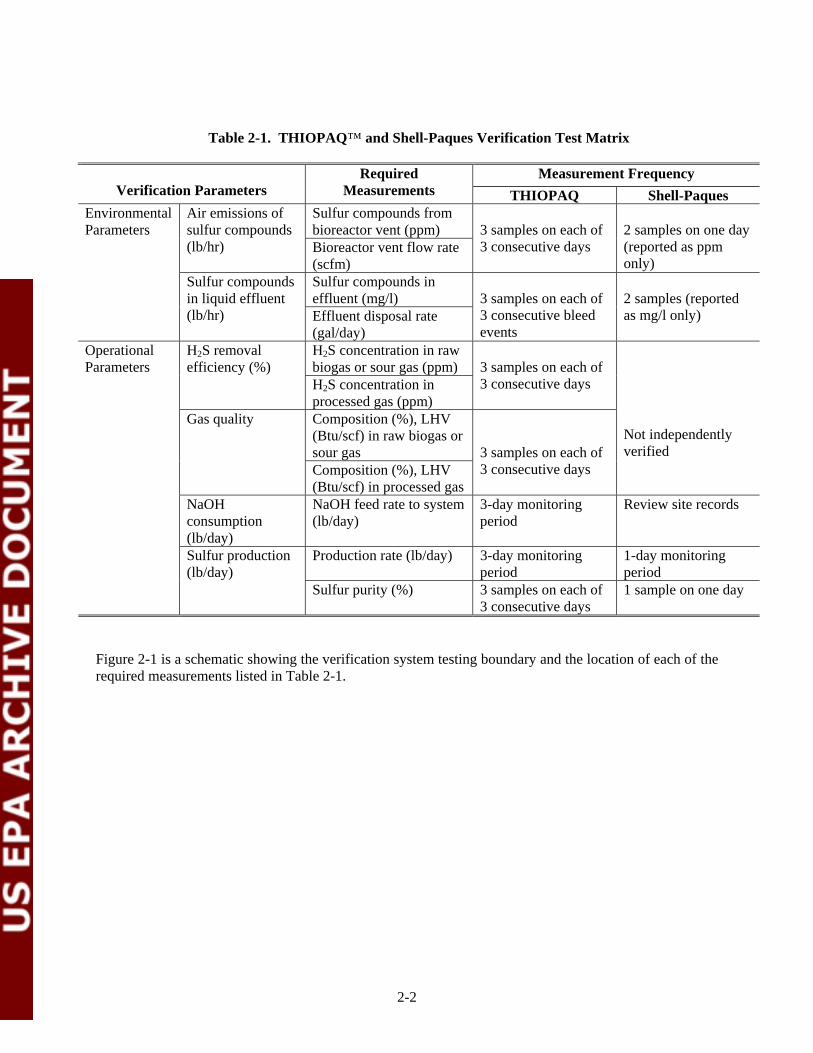
Table 2-1. THIOPAQ™ and Shell-Paques Verification Test Matrix
Verification Parameters Required
Measurements Measurement Frequency
THIOPAQ Shell-Paques Environmental Parameters
Air emissions of sulfur compounds
Sulfur compounds from bioreactor vent (ppm) 3 samples on each of
3 consecutive days 2 samples on one day (reported as ppm only)
(lb/hr) Bioreactor vent flow rate (scfm)
Sulfur compounds in liquid effluent
Sulfur compounds in effluent (mg/l) 3 samples on each of
3 consecutive bleed events
2 samples (reported as mg/l only) (lb/hr) Effluent disposal rate
(gal/day) Operational Parameters
H2S removal efficiency (%)
H2S concentration in raw biogas or sour gas (ppm) 3 samples on each of
3 consecutive days
Not independently verified
H2S concentration in processed gas (ppm)
Gas quality Composition (%), LHV (Btu/scf) in raw biogas or sour gas 3 samples on each of
3 consecutive days Composition (%), LHV (Btu/scf) in processed gas
NaOH consumption (lb/day)
NaOH feed rate to system (lb/day)
3-day monitoring period
Review site records
Sulfur production Production rate (lb/day) 3-day monitoring 1-day monitoring (lb/day) period period
Sulfur purity (%) 3 samples on each of 1 sample on one day 3 consecutive days
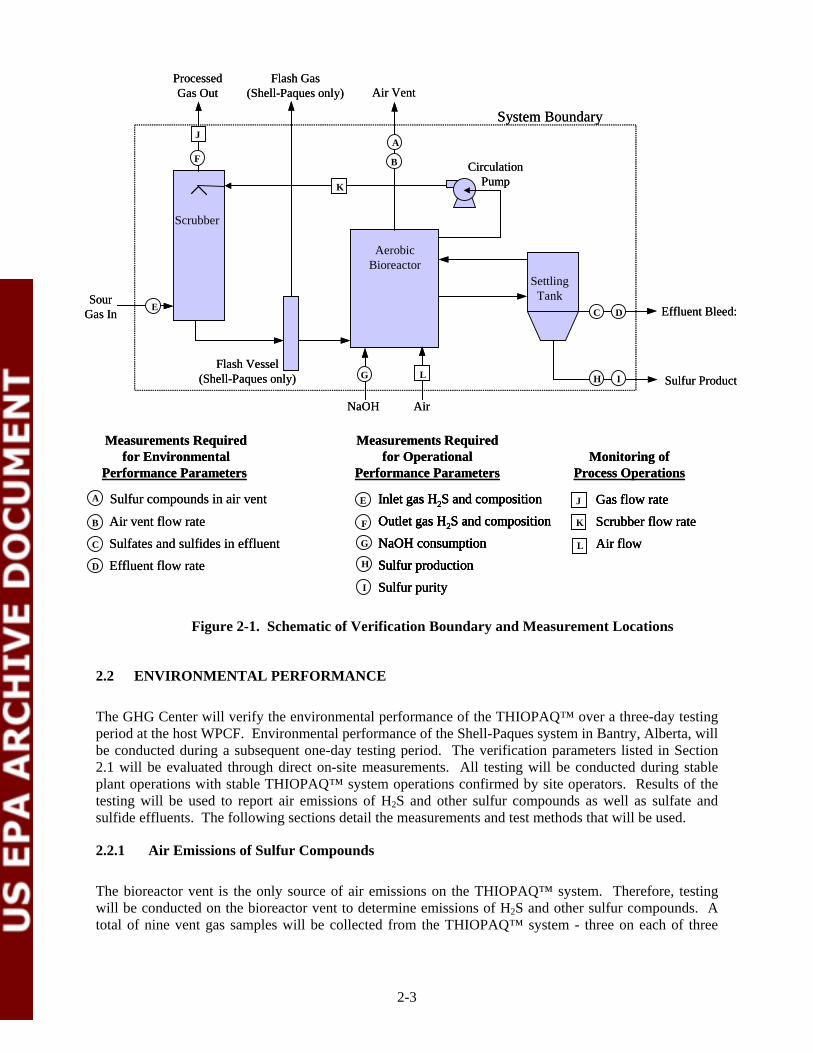
Figure 2-1 is a schematic showing the verification system testing boundary and the location of each of the required measurements listed in Table 2-1.
2-2
D
Scrubber
AerobicBioreactor
SettlingTank
C D
H ILG
A
BF
K
E
J
A
C
D
B K
J
L
I
F
E
G
H
DDC D
BF
K
E
J
A
C
D
B K
J
L
Processed Flash GasProcessed Flash GasGas Out (Shell-Paques only)Gas Out (Shell-Paques only) Air VentAir Vent
System Boundary
NaOH
Effluent Bleed:
Sulfur Product
Sour Gas In
Circulation Pump
Air
Flash Vessel (Shell-Paques only)
System Boundary
NaOH
Effluent Bleed:
Sulfur Product
SourGas In
CirculationPump
Air
Flash Vessel(Shell-Paques only)
Scrubber
Aerobic Bioreactor
Settling Tank
C D
H ILG
A
BF
K
E
J
MeasuremMeasurements Rents Reequiredquiredffoor Er Ennvivironmronmenentaltal
PerfPerformormaancence ParamParameetersters
MeMeasasurureemmenenttss RReeqquuiirereddffoor Operatir Operationonalal
PerfPerformormaance Parnce ParaammeeterstersMoniMonitoritoring ofng of
ProcessProcess OperatiOperationsons
A SuSullffur comur comppooundunds is inn airair vveentnt E InInInInlllleeeetttt ggggaaaassss HHHH2222SSSS aaaannnndddd ccccoooommmmpppposososositioitioitioitionnnn J GGGaaas flow rates flow rates flow rate
B AAiir vr veent flont floww raterate F OOOOuuuutletletletlet gat gat gat gassss HHHH2222SSSS andandandand comcomcomcomposiposiposiposittttiiiioooonnnn ScrScrScrubbubbubber fer fer flllooowww ratratrateeeK
C SulSulffatates and sules and sulffiiddeses in efin effluentfluent G NaNaNaNaOHOHOHOH ccccoooonnnnssssuuuummmmptptptptiiiioooonnnn L AiAiAirrr ffflllooowwwD EfEfflfluentuent flflowow rraattee H SuSuSuSulfur prolfur prolfur prolfur prodddduuuuctionctionctionction
I SuSuSulfur pulfur pulfur puritritrityyy
Figure 2-1. Schematic of Verification Boundary and Measurement Locations
2.2 ENVIRONMENTAL PERFORMANCE
The GHG Center will verify the environmental performance of the THIOPAQ™ over a three-day testing period at the host WPCF. Environmental performance of the Shell-Paques system in Bantry, Alberta, will be conducted during a subsequent one-day testing period. The verification parameters listed in Section 2.1 will be evaluated through direct on-site measurements. All testing will be conducted during stable plant operations with stable THIOPAQ™ system operations confirmed by site operators. Results of the testing will be used to report air emissions of H2S and other sulfur compounds as well as sulfate and sulfide effluents. The following sections detail the measurements and test methods that will be used.
2.2.1 Air Emissions of Sulfur Compounds
The bioreactor vent is the only source of air emissions on the THIOPAQ™ system. Therefore, testing will be conducted on the bioreactor vent to determine emissions of H2S and other sulfur compounds. A total of nine vent gas samples will be collected from the THIOPAQ™ system - three on each of three
2-3

consecutive days. Two samples will be collected from the Shell-Paques vent in Bantry. The samples will be collected several hours apart to allow ample process time between samples.
Time-integrated vent gas samples will be collected in tedlar bags over a period of approximately one hour per sample. A lung-type sampling system will be used to collect the bag samples. A teflon probe is inserted into the vent and attached to a tedlar bag mounted inside a leak-free vessel. A vacuum pump is used to slowly evacuate the vessel, thereby filling the tedlar bag with vent gas. Evacuation rate will be controlled with a needle valve so that the bag will fill over a period of approximately one hour. Appendix A-2 provides a log form for bag sample collection.
Collected samples will be express-shipped daily to a laboratory that specializes in air analyses (Air Toxics, Ltd.), for analysis of sulfur compounds. Appendix A-5 provides an example of the chain-ofcustody form that will accompany all samples and document the date and time of collection, release, receipt, and analysis of samples. A coordinated effort between field sampling personnel and the laboratory analyst will be made to complete sample analyses within 24 to 30 hours of collection to minimize bias caused by the instability of H2S. The samples will also be protected from prolonged exposure to light. These procedures are expected to minimize H2S losses and bias. Analyses will be conducted in accordance with ASTM Method 5504 (1) to quantify concentrations of the following sulfur species:
• hydrogen sulfide 2,5-dimethylthiophene • carbon disulfide 2-ethylthiophene • carbonyl sulfide 3-methylthiophene • diethyl disulfide ethyl methyl sulfide • diethyl sulfide ethyl mercaptan • isobutyl mercaptan isopropyl mercaptan • methyl mercaptan n-butyl mercaptan • n-propyl mercaptan tert-butyl mercaptan • tetrahydrothiophene thiophene
A known volume of sample is injected into a gas chromatograph (GC) equipped with a molecular sieve column. The sulfur components elute from the GC and they are directed to a sulfur chemiluminescence detector (SCD) for quantitation. Resultant peaks in the chart trace are determined for each compound. These areas are compared to the areas of the same compounds contained in a calibration reference standard that is analyzed under identical conditions. A total of 20 sulfur compounds are included in the analysis with individual compound reporting limits of approximately 4 parts per billion by volume (ppbv). QA/QC procedures for this analysis include instrument calibrations, laboratory control samples, internal standards, laboratory blanks, and duplicate analyses. Details regarding the QA/QC procedures are presented in Section 3.2.1.
Vent gas flow-rate determinations are required to convert any detectable sulfur compound concentrations to mass emissions in terms of pounds per hour (lb/hr). A temporary duct will be fitted over the two-foot diameter THIOPAQ™ system vent to allow air flow-rate measurements. Air flow rates are expected to be very low, so the duct will neck down to no more than one foot in diameter. The duct will be of sufficient length to provide laminar flow (at least 6 feet in length) and will be fitted with flow-straightening vanes.
Test personnel will conduct vent gas velocity and temperature measurements on the THIOPAQ™ system vent during each bag sampling event with a standard-type pitot tube and manometer following the general
2-4

procedures of EPA Reference Method 2 (2). The manometer (Dwyer Model 115-AV) is an incline oil manometer with a sensitivity of approximately 0.005 inches of water (in. w.c.) and a range of 0.25 in. w.c.
Vent gas velocity depends on the average pitot differential pressures, gas molecular weight, temperature, and pressure as follows:
Vv = 85.49( Cp )(Avg[ ∆p ]) Tv (Eqn. 1) PvMv
where: Vv = vent gas velocity, ft/sec Cp = pitot coefficient, dimensionless ∆p = change in velocity head, inches H2O Tv = average gas temperature, oR Pv = absolute pressure in vent duct, in. Hg Mv = molecular weight of vent gas, lb/lb-mole
85.49= constant
Volumetric flow rate for the vent gas will be calculated as follows:
Qstd = Vv A Pv Tv (Eqn. 2)
Pstd Tstd
where: Qstd = volumetric flow rate, dscf/min Vv = vent gas velocity, ft/min A = duct cross-sectional area, ft2
Pv = absolute pressure in duct, in. Hg Pstd = standard pressure, 29.92 in. Hg Tv = average gas absolute temperature, °R Tstd = standard temperature, 532 °R
Analysts will convert measured pollutant concentrations as ppbv to pounds per dry standard cubic foot (lb/dscf), and calculate emission rates for each as follows:
Epoll = CpollQstd 60 (Eqn. 3)
where: Epoll = pollutant emission rate, lb/hr Cpoll = average pollutant concentration, lb/dscf Qstd = standard dry volumetric flow rate, dscf/min, (Eqn. 2) 60 = minutes per hour
Section 3.2.1 contains the procedures and associated DQOs.
2-5
2.2.2 Sulfur in Liquid Effluent
The verification will include determination of the amount of sulfur emitted from the system in the liquid bleed effluent. The THIOPAQ™ effluent at this site is routed back into the sewage treatment plant influent line and subsequently treated, so it is not a true source of emissions. This information can, however, be important to sites where this effluent is a waste stream (unable to be recycled back into the influent). Any sulfur present in the effluent will be in the form of sulfates or dissolved sulfides. This analysis will include measurement of the sulfates and sulfides present in the effluent in units of mg/l and the effluent rate in units of liters per day (l/d).
On the THIOPAQ™ system, a batch of effluent is bled from the system weekly as dictated by the solution conductivity. At Bantry, effluent is bled continuously from a calm section of the bioreactor to minimize sulfur content in the bleed stream. The estimated bleed stream rate from the Bantry design is 4.5 m3/d. On the THIOPAQ™ system, GHG Center personnel will obtain three replicate samples by requesting site operators to collect three effluent samples on each of three consecutive bleed-off events. Two samples will be collected from the Bantry effluent stream. Samples will be collected from the hose leading from the bioreactor to the drain in 250-ml pre-cleaned (EPA Level-1 cleaning and QC procedures) polyethylene bottles. The samples will be shipped to CT Laboratories of Baraboo, Wisconsin, along with proper chain-of-custody forms. The following analyses will be conducted on each sample:
Effluent Sample Analyses
Analyte Reference Methodsa Principle of Detection Total sulfates EPA Method 9056 Ion chromatography Dissolved sulfides EPA Method 9030B and 9034 Distillation and titration a Source: SW-846 - Test Methods for Evaluating Solid Waste, Physical / Chemical Methods (3,4,5)
Total Sulfates
Method 9056 procedures specify that a small aliquot of sample (typically 2 to 3 ml) is injected into an ion chromatograph where inorganic ions are separated and measured using an electrical conductivity cell. Individual anions are identified based on their retention times compared to known standards. Quantitation is accomplished by measuring the peak area for the sulfate anion and comparing it to a calibration curve generated from known standards. The method detection limit (MDL) is approximately 0.1 mg/L.
Dissolved Sulfides
The Method 9030B distillation procedure is designed for the determination of sulfides in aqueous solutions and effluents. An aliquot of sample is distilled under acidic conditions at 100oC under a stream of nitrogen. Hydrogen sulfide gas is released from the sample and collected in gas scrubbing bottles containing zinc and a strong acetate buffer. Zinc sulfide precipitates and is then oxidized to sulfur by adding a known amount of excess iodine. The solution is then titrated with a standard of sodium thiosulfate to quantify the sulfur content. The MDL is approximately 0.2 mg/L.
2-6

Determination of Effluent Bleed Rate
The amount of effluent bled from the THIOPAQ™ system will be measured during each of the three events tested. The average bleed rate will be used in conjunction with the measured sulfate and sulfide concentrations to estimate the daily sulfate and sulfide emission rate in units of mg/day.
Effluent bleed rate will be determined by collecting the liquid from each of the three events in a tared container. The container and collected liquid will then be weighed on-site using a digital scale. The total mass (lbs) of liquid collected during the three events will be divided by the total number of days that passed between the last bleed event prior to the verification period and the third batch tested. This value will represent the average daily amount of liquid bled from this THIOPAQ™ system. The liquid mass values will be converted to volume (gallons) using specific gravity data determined by CT Laboratories on each of the samples (Standard Methods 2710F (6)). The average sulfate and sulfide liquid emission rate will then be calculated and reported in units of lb/day.
The digital scale that will be used for field determinations is a Digi Matex Model DI 28 S-SL. The scale has a range of 100 lbs and a factory calibration of ± 0.02 percent. The scale will be field-calibrated following procedures detailed in Section 3.2.2. Appendices A-4 and A-5 provide log forms for effluent bleed rate determinations and field calibration of the scale.
2.3 OPERATIONAL PERFORMANCE
The GHG Center will also verify the operational performance of the THIOPAQ™ system during the three-day testing period at the host WPCF. Operational performance of the Shell-Paques system in Bantry, Alberta, will be conducted during a one-day test period. The verification parameters listed in Section 2.1 will be evaluated through direct on-site measurements and analysis of collected samples. All testing will be conducted during stable plant operations with proper THIOPAQ™ system operations confirmed by site operators. Results of the testing will be used to report air and liquid emissions of H2S and other sulfur compounds listed in Section 2.2.1. The following sections detail the measurements and test methods that will be used.
2.3.1 H2S Removal Efficiency and Gas Quality
Testing will be conducted to evaluate the THIOPAQ™ system performance by comparing the composition, heating value, and contaminant concentrations of raw gas to that of processed gas. The following gas compositional and quality criteria will be evaluated on raw and processed gas samples:
• Gas properties (gross and net heating value, density, and compressibility) • Gas composition (N2, O2, CO2, and C1 through C6) • Sulfur compounds (primarily H2S)
A minimum of nine gas samples will be collected for the THIOPAQ testing on both the upstream and downstream sides of the scrubber, including three on each of three consecutive days. The time interval between gas sampling events will be at least one hour. Results of the analyses will be used to evaluate removal efficiency for H2S and other sulfur compounds and to examine the gas quality before and after treatment. The results will also allow the Center to evaluate the effects, if any, on gas composition and heating value. Gas samples will not be collected at the Bantry site. Gas composition and quality reports generated by the facility will be obtained and reported, but not independently verified.
2-7

Determination of H2S Removal Efficiency
THIOPAQ™ system H2S removal efficiency will be calculated according to the following equation:
RE = 1 - (Cout / Cin) * 100 (Eqn. 4)
where: RE = removal efficiency, % Cin = H2S concentration in raw gas, ppmv Cout = H2S concentration in processed gas, ppmv
Gas samples for analysis of H2S and other sulfur compounds (listed earlier in Section 2.2.1) will be collected in Tedlar bags. Raw biogas samples will be collected from sampling ports in the scrubber inlet and outlet gas lines at the site with the THIOPAQ™ system. Gas pressures at both locations are expected to be less than 1 psig, so the bags will be filled using line pressure. Gas pressure in the scrubber inlet line at the Bantry plant will be around 1000 psig, so a regulator will be installed at the sampling port to allow safe collection of gas in the bags. Appendix A-1 provides more detail regarding the gas sampling procedures. All samples will be properly labeled and documented using the log form shown in Appendix A-2.
Collected gas samples will be handled using the same procedures for the air sampling and handling described in section 2.2.1. Samples will be protected from light and analyzed withing 24 to 30 hours after collection. Analysis will be conducted by a laboratory that specializes in fuel gas analyses (Empact Analytical Systems, Inc., of Brighton, Colorado), following ASTM Method 5504 (1). A known volume of sample is injected into a gas chromatograph (GC) equipped with a molecular-sieve column for analysis of sulfur species. The sulfur components elute from the GC and they are transferred to a sulfur chemiluminescence detector (SCD) for quantitation. Resultant peaks in the chart trace are determined for each compound. These areas are compared to the areas of the same compounds contained in a calibration reference standard that is analyzed under identical conditions. A total of 20 sulfur compounds are included in the analysis with individual compound reporting limits of 4.0 ppbv.
QA/QC procedures for this analysis include instrument calibrations, laboratory control samples, internal standards, laboratory blanks, and duplicate analyses. Details regarding the QA/QC procedures are presented in Section 3.3.1.
Determination of Gas Composition and Quality
The field team leader will collect a corresponding set of gas samples in 600-ml stainless-steel gas sampling canisters concurrent with the gas sampling described above. These samples will be shipped to Empact for compositional analyses and determination of gas LHV. The samples will be collected at the same locations as the bag sampling described above.
The laboratory evacuates the canisters to prepare them for sampling. Test personnel will check the canisters with a vacuum gauge to ensure that they remain under vacuum and are leak-free prior to sample collection. Canisters that are not fully evacuated will not be used or will be evacuated on site and checked again before use. Appendices A-1, A-2, and A-6 contain detailed sampling procedures, log, and chain-of-custody forms.
2-8
Compositional analysis will be conducted in accordance with ASTM Specification D1945 (7) for quantification of speciated hydrocarbons, including methane through pentane (C1 through pentane C5), heavier hydrocarbons (grouped as hexanes plus C6+), N2, O2, and CO2 at the laboratory. The lab procedure specifies sample gas is injected into a Hewlett-Packard 589011 GC equipped with a molecular-sieve column and a thermal conductivity detector (TCD). The column physically separates gas components, the FID detects them, and the instrument plots the chart traces and calculates the resultant areas for each compound. The instrument then compares these areas to the areas of the same compounds contained in a calibration reference standard analyzed under identical conditions. The reference standard areas are used to determine instrument response factors for each compound and these factors are used to calculate the component concentrations in the sample.
The laboratory calibrates the instruments weekly with the reference standards. The instrument operator programs the analytical response factors generated for each compound analyzed into the instrument during calibrations. Allowable method error during calibration is ± 1 percent of the reference value of each gas component. The laboratory re-calibrates the instrument whenever its performance is outside the acceptable calibration limit of ± 1 percent for each component. The GHG Center will obtain and review the calibration records. Each sample will also be analyzed in duplicate to reconcile data quality objectives (Section 3.3.2).
The laboratory will use the compositional data to calculate the gross (HHV) and net (LHV) heating values (dry, standard conditions), compressibility factor, and the specific gravity of the gas per ASTM Specification D3588 (8). The data quality of the heating value determinations is related to the repeatability of the ASTM D1945 analysis.
2.3.2 NaOH Consumption
The design NaOH concentration in the make-up tank is 50 wt%. However, it is diluted with make-up water to about 4 wt% before entering the system. The NaOH usage estimated in the design was 9.25 kg/day. The host facility continuously monitors the amount of NaOH added to the system using a tank level sensor in the NaOH holding tank. The data is transmitted to the plant data acquisition system. The data will be provided to the Center and used to document NaOH addition rates and trends during the test period. Review of historical tank level data indicate that during each day of normal system operation, the tank level drops around 3 to 4 inches.
NaOH consumption will be reported for each of the three days of verification testing in units of gallons per day. A field reasonableness check will be conducted on the level sensor readings as described in Section 3.3.3.
2.3.3 Solids and Elemental Sulfur Production
A batch of solids slurry is drawn from the settling tank at the plant and directed to the vacuum filter where water is extracted from the slurry stream and returned to the bioreactor. The resultant solids cake is then collected in a container for disposal. The Center will determine the average solids and elemental sulfur production rate in units of lb/day using the following procedures.
(1) Determine the mass of solids collected during each of the three days of testing. (2) Collect a sample of each of the three batches for sulfur and moisture analyses.
2-9

Determination of Solids and Sulfur Production Rate
The amount of solids produced by the process will be verified daily during the three-day test period. Current operations at this facility allow the solids cake to fall off of the vacuum filter press into a large collection bin for subsequent disposal. The bin will be emptied and lined with a clean, pre-weighed sheet of polyethylene at the beginning of the verification period. Solids from the THIOPAQ™ system will be deposited into the bin following standard system operations on the first day of testing. The material will be gathered in the polyethylene sheet and a final weight obtained. The difference between the initial and final weights will be the mass of material collected that day. The process will be repeated on the two remaining days of testing and the three results will be averaged.
All weights will be determined using the same scale and procedures specified in Section 2.2.2 for determination of effluent bleed rates. The QA/QC procedures outlined in Section 3.3.4 will also apply for these determinations.
Elemental Sulfur and Moisture Content
Solids cake samples will be collected and shipped to Commercial Testing and Engineering for determination of sulfur and moisture content. Sulfur purity in the filter cake is estimated using an extraction and drying process. The large amount of liquid in the filter cake will require that moisture analyses be conducted prior to the sulfur analyses. The sulfur and moisture analytical procedures are shown in Appendix A-6.
The amount of moisture in the sample is determined by weighing 50 grams of undried sample into a previously dried, cooled, and weighed 100- by 15-mm Petri dish. The sample is then dried at 105°C for one hour. The sample is weighed after cooling in a desiccator. This dried sample can be used for the sulfur determination.
The sulfur analysis begins by weighing a 1-gram specimen in a fritted-glass extraction thimble. The sample is extracted in the extraction apparatus for at least 15 minutes with carbon disulfide (CS2). The container is removed, dried, and weighed. The percentage of insoluble residue is reported as foreign matter (including the ash). The percentage of sulfur, defined as the CS2 soluble fraction, is the difference between 100 and the percentage of foreign matter (to the nearest 0.1%).
2.4 PROCESS OPERATIONS MONITORING
All of the process operational parameter monitored by the site are recorded, logged, and stored by plant operational systems. Table 1-1 summarized the key system operational measurements that will be used to document THIOPAQ™ operations throughout the verification period. The facility will provide biogas flow rate, scrubber fluid flow rate, and NaOH level data to the GHG Center, and the report will include 15-minute averages for each of these parameters during the test periods. Other parameters such as conductivity and air flow to the bioreactor are considered proprietary to the Paques systems and will not be included.
2-10
3.0 DATA QUALITY
3.1. BACKGROUND
The GHG Center selects methodologies and instruments for all verifications to ensure that the desired level of data quality in the final results is obtained. The GHG Center specifies DQOs for each verification parameter before testing starts and uses these goals as a statement of data quality. Ideally, quantitative DQOs are established based on the level of confidence in results needed by stakeholders or potential users of a technology. In some cases, such as this verification, quantitative DQOs are not well defined and therefore, qualitative DQOs are established.
During this verification, determination of each of the primary verification parameters will be conducted based on published reference methods. The qualitative DQOs for this verification, then, are to meet all of the QA/QC requirements of each method. Each of the methods were introduced in Section 2.0 of this TQAP and are listed below. Additional details regarding the QA/QC requirements of each method are provided in the following sections.
Table 3-1. Verification Reference Methods
Verification Parameter Required Measurements Applicable Reference
Methods H2S air emissions (vent) H2S Concentrations Modified ASTM D5504
Air Flow Rate EPA Reference Method 2 Sulfate emissions Sulfates in water EPA Method 9056 Sulfide emissions Sulfides in water EPA Methods 9030B and
9034 H2S removal efficiency Raw gas H2S content
ASTM D5504Processed gas H2S content Gas Quality Gas composition ASTM D1945
Gas heating value ASTM D3588 NaOH consumption rate NaOH consumption rate None, see Section 3.3.3 Sulfur production Solids production None, see Section 3.3.4
Solids moisture content Solids sulfur content
3.2 ENVIRONMENTAL PERFORMANCE PARAMETERS
The primary verification parameters for environmental performance are air emissions of H2S and sulfate and sulfide effluent emissions. The DQOs for these parameters identified in Table 3-1 are detailed below along with explanations of the DQIs for each supporting measurement.
3-1

3.2.1 H2S Air Emissions
Two measurements are required to determine emissions of H2S from the bioreactor. These are H2S concentrations in the vent gas and vent gas flow rate. The combined error in these two measurements are the basis for the 30-percent relative error DQO stated in Table 3-1 for this parameter. Air Toxics, Ltd., will be analyzing collected samples in accordance with a modified version of ASTM Method 5504. The QA/QC procedures specified in the method will be followed, but acceptance criteria are modified to account for the fact that the sample matrix is air (the method is designed for gas samples), and concentrations of H2S and other sulfur compounds are expected to be very low. Table 3-2 summarizes the QC checks and the corresponding performance criteria.
Table 3-2. Summary of Vent Gas H2S Analyses QA/QC Checks
QC Check Minimum Frequency Acceptance Criteria Three-point instrument calibration
Monthly Three consecutive analyses of standards with a relative standard deviation less than 30%
Analysis of laboratory spiked sample
Daily, in conjunction with sample analyses
Recovery within 30% of expected values
Daily single-point calibration reanalysis (continuing calibration)
Daily, after sample analyses Within 30% of calibration standard
Documentation from Air Toxics, Ltd., that each of these QC checks was conducted and achieved will indicate that the qualitative DQO was met.
As an additional QC check, the GHG Center will supply one blind/audit air sample to the laboratory for analysis. The audit gas will be an independent Reference Standard of H2S in air manufactured by Scott Specialty Gases with a certified analytical accuracy of ± 5 percent. The audit sample will be collected, handled, and analyzed using the same procedures and equipment as the air samples. It will be submitted to the laboratory along with the vent samples collected during one of the test days. This QC check will serve as a performance evaluation audit (PEA) for this verification, and will be reported to the Southern QA Manager for inclusion in the audit report. The audit will also allow the GHG Center to evaluate H2S losses in the air samples.
Determination of air vent flow rate includes measurement of exhaust gas concentrations of velocity as differential pressure across a pitot tube and temperature. Method 2 specifies that a standard pitot be assigned an accuracy coefficient of 0.99. Method 2 calibration criteria also require that testers perform pre- and post-test thermocouple calibrations by subjecting the thermocouples used during testing to the average temperature found during testing. These readings will be compared to the readings of a NIST-traceable reference thermometer. The thermocouple reading must be within 1.5 percent of the reference thermometer to be considered acceptable. Details on thermocouple calibration are referenced in 40CFR60 Method 2, Section 10.3.1. The Dwyer manometer is a primary standard and does not require calibration.
These calibrations will provide documentation that the accuracy of each of the individual measurements conformed to reference method specifications. An overall uncertainty of ± 2 percent of reading is
3-2
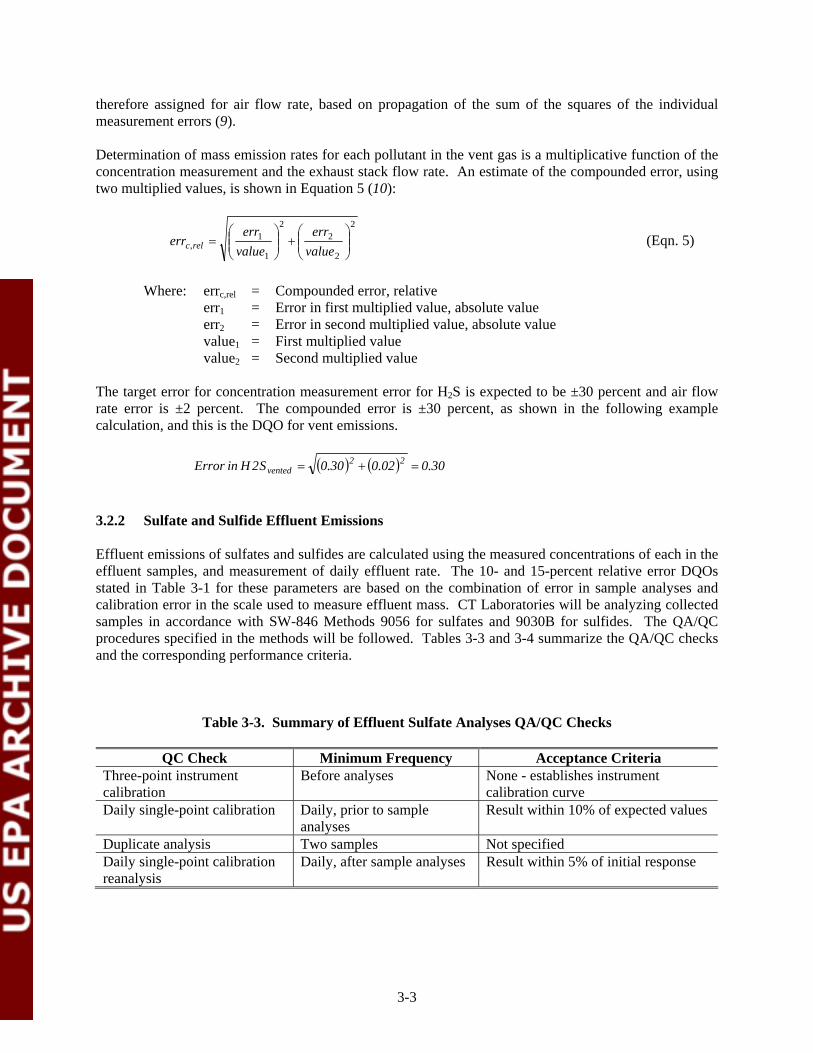
2 2⎛ err ⎞ ⎛ err ⎞
errc,rel =⎝⎜⎜ value
1
1 ⎠⎟⎟ +
⎝⎜⎜ value
2
2 ⎠⎟⎟
therefore assigned for air flow rate, based on propagation of the sum of the squares of the individual measurement errors (9).
Determination of mass emission rates for each pollutant in the vent gas is a multiplicative function of the concentration measurement and the exhaust stack flow rate. An estimate of the compounded error, using two multiplied values, is shown in Equation 5 (10):
(Eqn. 5)
Where: errc,rel = Compounded error, relative err1 = Error in first multiplied value, absolute value err2 = Error in second multiplied value, absolute value value1 = First multiplied value value2 = Second multiplied value
The target error for concentration measurement error for H2S is expected to be ±30 percent and air flow rate error is ±2 percent. The compounded error is ±30 percent, as shown in the following example calculation, and this is the DQO for vent emissions.
Error in H 2Svented = (0.30)2 + (0.02)2 = 0.30
3.2.2 Sulfate and Sulfide Effluent Emissions
Effluent emissions of sulfates and sulfides are calculated using the measured concentrations of each in the effluent samples, and measurement of daily effluent rate. The 10- and 15-percent relative error DQOs stated in Table 3-1 for these parameters are based on the combination of error in sample analyses and calibration error in the scale used to measure effluent mass. CT Laboratories will be analyzing collected samples in accordance with SW-846 Methods 9056 for sulfates and 9030B for sulfides. The QA/QC procedures specified in the methods will be followed. Tables 3-3 and 3-4 summarize the QA/QC checks and the corresponding performance criteria.
Table 3-3. Summary of Effluent Sulfate Analyses QA/QC Checks
QC Check Minimum Frequency Acceptance Criteria Three-point instrument calibration
Before analyses None - establishes instrument calibration curve
Daily single-point calibration Daily, prior to sample analyses
Result within 10% of expected values
Duplicate analysis Two samples Not specified Daily single-point calibration reanalysis
Daily, after sample analyses Result within 5% of initial response
3-3
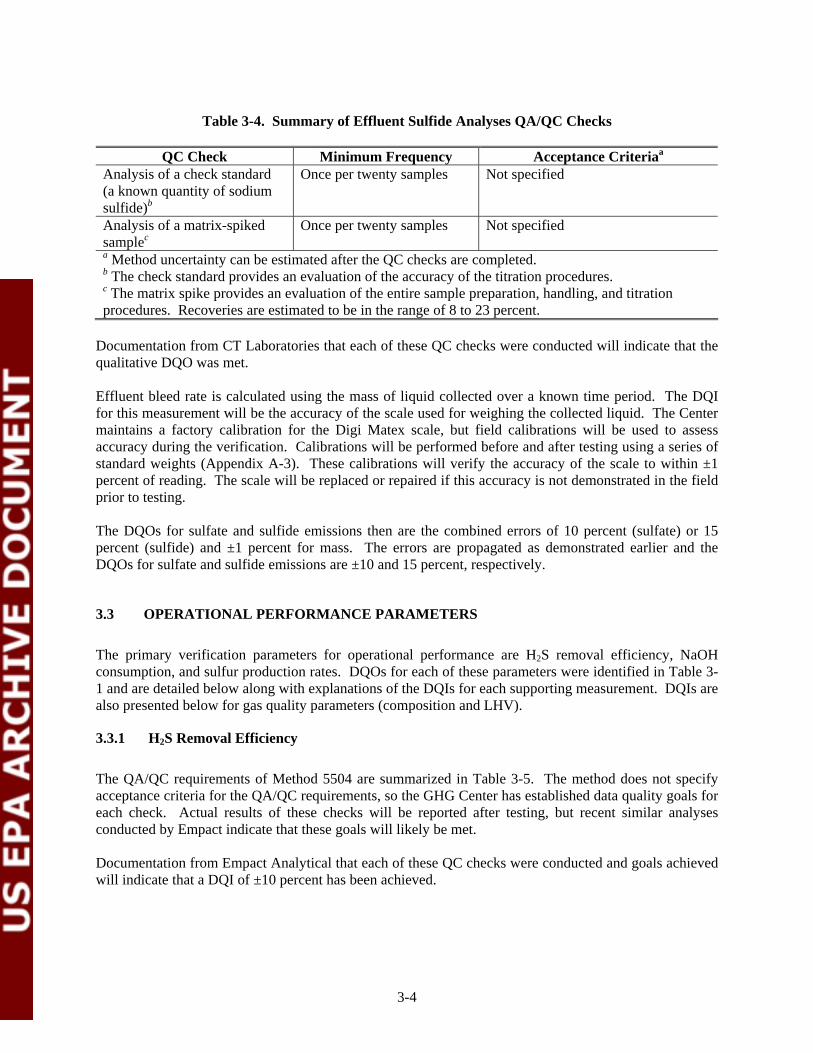
Table 3-4. Summary of Effluent Sulfide Analyses QA/QC Checks
QC Check Minimum Frequency Acceptance Criteriaa
Analysis of a check standard (a known quantity of sodium sulfide)b
Once per twenty samples Not specified
Analysis of a matrix-spiked samplec
Once per twenty samples Not specified
a Method uncertainty can be estimated after the QC checks are completed.b The check standard provides an evaluation of the accuracy of the titration procedures. c The matrix spike provides an evaluation of the entire sample preparation, handling, and titration procedures. Recoveries are estimated to be in the range of 8 to 23 percent.
Documentation from CT Laboratories that each of these QC checks were conducted will indicate that the qualitative DQO was met.
Effluent bleed rate is calculated using the mass of liquid collected over a known time period. The DQI for this measurement will be the accuracy of the scale used for weighing the collected liquid. The Center maintains a factory calibration for the Digi Matex scale, but field calibrations will be used to assess accuracy during the verification. Calibrations will be performed before and after testing using a series of standard weights (Appendix A-3). These calibrations will verify the accuracy of the scale to within ±1 percent of reading. The scale will be replaced or repaired if this accuracy is not demonstrated in the field prior to testing.
The DQOs for sulfate and sulfide emissions then are the combined errors of 10 percent (sulfate) or 15 percent (sulfide) and ±1 percent for mass. The errors are propagated as demonstrated earlier and the DQOs for sulfate and sulfide emissions are ±10 and 15 percent, respectively.
3.3 OPERATIONAL PERFORMANCE PARAMETERS
The primary verification parameters for operational performance are H2S removal efficiency, NaOH consumption, and sulfur production rates. DQOs for each of these parameters were identified in Table 31 and are detailed below along with explanations of the DQIs for each supporting measurement. DQIs are also presented below for gas quality parameters (composition and LHV).
3.3.1 H2S Removal Efficiency
The QA/QC requirements of Method 5504 are summarized in Table 3-5. The method does not specify acceptance criteria for the QA/QC requirements, so the GHG Center has established data quality goals for each check. Actual results of these checks will be reported after testing, but recent similar analyses conducted by Empact indicate that these goals will likely be met.
Documentation from Empact Analytical that each of these QC checks were conducted and goals achieved will indicate that a DQI of ±10 percent has been achieved.
3-4
Table 3-5. Summary of Biogas H2S Analyses QA/QC Checks
QC Check Minimum Frequency Data Quality Goals Three-point instrument calibration
Monthly None - establishes instrument calibration curve
Daily single-point calibration
Daily, prior to sample analyses Three consecutive analyses of standard within a range of 5% of expected values
Analysis of spiked sample Daily single-point calibration reanalysis
Once during sample analyses Daily, after sample analyses
Recovery within 10% of expected values Within 10% of calibration standard
The WPCF hosting the test provided the Center with preliminary biogas data. The data show the scrubber inlet and outlet H2S concentrations for samples collected on 14 days in October 2003. The data indicate average H2S concentrations of 12,276 ppmv and 13.9 ppmv at the scrubber inlet and outlet, respectively. Equation 4 from Section 2.3.1 showed that corresponding removal efficiency averaged 99.89 percent as shown below.
99.89 =(1 - (13.9 / 12,276)) * 100 , or 99.89 =(1 - (0.001132)) * 100
The value "0.001132" represents the fraction of H2S not removed by the scrubber. The relative error in the two measurements contributing to that value is ±10 percent each. The total error is, therefore, determined by calculating the sum of the squares of the two measurement errors as follows:
Relative error = 0.001132 ± (0.12 + 0.12)1/2, or 0.001132 ±14.1 percent
If the ±10 percent analytical error DQIs are met for the two analyses, then the uncertainty in determination of the fraction of H2S not removed is then ±14 percent.
3.3.2 Gas Composition, HHV and LHV
Field personnel will collect raw and processed biogas samples as described in Section 2.3.1 and submit them for laboratory analysis to determine gas composition and HHV/LHV. Compositional analyses will be conducted according to ASTM D1945 and LHV will be calculated based on the composition according to ASTM D3588.
ASTM D1945 repeatability directly affects the ASTM D3588 HHV and LHV data quality. The LHV repeatability is approximately 0.84 Btu/ ft3, or about 0.1 percent, provided the D1945 repeatability criteria are met. Duplicate analyses will be conducted on each sample submitted. The ASTM allowable method error during calibration is ± 1.0 percent of the reference value for each component.
The compounded accuracy of the two methods, including repeatability, allowable calibration error, and uncertainty in the calibration reference standard (±2 percent) therefore, is 2.2 percent. Achievement of proper calibrations and repeatability imply that use of these two ASTM methods will ensure that HHV and LHV data are accurate to ± 2.2 percent or better. Empact Analytical will provide the complete calibration and repeatability data to the Center when results are submitted.
3-5

As an additional QC check, the GHG Center will supply one blind/audit gas sample to the laboratory for analysis. The audit gas will be an independent Natural Gas GPA Reference Standard manufactured by Scott Specialty Gases with a certified analytical accuracy of ± 2 percent. The audit gas will be shipped to the test location and the Field Team Leader will collect a canister sample of it immediately after one of the gas samples is collected. He will ship the audit sample to the laboratory with the other fuel samples. The laboratory will analyze the audit sample in duplicate. The GHG Center will compute the average result from the two analyses and will compare the results to the certified concentration of each constituent. This QC check will serve as a second PEA for this verification.
3.3.3 NaOH Consumption
The NaOH consumption is currently measured at the WPCF with a Milltronics (Process Instruments Inc.) level transmitter that relays the liquid levels (height) in the tank to the WPCF’s data acquisition system. NaOH consumption is monitored continuously by tracking the liquid levels in the tank.
The Center will evaluate the accuracy of the level sensor data using a direct measurement field check. Specifically, NaOH consumption will be measured during the test period by measuring the flow rate of NaOH from a hose attached to the metering pump (after the NaOH tank) into a five-gallon bucket placed next to the pump. The mass of solution collected over a known time period will be recorded. The NaOH consumption measured by the field team leader with the pump flow test will be compared to the level sensor reading recorded on the DAS. The pump flow test will be considered acceptable for deviations of less than 10 percent between the two NaOH consumption methods.
3.3.4 Sulfur Purity and Production
Determination of sulfur purity and production was described in Section 2.3.3. Three measurements are required including determination of solids production rate, moisture content, and estimation of sulfur purity. A field calibration of the scale used to determine solids production rate will be conducted. The scale and calibration procedures were described in Section 2.2.3.
The methods that will be used to determine moisture and sulfur content are procedures developed and used internally by Commercial Testing (not published reference methods). Therefore, QA/QC checks will be limited to Commercial Testing’s internal QA policies. The Center will procure and maintain the lab’s Statement of quality and standard operating procedures. The Center will also obtain and review the calibration data for the analytical balance used for the analyses. Analytical uncertainty is expected to be ± 10 percent or better for both determinations.
3.7 INSTRUMENT TESTING, INSPECTION, AND MAINTENANCE
GHG Center personnel, the field team leader, laboratories, and/or contracted test organizations will subject all test equipment to the pre- and post-test QC checks discussed earlier. Operators will assemble and test it as anticipated to be used in the field before the equipment leaves the GHG Center or analytical laboratories. They will operate and calibrate all controllers, flow meters, computers, instruments, and other sub-components of the measurements system as required by the manufacturer and/or this TQAP. Any faulty sub-components will be repaired or replaced before being transported to the test site. Test personnel will maintain a small amount of consumables and frequently needed spare parts will be maintained at the test site. The Field Team Leader and Project Manager will handle major subcomponent failures on a case-by-case basis (e.g., by renting replacement equipment or buying replacement parts).
3-6

4.0 DATA ACQUISITION, VALIDATION, AND REPORTING
4.1 DATA ACQUISITION AND STORAGE
Test personnel will acquire the following types of data during the verification:
• Continuous measurements (i.e., process operational parameters collected by the sites'operating systems)
• Vent air pollutant concentrations • Effluent sulfur concentrations • Vent air flow and effluent flow rate measurements • Gas composition, heating value, and H2S content from biogas sample analyses • NaOH consumption rates • Sulfur product purity analyses and production rates
The field team leader will also take site photographs and maintain a Daily Test Log which includes the dates and times of setup, testing, teardown, and other activities.
The field team leader will submit digital data files, gas analyses, chain-of-custody forms, and the Daily Test Log to the Project Manager. The Project Manager will initiate the data review, validation, and calculation process. These submittals will form the basis of the VR which will present data analyses and results in table, chart, or text format as suited to the data type. The VR’s conclusions will be based on the data and the resulting calculations. The GHG Center will archive and store all data in accordance with the GHG Center QMP.
The field team leader will retrieve, review, and validate the collected data at the end of each day of testing. The field team leader will record manually acquired data (i.e., test run information and observations) in the Daily Test Log and on the log forms in Appendix A. Disk copies of the Excel spreadsheet results will be made at the end of each day.
Section 3.0 discussed the data quality assurance checks for the instruments illustrated in Figure 2-1. The field team leader will maintain manual and electronic records (as required) resulting from these checks.
The GHG Center will store original field data forms, the Daily Test Log, and electronic copies of data output and statistical analyses at the GHG Center’s RTP office per guidelines described in the GHG Center’s QMP after the completion of all test runs.
4.1.2 Laboratory Analyses
Sections 2.0 and 3.0 discussed biogas, effluent, and solids sampling and QA/QC. The field team leader will maintain sampling logs and chain-of-custody records. The laboratory will submit results for each sample, calibration records, and repeatability test results to the field team leader after the field test. The GHG Center will store original lab reports, electronic data copies, and statistical analyses at the GHG Center’s RTP office per guidelines described in the GHG Center’s QMP. The field team leader will compute the actual electrical efficiency at each load tested and report the results to the project manager after receipt of the laboratory analyses.
4-1

4.2 DATA REVIEW, VALIDATION, AND VERIFICATION
Data review and validation will primarily occur at the following stages:
• On-site -- by the field team leader • Before writing the draft Verification Report -- by the project manager • During QA review of the draft Verification Report and audit of the data -- by the GHG
Center QA Manager
Section 1.5 identifies the individuals who are responsible for data validation and verification.
The field team leader will be able to review, verify, and validate some data while on-site. Other data, such as analytical results from the laboratories must be reviewed, verified, and validated after testing has ended. The project manager has overall responsibility for these tasks. All collected data will be classed as valid, suspect, or invalid after review. The GHG Center will use the QA/QC criteria discussed in Section 3.0 and specified in the associated tables.
Valid results are based on measurements which meet the specified DQIs and QC checks. They were collected when an instrument was verified as being properly calibrated and they are consistent with reasonable expectations (e.g., manufacturers’ specifications, professional judgment).
The data review process often identifies anomalous data. Test personnel will investigate all outlying or unusual values in the field as is possible. Anomalous data may be considered suspect if no specific operational cause to invalidate the data is found.
The VR will incorporate all data-valid, invalid, and suspect. However, report conclusions will be based on valid data only and the report will justify the reasons for excluding any data. Suspect data may be included in the analyses, but may be given special treatment as specifically indicated. The Project Manager will decide to continue the test, collect additional data, or terminate the test and report the data obtained if the DQI goals cannot be met due to excessive data variability.
The QA Manager will review and validate the data and the draft VR using the TQAP and test method procedures as source material. The data review and data audit will be conducted in accordance with the GHG Center’s QMP. For example, the QA Manager will randomly select raw data and independently calculate the performance verification parameters dependent on that data. The comparison of these calculations with the results presented in the draft VR will yield an assessment of the QA/QC procedures used by the GHG Center.
4.3 RECONCILIATION OF DATA QUALITY OBJECTIVES
A fundamental component of all verifications is the reconciliation of the data and its quality as collected from the field with the DQOs. The field team leader and project manager will typically review the collected data to ensure that they are valid and are consistent with expectations. They will assess the quality of the data in terms of accuracy and completeness as they relate to the stated DQI goals. Section 3.0 discusses each of the verification parameters and their contributing measurements in detail. The procedures that field personnel will use to ensure that DQIs are achieved are also specified in Section 3.0. Analysts will conclude that DQOs were achieved if the test data show that DQI goals were met. DQIs and DQOs will therefore be reconciled. The GHG Center will assess achievement of certain DQI goals during field testing because QC checks and calibrations will be performed on-site or prior to testing.
4-2

Other DQIs, such as gas analysis repeatability, will be reconciled after field tests have concluded. Finally, the quality manager will also conduct an independent reconciliation of DQOs.
4.4 ASSESSMENTS AND RESPONSE ACTIONS
The Field Team Leader, Project Manager, QA Manager, GHG Center Director, and technical peer-reviewers will assess the quality of the project and associated data. The Project Manager and QA Manager independently oversee the project and assess its quality through project reviews, inspections (if needed), a technical systems audit (TSA), the two PEAs described in Section 3, and an audit of data quality (ADQ).
4.4.1 Project Reviews
The project manager is responsible for project data review and writing project reports. He is also responsible for conducting the first complete project assessment. Project personnel are involved with ongoing data review but it is the project manager’s responsibility to ensure that project activities meet the measurement and DQO requirements.
The GHG Center Director performs the second project review. The Director is responsible for ensuring that the project’s activities adhere to the ETV program requirements and stakeholder expectations. The GHG Center Director’s review will also include an overall project assessment to ensure that the field team leader has the equipment, personnel, and resources to complete the project as required and to deliver data of known and defensible quality.
The third review is that of the QA Manager, who is responsible for ensuring that the project management systems function as required by the QMP and corporate policy. The QA Manager is the final reviewer within the Southern organization and is responsible for assuring the achievement of all QA requirements.
The vendor (NATCO) and selected members of the Center's stakeholder groups will then review the report. Technically competent persons who are familiar with the technical aspects of the project, but not involved with the conduct of project activities, will perform the peer-reviews. The peer-reviewers will provide written comments to the project manager. Further details on project review requirements can be found in the GHG Center’s QMP.
The draft report will then be submitted to EPA QA personnel, and the project manager will address their comments as needed. The VR and VS will undergo EPA management reviews, including the GHG Center Program Manager, EPA ORD Laboratory Director, and EPA Technical Editor following this review.
4.4.2 Technical Systems Audit
An internal Technical Systems Audit (TSA) of this test will be conducted by Southern’s QA Manager. EPA QA/G7 states that TSAs are "thorough, systematic, and qualitative audits of the measurement system used in environmental data operations", which "are usually performed on the site of the project." The objective of the TSA is to assess and document acceptability of all facilities, maintenance, calibration procedures, reporting requirements, sampling and analytical activities, and quality control procedures. As implemented by the GHG Center, the approved TQAP (this document) provides the basis for the TSA. Objective evidence is gathered by interviewing personnel, examining records, and observing project activities. Audit findings are brought to the attention of GHG Center management in a written Audit Report.
4-3

The GHG Center also anticipates that independent TSAs will be conducted by the EPA QA Manager of at least one test per year. The GHG Center technical and QA staff will assist in the audit and respond to its findings as required if the EPA QA Manager elects to conduct a TSA on this test.
4.4.3 Performance Evaluation Audits
Two performance evaluation audits (PEAs) will be conducted as described in Section 3.0. These include submittal of a blind H2S in air reference standard as an analytical audit on vent air samples. The second PEA is submittal of a natural gas reference standard as an analytical audit on biogas compositional analyses. The Field Team Leader will evaluate the performance data for compliance with the project requirements and report the findings to the QA Manager upon receiving the analytical data from the analysts.
4.4.4 Audit of Data Quality
The ADQ is an evaluation of the measurement, processing, and data evaluation steps to determine if systematic errors have been introduced. The QA Manager will randomly select approximately 10 percent of the data to be followed through the analysis and data processing during the ADQ. The scope of the ADQ is to verify that the data-handling system functions correctly and to assess the quality of the data generated. The ADQ also includes review of QC documentation to verify that the planned QC checks and calibrations were performed and were within acceptance specifications. This process includes the independent review of DQI data and calculation of DQO attainment. The ADQ also includes review of any problems, changes, or corrective actions documented during the test program to verify that their impact on data quality has been assessed and documented.
The ADQ, as part of the project QA review, is not an evaluation of the reliability of the data presentation. The review of the data presentation is the responsibility of the project manager and the technical peer-reviewer.
4.5 DOCUMENTATION AND REPORTS
Documentation and proper information reporting for the different project activities is critical. The project manager, field personnel, vendor representatives, and QA personnel must be involved. The GHG Center will prepare the following field test documentation, QC documentation, corrective action/assessment report, and verification report/statements to insure the complete transfer of information to all parties involved in this project.
4.5.1 Field Test Documentation
The field team leader will record all important field activities. The field team leader will review all data sheets and maintain them in an organized file. Sections 2.0 and 3.0 describe the required test information. The field team leader will also maintain a daily test log that documents the field team’s activities, significant events, and any schedule deviations from the schedule or TQAP. The field team leader will immediately report any major problems that require corrective action to the project manager through a CAR.
4-4
The project manager will check the test results with the field team leader’s assistance to determine whether the QA criteria were satisfied. The GHG Center Director will be notified following this review and confirmation that the appropriate data were collected and DQOs were satisfied,
4.5.2 QC Documentation
The completion of the verification test will be followed by the collection of test data, sampling logs, calibration records, certificates of calibration, and other relevant information for storage in the project file in the GHG Center’s RTP office. Calibration records will include information about the instrument being calibrated, raw calibration data, calibration equations, analyzer identifications, calibration dates, calibration standards used and their traceabilities, calibration equipment, and staff conducting the calibration. These records will be used to prepare the Data Quality section in the Verification Report, and made available to the QA Manager for internal audits and final report QA review.
4.5.3 Corrective Action and Assessment Reports
A corrective action must occur when (1) deviations from the TQAP occur due to unforeseen events or problems or (2) when the result of an audit or quality control measurement is shown to be unsatisfactory (as defined by the DQOs or by the measurement objectives for each task). The corrective action process involves the field team leader, project manager, and QA Manager.
Immediate corrective action responds quickly to improper procedures, indications of malfunctioning equipment, or suspicious data. This TQAP includes validation processes to ensure data quality and establishes predetermined limits for data acceptability. Consequently, data determined to deviate from these objectives require evaluation through an immediate correction action process. The field team leader, as a result of calibration checks and internal quality control sample analyses, will most frequently identify the need for such an action. The field team leader will immediately notify the project manager and will take and document appropriate action. The project manager is responsible for and is authorized to halt the work if it is determined that a serious problem exists. The field team leader is responsible for implementing corrective actions identified by the project manager and is authorized to implement any procedures to prevent the recurrence of problems. A written Corrective Action Report (CAR), included in Appendix A-6, is required on major corrective actions that deviate from the TQAP. The CAR will be routed to the QA Manager and retained in the project files.
The QA Manager will route the results of internal assessments (TSA and ADQ) to the project manager for review, comments, and corrective action. The results will be documented in the project records. The project manager will take any necessary corrective action needed and will address the QA Manager’s comments in the final Verification Report.
4.5.4 Verification Report and Verification Statement
The project manager will coordinate preparation of a draft VR and VS within 8 weeks of completing the field test, if possible. The VR will summarize the results for each verification parameter discussed in Section 2.0 and will contain sufficient raw data to support findings and allow others to assess data trends, completeness, and quality. Clear statements will be provided which characterize the performance of the verification parameters identified in Sections 1.0 and 2.0. The VR will contain a VS, which is a 3 to 5 page summary of the Paques technology, the test strategy used, and the verification results obtained.
The project manager will submit the draft VR and VS to the QA Manager and Center Director for review. A preliminary outline of the report is shown below.
4-5

Preliminary Outline THIOPAQ and Shell-Paques Verification Report
Verification Statement
Section 1.0: Verification Test Design and Description Description of the ETV program Technology and site description Overview of the verification parameters and evaluation strategies
Section 2.0: Results Environmental performance Operational performance
Section 3.0: Data Quality
Section 4.0: Additional Technical and Performance Data (optional) supplied by the vendor
Section 5.0: References: Appendices: Raw Verification and Other Data
4.6 TRAINING AND QUALIFICATIONS
The GHG Center’s field team leader has extensive experience (+15 years) in field testing of air emissions from many types of sources. He is also familiar with gas flow measurements from production, processing, and transmission stations. He is familiar with the requirements of all of the test methods and standards that will be used in the verification test.
The project manager has performed numerous field verifications under the ETV program and is familiar with requirements mandated by the EPA and GHG Center QMPs. The QA Manager is an independently appointed individual whose responsibility is to ensure the GHG Center’s activities are performed according to the EPA approved QMP.
4.7 HEALTH AND SAFETY REQUIREMENTS
This section applies to GHG Center personnel only. Other organizations involved in the project have their own health and safety plans specific to their roles in the project.
GHG Center staff will comply with all known host, state/local, and federal regulations relating to safety at the test facility. This includes use of personal protective gear (e.g., safety glasses, hard hats, hearing protection, safety toe shoes) as required by the host and completion of site safety orientation (i.e., site hazard awareness, alarms, and signals).
4-6

5.0 REFERENCES
(1). American Society for Testing and Materials, Standard Practice for Determination of Sulfur Compounds in Natural Gas by Gas Chromatography and Chemiluminescense. ASTM D5504-01. West Conshohocken, PA. 2001.
(2). U.S. Environmental Protection Agency. Code of Federal Regulations, Title 40, Part 60. New Source Performance Standards. Appendix A. Washington, DC. 1999.
(3) U.S. Environmental Protection Agency. Office of Solid Waste. SW-846 - Revision 2, Method 9030B - Acid-Soluble and Acid-Insoluble Sulfides: Distillation. Washington, DC. 1994.
(4) U.S. Environmental Protection Agency. Office of Solid Waste. SW-846 - Revision 2, Method 9034 - Titrimetric Procedure for Acid-Soluble and Acid Insoluble Sulfides. Washington, DC. 1994.
(5) U.S. Environmental Protection Agency. Office of Solid Waste. SW-846 - Revision 2, Method 9056 - Determination of Inorganic Anions by Ion Chromatography. Washington, DC. 1994.
(6). American Public Health Association, American Water Works Association, Water Pollution Control Federation, Standard Methods for the Examination of Water and Wastewater. 20th
Edition. Washington, DC. 1998.
(7). American Society for Testing and Materials, Standard Test Method for Analysis of Natural Gas by Gas Chromatography. ASTM D1945-9GRI. West Conshohocken, PA. 2001.
(8). American Society for Testing and Materials, Standard Practice for Calculating Heat Value, Compressibility factor, and Relative Density of Gaseous Fuels. ASTM D3588-98. West Conshohocken, PA. 2001.
(9). Shigehara, R.T., Todd, W.F., Smith, W.S., Significance of Errors in Stack Sampling Measurements. Presented at the annual meeting of the Air Pollution Control Association. St. Louis, MO. 1970.
(10). Skoog, Douglas A., and Donald M. West. Fundamentals of Analytical Chemistry. 4th Edition. CBS College Publishing. Philadelphia, PA. 1982.
5-1

Appendix A
Test Procedures and Field Log Forms
Page Appendix A-1. Gas Sampling Procedures.................................................................................. A-3 Appendix A-2. Gas Sampling Log ............................................................................................ A-5 Appendix A-3. Log Form for Field Calibration of Scale ........................................................... A-6
Determination of Effluent or Solids Removal Rate .......................................... A-7Appendix A-4. Appendix A-5. Sample Chain-of-Custody Record..................................................................... A-8 Appendix A-6. Corrective Action Report .................................................................................. A-9 Appendix A-7. Sulfur and Moisture Analysis Methods............................................................. A-10
A-1

A-2
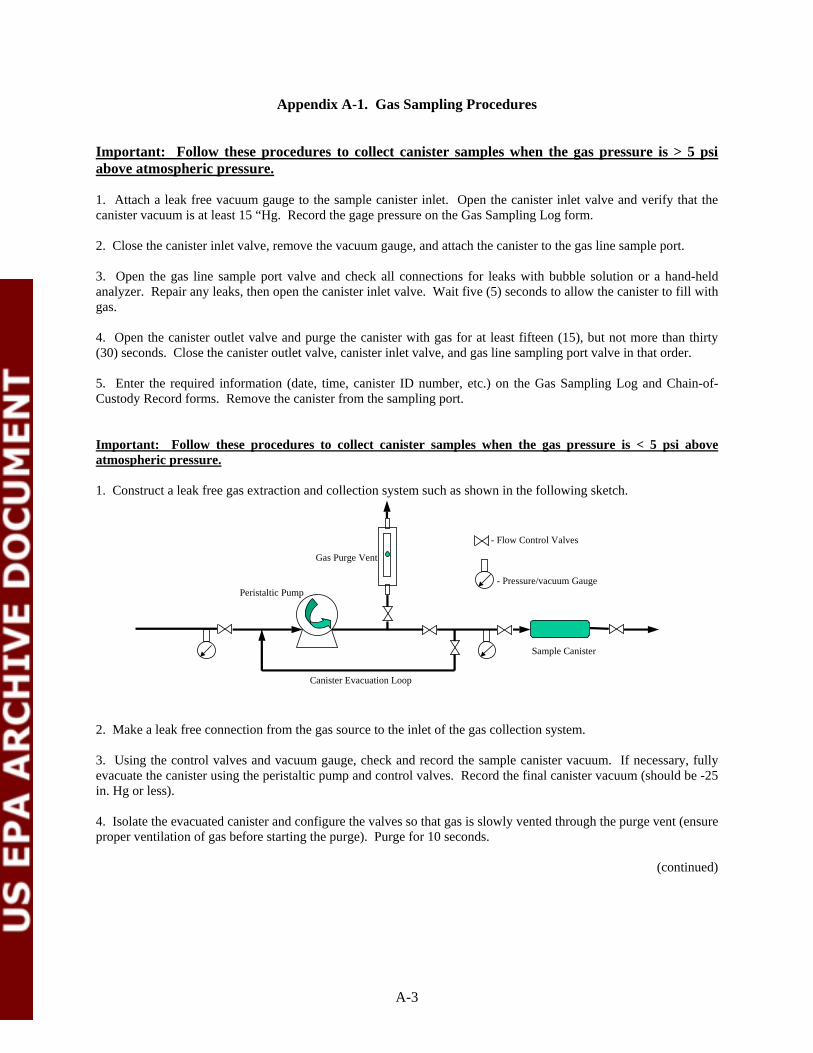
Appendix A-1. Gas Sampling Procedures
Important: Follow these procedures to collect canister samples when the gas pressure is > 5 psi above atmospheric pressure.
1. Attach a leak free vacuum gauge to the sample canister inlet. Open the canister inlet valve and verify that the canister vacuum is at least 15 “Hg. Record the gage pressure on the Gas Sampling Log form.
2. Close the canister inlet valve, remove the vacuum gauge, and attach the canister to the gas line sample port.
3. Open the gas line sample port valve and check all connections for leaks with bubble solution or a hand-held analyzer. Repair any leaks, then open the canister inlet valve. Wait five (5) seconds to allow the canister to fill with gas.
4. Open the canister outlet valve and purge the canister with gas for at least fifteen (15), but not more than thirty (30) seconds. Close the canister outlet valve, canister inlet valve, and gas line sampling port valve in that order.
5. Enter the required information (date, time, canister ID number, etc.) on the Gas Sampling Log and Chain-of-Custody Record forms. Remove the canister from the sampling port.
Important: Follow these procedures to collect canister samples when the gas pressure is < 5 psi above atmospheric pressure.
1. Construct a leak free gas extraction and collection system such as shown in the following sketch.
Peristaltic Pump
Sample Canister
- Pressure/vacuum Gauge
- Flow Control Valves
Gas Purge Vent
Canister Evacuation Loop
2. Make a leak free connection from the gas source to the inlet of the gas collection system.
3. Using the control valves and vacuum gauge, check and record the sample canister vacuum. If necessary, fully evacuate the canister using the peristaltic pump and control valves. Record the final canister vacuum (should be -25 in. Hg or less).
4. Isolate the evacuated canister and configure the valves so that gas is slowly vented through the purge vent (ensure proper ventilation of gas before starting the purge). Purge for 10 seconds.
(continued)
A-3

Appendix A-1 Gas Sampling Procedures (continued)
5. Close the purge vent and slowly open the valves upstream of the canister and allow the canister to pressurize to no less than 2 psig.
6. With the pump still running, open the canister outlet valve and purge the canister for 5 seconds. Sequentially close the canister outlet valve, canister inlet valve, and pump inlet valve. Turn off pump.
7. Record the date, time, gas temperature, canister ID number, and final canister pressure on log form.
8. Return collected sample(s) to laboratory with completed chain-of-custody form.
Important: Follow these procedures to collect bag samples when the gas pressure is > 5 psi above atmospheric pressure.
1. Use the gas extraction and collection system to completely evacuate the tedlar bag.
2. Attach a leak free, stainless steel gas regulator to the sampling port and control gas pressure to around 5 psig. Purge the regulator for at least 15 seconds.
3. Attach the evacuated bag to the regulator using teflon tubing and allow the bag to fill completely. Close the bag valve and stop the flow of gas.
4. Record the date, time, gas temperature, canister ID number, and final canister pressure on log form.
5. Return collected sample(s) to laboratory with completed chain-of-custody form.
Important: Follow these procedures to collect bag samples when the gas pressure is < 5 psi above atmospheric pressure.
1. Use the gas extraction and collection system to completely evacuate the tedlar bag.
2. Attach the evacuated bag to the sampling port using teflon tubing and allow the bag to fill completely. Close the bag valve and stop the flow of gas.
3. Record the date, time, gas temperature, bag ID number, and final canister pressure on log form.
4. Return collected sample(s) to laboratory with completed chain-of-custody form.
A-4

Appendix A-2. Gas Sampling Log
Project ID: Location (city, state):
Date: Signature:
Unit Description: Fuel Source (e.g., pipeline, digester):
Note: If desired, assign random sample ID numbers to prevent the lab from attributing analysis results to a particular test or audit sample. Transfer sample ID numbers to Chain-of-Custody Record prior to sample shipment.
Date Time Run ID Sample ID Canister/Bag ID Initial Vacuum (“Hg)
Notes:
A-5

Appendix A-3. Log Form for Field Calibration of Scale
Project ID:______________________ Location (city, state):___________________________________
Date:____________________ Signature:____________________________________________
Unit Description:_________________________ Sampling Location :_____________________________
Calibration Procedures: 1. Prior to any field weighing, assemble the platform and readout as specified in the user's manual. 2. Ensure that the platform is level using the bubble level indicator. 3. Zero the scale. 4. Place the 5 lb standard weight onto the scale and record the reading. 5. Using the remaining standard weights, repeat step 4 at each of the following values: 10, 25, 50,
75, and 90 lbs. 6. Repeat the entire process at the end of each day of testing.
Standard Weight (lb)
Initial Scale Response (lb)
Difference (lb) Acceptable? a Gas Temp
End of Day Scale
Response (lb)
Acceptable Repeatability? b
5 10 25 50 75 90
a Acceptable difference = (std weight * 0.002) + 0.05 lbs b Acceptable difference = Initial response - final response < 0.05 lbs
Notes:
A-6

Appendix A-4. Determination of Effluent and Solids Removal Rates
Project ID:______________________ Location (city, state):___________________________________
Date:____________________ Signature:____________________________________________
Unit Description:_________________________ Sampling Location :_____________________________
Determination of Effluent Bleed Rate: 7. Calibrate the scale following procedures in Appendix A-4. 8. Place effluent collection receptacle on scale and record tare weight. 9. Record the effluent bleed start time and date. 10. Collect all effluent bled from system in receptacle and record the bleed end time. 11. Record the final receptacle weight and calculate the weight of effluent collected and the elapsed
time.
Solids Removal Rate: 12. Calibrate the scale following procedures in Appendix A-4. 13. Line the solids collection receptacle with tared sheet of polyethylene. 14. Record the solids removal start time and date. 15. Collect all solids in receptacle and record the end time. 16. Record the final weight of polyethylene sheet and collected solids 17. Calculate the weight of solids collected and the elapsed time.
Indicate liquid or
solids collection
Date and Start Time
Receptacle or poly Tare weight (lbs)
End time Elapsed time (min)
Final weight (lbs)
Material collected (lbs)
Notes:
A-7

Appendix A-5. Sample Chain-of-Custody Record
Southern Research Institute Chain-of-Custody Record
Important: Use separate Chain-of-Custody Record for each laboratory and/or sample type.
Project ID: Location (city, state):
Originator’s signature: Unit description:
Sample description & type (gas, liquid, other.):
Laboratory: Phone: Fax:
Address: City: State: Zip:
Sample ID Bottle/Canister ID Sample Matrix Analyses Req’d Notes/Comments
Relinquished by: Date: Time: Received by: Date: Time:
Relinquished by: Date: Time: Received by: Date: Time:
Relinquished by: Date: Time: Received by: Date: Time:
Notes: (shipper tracking #, other)
A-8

Appendix A-6. Corrective Action Report
Corrective Action Report
Verification Title:
Verification Description:
Description of Problem:
Originator: Date:
Investigation and Results:
Investigator: Date:
Corrective Action Taken:
Originator: Date: Approver: Date:
cc: GHG Center Project Manager, GHG Center Director, Southern QA Manager
A-9

Appendix A-7. Sulfur and Moisture Analysis Methods
SULFER
Hydrochloric Acid, Concentrated Hydrochloric Acid, 1:1. Sodium Carbonate. Sodium Nitrate. Liquid Bromine.
Procedure 1 is sufficiently accurate for ordinary routine work. Use procedure 2 for very accuratedeterminations.
Procedure 1.- Weigh a 1-g. specimen in the fritted glass extraction thimble and extract in the extraction apparatus for at least 15 minutes with carbon disulfide. Remove the container, dry and weigh. Report the percentage of insoluble residue as foreign matter. (This includes the ash.) Report the percentage of sulfur as the difference between 100 and the percentage of foreign matter to the nearest 0.1%.
Note – Organic impurities may dissolve in the CS2, causing a slight inaccuracy.
Procedure 2.- Weigh a 0.5-g. specimen into a 250-ml. porcelain dish, warm to 30°C and add about 6 ml. of bromine. Keep the mixture at this temperature for about 10 minutes and then add 15 ml. of concentrated HNO3 previously brought to 30°C. After the violent reaction has subsided, heat the mixture, cautiously at first, then boil to drive off the HNO3 . Add about 0.5g. of NaCl to avoid loss of H2SO4 and evaporate the mixture to a small volume. Repeat the evaporation three or four times, adding after each evaporation about 5 ml. of concentrated HCl. Evaporate to dryness on the steam bath and heat the residue gently. Take up this residue with 5 ml. of HC1 (1: 1) and about 100 ml. of water, filter out the insoluble matter and wash thoroughly on the filter paper with hot water. (This may be ignited and weighed, if the amount of insoluble matter is desired.)
Transfer the filtrate to a 500-ml. volumetric flask, dilute to the mark and thoroughly mix. Pipette a 100-ml. aliquot into a beaker, heat to boiling, and add 10 ml. of 10% BaC12 solution drop by drop to the boiling solution with constant stirring. Stir the solution thoroughly, preferably letting it stand overnight and filter through an ignited and weighed Gooch crucible with asbestos mat. Wash with boiling water, dry, ignite at 700-750°C and weigh as BaSO4. Calculate to the percentage of sulfur to the nearest 0.01%, correcting for the aliquoting of the solution.
Calculation.-
Weight of BaSO4 × 0.1374 = Weight of S in sample
A-10

MOISTURE
Procedure.- Weigh 50g. of the undried prepared laboratory sample into a previously dried, cooled, and weighed 100- by 15-mm. Petri dish. Place in an oven at 105°C for 1 hour. Then remove, cool in a desiccator, and weigh.
Calculation.-
sample wt. – dried wt. % moisture = × 100
Sample wt.
Notes.-1.This dried sample may be used for the ash, elemental sulfur, combined sulfur, arsenic, and selenium determinations. However, since approximately 100 g. of dried sulfur will be required for all of these determinations, it is suggested that the moisture determination be made in duplicate.
A-11


