Embed Size (px)
Citation preview

U.S. Department of Health and Human Services Food and Drug Administration Center for Drug Evaluation and Research Office of Translational Sciences Office of Biostatistics
STATISTICAL REVIEW AND EVALUATION CLINICAL STUDIES
NDA/Serial Number: 21-356
Drug Name: Viread (tenofovir disoproxil fumarate) 300 mg tablets, administered once daily
Indication(s): Treatment of HIV-1 infection in combination with other antiretroviral agents in treatment-experienced subjects
Applicant: Gilead Sciences
Date(s): Submission date: 9/25/2009 PDUFA date: 3/25/2009
Review Priority: Standard
Biometrics Division: DB7
Primary Statistical Reviewer: Eric Frimpong, Ph.D.
Concurring Reviewers: George Rochester Ph.D. Greg Soon, Ph.D.
Medical Division: Division of Antiviral Products (DAVP)
Medical Reviewer: Rebecca Levorson, M.D.
Project Manager: Ceresa, Carrie M., PharmD
Tenofovir Statistical Review

Table of Contents LIST OF TABLES.......................................................................................................................................................3
EXECUTIVE SUMMARY .........................................................................................................................................5
1.1 CONCLUSIONS AND RECOMMENDATIONS .............................................................................................................5 1.2 BRIEF OVERVIEW OF CLINICAL STUDIES .............................................................................................................5 1.3 STATISTICAL ISSUES AND FINDINGS.....................................................................................................................6
2. INTRODUCTION ...............................................................................................................................................8
2.1 OVERVIEW......................................................................................................................................................8 DATA SOURCES ..........................................................................................................................................................8
3. STATISTICAL EVALUATION ........................................................................................................................9
3.1 EVALUATION OF EFFICACY OF STUDY 021 .....................................................................................................9 3.1.1 Study Design ..........................................................................................................................................9 3.1.2 Efficacy Assessments..............................................................................................................................9 3.1.3 Efficacy Endpoints .................................................................................................................................9 3.1.4 Patient Disposition, Demographic and Baseline Characteristics........................................................10 3.1.5 Optimize Background Regimen (OBR) ................................................................................................13 3.1.5 Statistical Methodologies.....................................................................................................................16 3.1.6 Applicant’s Results and Conclusion ....................................................................................................16 3.1.7 Reviewer’s Comments..........................................................................................................................28
EVALUATION OF SAFETY..........................................................................................................................................34
4. FINDINGS IN SPECIAL/SUBGROUP POPULATIONS ............................................................................34
5. SUMMARY AND CONCLUSIONS ................................................................................................................37
5.1 STATISTICAL ISSUES AND COLLECTIVE EVIDENCE .......................................................................................37 5.2 CONCLUSIONS AND RECOMMENDATIONS ..........................................................................................................38
Tenofovir Statistical Review

LIST OF TABLES
Table 1: Patient Disposition.........................................................................................................................................11 Table 2: Patient Demographics and Baseline Characteristics (Randomized and Treated) ..........................................12 Table 3: Baseline Disease Characteristics (Randomized and Treated)........................................................................13 Table 4: Baseline ANRS OBR GSS and Number of ARVs in OBR at Baseline (Randomized and Treated) ............14 Table 5: Baseline Stanford OBR GSS (Randomized and Treated)..............................................................................15 Table 6: Primary Efficacy Endpoint at Week 24 (ITT Analysis Set) .........................................................................17 Table 7: Primary Efficacy Endpoint - Subjects with a Baseline ANRS OBR GSS ≤ 1 or > 1 log10 copies/mL (ITT Analysis Set)................................................................................................................................................................18 Table 8: Primary Efficacy Endpoint - Subjects with a Baseline Stanford OBR GSS ≤ 1 or > 1 log10 copies/mL (ITT Analysis Set)................................................................................................................................................................19 Table 9: Secondary Efficacy Endpoint at Week 48 (ITT Analysis Set) ......................................................................20 Table 10: Secondary Efficacy Endpoint - Subjects with a Baseline ANRS OBR GSS ≤ 1 or > 1 log10 copies/mL (ITT Analysis Set) .......................................................................................................................................................20 Table 11: Change from Baseline in Plasma HIV-1 RNA (log10 copies/mL) (LOCF; ITT Analysis Set)...................21 Table 12: Applicant’s Additional Results - Number and Percentage of Subjects with Plasma HIV-1 RNA < 400 copies/mL (M = F, LOCF, M = E; ITT Analysis Set) .................................................................................................22 Table 13 : Number and Percentage of Subjects with Plasma HIV-1 RNA < 50 copies/mL (M = F, LOCF, M = E; ITT Analysis Set).........................................................................................................................................................23 Table 14: TLOVR Treatment Outcome for HIV-1 RNA < 400 copies/mL Through Week 24 (ITT Analysis Set) ....24 Table 15: TLOVR Treatment Outcome for HIV-1 RNA < 400 copies/mL Through Week 48 (ITT Analysis Set) ....25 Table 16: TLOVR Treatment Outcome for HIV-1 RNA < 50 copies/mL Through Week 24 (ITT Analysis Set) .....26 Table 17: TLOVR Treatment Outcome for HIV-1 RNA < 50 copies/mL Through Week 48 (ITT Analysis Set) ......27 Table 18 : Virologic Outcome for HIV-1 RNA < 400 copies/mL at Week 24 (ITT Analysis Set) .............................29 Table 19: Virologic Outcome for HIV-1 RNA < 400 copies/mL at Week 48 (ITT Analysis Set) ..............................30 Table 20 : Virologic Outcome for HIV-1 RNA < 50 copies/mL at Week 24 (ITT Analysis Set) ...............................30 Table 21: Virologic Outcome for HIV-1 RNA < 50 copies/mL at Week 48 (ITT Analysis Set) ................................30 Table 22: Number and Percentage of Subjects with Plasma HIV-1 RNA < 400 copies/mL and Baseline TDF GSS < 1 or = 1 (M=F; ITT set) ...............................................................................................................................................31 Table 23: Number and Percentage of Subjects with Plasma HIV-1 RNA < 50 copies/mL and Baseline TDF GSS < 1 or = 1 (M=F; ITT set) ..................................................................................................................................................31 Table 24: Number and Percentage of Subjects with Plasma HIV-1 RNA < 400 copies/mL and Baseline ANRS OBR GSS ≤ 1 or > 1 (M=F; ITT set)....................................................................................................................................31 Table 25: Number and Percentage of Subjects with Plasma HIV-1 RNA < 50 copies/mL and Baseline ANRS OBR GSS ≤ 1 or > 1 (M=F; ITT set)....................................................................................................................................32 Table 26: Time-Weighted change from Baseline to Week 24 in Plasma HIV-1 RNA and Baseline Background TDF GSS < 1 or = 1 (ITT set)..............................................................................................................................................32 Table 27: Baseline GSS and Week 24 virologic response (HIV-1 RNA levels < 400 Copies/mL) (M=F; ITT set) ...34 Table 28 : Baseline GSS and Week 24 virologic response (HIV-1 RNA levels < 50 Copies/mL) (M=F; ITT set) ....34 Table 29: Subgroup Analysis for Primary Efficacy Endpoint - Subjects with a Baseline ARNS OBR GSS ≤ 1 or > 1 log10 copies/mL (ITT Analysis Set) ...........................................................................................................................36 Table 30: Number and Percentage of Subjects with Plasma HIV-1 RNA < 50 copies/mL in Subjects with a Baseline ANRS OBR GSS ≤ 1 or > 1 (M=F; ITT set)………………………………………………………………………..37
Tenofovir Statistical Review

List of Figures
Figure 1: Cumulative frequency of the GSS OBR in the French 3-point and Stanford 3-point scales ........................15 Figure 2: Mean and 95% Confidence Interval of the Time-Weighted Average Change from Baseline through Week 48 in Plasma HIV-1 RNA (ITT Analysis Set) .............................................................................................................17 Figure 3: Mean and 95% Confidence Interval of the Time-Weighted Average Change from Baseline through Week 48 in Plasma HIV-1 RNA in Subjects with Baseline ANRS GSS ≤ 1.0 (ITT Analysis Set).......................................18 Figure 4: Kaplan-Meier Plot of Time to Virologic Failure during the Double-Blind Treatment Period (ITT Analysis Set)...............................................................................................................................................................................23 Figure 5 : Time to Loss-of –Virologic Response (HIV-1 RNA < 50 copies/mL) (ITT Analysis Set) ........................27
: Distribution of DAVG24 within ARNS OBR GSS.....................................................................................33Figure 6Figure 7 : Distribution of DAVG24 within Stanford OBR GSS .................................................................................33
Tenofovir Statistical Review

EXECUTIVE SUMMARY
1.1 Conclusions and Recommendations
In September of 2009, Gilead Sciences submitted a supplemental NDA (21-356) consisting of data from a single pivotal phase III trial of 48 weeks ( Study 0321) to seek the approval of tenofovir disoproxil fumarate (TDF) 300 mg administered once daily for the treatment of HIV-1 infection among adolescents subjects. The current study was performed to assess the efficacy of TDF together with a genotype-guided optimized background regimen (OBR) compared to placebo with OBR in the treatment of experienced HIV-1 infected adolescents weighing over 35 kg and having plasma HIV- RNA levels ≥ 1000 copies/mL.
The protocol-specified primary endpoint was defined as the time-weighted average change from baseline through Week 24 (DAVG24) in Plasma HIV-1 RNA. Based on this endpoint the difference between the treatment groups were not statistically significant. The efficacy results based on the 48 week (DAVG48) data also showed no differences in efficacy among subjects who took TDF compared to those who took placebo. The Division of Anti-viral Products (DAVP) requested that an analysis of the proportion of subjects below 50 Copies/mL be used as the primary endpoint. Using the definition as provided by the DAVP the rate of response in TDF was 20.45% (9/44), which also failed to demonstrate superiority over placebo 34.15% (14/41). Other exploratory analyses which examined differences in response to treatment based on baseline TDF genotypic sensitivity score (GSS) also did not show any statistically significant differences.
1.2 Brief Overview of Clinical Studies
Tenofovir was approved by the Agency on the 26th October, 2001 for the treatment of adult HIV-1 infection. Subsequently, TDF was approved for the treatment of chronic hepatitis B in August, 2008. In this submission consisting of data from a single pivotal phase III trial of 48 weeks (Study 0321) the Sponsor seeks approval of TDF administered once daily for the treatment of HIV-1 infection among adolescents subjects. In this study subjects were randomized to either TDF with OBR or placebo with OBR for a period of 48 weeks. After this period, subjects were given the option of enrolling in a 96-week open-label extension phase or seek other regimen. After this period, subjects are given the option of enrolling in a 96-week open-label extension phase or seek other regimen.
Study 0321 was performed to assess the efficacy of tenofovir DF together with a genotype-guided optimized background regimen compared to placebo with OBR in the treatment of experienced HIV-1 infected adolescents weighing over 35 kg and having plasma HIV- RNA levels ≥ 1000 copies /mL. The OBR for each patient was configured and optimized according to their genotyping results coupled with their antiretroviral drug history. Additionally, the Sponsor evaluated safety, tolerability and changes in bone mass density (BMD) in the treatment groups.
Tenofovir Statistical Review

The study was conducted in 18 sites: 17 in Brazil and 1 in Panama. A total of 90 eligible subjects were randomized in a 1:1 ratio to receive 300 mg once daily tenofovir DF plus OBR (n = 46) or placebo plus OBR (n = 44).
The primary efficacy endpoint as defined in the study protocol is the time-weighted average change from baseline through Week 24 (DAVG24) in plasma HIV-1 RNA. This was computed as the area under the curve between the first post baseline value through the week 24 value minus the baseline value. Other secondary endpoints of interest are the time-weighted average change from baseline through Week 48 (DAVG48) in plasma HIV-1 RNA and the proportion of subjects with HIV-1 RNA < 400 copies/mL and < 50 copies/mL at Weeks 24 and 48. At week 24 subjects who did not achieve a decrease in HIV-1 RNA levels of at least 0.5log10 copies/mL were considered non-responders and were un-blinded. In this case, non-responders originally randomized to TDF were discontinued from the study to seek other feasible regimen whereas those randomized to placebo were given the option to receive open label TDF together with a reconfigured OBR.
This study was conducted to fulfill a post-marketing commitment on the efficacy and safety of tenofovir in the experienced HIV-1 infected adolescent population, ages of 12 to < 18 years.
1.3 Statistical Issues and Findings
The Agency considered DAVG24 endpoint not to be the most appropriate definition to establish efficacy for 24 weeks or longer treatment durations. How subjects were handled who dropped out of the study prior 24 weeks in terms of missing information is not clear and may produce biased assessment of differences. This issue is also relevant to the 48 week assessment. Given the discontinuation rate in this study (31/87, 35.6%) of approximately a third of the randomized and treated subjects, any changes in the imputed values for these subjects will likely alter the conclusion of the trial. It would be more appropriate to use an endpoint such as median change from baseline or proportion of respondents below a pre-specified level at pre-specified follow up time points.
Subjects were stratified at baseline into two groups as OBR GSS ≤ 1 and OBR GSS >1. The sponsor attributed the lack of treatment difference to the imbalances in the OBR. The stratification employed in this particular study is sensitive to different cut-points because they lead to different conclusions.
The differences in median changes from baseline for all subgroup analysis were computed by subtracting the median change from baseline in the placebo group from that of the tenofovir group. The subgroup analyses for subjects with ANRS OBR GSS ≤ 1 showed a difference in median change of -0.518 log10 copies from baseline between tenofovir and the placebo groups (-1.658 copies in the tenofovir group [n=18] and -1.140 in the placebo group [n=10]). This difference was considered clinically relevant in favor of tenofovir but was not statistically significant at two-sided 0.05. For subjects with the French National Agency for Aids Research (ANRS) OBR GSS >1 the difference in median change was 0.211 log10 copies in favor of the
Tenofovir Statistical Review

placebo group (-1.471 copies/mL in the tenofovir group [n=26] and -1.682 copies/mL in the placebo group [n=31]).
Snapshot analyses were performed by adopting the principles outlined in the Agency’s guidelines for snapshot algorithm. The snapshot approach classified subjects as responders or non-responders based on the HIV RNA level at Weeks 24 and 48. If the subjects discontinued the study treatment before Weeks 24 or 48 or did not have the HIV RNA value at Week 48 they were considered as non-responders in the snapshot analysis. The slight difference in the snap shot and Time-to-loss-of-virologic-response (TLOVR) results was mostly due to different classifications for subjects who rebounded and then re-suppressed, or subjects who had a temporary blip in viral load. This however, did not change the conclusion that both the proportion of subjects with HIV RNA below 50 copies/mL and the proportion of subjects with HIV RNA below 400 copies/mL in the placebo group were slightly higher than those in the tenofovir group at both weeks 24 and 48. Please see Tables 18 through Table 21.
The following exploratory subgroup analyses were performed:
1) Gender and baseline OBR Status: Results of this analysis using the proportion of subjects with HIV-1 RNA copies less than 50 as endpoint at week 24 shows that, among males (3/20, 15.0%) achieved HIV-1 RNA response in the tenofovir group compared to (6/17, 35.29%) in the placebo group. Among females there were (6/24, 25.0%) in the tenofovir group compared to (8/24, 33.33%) in the placebo group. Furthermore, a similar analysis for these subgroups were conducted based on the baseline stratification of OBR GSS score of ≤ 1 and OBR GSS >1. Results indicate that among male subjects with GSS ≤ 1 the response was (1/9, 11.1%) in the tenofovir group compared to (2/7, 28.6%) in the placebo group. In the GSS >1 subgroup, the response was (2/11, 18.2%) compared to (4/10, 40%) in the placebo group. In the case of females within the GSS score of ≤ 1 subgroup, there were (2/9, 22.2%) in the tenofovir group and (2/3, 66.7%) in the placebo group. On the other hand, there was virtually no difference in the GSS>1 subgroup. The response were (4/15, 26.7%) in the tenofovir group and (6/21, 28.6%) in the placebo group.
2) Race and OBR Status: With regards to blacks there were (4/13, 30.77%) in the tenofovir group compared to (3/11, 27.27%) in the placebo group who achieved HIV-1 RNA less than 50 copies at week 24. Among whites, subjects with HIV RNA less than 50 were (5/23, 21.74%) and (9/21, 42.86%) in the tenofovir and placebo groups respectively. In the other race, there was none in the tenofovir group whereas only 2 subjects in the placebo group had copies less than 50. For blacks with GSS score of ≤ 1, one patient in each treatment group achieved RNA copies < 50 (1/3, 33.3%) and (1/6, 16.7%) in the placebo and tenofovir groups respectively. For blacks within the GSS >1 subgroup the response were (2/8, 25.0%) in the placebo group and (3/7, 42.9%) in the tenofovir group. In the case of white subjects in the GSS ≤ 1 subgroup, there were (3/6, 50.0%) in the
Tenofovir Statistical Review

placebo group compared to (2/8, 25.0%) in the tenofovir group. For those in the GSS >1 subgroup there were (6/15, 40.0%) in the placebo group compared to (3/15, 20.0%) in the tenofovir group. Only 2 subjects in the other race with GSS>1 within the tenofovir group had RNA copies less than 50.
2. INTRODUCTION
2.1 Overview
Approximately 6 % of the estimated 33 million people infected with human immunodeficiency virus (HIV) worldwide are children. This infection is typified by a condition that progressively reduces the effectiveness of the immune system. This leaves infected individuals susceptible to opportunistic infections and tumors.
Current optimal treatment options for HIV infection consists of antiretroviral (ARV) regimens. Typical regimens consist of combinations (cocktails) of at least three drugs belonging to two or more types of ARV agents. These cocktails suppress HIV replication and thereby reducing the potential for resistant viruses, boosting CD4 cell count and hence delay the progression of the disease.
HIV Type -1 progression in infected children previously exposed to a number of non-suppressive ARV regimens is more rapid. In particular, those with advance clinical disease, low CD4 parameters and higher HIV-1 ribonucleic acid (RNA) levels, are most at risk of further disease progression. Adherence in infected children is more difficult and unpredictable compared to adults due to psychosocial and historical reasons. As a result, children are more likely to have higher levels of drug failures and thereby develop resistance to available therapy. This leaves these infected children with very few options with current therapeutic agents. This prompts for more novel treatment methods and use of ARVs in pediatric subjects.
Similar considerations for the need for effective treatment of HIV-1 infection among adolescent exist and are further exacerbated by the growth and development challenges of this period. Further research is needed in the adolescent population and TDF will continue to obtain data as described in the post-market requirement as agreed between the Sponsor and the Agency.
Data Sources
The application was electronic and can be found in FDA internal network drive of \\CDSESUB1\EVSPROD\NDA021356\0569
Tenofovir Statistical Review

3. STATISTICAL EVALUATION
3.1 Evaluation of Efficacy of Study 021
3.1.1 Study Design Study 0321 comprised of a 48 week randomized, double-blind, placebo-controlled phase followed by a two 96 week consecutive open label phase. For the first 48 weeks, a total of 90 subjects were randomized in 1:1 ratio to receive either 300mg once daily tenofovir DF with OBR (n = 46) or placebo with OBR (n = 44). The OBR consisted of a combination of 3 to 5 therapeutic agents. These combinations were determined at screening based on the patient’s genotype results together with their history of ARV use. Subjects who fail to achieve a decrease greater or equal to 0.5log10 copies/mL were considered non-responders. Those subjects were completely withdrawn from the study if originally assigned to the tenofovir arm, but those assigned to placebo were given the options to continue on study by switching to open label tenofovir DF with a reconstructed OBR.
Safety evaluations were carried out by means of either complete physical examinations or symptom-directed. Other serial laboratory testing such as hematology, chemistry and urinalysis assessment were also conducted at every visit. Bone density tests were also conducted by means of bone biochemical makers at baseline, weeks 4, 16, 24, 32, 48 and every 24 week interval in the open label extension period. In addition, dual energy x –ray absorptiometry (DEXA) scans of the lumbar spine as well as the whole body were carried out at baseline, week 24, 48 and every 48 weeks thereafter in the extension period. The study was conducted in 18 sites: 17 in Brazil and 1 in Panama.
The primary comparison was time weighted average change in plasma HIV-1 RNA levels from baseline to week 24. additionally, time-weighted average change from baseline through Week 48 in plasma HIV-1 RNA as well as the comparisons of proportion of subjects with HIV-1 RNA < 400 copies/mL, and < 50 copies/mL at Weeks 24 and 48.
3.1.2 Efficacy Assessments Changes in plasma HIV-1 RNA levels, CD4 counts and percentages were assessed at every visit. Additionally, subsets of subjects who opted for the open label phase at week 24 and have been on TDF for at least 4 weeks undergo an intensive pharmacokinetic substudy.
3.1.3 Efficacy Endpoints The primary efficacy endpoint is time-weighted average change from baseline through Week 24 (DAVG24) in plasma HIV-1 RNA. Other primary endpoints preferred by the Division of Anti-viral Products are the proportion of subjects with HIV-1 RNA levels below 50 Copies/mL and below 400 Copies/mL at week 24.
Tenofovir Statistical Review

3.1.4 Patient Disposition, Demographic and Baseline Characteristics Table 1 provides a summary of subjects’ disposition. A total of 90 subjects were randomized at 17 sites in Brazil and a site in Panama. Of those 90 subjects, 46 subjects were randomized to tenofovir DF group and 44 to the placebo group. Three subjects, 2 in the TDF group and 1 in the placebo group were determined never to have taken any study medication. Out of the remaining 87 subjects, 27 subjects (60.0 %) and 29 subjects (69.0 %) completed the 48 week double blind phase in the TDF group and the placebo group respectively.
The majority of the discontinued subjects in both treatment groups were unblinded for virologic failure. Thirteen (31.0 %) subjects from the placebo group discontinued from the randomized phase, 3 of these were removed from the study. Ten out of these unblinded subjects from the placebo group were enrolled in the open label extension period to receive TDF. Additionally, one patient was unblinded for virologic failure and withdrew consent and was removed from the study. In the tenofovir group, 14 of the 18 (40.0 %) subjects who discontinued from the study were due to virologic failure. For reasons such as investigators discretion; there were 2 from each group (4.4 % in TDF group and 4.8 % in the placebo group), safety/tolerability/ efficacy; 2 in the TDF group with one of these being drug- related vomiting and other due to intolerance to ARV regimen.
In the open-label extension phase, a total of sixty subjects received tenofovir DF. Of these 24 were originally randomized to tenofovir DF and the remaining 36 originally randomized to placebo. Overall, 19 subjects 8 in the tenofovir group and 11 in the placebo group discontinued in the extension phase. Most of the discontinuations were due to the investigators discretion (7 subjects in each group). The rest of the subjects’ discontinuation was due to safety/tolerability and efficacy reasons, 1 and 4 in the tenofovir DF group and placebo group respectively.
Tenofovir Statistical Review

Table 1: Patient Disposition
Tenofovir Placebo n/N (%) n/N (%)
Subjects Randomized 46 44
Subjects Randomized and Treated 45 42
Subjects Completing 48 Week Randomized Phase 27/45 (60.0) 29/42 (69.0)
Discontinued from Randomized Phase 18/45 (40.0) 13/42 (31.0) Unblinded for Virologic Failure and Enrolled into Open Label Extension NA 10/42 (23.8)
Reasons for Discontinuation
Investigator’s Discretion 2/45 (4.4) 2/42 (4.8)
Safety, Tolerability or Efficacy Reasons 16 (35.6) 0
Unblinded for Virologic Failure 14 0
Withdrew Consent 0 1/42 ( 2.4)
Subjects Treated in the Extension Phase 24 36
Subjects Discontinued from Extension Phase 8/24 (33.3) 11/36 (30.6)
Investigator’s Discretion 7/24 (29.2) 7/36 (19.4)
Safety, Tolerability or Efficacy Reasons 1/24 (4.2) 4 (11.1)
A summary of the demographic and baseline characteristics of the subjects is presented in Table 2. Overall, the baseline characteristics were evenly distributed among the two treatment groups. However, majority of the study subjects were whites (51.7%).
Tenofovir Statistical Review

Table 2: Patient Demographics and Baseline Characteristics (Randomized and Treated)
Total Tenofovir DF Placebo
Characteristics (N = 45) (N = 42) (N = 87) Gender – n (%)
Female 24 (46.7) 25 (59.5) 49 (56.3) Male 21 (53.3) 17 (40.5) 38 (43.7)
Race – n (%) White 23 (51.5) 22 (52.4) 45 (51.7) Black or African Heritage 14 (31.1) 11 (26.2) 25 (28.7) Other 8 (17.8) 9 (21.4) 17 (19.5)
Age Mean (SD) 14 (1.5) 14 (1.5) 14 (1.5) Median 14 14 14 Min, Max 12, 17 12, 17 12, 17
Weight (kg) Mean (SD) 45.84 (9.64) 49.09 (11.34) 47.41 (10.56) Median 43.8 47.3 45.5 Min, Max 35.0, 76.9 35.0, 82.0 35.0, 91.1
Height (cm) Mean (SD) 155.84(10.07) 156.05 (8.57) 156.87 (8.7) Median 154 156 154 Min, Max 5.1 (2.6, 5.9) 5.0 (3.6, 5.9) 5.0 (2.6, 5.9)
Body Mass Index (kg/m^2) Mean (SD) 18.72 (2.30) 19.99 (3.24) 19.32 (2.85) Min, Max 15.3, 26.9 15.4, 30.1 15.3, 30.1
As shown in Table 3 below, there were similarities in the distribution of patient baseline disease characteristics in the two treatment groups. About half of the subjects in the tenofovir group had HIV-RNA log10 copies of more than 4.71 (median) compared to 4.63 (median) in the placebo group. On the whole the median CD4 cell count was 370 and the median CD4% was 16.0. A patient in each treatment group was excluded from the study due to HIV-RNA levels below 1000 copies/mL.
Tenofovir Statistical Review

Table 3: Baseline Disease Characteristics (Randomized and Treated)
Total Tenofovir DF Placebo
Baseline Disease Characteristics (N = 45) (N = 42) (N = 87) HIV-1 RNA (log10 copies/mL)
Mean (SD) 4.66 (0.75) 4.57 (0.64) 4.61 (0.69) Median 4.60 4.55 4.60 Q1, Q3 4.3, 5.2 4.3, 5.0 4.3, 5.0 Min, Max 2.9, 6.4 3.3, 6.6 2.9, 6.6
CD4 Count (/mm3) Mean (SD) 378.4 (236.4) 354 (205.7) 366.5 (220.5) Median 370.5 335.5 357.0 Q1, Q3 217, 540.5 238, 465 223, 480.5 Min, Max 14, 893 43, 933 14, 933
CD4 % Mean (SD) 17.7 (9.94) 17.6 (8.32) 17.7 (9.00) Median 15.5 16.5 16.0 Q1, Q3 10, 25 11, 22.5 11, 24 Min, Max 2, 43.0 2, 34.0 2, 43.0
3.1.5 Optimize Background Regimen (OBR) To better understand the susceptibility of tenofovir, the Sponsor calculated Genotypic Sensitivity Score (GSS) at baseline for the configured OBR by using two public databases. The scoring systems are the ANRS (French National Agency for AIDS Research algorithm, a 3-point scale) and the Stanford HIV database program (5-point and 3-point scales). The scales are as follows:
The ANRS algorithm: 1.0 = No resistance (No resistance associated resistance mutations) 0.5 = possible resistance (mutations associated to possible resistance) 0.0 = Yes Resistant (mutations associated to resistance)
The Stanford HIV-db algorithm: Stanford 5-point Scale 1.00 = No resistance, i.e., sensitive 0.75 = potential low-level resistance 0.50 = low-level resistance 0.25 = Intermediate resistance 0.00 = High-level resistance
Stanford 3-point Scale 1.0 = Sensitive or potential low-level resistance 0.5 = Low-level resistance or intermediate resistance 0.0 = High-level resistance
Tenofovir Statistical Review

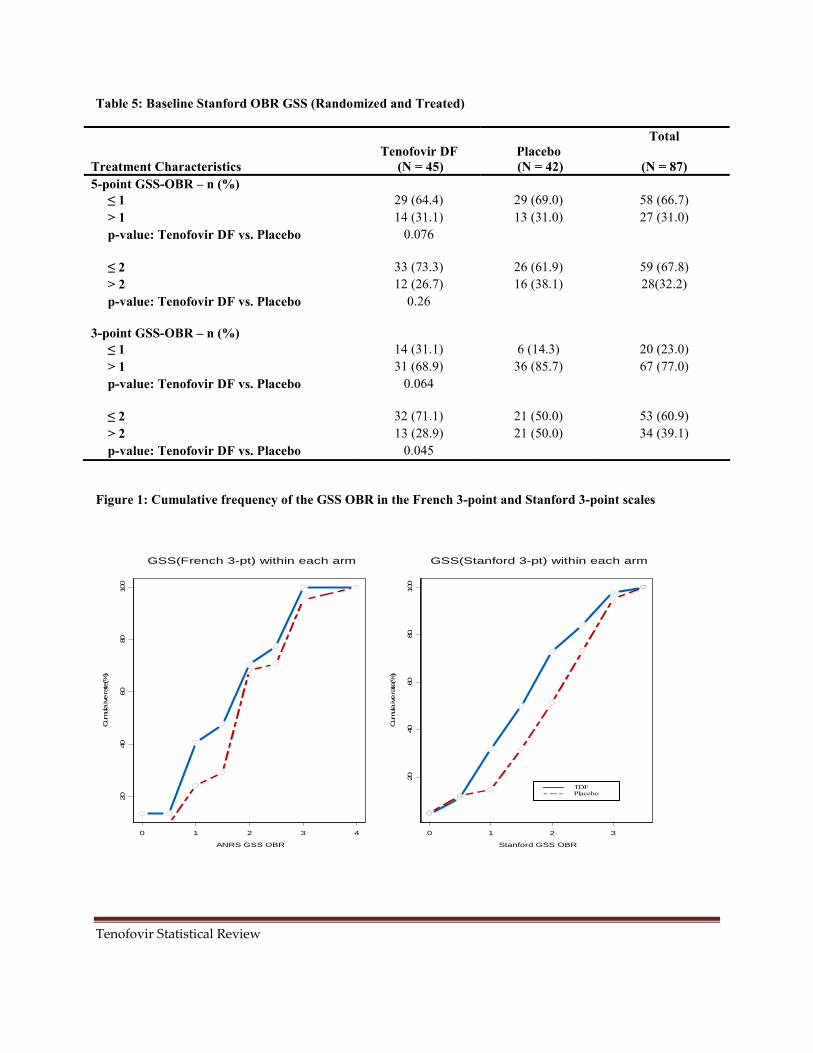
The applicant calculated the GSS by adding the score for each ARV in the OBR regimen and for subgroup analyses, subjects were stratified by their baseline OBR GSS as ≤ 1 or > 1. There were no major differences in the distribution of OBR among the treatment groups. Most of the subjects (66.7%) had three ARVs in their OBR. Table 4 also shows that the proportion of subjects with ANRS GSS ≤ 1 in the tenofovir group was higher (18/45, 40%) compared to that of the placebo group (10/42, 23.8%). However the proportion of subjects with GSS = 2 was seen to be higher in the placebo group (16/42, 38.1%) compared to the tenofovir group (10/45, 22.2%). There were no significant differences in other categories of GSS. The overall assertion of the sponsor was that since more subjects in the tenofovir group had less active OBR compared to those in the placebo group, they would not be expected to gain clinical benefits from the OBR (Figure 1). For baseline susceptibility of tenforvir DF, the placebo group had a higher proportion compared to tenofovir group. Therefore a lower treatment response to tenofovir was expected in the tenofovir group.
Table 4: Baseline ANRS OBR GSS and Number of ARVs in OBR at Baseline (Randomized and Treated)
Total Tenofovir DF Placebo
Treatment Characteristics (N = 45) (N = 42) (N = 87) Number of Antiretrovirals in OBR – n (%)
3 29 (64.4) 29 (69.0) 58 (66.7) 4 14 (31.1) 13 (31.0) 27 (31.0) 5 2 (4.4) 0 2 (2.3)
GSS-OBR – n (%) ≤ 1 18 (40.0) 10 (23.8) 28 (32.2) 1.5 3 (6.7) 2 (4.8) 5 (5.7) 2 10 (22.2) 16 (38.1) 26 (29.9) 2.5 3 (6.7) 2 (4.8) 5 (5.7) ≥ 3 11 (24.4) 12 (28.6) 23 (26.4)
GSS stratum-OBR – n (%) ≤ Median (Median GSS = 2) 31 (68.9) 28 (66.7) 59 (67.8) > Median (Median GSS = 2) 14 (31.1) 14 (33.3) 28 (32.2)
Susceptibility for TDF 0 1 (2.2) 2 (4.8) 3 (3.4) 0.5 24 (53.3) 15 (35.7) 39 (44.8) 1 20 (44.4) 25 (59.5) 45 (51.7)
Table 5 shows the results from using the Stanford 5-piont and 3-point scales based on the baseline stratification of GSS ≤ 1 or > 1 and other categories of interest. The overall pattern of having non-active OBR in the tenofovir group thus GSS ≤ 1 is also seen with the Stanford algorithm (Figure 1).
Tenofovir Statistical Review
GSS(French 3-pt) within each arm GSS(Stanford 3-pt) within each arm
20
40
60
80
100
Cum
ula
ive
rate
(%)
0 1 2 3 4
ANRS GSS OBR
20
40
60
80
100
Cum
ula
ive
rate
(%)
TDF Placebo
0 1 2 3
Stanford GSS OBR
Table 5: Baseline Stanford OBR GSS (Randomized and Treated)
Treatment Characteristics 5-point GSS-OBR – n (%) ≤ 1 > 1 p-value: Tenofovir DF vs. Placebo
Tenofovir DF (N = 45)
29 (64.4) 14 (31.1)
0.076
Placebo (N = 42)
29 (69.0) 13 (31.0)
Total
(N = 87)
58 (66.7) 27 (31.0)
≤ 2 > 2 p-value: Tenofovir DF vs. Placebo
33 (73.3) 12 (26.7)
0.26
26 (61.9) 16 (38.1)
59 (67.8) 28(32.2)
3-point GSS-OBR – n (%) ≤ 1 > 1 p-value: Tenofovir DF vs. Placebo
14 (31.1) 31 (68.9)
0.064
6 (14.3) 36 (85.7)
20 (23.0) 67 (77.0)
≤ 2 > 2 p-value: Tenofovir DF vs. Placebo
32 (71.1) 13 (28.9)
0.045
21 (50.0) 21 (50.0)
53 (60.9) 34 (39.1)
Figure 1: Cumulative frequency of the GSS OBR in the French 3-point and Stanford 3-point scales
Tenofovir Statistical Review

3.1.5 Statistical Methodologies
The efficacy analyses were based on the modified intent to treat dataset which the sponsor refers to as intent to treat (ITT). Gilead’s hypothesis that there is no difference between the tenofovir group compared to the placebo group in terms of virologic response, with respect to the time-weighted average change from the baseline through week 24. The alternate hypothesis is that the tenofovir group is different from the placebo group in virologic response, with respect to the time-weighted average change from the baseline through week 24 in plasma HIV-RNA. The primary efficacy end-point was defined as the time-weighted average change between the first post-baseline value through the last value up to Week 24 minus the baseline value (DAVG24). Similar computations were determined for week 48 as the secondary endpoint (DAVG48). The differences in DAVG24 between the two groups were tested by Van Elteren test based on the GSS baseline stratification. In addition, Gilead conducted further analysis for other secondary endpoints such as missing equals excluded (M = E), failure (M = F), and last observation carried forward (LOCF). These analyses were also repeated for number and percentages of subjects with HIV-RNA levels < 50 and <400 at weeks 24 and 48. These comparisons were conducted using a two-sided Fisher’s Exact test. Kaplan –Meier product limit method was used for the distribution of time to virologic failure during the double-blind phase.
3.1.6 Applicant’s Results and Conclusion
Table 6 summarizes the applicant’s results for primary efficacy endpoint. The applicant’s results show that both treatment groups demonstrated decrease from baseline in plasma HIV-1 RNA that was clinically relevant. However these results were not statistically significant using the Van Elteren test (p = 0.55). The median DAVG24 were -1.580 log10 copies/mL and -1.549 log10 copies/mL in the tenofovir group (n =44) and placebo group (n=41) respectively. This result is also reflected in Figure 2. Similar analyses were also carried out for the subgroup of subjects stratified by their baseline OBR GSS (≤ 1 or > 1) in accordance with both ARNS and the Stanford scales (Tables 7 and Table 8). For the ARNS, subjects with OBR GSS ≤ 1 who received tenofovir had a median change of -1.658 log10 copies/mL (n=18) compared to a median change of -1.140 log10 copies/mL (n=10) for those who received placebo. This result was no different from the more robust Stanford scales. The median changes in HIV-1 RNA from baseline to week 24 for the tenofovir group and the placebo group were respectively -1.206 log10 copies/mL (n=15) and 0.036 log10 copies/mL (n=7) using the 5-point scale. For the 3-point scale, the median change was -1.381 log10 copies/mL (n=14) for the tenofovir group and 0.063 log10 copies/mL (n=6) for the placebo group.
Tenofovir Statistical Review

(b) (4) (b) (4)
Table 6: Primary Efficacy Endpoint at Week 24 (ITT Analysis Set)
Time-Weighted Average Change in HIV-1 RNA (log10 copies/mL) from Baseline through Week 24 (DAVG24)a,b,c
Tenofovir DF (N = 44)
Placebo (N = 41) p-valued
DAVG Through Week 24 N 44 41 0.55 Mean (SD) -1.246 (1.116) -1.346 (1.245) Median -1.580 -1.549 Q1, Q3 -2.15, -0.27 -2.36, -0.34 Min, Max -2.81, 0.89 -3.09, 0.88
Source: Clinical Study Report for Study 0321, Section 7, Table 7-1 a. DAVG through time X is the time-weighted average between the first post-baseline value through the last the value up to
week X minus the baseline value. b. HIV-1 RNA analyzed using Ultrasensitive assay (range 50 to 100,000 copies/mL); or as a
reflex test. c. HIV-1 RNA collected after first dose of open-label tenofovir DF or after last randomized dose date + 2 days (if
terminated) for double-blind groups was excluded. d. p-value is from a Van Elteren test stratified by baseline genotypic sensitivity score (GSS) (without tenofovir DF) <= or>
median [median GSS is 2].
Figure 2: Mean and 95% Confidence Interval of the Time-Weighted Average Change from Baseline through Week 48 in Plasma HIV-1 RNA (ITT Analysis Set)
Source: Clinical Study Report for Study 0321, Section 7, Figure 7-1
Tenofovir Statistical Review
17

(b) (4) (b) (4)
Table 7: Primary Efficacy Endpoint - Subjects with a Baseline ANRS OBR GSS ≤ 1 or > 1 log10 copies/mL (ITT Analysis Set)
OBR GSS ≤ 1 OBR GSS > 1 Time-Weighted Average Change in HIV-1 RNA (log10 copies/mL) from Baseline through Week 24 (DAVG24)a,b,c
Tenofovir DF (N = 18)
Placebo (N =10)
Tenofovir DF (N = 26)
Placebo (N = 31)
N 18 10 26 31 Mean (SD) -1.308 (1.091) -0.888 (1.265) -1.203 (1.152) -1.494 (1.222) Median -1.658 -1.140 -1.471 -1.682 Q1, Q3 -2.00, -0.76 -2.23, 0.09 -2.19, -0.18 -2.48, -0.49 Min, Max -2.75, 0.61 -2.41, 0.88 -2.81, 0.89 -3.09, 0.77 p-valued: Tenofovir vs. Placebo 0.40 0.33
Source: Clinical Study Report for Study 0321, Section 7, Table 7-2 a. DAVG through time X is the time-weighted average between the first post-baseline value through the last the value up to
week X minus the baseline value. b. HIV-1 RNA analyzed using Ultrasensitive assay (range 50 to 100,000 copies/mL); or as a
reflex test. c. HIV-1 RNA collected after first dose of open-label tenofovir DF or after last randomized dose date + 2 days (if
terminated) for double blind groups was excluded. d. p-value (comparing randomized treatment groups) is from a Wilcoxon rank sum test.
Figure 3: Mean and 95% Confidence Interval of the Time-Weighted Average Change from Baseline through Week 48 in Plasma HIV-1 RNA in Subjects with Baseline ANRS GSS ≤ 1.0 (ITT Analysis Set)
Source: Clinical Study Report for Study 0321, Section 7, Figure 7-2
Tenofovir Statistical Review
18

Table 8: Primary Efficacy Endpoint - Subjects with a Baseline Stanford OBR GSS ≤ 1 or > 1 log10 copies/mL (ITT Analysis Set)
Time-Weighted Average Change in HIV-1 RNA (Log10 copies/mL) from Baseline through Week 24 (DAVG24)a, b, c
5-point GSS OBR
OBR GSS <= 1
Tenofovir DF Placebo
OBR GSS > 1
Tenofovir DF Placebo
DAVG Through Week 24
N 15 7 29 34 Mean (SD) –1.116
(1.1806) –0.393
(1.1682) –1.313
(1.0964) –1.542
(1.1824)
Median –1.206 0.036 –1.639 –1.723
Q1, Q3 –2.00, 0.07 –1.22, 0.81 –2.19, –0.60 –2.43, –0.72
Min, Max p-valued: Tenofovir DF vs. Placebo
–2.75, 0.89
0.26
–2.29, 0.88 –2.81, 0.71
0.40
–3.09, 0.77
3-point GSS OBR
DAVG Through Week 24
N 14 6 30 35 Mean (SD) –1.170
(1.2059) –0.281
(1.2383) –1.281
(1.0913) –1.529
(1.1677)
Median –1.381 0.063 –1.622 –1.682
Q1, Q3 –2.00, 0.07 –1.22, 0.81 –2.19, –0.36 –2.43, –0.72
Min, Max p-valued: Tenofovir DF vs. Placebo
–2.75, 0.89
0.23
–2.29, 0.88 –2.81, 0.71
0.37
–3.09, 0.77
Source: Clinical Study Report for Study 0321, Section 7, Table 7-3
The applicant further showed that there is no significant treatment difference between the two treatment groups with respect to the secondary efficacy endpoints at Week 48. There were antiretroviral activity of tenofovir for subjects with baseline ARNS and Stanford OBR GSS <= 1 as evident in the differences between the two treatment groups in the analyses of DAVG48 for this subgroup. Overall, there were decreases in plasma HIV-1 RNA in both treatment groups; the median time-weighted average change from baseline through week 48 (DAVG48) in plasma HIV-1 RNA was -1.423 log10 copies/mL and -1.352 log10 copies/mL in the tenofovir group (n =44) and placebo group (n=41) respectively (p = 0.40, Van Elteren test) Table 9. Subgroup analysis for OBR GSS <= 1 or > 1 were also performed but the comparisons were clinically meaningless given the small samples in the subgroups Table 10. In addition, the sponsor performed other analyses including change from baseline in Plasma HIV-1 RNA (Table 11) using (LOCF; ITT Analysis Set) as well as number and percentage of subjects with Plasma HIV-1 RNA < 50 and < 400 at weeks 24 and 48. The results are displayed in Table 12 and Table 13.
Tenofovir Statistical Review
19

(b) (4) (b) (4)
This result also indicates no significant differences in subjects with Plasma HIV-1 RNA < 50 and < 400 in the double blind phase.
The applicant also demonstrated that there is no significant difference between the treatment groups in time to virologic failure using the Kaplan-Meier estimates (Figure 3).
Table 9: Secondary Efficacy Endpoint at Week 48 (ITT Analysis Set)
Time-Weighted Average Change in HIV-1 RNA (log10 copies/mL) from Baseline through Week 48 (DAVG48)a, b, c
DAVG Through Week 48
Tenofovir DF (N = 44)
Placebo (N = 41) p-valued
N 44 41 0.40
Mean (SD) –1.276 (1.1894) –1.457 (1.2401)
Median –1.423 –1.352
Q1, Q3 –2.25, –0.25 –2.72, –0.53
Min, Max –3.14, 0.83 –3.14, 0.87 Source: Clinical Study Report for Study 0321, Section 7, Table 7-4 a DAVG through time X is the time weighted average between the first post-baseline value through the last value up to week X minus the baseline value. b HIV-1 RNA analyzed using Ultrasensitive assay (range 50 to 100,000 copies/mL); or as a reflex test. c HIV-1 RNA collected after first dose of open-label tenofovir DF or after last randomized dose date + 2 days (if terminated) for double-blind groups was excluded. d p-value is from a Van Elteren test stratified by baseline genotypic sensitivity score (GSS) (without tenofovir DF) <= or > median [median GSS is 2].
Table 10: Secondary Efficacy Endpoint - Subjects with a Baseline ANRS OBR GSS ≤ 1 or > 1 log10 copies/mL (ITT Analysis Set)
OBR GSS <= 1 Time-Weighted Average Change in HIV-1 RNA (Log10 copies/mL) from Baseline through Week 48 (DAVG48)a,
b, c Tenofovir DF (N = 18)
Placebo (N = 10)
DAVG Through Week 48
N 18 10
Mean (SD) –1.359 (1.1995)
–0.935 (1.3666)
Median –1.503 –0.933
Q1, Q3 –2.36, –0.62 –2.44, 0.07
Min, Max –2.90, 0.76 –2.82, 0.87 p-valued: Tenofovir DF vs. Placebo 0.49
Source: Clinical Study Report for Study 0321, Section 7, Table 7-5
OBR GSS > 1
Tenofovir DF (N = 26)
Placebo (N = 31)
26 31 –1.220
(1.2029) –1.625
(1.1705) –1.322 –1.576
–2.18, –0.08 –2.76, –0.72
–3.14, 0.83 –3.14, 0.68
0.17
20
Tenofovir Statistical Review

Table 11: Change from Baseline in Plasma HIV-1 RNA (log10 copies/mL) (LOCF; ITT Analysis Set)
Tenofovir DF Placebo HIV-1 RNA (log10 copies/mL)a, b, c (N = 44) (N = 41) p-valued
Baseline N 44 41 0.53 Mean (SD) 4.75 (0.675) 4.62 (0.657) Median 4.71 4.65 Q1, Q3 4.3, 5.3 4.3, 5.0 Min, Max 3.5, 6.4 3.2, 6.6
Change at Week 24 N 44 41 0.58
Mean (SD) –1.18 (1.337) –1.27 (1.475) Median –1.23 –1.27 Q1, Q3 –2.3, –0.1 –2.8, –0.1 Min, Max –3.6, 1.1 –3.4, 1.2
Change at Week 48 N 44 41 0.37 Mean (SD) –1.19 (1.451) –1.46 (1.460) Median –0.97 –1.53
Q1, Q3 –2.3, 0.0 –3.0, 0.0 Min, Max –4.6, 1.2 –3.4, 1.0
Source: Clinical Study Report for Study 0321, Section 7, Table 7-6
Tenofovir Statistical Review
21

(b) (4)
c (b) (4)
Table 12: Applicant’s Additional Results - Number and Percentage of Subjects with Plasma HIV-1 RNA < 400 copies/mL (M = F, LOCF, M = E; ITT Analysis Set)
Number (%) of Subjects with Plasma Tenofovir DF Placebo HIV-1 RNA < 400 copies/mLa, b, c (N = 44) (N = 41) p-valued Missing=Failure
Baseline 0/44 0/41
At Week 24 18/44 ( 40.9%) 17/41 ( 41.5%) 1.00
At Week 48 15/44 ( 34.1%) 18/41 ( 43.9%) 0.38
Last Observation Carried Forward
Baseline 0/44 0/41
At Week 24 18/44 ( 40.9%) 17/41 ( 41.5%) 1.00
At Week 48 15/44 ( 34.1%) 19/41 ( 46.3%) 0.28
Missing=Excluded
Baseline 0/44 0/41
At Week 24 18/42 ( 42.9%) 17/41 ( 41.5%) 1.00
At Week 48 15/28 ( 53.6%) 18/31 ( 58.1%) 0.80 Source: Clinical Study Report for Study 0321, Section 7, Table 7-10
a LOCF pulls forward the last available post-baseline value for analysis. If no prior post-baseline values are available the value is missing.
b HIV-1 RNA analyzed using Ultrasensitive assay (range 50 to 100,000 copies/mL); or as a reflex test. HIV-1 RNA collected after first dose of open-label tenofovir DF or after last randomized dose date + 2 days (if terminated) for double-blind groups was excluded.
d p-value is from a Fisher's exact test.
Tenofovir Statistical Review
22

(b) (4)
(b) (4)
Table 13 : Number and Percentage of Subjects with Plasma HIV-1 RNA < 50 copies/mL (M = F, LOCF, M = E; ITT Analysis Set)
Number (%) of Subjects with Plasma Tenofovir DF Placebo HIV-1 RNA < 50 copies/mL a, b, c (N = 44) (N = 41) p-valued
Missing=Failure
Baseline 0/44 0/41
At Week 24 9/44 ( 20.5%) 14/41 ( 34.1%) 0.22
At Week 48 12/44 ( 27.3%) 15/41 ( 36.6%) 0.48
Last Observation Carried Forward
Baseline 0/44 0/41
At Week 24 9/44 ( 20.5%) 14/41 ( 34.1%) 0.22
At Week 48 12/44 ( 27.3%) 16/41 ( 39.0%) 0.36
Missing=Excluded
Baseline 0/44 0/41
At Week 24 9/42 ( 21.4%) 14/41 ( 34.1%) 0.23
At Week 48 12/28 ( 42.9%) 15/31 ( 48.4%) 0.79 Source: Clinical Study Report for Study 0321, Section 7, Table 7-12
a LOCF pulls forward the last available post-baseline value for analysis. If no prior post-baseline values are available the value is missing.
b HIV-1 RNA analyzed using Ultrasensitive assay (range 50 to 100,000 copies/mL); or as a reflex test.
c HIV-1 RNA collected after first dose of open-label tenofovir DF or after last randomized dose date + 2 days (if terminated) for double-blind groups was excluded.
d p-value is from a Fisher's exact test.
Figure 4: Kaplan-Meier Plot of Time to Virologic Failure during the Double-Blind Treatment Period (ITT Analysis Set)
Tenofovir Statistical Review
23

Finally, the sponsor provided results on the proportion of subjects with plasma HIV-1 RNA below 50 copies/mL at Weeks 24 and 48 using the TLOVR and the snap shot algorithms. Similar computations were repeated for proportion below 400 copies/mL at Weeks 24 and 48. See tables below.
Table 14: TLOVR Treatment Outcome for HIV-1 RNA < 400 copies/mL Through Week 24 (ITT Analysis Set)
Tenofovir DF Placebo (N= 44) (N = 41) p-value Prop Diff (95% CI)
Responder 18 (40.9%) 18 (43.9%) 0.76 Non-Responder 26 (59.1%) 23 (56.1%) -2.9% (-23.8%, 17.9%)
Virologic Failure 24 (54.5%) 22 (53.7%) Rebound 4 (9.1%) 4 (9.8%) Never suppressed through 16 (36.4%) 15 (36.6%) Week 24 Unblinded for virologic 4 (9.0%) 3 (7.3%) Failure
Reasons for Discontinuation Death 0 0 Adverse experiences 1 (2.3%) 0 Other 1 (2.3%) 1 (2.4%)
Investigator’s Discretion 0 1 (2.4%) Safety, Tolerability or 1 (2.3%) 0
Efficacy Reasons The p-value is from the CMH test stratified by baseline GSS (w/out TDF) <= or > median [median GSS is 2]. The difference and 95% confidence interval are stratum weighted by baseline GSS (w/out TDF) <= or > median [median GSS is 2] using normal approximation
Tenofovir Statistical Review
24

Table 15: TLOVR Treatment Outcome for HIV-1 RNA < 400 copies/mL Through Week 48 (ITT Analysis Set)
Tenofovir DF Placebo (N= 44) (N = 41) p-value Prop Diff (95% CI)
Responder 18 (40.9%) 20 (48.8%) 0.46 Non-Responder 26 (59.1%) 21 (51.2%) -8.0% (-29.0%, 13.0%)
Virologic Failure 25 (50.0%) 19 (46.3%) Rebound 5 (11.4%) 4 (9.8%) Never suppressed through 5 (11.4%) 5 (12.2%) Week 48 Unblinded for virologic 12 (27.3%) 10 (24.4%) Failure
Reasons for Discontinuation Death 0 0 Adverse experiences 1 (2.3%) 0 Other 3 (6.8%) 2 (4.9%)
Investigator’s Discretion 2 (4.5%) 2 (4.9%) Safety, Tolerability or 1 (2.3%) 0
Efficacy Reasons The p-value is from the CMH test stratified by baseline GSS (w/out TDF) <= or > median [median GSS is 2]. The difference and 95% confidence interval are stratum weighted by baseline GSS (w/out TDF) <= or > median [median GSS is 2] using normal approximation. If there are more than one event at the earliest time of failure, the order for classification is death, virologic failure, AE, and then other reasons. HIV-1 RNA collected after first dose of OL TDF or after last randomized dose date + 2 days (if terminated) for DB groups was excluded.
Tenofovir Statistical Review
25

Table 16: TLOVR Treatment Outcome for HIV-1 RNA < 50 copies/mL Through Week 24 (ITT Analysis Set)
Tenofovir DF Placebo (N= 44) (N = 41) p-value Prop Diff (95% CI)
Responder 10 (22.7%) 13 (31.7%) 0.36 Non-Responder 34 (77.3%) 28 (68.3%) -9.0% (-27.8%, 9.8%)
Virologic Failure 32 (72.7%) 27 (65.9%) Rebound 0 0 Never suppressed through 28(63.6%) 24 (58.5%) Week 24 Unblinded for virologic 4 (9.1%) 3 (7.3%) Failure
Reasons for Discontinuation Death 0 0 Adverse experiences 1 (2.3%) 0 Other 1 (2.3%) 1 (2.4%)
Investigator’s Discretion 0 1 (2.4%) Safety, Tolerability or 1 (2.3%) 0
Efficacy Reasons The p-value is from the CMH test stratified by baseline GSS (w/out TDF) <= or > median [median GSS is 2]. The difference and 95% confidence interval are stratum weighted by baseline GSS (w/out TDF) <= or > median [median GSS is 2] using normal approximation. If there are more than one event at the earliest time of failure, the order for classification is death, virologic failure, AE, and then other reasons. HIV-1 RNA collected after first dose of OL TDF or after last randomized dose date + 2 days (if terminated) for DB groups was excluded.
Tenofovir Statistical Review
26
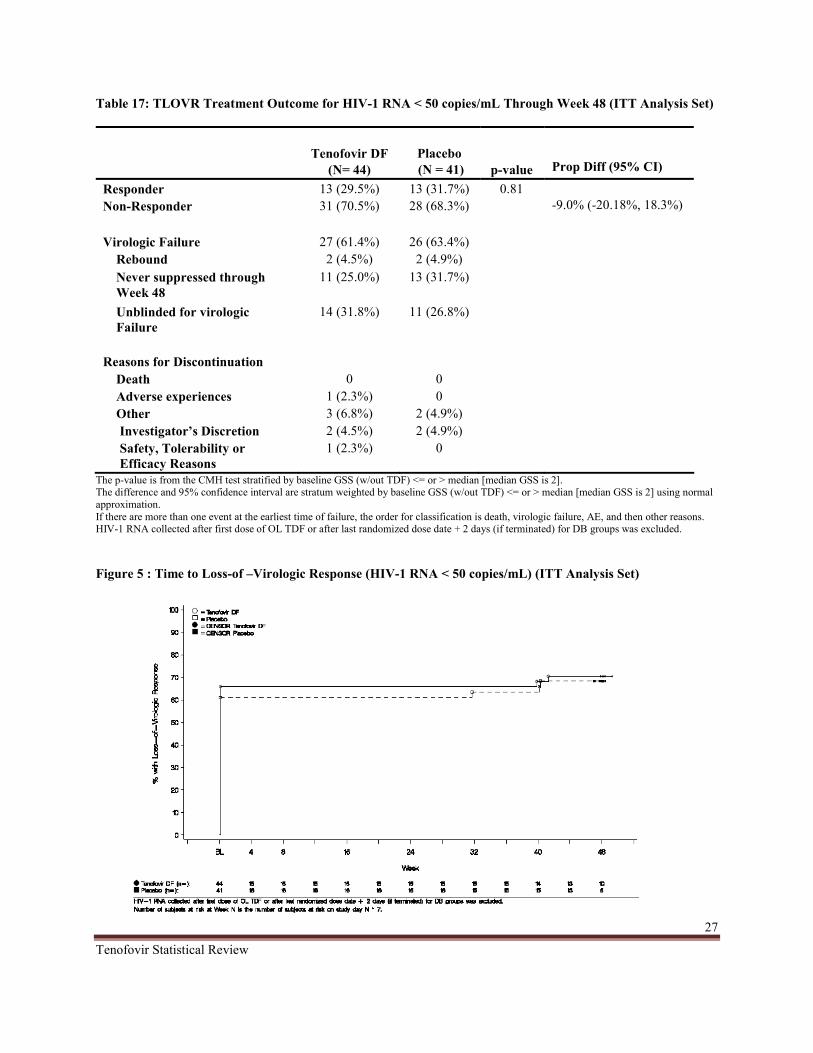
Table 17: TLOVR Treatment Outcome for HIV-1 RNA < 50 copies/mL Through Week 48 (ITT Analysis Set)
Tenofovir DF Placebo (N= 44) (N = 41) p-value Prop Diff (95% CI)
Responder 13 (29.5%) 13 (31.7%) 0.81 Non-Responder 31 (70.5%) 28 (68.3%) -9.0% (-20.18%, 18.3%)
Virologic Failure 27 (61.4%) 26 (63.4%) Rebound 2 (4.5%) 2 (4.9%) Never suppressed through 11 (25.0%) 13 (31.7%) Week 48 Unblinded for virologic 14 (31.8%) 11 (26.8%) Failure
Reasons for Discontinuation Death 0 0 Adverse experiences 1 (2.3%) 0 Other 3 (6.8%) 2 (4.9%)
Investigator’s Discretion 2 (4.5%) 2 (4.9%) Safety, Tolerability or 1 (2.3%) 0
Efficacy Reasons The p-value is from the CMH test stratified by baseline GSS (w/out TDF) <= or > median [median GSS is 2]. The difference and 95% confidence interval are stratum weighted by baseline GSS (w/out TDF) <= or > median [median GSS is 2] using normal approximation. If there are more than one event at the earliest time of failure, the order for classification is death, virologic failure, AE, and then other reasons. HIV-1 RNA collected after first dose of OL TDF or after last randomized dose date + 2 days (if terminated) for DB groups was excluded.
Figure 5 : Time to Loss-of –Virologic Response (HIV-1 RNA < 50 copies/mL) (ITT Analysis Set)
Tenofovir Statistical Review
27

Tenofovir demonstrated similar clinically decreases in Plasma HIV-1 RNA levels over time compared with placebo with respect to the proportion of subjects with HIV-1 RNA below 50 copies/mL. Similar results were observed in the proportion of subjects with HIV-1 RNA below 400 copies/mL. (Figure 3 and Figure 4).
Based on the primary and secondary efficacy analyses, the sponsor concluded that tenofovir was not statistically different to placebo but attributed it to the no or non active OBR at baseline in the tenofovir group.
3.1.7 Reviewer’s Comments
The choice of an endpoint in a study is very important since different endpoints may correspond to different objectives. Also statistical methods used in data analysis are driven by the choice of the virologic endpoint. The use of endpoints such as DAVG should not be encourage since there are no well laid down methods to handle subjects who dropped out prior to the specified post baseline time point. Given the discontinuation rate of this study (31/87, 35.6%), more than a third of the randomized and treated subjects, it would be more appropriate to use an endpoint such as median change from baseline to a specified follow up time and proportion for a pre-specified threshold HIV-RNA levels at pre-specified follow up time points.
Snapshot analyses were performed by adopting the principles outlined in the agencies guidelines. The snap shot approach classified subjects as responders or non-responders based on the HIV RNA level at Weeks 24 and 48. If the subjects discontinued the study treatment before Weeks 24 or 48 or did not have the HIV RNA value at Week 48 were considered as non-responders in the snap shot analysis. The slight difference in the snap shot and Time-to-loss-of-virologic-response (TLOVR) results was mostly due to different classifications for subjects who rebounded and then re-suppressed, or subjects who had a temporary blip in viral load. This however, did not change the conclusion that both the proportion of subjects with HIV RNA below 50 copies/mL and the proportion of subjects with HIV RNA below 400 copies/mL in the placebo group were slightly higher than those in the tenofovir group at both weeks 24 and 48. Please see Table 18 through Table 21.
Additional exploratory analyses to evaluate the sponsor’s conclusion were performed, thus tenofovir failure to show statistically significant difference compared to placebo was due to non active OBR at baseline. First, the number and percentage of subjects with HIV-1 RNA levels below 50 copies/mL at weeks 24 and 48 with respect to their baseline susceptibility to tenofeovir were determined. This was also repeated for HIV-1 RNA levels below 400 copies/mL at weeks 24 and 48. The baseline tenofovir susceptibility was 60.98% in the placebo group and 43.18% in the tenofovir group. Subjects with a baseline tenofovir GSS was categorized as resistance for scores < 1 and susceptible when score = 1. A summary of the results are displayed in Table 22 and Table 23. Subjects with baseline tenofovir resistance in the placebo group had a higher virologic response (i.e. HIV-1 RNA < 50) at both weeks 24 and 48 compared to those in tenofovir group. This result was no different for virologic response (i.e. HIV-1 RNA < 400) at
Tenofovir Statistical Review
28

both weeks 24 and 48. However, the samples were small so all p-values should be used for only reference purposes (Fisher’s Exact test). Similar analysis was conducted for the primary endpoint DAVG using this subgroup (resistance, GSS < 1 and susceptible, GSS =1 to baseline tenofovir). Table 23 shows that subjects randomized to the placebo group that were resistant to baseline tenofovir had a higher time-weighted change from baseline to week 24 in plasma HIV-1 RNA. The median change was -1.604 log10 copies/mL in the tenofovir group and -2.259 log10 copies/mL in the placebo group. This together with the previous results on proportions indicates that subjects in the placebo group in this subgroup had a better response at week 24. To further investigate this assertion, similar analysis for subjects with GSS ≤ 1 using RNA levels less than 50 and 400 copies at weeks 24 and 48 as the endpoint were carried out. Results of these analyses are reported in Tables 24 and Table 25. In this exploratory analysis, tenofovir subgroup (50.0%) with GSS ≤ 1 who achieved RNA copies < 400 at week 24 were higher compared to the placebo subgroup (40.0%). This result was consistent with the primary endpoint (DAVG) for this subgroup. However, at week 48 there was no difference in virologic outcome thus 38.9% and 40.0% in the tenofovir and placebo groups respectively. Based on RNA copies < 50 at week 24, the placebo subjects rather had a higher virologic response (40.0%) compared to 16.7% in the tenofovir group. At week 48 there was virtually no difference in virologic response between the tenofovir subgroup (33.3%) and the placebo subgroup (30.0%). These inconsistent results suggest that the sponsor’s assertion may not necessarily be the case.
Additional analysis to explore the relationship between the genotypic sensitivity score at the baseline and virologic response (plasma HIV-1 RNA, < 400 and < 50) at week 24 and 48 were performed. Figure 5 and Figure 6 shows that the subjects within the GSS categories are evenly distributed across treatment groups with respect to the primary endpoint. Logistic regression was used to evaluate the relationship between the baseline GSS (ANRS GSS ≤ 1 (yes=1, no=0), Treatment (TDF) (yes=1, no=0) and the response Plasma HIV-1 RNA, < 400 and < 50 (yes=1, no=0). The results are displayed in Table 25 and Table 26. The results shows that the odds of having Plasma HIV-1 RNA,< 400 and < 50 given that the patient had ANRS GSS ≤ 1 at baseline is almost the same across treatment groups. Thus a patient in the tenofovir group in comparison to the placebo group with ANRS GSS ≤ 1 at baseline is 0.95 times less likely to achieve plasma HIV-1 RNA < 400 at week 24.
Table 18 : Virologic Outcome for HIV-1 RNA < 400 copies/mL at Week 24 (ITT Analysis Set)
Tenofovir DF Placebo (N= 44) (N = 41)
Virologic Success HIV RNA < 400 copies/mL. 18 (40.91%) 17 (41.46%) Virologic Failure 25 (56.82%) 24 (58.54%) No Virologic Data at Week 24 Window
Reasons Discontinued study due to AE or Death* 1 (2.27%) 0 Discontinued study for Other Reasons** 0 0 Missing data during window but on study 0 0
*Includes subjects who discontinued due to AE or Death at any time point from Day 1 through the time window if this resulted in no virologic data on treatment during the specified window. **Other includes: withdrew consent, loss to follow-up, moved etc.
Tenofovir Statistical Review
29

Table 19: Virologic Outcome for HIV-1 RNA < 400 copies/mL at Week 48 (ITT Analysis Set)
Tenofovir DF Placebo (N= 44) (N = 41)
Virologic Success HIV RNA < 400 15 (34.09%) 19 (46.34%) copies/mL. Virologic Failure 27 (61.36%) 21 (51.22%) No Virologic Data at Week 48 Window
Reasons Discontinued study due to AE or Death* 1 (2.27%) 0 Discontinued study for Other Reasons** 1 (2.27%) 1 (2.44%) Missing data during window but on study 0 0
*Includes subjects who discontinued due to AE or Death at any time point from Day 1 through the time window if this resulted in no virologic data on treatment during the specified window. **Other includes: withdrew consent, loss to follow-up, moved etc.
Table 20 : Virologic Outcome for HIV-1 RNA < 50 copies/mL at Week 24 (ITT Analysis Set)
Tenofovir DF Placebo (N= 44) (N = 41)
Virologic Success HIV RNA < 50 copies/mL 9 (20.45%) 14 (34.15%) Virologic Failure 34 (77.27%) 27 (65.85%) No Virologic Data at Week 24 Window
Reasons Discontinued study due to AE or Death* 1 (2.27%) 0 Discontinued study for Other Reasons** 0 0 Missing data during window but on study 0 0
*Includes subjects who discontinued due to AE or Death at any time point from Day 1 through the time window if this resulted in no virologic data on treatment during the specified window. **Other includes: withdrew consent, loss to follow-up, moved etc.
Table 21: Virologic Outcome for HIV-1 RNA < 50 copies/mL at Week 48 (ITT Analysis Set)
Tenofovir DF Placebo (N= 44) (N = 41)
Virologic Success HIV RNA < 50 copies/mL 12 (27.27%) 16 (39.02%) Virologic Failure 30 (68.18%) 24 (58.54%) No Virologic Data at Week 48 Window
Reasons Discontinued study due to AE or Death* 1 (2.27%) 0 Discontinued study for Other Reasons** 1 (2.27%) 1 (2.44%) Missing data during window but on study 0 0
*Includes subjects who discontinued due to AE or Death at any time point from Day 1 through the time window if this resulted in no virologic data on treatment during the specified window. **Other includes: withdrew consent, loss to follow-up, moved etc.
Tenofovir Statistical Review
30

Table 22: Number and Percentage of Subjects with Plasma HIV-1 RNA < 400 copies/mL and Baseline TDF GSS < 1 or = 1 (M=F; ITT set)
Resistance, GSS < 1 Susceptible, GSS = 1
Tenofovir DF Placebo Tenofovir DF Placebo (N = 25) (N = 16) (N = 19) (N = 25)
At Week 24 12/25 (48.0%) 11/16 (68.8%) 6/19 (31.6%) 6/25 (24.0%)
p-value 0.22 0.74
At Week 24 9/25 (36.0%) 11/16 (68.8%) 6/19 (31.6%) 7/25 (28.0%) p-value 0.06 1.00 p-value is from Fisher's exact test
Table 23: Number and Percentage of Subjects with Plasma HIV-1 RNA < 50 copies/mL and Baseline TDF GSS < 1 or = 1 (M=F; ITT set)
Resistance, GSS < 1 Susceptible, GSS = 1
Tenofovir DF Placebo Tenofovir DF Placebo (N = 25) (N = 16) (N = 19) (N = 25)
At Week 24 6/25 (24.0%) 10/16 (62.5%) 6/19 (31.6%) 6/25 (24.0%)
p-value 0.02 1.00
At Week 24 7/25 (28.0%) 10/16 (62.5%) 5/19 (26.3%) 5/25 (20.0%) p-value 0.05 0.72
p-value is from Fisher's exact test
Table 24: Number and Percentage of Subjects with Plasma HIV-1 RNA < 400 copies/mL and Baseline ANRS OBR GSS ≤ 1 or > 1 (M=F; ITT set)
OBR GSS ≤ 1 OBR GSS > 1
Tenofovir DF (N = 18)
Placebo (N = 10)
Tenofovir DF (N = 26)
Placebo (N = 31)
At Week 24 9/18 (50.0%) 4/10 (40.0%) 9/26(34.6%) 13/31 (41.9%)
p-value 0.71 1.00
At Week 48 p-value
7/18 (38.9%)
1.00
4/10 (40.0%) 8/26 (30.8%)
0.29
14/31 (45.2%)
p-value is from Fisher's exact test
Tenofovir Statistical Review
31

Table 25: Number and Percentage of Subjects with Plasma HIV-1 RNA < 50 copies/mL and Baseline ANRS OBR GSS ≤ 1 or > 1 (M=F; ITT set)
OBR GSS ≤ 1 OBR GSS > 1
Tenofovir DF (N = 18)
Placebo (N = 10)
Tenofovir DF (N = 26)
Placebo (N = 31)
At Week 24 3/18 (16.7%) 4/10 (40.0%) 6/26(23.1%) 10/31 (32.3%)
p-value 0.21 0.55
At Week 48 p-value
6/18 (33.3%)
1.00
3/10 (30.0%) 6/26 (23.1%)
0.26
12/31 (38.71%)
Table 26: Time-Weighted change from Baseline to Week 24 in Plasma HIV-1 RNA and Baseline Background TDF GSS < 1 or = 1 (ITT set)
(DAVG24) Resistance GSS < 1
Tenofovir DF Placebo
Susceptible GSS = 1
Tenofovir DF Placebo
DAVG Through Week 24
N 25 16 19 25
Mean (SD)
Median
-1.356(1.1021)
-1.604
-1.773 (1.198)
-2.259
-1.100 (1.243)
-1.211
-1.0724(1.219)
-1.062
Q1, Q3 Min, Max
-2.003, -0.758
-2.806, 0.886
-2.259, -1.177
-3.067, -0.878
-2.418, 0.0625
-2.626, 0.713
-2.077, -0.077
-3.091, 0.809
Tenofovir Statistical Review
32

Figure 6 : Distribution of DAVG24 within ARNS OBR GSS
Figure 7 : Distribution of DAVG24 within Stanford OBR GSS
Tenofovir Statistical Review
33

Table 27: Baseline GSS and Week 24 virologic response (HIV-1 RNA levels < 400 Copies/mL) (M=F; ITT set)
Model Variables in model OR(95% CI) P-values
1 ANRS GSS ≤1
ANRS GSS ≤ 1 2 Treatment (TDF)
ANRS GSS≤ 1 3 Treatment (TDF)
ANRS GSS*Treatment
0.73 (0.29, 1.82)
0.72 (0.28, 1.81) 1.08 (0.45, 2.63)
0.75 (0.25, 2.20) 1.18 (0.17, 8.08) 0.95 (0.43, 2.02)
0.49
0.48 0.86
0.59 1.00 0.92
Table 28 : Baseline GSS and Week 24 virologic response (HIV-1 RNA levels < 50 Copies/mL) (M=F; ITT set)
Model Variables in model OR(95% CI) P-values
1 ANRS GSS ≤1 1.17 (0.42, 3.30) 0.76
2 ANRS GSS ≤ 1 Treatment (TDF) 1.03 (0.36, 2.97)
2.01 (0.75, 5.41) 0.96 0.17
3
ANRS GSS≤ 1 Treatment (TDF) ANRS GSS*Treatment
1.21 (0.34, 4.60) 2.66(0.33, 22.53) 0.84 (0.36, 1.91)
0.77 0.49 0.74
Evaluation of Safety
Safety evaluations were carried out by means of either complete physical examinations or symptom-directed. Other serial laboratory testing such as hematology, chemistry and urinalysis assessment were also conducted at every visit. Bone density tests were also conducted by means of bone biochemical makers at baseline, weeks 4, 16, 24, 32, 48 and every 24 week interval in the open label extension period. In addition, dual energy x –ray absorptiometry (DEXA) scans of the lumbar spine as well as the whole body were carried out at baseline, week 24, 48 and every 48 weeks thereafter in the extension period. When reviewing the label, bone effects for the adolescent subjects were similar to the effects observed in the adult subjects. To properly assess the bone effects and the body as a whole, future studies should be design and powered for an endpoint such as loss in lumbar spine, skeletal growth and rate of bone loss/gain.
4. FINDINGS IN SPECIAL/SUBGROUP POPULATIONS
Tenofovir Statistical Review
34

Subgroup analyses for the primary efficacy endpoint with respective to patient demographic and baseline GSS stratification were performed. Tables 29 and 30 summarize FDA’s subgroup analyses. The differences in median changes from baseline for all subgroup analysis were computed by subtracting the median change from baseline in the placebo group from the median change from baseline in the tenofovir group. The subgroup analyses for subjects with ANRS OBR GSS ≤ 1 showed a difference in median change larger than 0.5 log10 copies from baseline between tenofovir and the placebo groups (-1.658 copies in the tenofovir group [n=18]and -1.140 in the placebo group [n=10]). This difference considered clinically relevant in favor of the tenofovir group, was not statistically significant. For subjects with ANRS OBR GSS >1 the difference in median change was 0.211 log10 copies in favor of the placebo group (-1.471 copies in the tenofovir group [n=26] and -1.682 in the placebo group [n=31]). Note that the sample sizes in these subgroups were not big enough to make any definitive conclusions.
(1) Results analysis using the proportion of subjects with HIV-1 RNA copies less than 50 as endpoint at week 24 shows that, among males (3/20, 15.0%) achieved HIV-1 RNA concentration in the tenofovir group compared to (6/17, 35.29%) in the placebo group. Among females there were (6/24, 25.0%) in the tenofovir group compared to (8/24, 33.33%) in the placebo group. Furthermore, a similar analysis for these subgroups were conducted base on the baseline stratification of OBR GSS score of ≤ 1 and OBR GSS >1. Results indicates that among males subjects with GSS ≤ 1 the response was (1/9, 11.1%) in the tenofovir group compared to (2/7, 28.6%) in the placebo group. In the GSS >1 subgroup, the response was (2/11, 18.2%) compared to (4/10, 40%) in the placebo group. In the case of females within the GSS score of ≤ 1 subgroup, there were (2/9, 22.2%) in the tenofovir group and (2/3, 66.7%) in the placebo group. On the other hand, there was virtually no diference in the GSS>1 subgroup. The response were (4/15, 26.7%) in the tenofovir group and (6/21, 28.6%) in the placebo group.
(2) With regards to blacks there were (4/13, 30.77%) in the tenofovir group compared to (3/11, 27.27%) in the placebo group who achieved HIV-1 RNA concentrations less than 50 copies at week 24. Among whites, subjects with copies less than 50 were (5/23, 21.74%) and (9/21, 42.86%) in the tenofovir and placebo groups respectively. In the other race, there was none in the tenofovir group whereas only 2 subjects in the placebo group had copies less than 50. For blacks with GSS score of ≤ 1, one patient in each treatment group achieved RNA copies < 50 (1/3, 33.3%) and (1/6, 16.7%) in the placebo and tenofovir groups respectively. For blacks within the GSS >1 subgroup the response were (2/8, 25.0%) in the placebo group and (3/7, 42.9%) in the tenofovir group. In the case of white subjects in the GSS ≤ 1 subgroup, there were (3/6, 50.0%) in the placebo group compared to (2/8 ,25.0%) in the tenofovir group. For those in the GSS >1 subgroup there were (6/15, 40.0%) in the placebo group compared to (3/15, 20.0%) in the tenofovir group. Only 2 subjects in the other race with GSS>1 within the tenofovir group had RNA copies less than 50.
Tenofovir Statistical Review
35

Table 29: Subgroup Analysis for Primary Efficacy Endpoint - Subjects with a Baseline ARNS OBR GSS ≤ 1 or > 1 log10 copies/mL (ITT Analysis Set)
Time-Weighted Average Change in OBR GSS <= 1 OBR GSS > 1 HIV-1 RNA (Log10 copies/mL) from Baseline through Week 24 (DAVG24)a, b, c
Tenofovir DF Placebo Tenofovir DF Placebo
Gender Female DAVG Through Week 24 N 9 3 15 21
Mean (SD) -1.394(1.126) -1.592 (0.594) -1.309(1.176) -1.465(1.275) Median -1.775 -1.482 -1.605 -1.576 Q1, Q3 -1.912, -0.76 -2.23, -1.06 -2.43, -0.59 -2.48, -0.48 Min, Max -2.58, 0.61 -2.23, -1.06 -2.81, 0.71 -3.09, 0.77 Male DAVG Through Week 24 N 9 7 11 10
Mean (SD) -1.221(1.116) -0.586(1.388) -1.057(1.158) -1.554(1.165) Median -1.206 0.036 -1.211 -1.879 Q1, Q3 -2.004, -0.824 -2.285, 0.809 -2.188, -0.084 –2.363, -0.794
Min, Max -2.746, 0.609 -2.414, 0.878 -2.413, 0.886 -2.836, 0.727 Race White DAVG Through Week 24 N 8 6 15 15
Mean (SD) -1.343 ( 1.048) -1.045 ( 1.311) -1.083 ( 1.259) -1.689 ( 1.221)
Median -1.491 -1.272 -1.337 -2.077
Q1, Q3 -2.232, -0.423 -2.285, 0.0907 -2.189, 0.479 -2.930, -0.487
Min, Max -2.569, 0.111 -2.414, 0.878 -2.626, 0.886 -3.091, 0.678 Black DAVG Through Week 24 N 6 3 7 8
Mean (SD) -1.345(1.127) -0.463 (1.582) -1.847 ( 0.765) -1.679 (0.684)
Median -1.718 0.036 -1.926 -1.563 Q1, Q3 -1.912, -0.758 -2.234, 0.809 -2.434, -1.211 -2.331, -1.059 Min, Max -2.581, 0.613 -2.234, 0.809 -2.807, -0.595 -2.659, -0.871 Other DAVG Through Week 24 N 4 1 4 8
Mean (SD) -1.180(1.427 ) -1.217 -0.5246113 0.9189009
-0.9423375 1.5768854
Median -1.292 -1.217 -0.133 -0.399 Q1, Q3 -2.253, -0.108 -1.038, -0.011 -2.658, 0.375 Min, Max -2.746, 0.609 -1.895, 0.062 -2.943, 0.771
Tenofovir Statistical Review
36

Table 30: Number and Percentage of Subjects with Plasma HIV-1 RNA < 50 copies/mL in Subjects with a Baseline ANRS OBR GSS ≤ 1 or > 1 (M=F; ITT set)
OBR GSS <= 1 OBR GSS > 1 Tenofovir DF Placebo Tenofovir DF Placebo
Gender Female 9 3 15 21
At Week 24 2/9 (22.2%) 2/3 (66.7%) 4/15 (26.7%) 6/21 (28.6%) p-value 0.23 1.00
Male 9 7 11 10 At Week 24 1/9 (11.1%) 2/7 (28.6%) 2/11 (18.2%) 4/10 (40%) p-value 0.55 0.36
Race White 8 6 15 15
At Week 24 2/8 (25.0%) 3/6 (50.0%) 3/15 (20.0%) 6/15 (40.0%) p-value 0.58 0.42
Black 6 3 7 8 At Week 24 1/6 (16.7%) 1/3 (33.3%) 3/7 (42.9%) 2/8 (25.0%) p-value 1.00 0.61
Other 1 4 8 4 At Week 24 0 0 2/8 (25.0%) 0 p-value
5. SUMMARY AND CONCLUSIONS
5.1 Statistical Issues and Collective Evidence
The choice of an endpoint in a study is very important since different endpoints may correspond to different objectives. Also statistical methods used in data analysis are driven by the choice of the virologic endpoint. The use of endpoints such as DAVG should not be encourage since there are no well laid down methods to handle subjects who drop out prior to the specified post baseline time point. Given the discontinuation rate of this study (31/87, 35.6%), more than a third of the randomized and treated subjects, it would be more appropriate to use an endpoint such as median change from baseline to a specified follow up time and proportion for a pre-specified threshold HIV-RNA levels at pre-specified follow up time points. On the stratification factor, it would be more convincing to pre-specify all possible cut-points and then randomized subjects with respect to these cut-points. The stratification employed in this particular study may not be appropriate since different cut-points leads to different conclusions.
The results of the study show that both treatment groups demonstrated decrease from baseline in plasma HIV-1 RNA that was clinically relevant. However these results were not statistically significant using the Van Elteren test (p = 0.55). The median DAVG24 were -1.580 log10 copies/mL and -1.549 log10 copies/mL in the tenofovir group (n =44) and placebo group (n=41) respectively. This result is also reflected in Figure 2. Similar analyses were also carried out for
Tenofovir Statistical Review
37

the subgroup of subjects stratified by their baseline OBR GSS (≤ 1 or > 1) in accordance with both ARNS and the Stanford scales. For the ARNS, subjects with OBR GSS ≤ 1 who received tenofovir had a median change of -1.658 log10 copies/mL (n=18) compared to a median change of -1.140 log10 copies/mL (n=10) for those who received placebo. This result was no different from the more robust Stanford scales post hoc analysis. The median changes in HIV-1 RNA from baseline to week 24 for the tenofovir group and the placebo group were respectively -1.206 log10 copies/mL (n=15) and 0.036 log10 copies/mL (n=7) using the 5-point scale. For the 3-point scale, the median change was -1.381 log10 copies/mL (n=14) for the tenofovir group and 0.063 log10 copies/mL (n=6) for the placebo group.
(1) Results analysis using the proportion of subjects with HIV-1 RNA copies less than 50 as endpoint at week 24 shows that, among males (3/20, 15.0%) achieved HIV-1 RNA concentration in the tenofovir group compared to (6/17, 35.29%) in the placebo group. Among females there were (6/24, 25.0%) in the tenofovir group compared to (8/24, 33.33%) in the placebo group. Furthermore, a similar analysis for these subgroups were conducted base on the baseline stratification of OBR GSS score of ≤ 1 and OBR GSS >1. Results indicates that among males subjects with GSS ≤ 1 the response was (1/9, 11.1%) in the tenofovir group compared to (2/7, 28.6%) in the placebo group. In the GSS >1 subgroup, the response was (2/11, 18.2%) compared to (4/10, 40%) in the placebo group. In the case of females within the GSS score of ≤ 1 subgroup, there were (2/9, 22.2%) in the tenofovir group and (2/3, 66.7%) in the placebo group. On the other hand, there was virtually no diference in the GSS>1 subgroup. The response were (4/15, 26.7%) in the tenofovir group and (6/21, 28.6%) in the placebo group.
(2) With regards to blacks there were (4/13, 30.77%) in the tenofovir group compared to (3/11, 27.27%) in the placebo group who achieved HIV-1 RNA concentrations less than 50 copies at week 24. Among whites, subjects with copies less than 50 were (5/23, 21.74%) and (9/21, 42.86%) in the tenofovir and placebo groups respectively. In the other race, there was none in the tenofovir group whereas only 2 subjects in the placebo group had copies less than 50. For blacks with GSS score of ≤ 1, one patient in each treatment group achieved RNA copies < 50 (1/3, 33.3%) and (1/6, 16.7%) in the placebo and tenofovir groups respectively. For blacks within the GSS >1 subgroup the response were (2/8, 25.0%) in the placebo group and (3/7, 42.9%) in the tenofovir group. In the case of white subjects in the GSS ≤ 1 subgroup, there were (3/6, 50.0%) in the placebo group compared to (2/8 ,25.0%) in the tenofovir group. For those in the GSS >1 subgroup there were (6/15, 40.0%) in the placebo group compared to (3/15, 20.0%) in the tenofovir group. Only 2 subjects in the other race with GSS>1 within the tenofovir group had RNA copies less than 50.
5.2 Conclusions and Recommendations
After reviewing the efficacy results based on the 48 week data from Study 0321 in HIV-1 subjects, the statistical reviewer concluded that there were no treatment differences in efficacy at weeks 24 and 48 between the subjects who took tenofovir 300 mg once daily and those who took placebo.
Tenofovir Statistical Review
38

-------------------- -------------------- -------------------- ------------------------------------------
---------------------------------------------------------------------------------------------------------
---------------------------------------------------------------------------------------------------------
----------------------------------------------------
Application Submission Submitter Name Product NameType/Number Type/Number
NDA-21356 ORIG-1 GILEAD SCIENCES VIREAD(TENOFOVIR INC DISOPROXIL FUMARATE)300
This is a representation of an electronic record that was signed electronically and this page is the manifestation of the electronic signature.
/s/
ERIC Y FRIMPONG 03/24/2010
GUOXING SOON 03/24/2010
Carol H ROCHESTER 03/25/2010