Embed Size (px)
Citation preview
This article was downloaded by: [INASP - Pakistan (PERI)]On: 27 March 2014, At: 02:54Publisher: RoutledgeInforma Ltd Registered in England and Wales Registered Number: 1072954 Registeredoffice: Mortimer House, 37-41 Mortimer Street, London W1T 3JH, UK
International Journal of ScienceEducationPublication details, including instructions for authors andsubscription information:http://www.tandfonline.com/loi/tsed20
Upper Secondary Bruneian ScienceStudents’ Perceptions of AssessmentHarkirat S. Dhindsa a , Khalid Omar b & Bruce Waldrip ca Universiti Brunei Darussalam , Bruneib Ministry of Education , Bruneic University of Southern Queensland , AustraliaPublished online: 22 Jun 2007.
To cite this article: Harkirat S. Dhindsa , Khalid Omar & Bruce Waldrip (2007) Upper SecondaryBruneian Science Students’ Perceptions of Assessment, International Journal of Science Education,29:10, 1261-1280, DOI: 10.1080/09500690600991149
To link to this article: http://dx.doi.org/10.1080/09500690600991149
PLEASE SCROLL DOWN FOR ARTICLE
Taylor & Francis makes every effort to ensure the accuracy of all the information (the“Content”) contained in the publications on our platform. However, Taylor & Francis,our agents, and our licensors make no representations or warranties whatsoever as tothe accuracy, completeness, or suitability for any purpose of the Content. Any opinionsand views expressed in this publication are the opinions and views of the authors,and are not the views of or endorsed by Taylor & Francis. The accuracy of the Contentshould not be relied upon and should be independently verified with primary sourcesof information. Taylor and Francis shall not be liable for any losses, actions, claims,proceedings, demands, costs, expenses, damages, and other liabilities whatsoeveror howsoever caused arising directly or indirectly in connection with, in relation to orarising out of the use of the Content.
This article may be used for research, teaching, and private study purposes. Anysubstantial or systematic reproduction, redistribution, reselling, loan, sub-licensing,systematic supply, or distribution in any form to anyone is expressly forbidden. Terms &Conditions of access and use can be found at http://www.tandfonline.com/page/terms-and-conditions
International Journal of Science EducationVol. 29, No. 10, 6 August 2007, pp. 1261–1280
ISSN 0950-0693 (print)/ISSN 1464-5289 (online)/07/101261–20© 2007 Taylor & Francis DOI: 10.1080/09500690600991149
RESEARCH REPORT
Upper Secondary Bruneian Science Students’ Perceptions of Assessment
Harkirat S. Dhindsaa*, Khalid Omarb and Bruce WaldripcaUniversiti Brunei Darussalam, Brunei; bMinistry of Education, Brunei; cUniversity of Southern Queensland, AustraliaTaylor and Francis LtdTSED_A_199015.sgm10.1080/09500690600991149International Journal of Science Education0950-0693 (print)/1464-5289 (online)Original Article2006Taylor & [email protected]
The aims of this study were to evaluate reliability and validity of the Students’ Perception ofAssessment Questionnaire (SPAQ), to evaluate students’ perception on assessment, and toevaluate gender-based, grade-based, and ethnicity-based differences in students’ perceptions. Thevalidity and reliability coefficients revealed that the SPAQ was suitable for assessing students’perceptions on five assessment dimensions. The average scale-item mean values for all the scaleswere less than 3.0, which indicates a need to address these dimensions of assessment at classroomlevel. The mean value for Student Consultation scale was 1.96 out of 4, indicating a need forspecial attention in this area. The perceptions of students grouped on the basis of gender and ofgrade level groups were comparable, but on the basis of ethnic groups were statistically signifi-cantly different. Assuming these differences to be real, does it mean that teaching approaches willneed to be addressed? Future research in this area is warranted.
Introduction
Assessment is one aspect of education about which everyone seems to have an opin-ion. Assessment is the “systematic process for gathering information about studentachievement” (Wilson & Bertenthal, 2005, p. 3.). It can be used by teachers andeducational authorities to indicate the perceived quality of teaching and learning.There is a hope that if the assessment process is improved, then the resultant learn-ing will improve (Biggs, 1998; Black & William, 1998). This paper recognises thatthere can be assessment for learning (diagnostic), assessment of learning (summa-tive) while learning (formative assessment) is being monitored (Black & William,1998). The assessment process includes a range of activities including these forms ofassessment and reporting. These researchers see that feedback forms a critical role inimproving outcomes. In particular, students have benefited from feedback that
*Corresponding author. DOSME, UBD, Gadong BE 1410, Brunei. Email: [email protected]
Dow
nloa
ded
by [
INA
SP -
Pak
ista
n (P
ER
I)]
at 0
2:54
27
Mar
ch 2
014
1262 H. S. Dhindsa et al.
identifies the strengths and weaknesses of their work, enabling them to take controlof their own learning (Mavrommattis, 1997). Falchikov (2004) stresses the impor-tance of student involvement in peer assessment as essential for value adding in thelearning process. Sambell, McDowell, and Brown (1997, pp. 365–366) concludedthat assessment stimulates effective learning when they:
relate to authentic tasks; represent reasonable demands; encourage students to applyknowledge to realistic contexts; emphasize the need to develop a range of skills; rewardgenuine effort, breadth and depth in learning rather than measuring “luck”; fosterstudent independence by making expectations and criteria clear; provide adequate feed-back about students’ progression; and accurately measure complex skills and qualities,as opposed to an over-reliance on memory or regurgitation of facts.
This claim suggests the need to examine the client’s perception of whether theassessment process addresses these conclusions.
In addition, most countries have signed the United Nations Convention on theRights of the Child (United Nations, 1989). The four basic principles of the conven-tion include non-discrimination (Article 2), the best interest of the child (Article 3),survival and development (Article 6), and respect for child’s opinion (Article 12).This later point suggests that child’s views about the assessment process must betaken into account. It is not possible to determine whether the best interest of thechild, their development, and respect for opinion has occurred without seeking thechild’s perspective. With increased acceptance that the student should be account-able for their part in the learning process, constructivism supports the notion thatthe student should assume greater responsibility for their learning (Mintzes,Wandersee, & Novak, 1999). The concept that the student needs to be responsibleand plan their learning to achieve learning illustrates that it is important to gain anunderstanding of students’ perceptions of the assessment process. There is a pleth-ora of research into forms and comparison of assessment techniques (Biggs, 1998;Black & William, 1998; Centre for Educational Research and Innovation, 2005).Despite the growth in emancipatory conceptualisations of classrooms that embrace aconstructivist epistemology, little contemporary evidence appears to exist to supportthe view that students are genuinely involved in decision-making about their assess-ment tasks. That is, forms of assessment and specific assessment tasks employed inschools are overwhelmingly decided by teachers and administrators. Furthermore,even though reports such as The Status and Quality of Teaching and Learning inAustralia (Goodrum, Hackling, & Rennie, 2001) has asserted that assessment is akey component of the teaching and learning process, teachers tend to utilise a verynarrow range of assessment strategies on which to base feedback to parents andstudents. In practice, there is little evidence that teachers actually use diagnostic orformative assessment strategies to inform planning and teaching (Radnor, 1996).This could be due to teachers feeling that they need to “sacrifice learning withunderstanding for the goal of drilling students in the things for which they will beheld accountable” (Hobden, 1998, p. 221).
Historically, teachers have received substantial levels of advice on assessmentpractices (Black & William, 1998; Harlen, 2001, Reynolds, Doran, Allers, & Agruso,
Dow
nloa
ded
by [
INA
SP -
Pak
ista
n (P
ER
I)]
at 0
2:54
27
Mar
ch 2
014
Science Students’ Perceptions of Assessment 1263
1995; Stern & Ahlgren, 2002; Stiggins, 1994). Just as no particular assessmentstrategy can provide all the information on how students are progressing; it can beargued that involving students in the process should illuminate our understanding asto how assessment impacts on the student.
Few textbooks on classroom teaching and assessment suggest a substantive rolefor students in developing assessment tasks. This position is historically and cultur-ally based, and is rooted in an outdated “assembly-line” view of learning in whichrecitation of facts is highly prized (Darling-Hammond, 1999). In today’s informa-tion age, jobs are increasingly demanding higher levels of literacy skill and criticalthinking, and these demands require students to actively engage and monitor theirlearning rather than passively receive knowledge. This requires a fundamental reviewof how teachers involve students in assessment tasks (Rogoff, 2001).
An effective assessment process should involve a two-way communication systembetween teachers and their students. Historically, teachers have used testinginstruments to transmit to the student and their parents what is really importantfor the student to know and do (Brookhart, 1999). While this reporting tends to bein the form of a grade, the form and design of assessment can send subtle messageson what is important. There has been a substantial amount of research into typesof assessment but very little research into students’ perceptions of assessment (see,e.g., Black & William, 1998; Crooks, 1988; Plake, 1993; Popham, 1997;Schaffner, Burry-Stock, Cho, Boney, & Hamilton, 2000). By including students inthe teaching–testing–grading cycle, the validity of the assessment processes can beenhanced and invalid assessment instruments that result in very high failure ratescan be avoided (see, e.g., Steinberg, 2000). There have been comparatively fewother studies that recommend teachers involve students in deciding assessmentcriteria for specific tasks (Smith, 2000), and yet the importance of consultingstudents has been explored (McIntyre, Pedder, & Reay, 2003; Flutter & Rudduck,2004).
Aims
The aims of the research reported here were to determine reliability and validity ofthe Students’ Perception of Assessment Questionnaire (SPAQ) in evaluating theupper secondary science students’ perception of the assessment process; to evaluatestudents’ perception on assessment process dimensions covered in SPAQ; and tocompare perceptions of the assessment process of students from different groupsclassified on the bases of gender, grade, and race. More specifically, the studyattempted to answer the following research questions:
● Was the SPAQ valid and reliable to evaluate students’ perceptions of assessment?● What were the students’ perceptions of assessment and how these perception data
compare with that of teachers and their classroom practices?● How do the perceptions of assessment of students from various groups, classified
based on gender, grade and race compare?
Dow
nloa
ded
by [
INA
SP -
Pak
ista
n (P
ER
I)]
at 0
2:54
27
Mar
ch 2
014
1264 H. S. Dhindsa et al.
Demographic, Social, Cultural, and Educational Contexts
Since there are large variations in educational set-ups in different countries, it wastherefore decided to describe some background context associated with thisresearch.
Brunei (5270 sq km land area) is divided into four districts: Brunei-Muara,Tutong, Belait, and Temburong. Tutong and Belait districts are named after theethnic communities that are concentrated in these regions. The Bruneian localpopulation consists of mainly Brunei Malay, Kedayan, Tutong, Belait, Bisaya,Dusan, Murut, Iban, Penan, and Chinese communities. These ethnic groups havedifferent languages (dialects), cultures, and eating habits. Moreover, they areconcentrated in specific districts of Brunei Darussalam. For example, most Malays,Bisaya, and Kedayan are found in the Brunei-Muara district, whereas Murut andIbans are found in the Tamburong district. Belait and Penan ethnic groups areconcentrated in the Kuala-Belait district of Brunei, and the Chinese are found inall the districts of Brunei. Other ethnic groups are mainly found in the Tutongdistrict. According to the WFB (2006), the population of 379,444 estimated forJuly 2006 consisted of a male:female ratio of 1.0:0.9. Moreover the populationconsists of Malay 67%, Chinese 15%, indigenous 6%, and others 12%. However,in government forms these ethnicities are reported as race groups. It is a commonpractice to ask for a person’s race classification (ethnicity). Therefore, in this studythese groups are referred to as the race groups. A child automatically acquires therace of the father. The national policy is to provide free education to its nationals.The country follows six years of primary, three years of lower secondary, and threeyears of upper secondary education followed by tertiary education. The medium ofinstruction in secondary schools is English, which is the students’ second or thirdlanguage. The school year is divided into four terms. The assessment proceduresused include questioning in the classroom, homework (assignments), topic/monthlytests, term tests, and yearly examinations. Most of the assessment tasks are gearedto prepare students for O-level examinations taken at the end of upper secondaryschooling.
Methodology
The methodology section is divided into four sections covering subjects andselection procedure, instrument, procedures for data collection, and analysis of data.
Subjects and Selection Procedure
The subjects of the study were 1,028 upper secondary science students from all thefour districts of Brunei. The median age of upper secondary students is 15–16 years.There were 42% male and 58% female students, respectively. The number ofstudents studying in Form 4 and Form 5 were 44.5% and 55.5%, respectively. Thesample consisted of 68.5% Malay, 44.5% Chinese, and 3.9% students from other
Dow
nloa
ded
by [
INA
SP -
Pak
ista
n (P
ER
I)]
at 0
2:54
27
Mar
ch 2
014
Science Students’ Perceptions of Assessment 1265
races. These percentages are computed by omitting a small number of subjects whodid not respond to a particular demographic question.
These students represented 43 science classes. A stratified sampling techniquewas used for the selection of classes because the number of schools, and hence thenumber of students, in all the four districts of the country, was greatly non-uniform.The numbers of government schools in Brunei-Muara, Belait, Tutong, and Tembu-rong districts are 21, 4, 6, and 1, respectively. Considering the available financialand manpower resources, it was decided to involve one-third of these classes forcollecting qualitative data. Therefore, 14 classes were randomly selected. Moreover,one student from each class was further selected randomly for interview. Further-more, one class per teacher was observed to evaluate their classroom practices.These classes were taught by nine teachers. Hence, 14 students and nine teacherswere interviewed in English to know their views on the themes covered in five scalesof SPAQ. The interview questions were based on the thematic descriptions of thescales (see Table 1), and are reported later in Figures 1 and 2 along with samples ofstudents’ and teachers’ responses to these questions. Since the items in the instru-ment mainly emphasised tests and assignments as the means of assessment, theclassroom observations focused on these areas. The classroom observations in thisstudy therefore include the analysis of test papers, homework, and class-work. Onetest paper, homework assignment, and classroom observation per teacher were usedto collect observation data. The questions covering observations data are reportedlater in Figure 3.Figure 1. Samples of student interview responses
Instrument
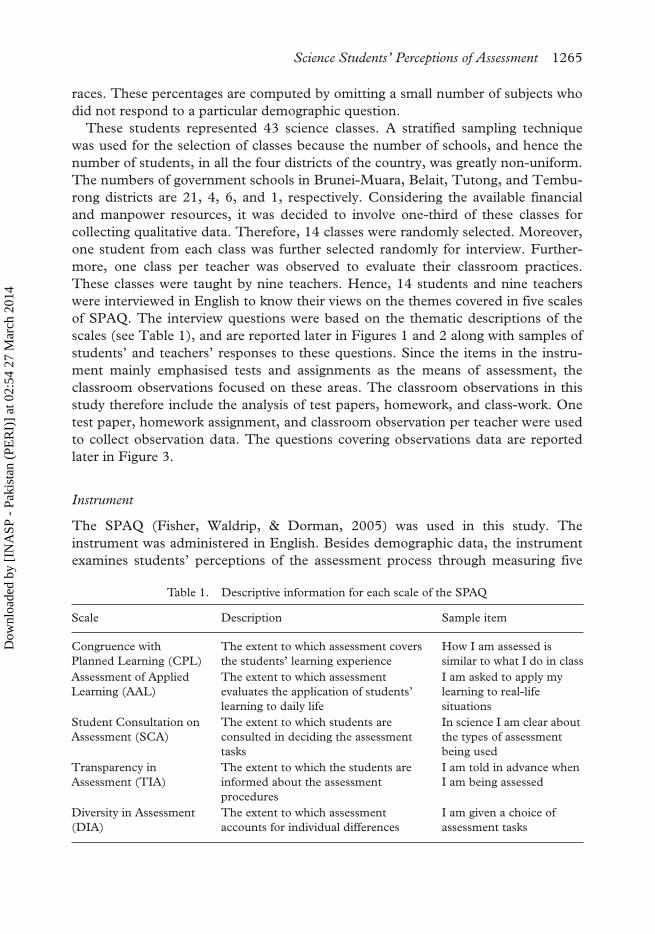
The SPAQ (Fisher, Waldrip, & Dorman, 2005) was used in this study. Theinstrument was administered in English. Besides demographic data, the instrumentexamines students’ perceptions of the assessment process through measuring five
Table 1. Descriptive information for each scale of the SPAQ
Scale Description Sample item
Congruence with Planned Learning (CPL)
The extent to which assessment covers the students’ learning experience
How I am assessed is similar to what I do in class
Assessment of Applied Learning (AAL)
The extent to which assessment evaluates the application of students’ learning to daily life
I am asked to apply my learning to real-life situations
Student Consultation on Assessment (SCA)
The extent to which students are consulted in deciding the assessment tasks
In science I am clear about the types of assessment being used
Transparency in Assessment (TIA)
The extent to which the students are informed about the assessment procedures
I am told in advance when I am being assessed
Diversity in Assessment (DIA)
The extent to which assessment accounts for individual differences
I am given a choice of assessment tasks
Dow
nloa
ded
by [
INA
SP -
Pak
ista
n (P
ER
I)]
at 0
2:54
27
Mar
ch 2
014
1266 H. S. Dhindsa et al.
selected dimensions (scales): Congruence with Planned Learning; Assessment ofApplied Learning, Students Consultation on Assessment types, Transparency inAssessment, and Accommodation of Students’ Diversity in assessment procedures.These scales are described in Table 1. Each dimension (scale) is represented by sixitems. The respondents were asked to report the extent to which they agree with thestatement on a four-point scale: Almost always (4), Often (3), Sometimes (2), andAlmost never (1).
Procedures for Data Collection
Two types of data (quantitative and qualitative) were collected in this study. Theaim of collecting qualitative data was to triangulate it with quantitative data toevaluate how objective were the quantitative data in relation to student and teacherinterviews and observation data.
Although English is a major medium of instruction for the respondents, English istheir second or third language. It was therefore felt essential to evaluate whether thevocabulary and language structure used in the instrument developed in Australiawere appropriate for the Bruneian students. To achieve this, the original instrumentwas read by three lecturers. Their comments are reported in results section. TheFlesh Reading Ease and Flesh–Kincard Grade Level coefficients were computedusing the Microsoft Word program to evaluate the readability of the instrument.
The SPAQ was administered to respondents with the help of their scienceteachers. Interviews were transcribed. Moreover, nine 60-min classes (one perteacher) were observed and the observations were recorded.
Analysis of Data
The respondents’ responses to SPAQ items were analysed using the SPSS program.Scale-item mean values were computed for each respondent and then these valueswere averaged over the respondents to compute an average scale-item mean value.The interview transcripts were analysed by reading responses to each interviewquestion as well as to questions associated with classroom observations. Then overallsummaries for each question for students’ and teachers’ interviews as well as forobservation data were prepared. These summaries represented the theme for eachscale and are reported in the Results section. These summaries were reviewed by anindependent coder, who agreed in principle but proposed minor revisions, whichwere taken care of. The major aim of collecting qualitative data was to evaluate thescale-item mean data for students’ responses on SPAQ in light of observedclassroom practices.
Results
In this section, the results are divided into two categories: quantitative data andqualitative data.
Dow
nloa
ded
by [
INA
SP -
Pak
ista
n (P
ER
I)]
at 0
2:54
27
Mar
ch 2
014
Science Students’ Perceptions of Assessment 1267
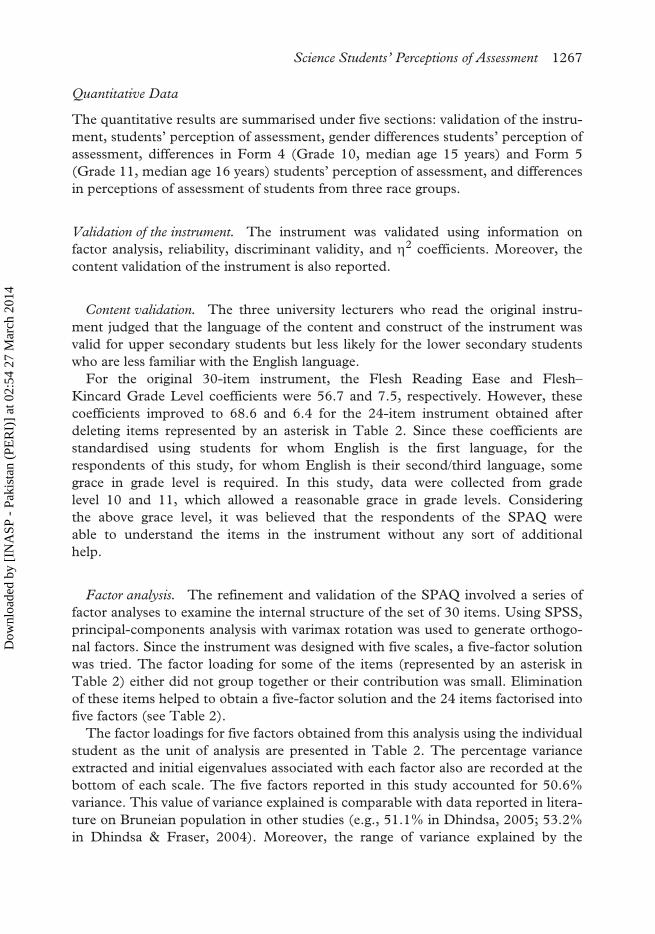
Quantitative Data
The quantitative results are summarised under five sections: validation of the instru-ment, students’ perception of assessment, gender differences students’ perception ofassessment, differences in Form 4 (Grade 10, median age 15 years) and Form 5(Grade 11, median age 16 years) students’ perception of assessment, and differencesin perceptions of assessment of students from three race groups.
Validation of the instrument. The instrument was validated using information onfactor analysis, reliability, discriminant validity, and η2 coefficients. Moreover, thecontent validation of the instrument is also reported.
Content validation. The three university lecturers who read the original instru-ment judged that the language of the content and construct of the instrument wasvalid for upper secondary students but less likely for the lower secondary studentswho are less familiar with the English language.
For the original 30-item instrument, the Flesh Reading Ease and Flesh–Kincard Grade Level coefficients were 56.7 and 7.5, respectively. However, thesecoefficients improved to 68.6 and 6.4 for the 24-item instrument obtained afterdeleting items represented by an asterisk in Table 2. Since these coefficients arestandardised using students for whom English is the first language, for therespondents of this study, for whom English is their second/third language, somegrace in grade level is required. In this study, data were collected from gradelevel 10 and 11, which allowed a reasonable grace in grade levels. Consideringthe above grace level, it was believed that the respondents of the SPAQ wereable to understand the items in the instrument without any sort of additionalhelp.
Factor analysis. The refinement and validation of the SPAQ involved a series offactor analyses to examine the internal structure of the set of 30 items. Using SPSS,principal-components analysis with varimax rotation was used to generate orthogo-nal factors. Since the instrument was designed with five scales, a five-factor solutionwas tried. The factor loading for some of the items (represented by an asterisk inTable 2) either did not group together or their contribution was small. Eliminationof these items helped to obtain a five-factor solution and the 24 items factorised intofive factors (see Table 2).
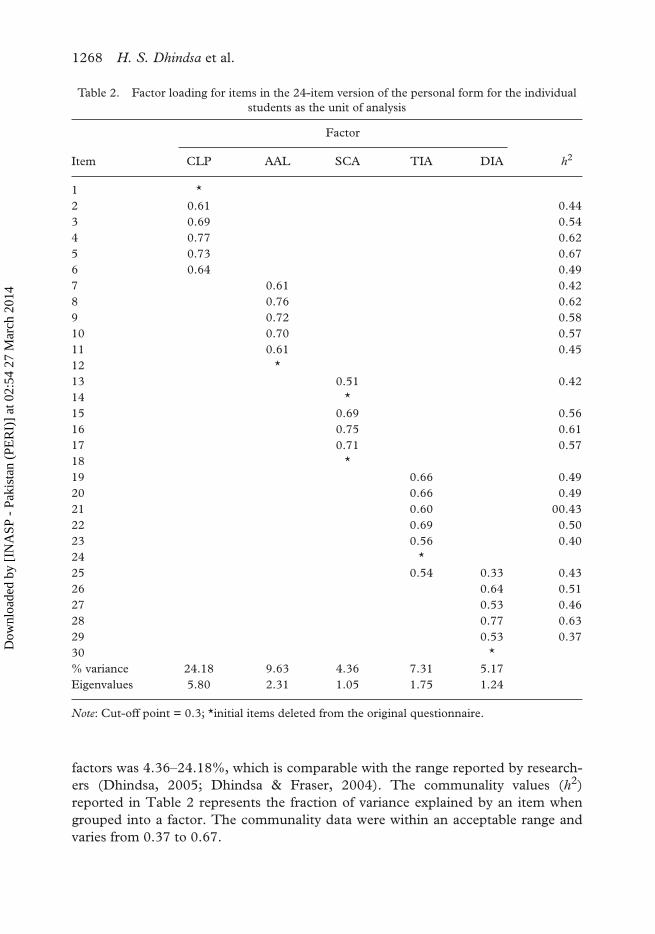
The factor loadings for five factors obtained from this analysis using the individualstudent as the unit of analysis are presented in Table 2. The percentage varianceextracted and initial eigenvalues associated with each factor also are recorded at thebottom of each scale. The five factors reported in this study accounted for 50.6%variance. This value of variance explained is comparable with data reported in litera-ture on Bruneian population in other studies (e.g., 51.1% in Dhindsa, 2005; 53.2%in Dhindsa & Fraser, 2004). Moreover, the range of variance explained by the
Dow
nloa
ded
by [
INA
SP -
Pak
ista
n (P
ER
I)]
at 0
2:54
27
Mar
ch 2
014
1268 H. S. Dhindsa et al.
factors was 4.36–24.18%, which is comparable with the range reported by research-ers (Dhindsa, 2005; Dhindsa & Fraser, 2004). The communality values (h2)reported in Table 2 represents the fraction of variance explained by an item whengrouped into a factor. The communality data were within an acceptable range andvaries from 0.37 to 0.67.
Table 2. Factor loading for items in the 24-item version of the personal form for the individual students as the unit of analysis
Factor
Item CLP AAL SCA TIA DIA h2
1 *2 0.61 0.443 0.69 0.544 0.77 0.625 0.73 0.676 0.64 0.497 0.61 0.428 0.76 0.629 0.72 0.5810 0.70 0.5711 0.61 0.4512 *13 0.51 0.4214 *15 0.69 0.5616 0.75 0.6117 0.71 0.5718 *19 0.66 0.4920 0.66 0.4921 0.60 00.4322 0.69 0.5023 0.56 0.4024 *25 0.54 0.33 0.4326 0.64 0.5127 0.53 0.4628 0.77 0.6329 0.53 0.3730 *% variance 24.18 9.63 4.36 7.31 5.17Eigenvalues 5.80 2.31 1.05 1.75 1.24
Note: Cut-off point = 0.3; *initial items deleted from the original questionnaire.
Dow
nloa
ded
by [
INA
SP -
Pak
ista
n (P
ER
I)]
at 0
2:54
27
Mar
ch 2
014
Science Students’ Perceptions of Assessment 1269
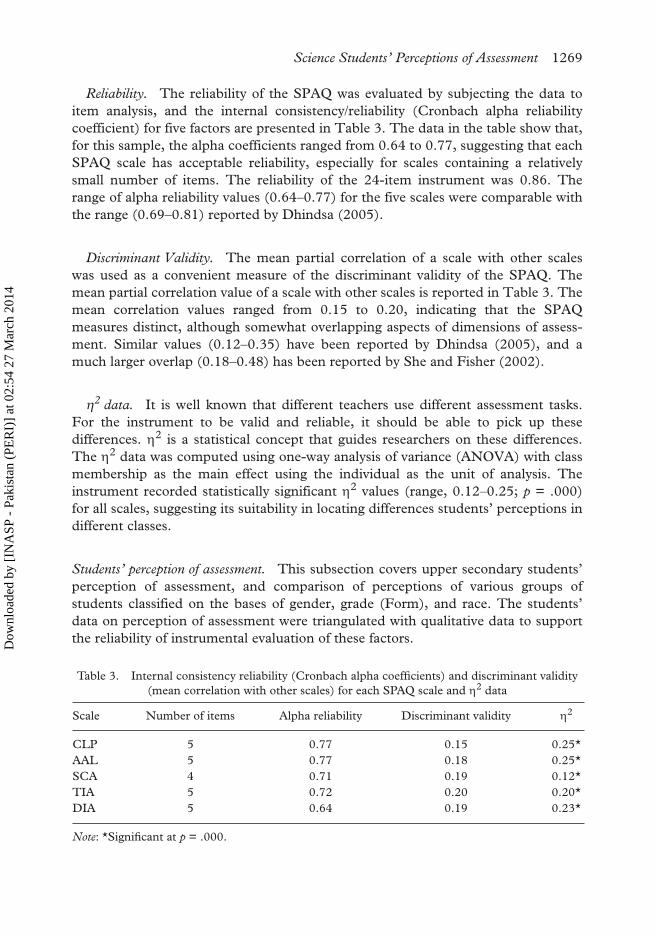
Reliability. The reliability of the SPAQ was evaluated by subjecting the data toitem analysis, and the internal consistency/reliability (Cronbach alpha reliabilitycoefficient) for five factors are presented in Table 3. The data in the table show that,for this sample, the alpha coefficients ranged from 0.64 to 0.77, suggesting that eachSPAQ scale has acceptable reliability, especially for scales containing a relativelysmall number of items. The reliability of the 24-item instrument was 0.86. Therange of alpha reliability values (0.64–0.77) for the five scales were comparable withthe range (0.69–0.81) reported by Dhindsa (2005).
Discriminant Validity. The mean partial correlation of a scale with other scaleswas used as a convenient measure of the discriminant validity of the SPAQ. Themean partial correlation value of a scale with other scales is reported in Table 3. Themean correlation values ranged from 0.15 to 0.20, indicating that the SPAQmeasures distinct, although somewhat overlapping aspects of dimensions of assess-ment. Similar values (0.12–0.35) have been reported by Dhindsa (2005), and amuch larger overlap (0.18–0.48) has been reported by She and Fisher (2002).
η2 data. It is well known that different teachers use different assessment tasks.For the instrument to be valid and reliable, it should be able to pick up thesedifferences. η2 is a statistical concept that guides researchers on these differences.The η2 data was computed using one-way analysis of variance (ANOVA) with classmembership as the main effect using the individual as the unit of analysis. Theinstrument recorded statistically significant η2 values (range, 0.12–0.25; p = .000)for all scales, suggesting its suitability in locating differences students’ perceptions indifferent classes.
Students’ perception of assessment. This subsection covers upper secondary students’perception of assessment, and comparison of perceptions of various groups ofstudents classified on the bases of gender, grade (Form), and race. The students’data on perception of assessment were triangulated with qualitative data to supportthe reliability of instrumental evaluation of these factors.
Table 3. Internal consistency reliability (Cronbach alpha coefficients) and discriminant validity (mean correlation with other scales) for each SPAQ scale and η2 data
Scale Number of items Alpha reliability Discriminant validity η2
CLP 5 0.77 0.15 0.25*AAL 5 0.77 0.18 0.25*SCA 4 0.71 0.19 0.12*TIA 5 0.72 0.20 0.20*DIA 5 0.64 0.19 0.23*
Note: *Significant at p = .000.
Dow
nloa
ded
by [
INA
SP -
Pak
ista
n (P
ER
I)]
at 0
2:54
27
Mar
ch 2
014
1270 H. S. Dhindsa et al.
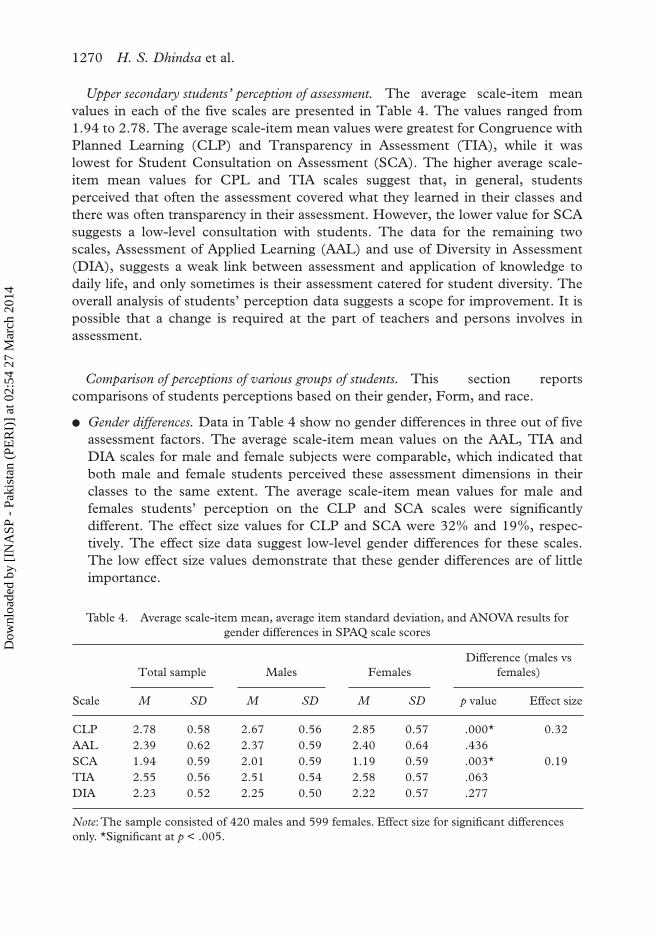
Upper secondary students’ perception of assessment. The average scale-item meanvalues in each of the five scales are presented in Table 4. The values ranged from1.94 to 2.78. The average scale-item mean values were greatest for Congruence withPlanned Learning (CLP) and Transparency in Assessment (TIA), while it waslowest for Student Consultation on Assessment (SCA). The higher average scale-item mean values for CPL and TIA scales suggest that, in general, studentsperceived that often the assessment covered what they learned in their classes andthere was often transparency in their assessment. However, the lower value for SCAsuggests a low-level consultation with students. The data for the remaining twoscales, Assessment of Applied Learning (AAL) and use of Diversity in Assessment(DIA), suggests a weak link between assessment and application of knowledge todaily life, and only sometimes is their assessment catered for student diversity. Theoverall analysis of students’ perception data suggests a scope for improvement. It ispossible that a change is required at the part of teachers and persons involves inassessment.
Comparison of perceptions of various groups of students. This section reportscomparisons of students perceptions based on their gender, Form, and race.
● Gender differences. Data in Table 4 show no gender differences in three out of fiveassessment factors. The average scale-item mean values on the AAL, TIA andDIA scales for male and female subjects were comparable, which indicated thatboth male and female students perceived these assessment dimensions in theirclasses to the same extent. The average scale-item mean values for male andfemales students’ perception on the CLP and SCA scales were significantlydifferent. The effect size values for CLP and SCA were 32% and 19%, respec-tively. The effect size data suggest low-level gender differences for these scales.The low effect size values demonstrate that these gender differences are of littleimportance.
Table 4. Average scale-item mean, average item standard deviation, and ANOVA results for gender differences in SPAQ scale scores
Total sample Males FemalesDifference (males vs
females)
Scale M SD M SD M SD p value Effect size
CLP 2.78 0.58 2.67 0.56 2.85 0.57 .000* 0.32AAL 2.39 0.62 2.37 0.59 2.40 0.64 .436SCA 1.94 0.59 2.01 0.59 1.19 0.59 .003* 0.19TIA 2.55 0.56 2.51 0.54 2.58 0.57 .063DIA 2.23 0.52 2.25 0.50 2.22 0.57 .277
Note: The sample consisted of 420 males and 599 females. Effect size for significant differences only. *Significant at p < .005.
Dow
nloa
ded
by [
INA
SP -
Pak
ista
n (P
ER
I)]
at 0
2:54
27
Mar
ch 2
014
Science Students’ Perceptions of Assessment 1271
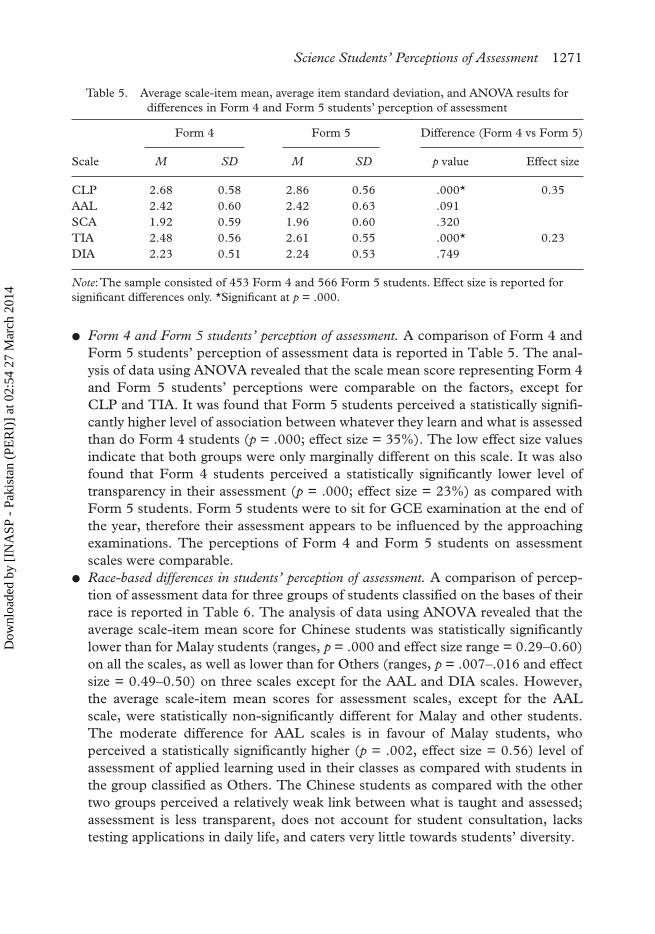
● Form 4 and Form 5 students’ perception of assessment. A comparison of Form 4 andForm 5 students’ perception of assessment data is reported in Table 5. The anal-ysis of data using ANOVA revealed that the scale mean score representing Form 4and Form 5 students’ perceptions were comparable on the factors, except forCLP and TIA. It was found that Form 5 students perceived a statistically signifi-cantly higher level of association between whatever they learn and what is assessedthan do Form 4 students (p = .000; effect size = 35%). The low effect size valuesindicate that both groups were only marginally different on this scale. It was alsofound that Form 4 students perceived a statistically significantly lower level oftransparency in their assessment (p = .000; effect size = 23%) as compared withForm 5 students. Form 5 students were to sit for GCE examination at the end ofthe year, therefore their assessment appears to be influenced by the approachingexaminations. The perceptions of Form 4 and Form 5 students on assessmentscales were comparable.
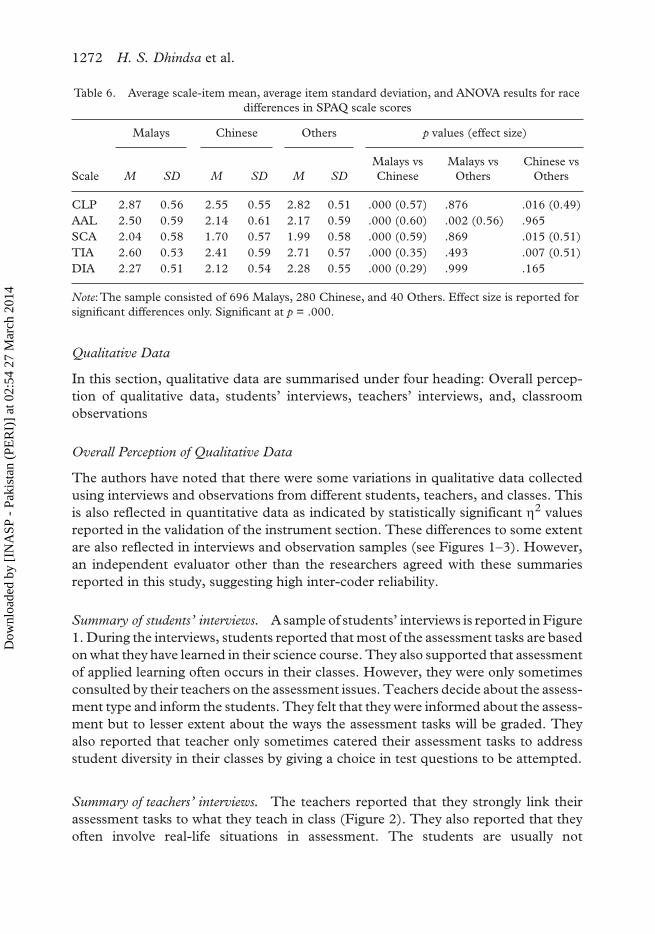
● Race-based differences in students’ perception of assessment. A comparison of percep-tion of assessment data for three groups of students classified on the bases of theirrace is reported in Table 6. The analysis of data using ANOVA revealed that theaverage scale-item mean score for Chinese students was statistically significantlylower than for Malay students (ranges, p = .000 and effect size range = 0.29–0.60)on all the scales, as well as lower than for Others (ranges, p = .007–.016 and effectsize = 0.49–0.50) on three scales except for the AAL and DIA scales. However,the average scale-item mean scores for assessment scales, except for the AALscale, were statistically non-significantly different for Malay and other students.The moderate difference for AAL scales is in favour of Malay students, whoperceived a statistically significantly higher (p = .002, effect size = 0.56) level ofassessment of applied learning used in their classes as compared with students inthe group classified as Others. The Chinese students as compared with the othertwo groups perceived a relatively weak link between what is taught and assessed;assessment is less transparent, does not account for student consultation, lackstesting applications in daily life, and caters very little towards students’ diversity.
Table 5. Average scale-item mean, average item standard deviation, and ANOVA results for differences in Form 4 and Form 5 students’ perception of assessment
Form 4 Form 5 Difference (Form 4 vs Form 5)
Scale M SD M SD p value Effect size
CLP 2.68 0.58 2.86 0.56 .000* 0.35AAL 2.42 0.60 2.42 0.63 .091SCA 1.92 0.59 1.96 0.60 .320TIA 2.48 0.56 2.61 0.55 .000* 0.23DIA 2.23 0.51 2.24 0.53 .749
Note: The sample consisted of 453 Form 4 and 566 Form 5 students. Effect size is reported for significant differences only. *Significant at p = .000.
Dow
nloa
ded
by [
INA
SP -
Pak
ista
n (P
ER
I)]
at 0
2:54
27
Mar
ch 2
014
1272 H. S. Dhindsa et al.
Qualitative Data
In this section, qualitative data are summarised under four heading: Overall percep-tion of qualitative data, students’ interviews, teachers’ interviews, and, classroomobservations
Overall Perception of Qualitative Data
The authors have noted that there were some variations in qualitative data collectedusing interviews and observations from different students, teachers, and classes. Thisis also reflected in quantitative data as indicated by statistically significant η2 valuesreported in the validation of the instrument section. These differences to some extentare also reflected in interviews and observation samples (see Figures 1–3). However,an independent evaluator other than the researchers agreed with these summariesreported in this study, suggesting high inter-coder reliability.
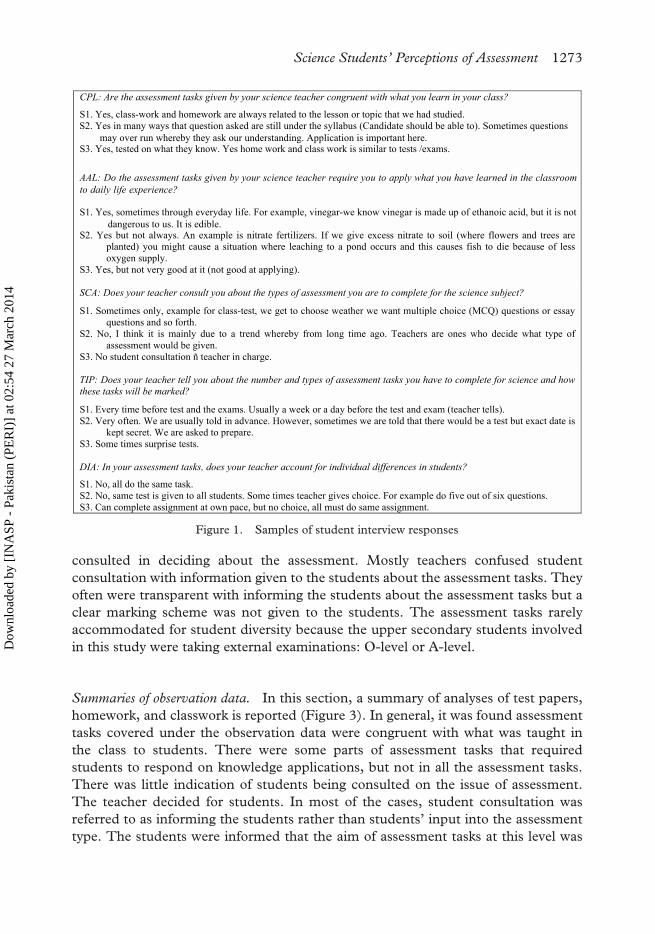
Summary of students’ interviews. A sample of students’ interviews is reported in Figure1. During the interviews, students reported that most of the assessment tasks are basedon what they have learned in their science course. They also supported that assessmentof applied learning often occurs in their classes. However, they were only sometimesconsulted by their teachers on the assessment issues. Teachers decide about the assess-ment type and inform the students. They felt that they were informed about the assess-ment but to lesser extent about the ways the assessment tasks will be graded. Theyalso reported that teacher only sometimes catered their assessment tasks to addressstudent diversity in their classes by giving a choice in test questions to be attempted.
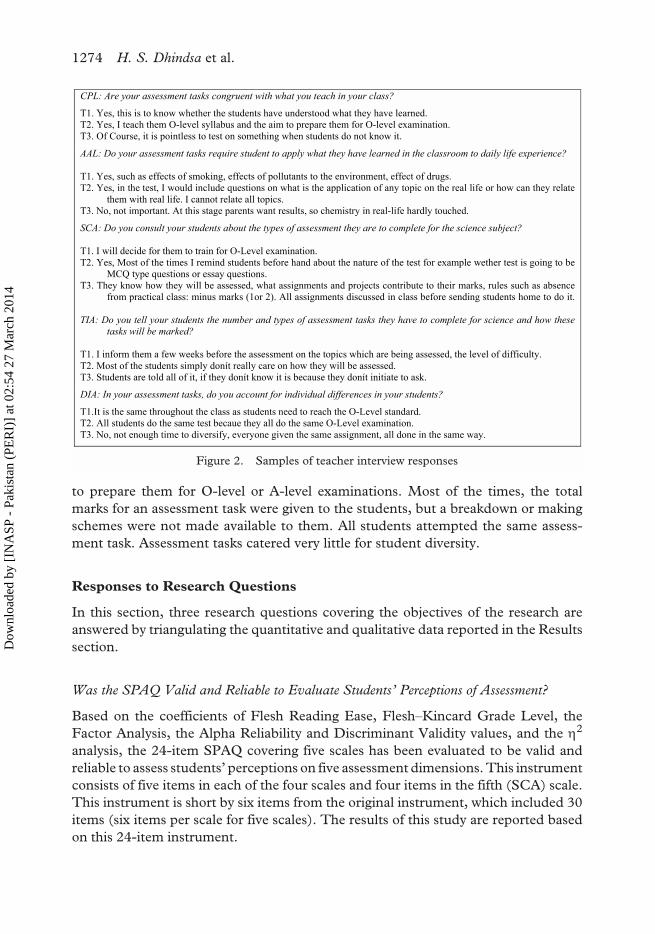
Summary of teachers’ interviews. The teachers reported that they strongly link theirassessment tasks to what they teach in class (Figure 2). They also reported that theyoften involve real-life situations in assessment. The students are usually not
Table 6. Average scale-item mean, average item standard deviation, and ANOVA results for race differences in SPAQ scale scores
Malays Chinese Others p values (effect size)
Scale M SD M SD M SDMalays vs Chinese
Malays vs Others
Chinese vs Others
CLP 2.87 0.56 2.55 0.55 2.82 0.51 .000 (0.57) .876 .016 (0.49)AAL 2.50 0.59 2.14 0.61 2.17 0.59 .000 (0.60) .002 (0.56) .965SCA 2.04 0.58 1.70 0.57 1.99 0.58 .000 (0.59) .869 .015 (0.51)TIA 2.60 0.53 2.41 0.59 2.71 0.57 .000 (0.35) .493 .007 (0.51)DIA 2.27 0.51 2.12 0.54 2.28 0.55 .000 (0.29) .999 .165
Note: The sample consisted of 696 Malays, 280 Chinese, and 40 Others. Effect size is reported for significant differences only. Significant at p = .000.
Dow
nloa
ded
by [
INA
SP -
Pak
ista
n (P
ER
I)]
at 0
2:54
27
Mar
ch 2
014
Science Students’ Perceptions of Assessment 1273
consulted in deciding about the assessment. Mostly teachers confused studentconsultation with information given to the students about the assessment tasks. Theyoften were transparent with informing the students about the assessment tasks but aclear marking scheme was not given to the students. The assessment tasks rarelyaccommodated for student diversity because the upper secondary students involvedin this study were taking external examinations: O-level or A-level.Figure 2. Samples of teacher interview responses
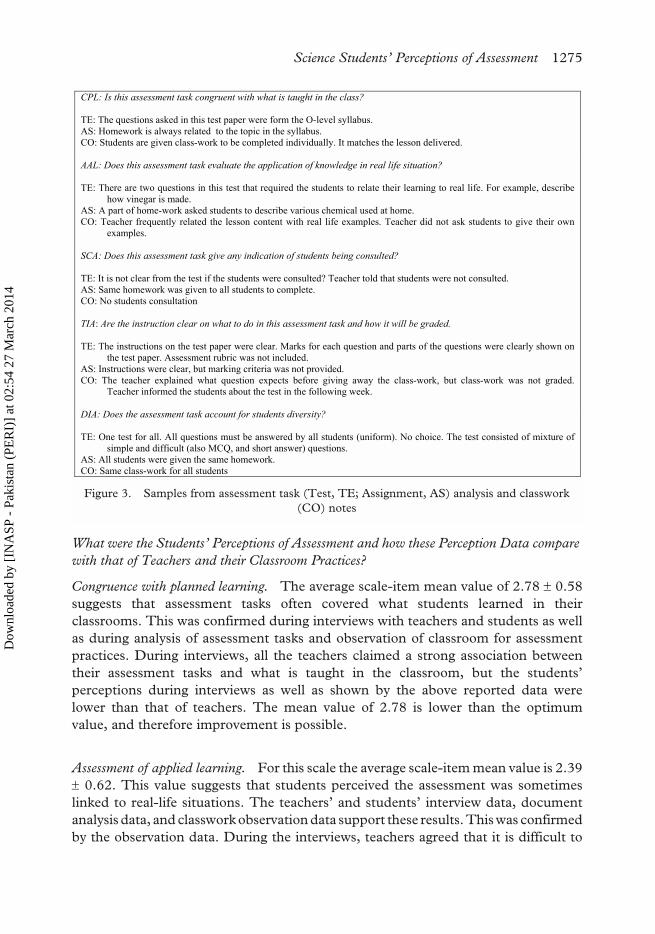
Summaries of observation data. In this section, a summary of analyses of test papers,homework, and classwork is reported (Figure 3). In general, it was found assessmenttasks covered under the observation data were congruent with what was taught inthe class to students. There were some parts of assessment tasks that requiredstudents to respond on knowledge applications, but not in all the assessment tasks.There was little indication of students being consulted on the issue of assessment.The teacher decided for students. In most of the cases, student consultation wasreferred to as informing the students rather than students’ input into the assessmenttype. The students were informed that the aim of assessment tasks at this level was
CPL: Are the assessment tasks given by your science teacher congruent with what you learn in your class?
S1. Yes, class-work and homework are always related to the lesson or topic that we had studied. S2. Yes in many ways that question asked are still under the syllabus (Candidate should be able to). Sometimes questions may over run whereby they ask our understanding. Application is important here.S3. Yes, tested on what they know. Yes home work and class work is similar to tests /exams.
AAL: Do the assessment tasks given by your science teacher require you to apply what you have learned in the classroomto daily life experience?
S1. Yes, sometimes through everyday life. For example, vinegar-we know vinegar is made up of ethanoic acid, but it is not dangerous to us. It is edible.S2. Yes but not always. An example is nitrate fertilizers. If we give excess nitrate to soil (where flowers and trees are
planted) you might cause a situation where leaching to a pond occurs and this causes fish to die because of less oxygen supply.
S3. Yes, but not very good at it (not good at applying).
SCA: Does your teacher consult you about the types of assessment you are to complete for the science subject?
S1. Sometimes only, example for class-test, we get to choose weather we want multiple choice (MCQ) questions or essay questions and so forth.
S2. No, I think it is mainly due to a trend whereby from long time ago. Teachers are ones who decide what type of assessment would be given.
S3. No student consultation ñ teacher in charge.
TIP: Does your teacher tell you about the number and types of assessment tasks you have to complete for science and how these tasks will be marked?
S1. Every time before test and the exams. Usually a week or a day before the test and exam (teacher tells). S2. Very often. We are usually told in advance. However, sometimes we are told that there would be a test but exact date is
kept secret. We are asked to prepare. S3. Some times surprise tests.
DIA: In your assessment tasks, does your teacher account for individual differences in students?
S1. No, all do the same task. S2. No, same test is given to all students. Some times teacher gives choice. For example do five out of six questions.S3. Can complete assignment at own pace, but no choice, all must do same assignment.
Figure 1. Samples of student interview responses
Dow
nloa
ded
by [
INA
SP -
Pak
ista
n (P
ER
I)]
at 0
2:54
27
Mar
ch 2
014
1274 H. S. Dhindsa et al.
to prepare them for O-level or A-level examinations. Most of the times, the totalmarks for an assessment task were given to the students, but a breakdown or makingschemes were not made available to them. All students attempted the same assess-ment task. Assessment tasks catered very little for student diversity.Figure 3. Samples from assessment task (Test, TE; Assignment, AS) analysis and classwork (CO) notes
Responses to Research Questions
In this section, three research questions covering the objectives of the research areanswered by triangulating the quantitative and qualitative data reported in the Resultssection.
Was the SPAQ Valid and Reliable to Evaluate Students’ Perceptions of Assessment?
Based on the coefficients of Flesh Reading Ease, Flesh–Kincard Grade Level, theFactor Analysis, the Alpha Reliability and Discriminant Validity values, and the η2
analysis, the 24-item SPAQ covering five scales has been evaluated to be valid andreliable to assess students’ perceptions on five assessment dimensions. This instrumentconsists of five items in each of the four scales and four items in the fifth (SCA) scale.This instrument is short by six items from the original instrument, which included 30items (six items per scale for five scales). The results of this study are reported basedon this 24-item instrument.
CPL: Are your assessment tasks congruent with what you teach in your class?
T1. Yes, this is to know whether the students have understood what they have learned.T2. Yes, I teach them O-level syllabus and the aim to prepare them for O-level examination.T3. Of Course, it is pointless to test on something when students do not know it.
AAL: Do your assessment tasks require student to apply what they have learned in the classroom to daily life experience?
T1. Yes, such as effects of smoking, effects of pollutants to the environment, effect of drugs.T2. Yes, in the test, I would include questions on what is the application of any topic on the real life or how can they relate
them with real life. I cannot relate all topics. T3. No, not important. At this stage parents want results, so chemistry in real-life hardly touched.
SCA: Do you consult your students about the types of assessment they are to complete for the science subject?
T1. I will decide for them to train for O-Level examination.T2. Yes, Most of the times I remind students before hand about the nature of the test for example wether test is going to be
MCQ type questions or essay questions. T3. They know how they will be assessed, what assignments and projects contribute to their marks, rules such as absence
from practical class: minus marks (1or 2). All assignments discussed in class before sending students home to do it.
TIA: Do you tell your students the number and types of assessment tasks they have to complete for science and how these tasks will be marked?
T1. I inform them a few weeks before the assessment on the topics which are being assessed, the level of difficulty.T2. Most of the students simply donít really care on how they will be assessed.T3. Students are told all of it, if they donít know it is because they donít initiate to ask.
DIA: In your assessment tasks, do you account for individual differences in your students?
T1.It is the same throughout the class as students need to reach the O-Level standard.T2. All students do the same test becaue they all do the same O-Level examination.T3. No, not enough time to diversify, everyone given the same assignment, all done in the same way.
Figure 2. Samples of teacher interview responses
Dow
nloa
ded
by [
INA
SP -
Pak
ista
n (P
ER
I)]
at 0
2:54
27
Mar
ch 2
014
Science Students’ Perceptions of Assessment 1275
What were the Students’ Perceptions of Assessment and how these Perception Data compare with that of Teachers and their Classroom Practices?
Congruence with planned learning. The average scale-item mean value of 2.78 ± 0.58suggests that assessment tasks often covered what students learned in theirclassrooms. This was confirmed during interviews with teachers and students as wellas during analysis of assessment tasks and observation of classroom for assessmentpractices. During interviews, all the teachers claimed a strong association betweentheir assessment tasks and what is taught in the classroom, but the students’perceptions during interviews as well as shown by the above reported data werelower than that of teachers. The mean value of 2.78 is lower than the optimumvalue, and therefore improvement is possible.
Assessment of applied learning. For this scale the average scale-item mean value is 2.39± 0.62. This value suggests that students perceived the assessment was sometimeslinked to real-life situations. The teachers’ and students’ interview data, documentanalysis data, and classwork observation data support these results. This was confirmedby the observation data. During the interviews, teachers agreed that it is difficult to
CPL: Is this assessment task congruent with what is taught in the class? TE: The questions asked in this test paper were form the O-level syllabus. AS: Homework is always related to the topic in the syllabus.CO: Students are given class-work to be completed individually. It matches the lesson delivered. AAL: Does this assessment task evaluate the application of knowledge in real life situation? TE: There are two questions in this test that required the students to relate their learning to real life. For example, describe
how vinegar is made. AS: A part of home-work asked students to describe various chemical used at home.CO: Teacher frequently related the lesson content with real life examples. Teacher did not ask students to give their own
examples. SCA: Does this assessment task give any indication of students being consulted? TE: It is not clear from the test if the students were consulted? Teacher told that students were not consulted. AS: Same homework was given to all students to complete. CO: No students consultation
TIA: Are the instruction clear on what to do in this assessment task and how it will be graded. TE: The instructions on the test paper were clear. Marks for each question and parts of the questions were clearly shown on
the test paper. Assessment rubric was not included. AS: Instructions were clear, but marking criteria was not provided. CO: The teacher explained what question expects before giving away the class-work, but class-work was not graded.
Teacher informed the students about the test in the following week. DIA: Does the assessment task account for students diversity? TE: One test for all. All questions must be answered by all students (uniform). No choice. The test consisted of mixture of
simple and difficult (also MCQ, and short answer) questions. AS: All students were given the same homework.CO: Same class-work for all students
Figure 3. Samples from assessment task (Test, TE; Assignment, AS) analysis and classwork (CO) notes
Dow
nloa
ded
by [
INA
SP -
Pak
ista
n (P
ER
I)]
at 0
2:54
27
Mar
ch 2
014
1276 H. S. Dhindsa et al.
associate all pieces of science knowledge to daily life experiences. This factor needsattention and can be improved by relating content to daily life experiences.
Student consultation on assessment. The students’ responses to the items in this scaleproduced an average scale-item mean value of 1.94 ± 0.59. These data suggest thatstudents were only sometimes consulted about their assessment. These data are alsosupported by the interview data and observation data reported in the previous section.Most of the time, the teachers decide about the types of assessment and then informthe students. Teachers often think that providing information to students regardingwhen and what type of assessment is consultation. The mean value less than 2.00suggests that this dimension requires serious attention. The teachers should think ofways by which they can involve student input in their assessment tasks.
Transparency in assessment. The quantitative data on students’ perception (2.55 ±0.56) suggest that students perceived that there is often transparency in assessment.When data from interviews and observations were triangulated, these results wereverified. Teachers felt that providing information to students on the type of assess-ment and topics covered in the assessment means transparency of assessment (seeinformation in Figure 1). Students also felt that receiving information from theirteachers on the type of assessment and topics covered in the assessment meant trans-parency of assessment (see information in Figure 1). However, there is lot moreattached to the transparency of assessment. For example, teachers should informtheir students on how their assessment tasks will be marked, which is missing on thepart of teachers. Therefore, teachers need to provide more information to studentsto improve their mean perception score on this scale.
Diversity in assessment. The average scale-item mean of 2.23 ± 0.52 suggests thatstudents perceived that assessment only sometimes catered for student diversity.The teachers’ interviews and observation data (analysis of tests, homework, andclasswork) did not support this value. Therefore this value appears to be higher thanexpected. Most of the teachers believed they use the same assessment for all studentsbecause they were preparing the students for O-level or A-level examinations. Thesedata, however, were supported by students’ interview data as they believed thatteachers sometimes gave choices in examinations that students could chose ques-tions. However, only a few teachers gave choice in classwork or homework assign-ments. The authors believe that there is scope for improvement on this dimension,which can be easily achieved by informing teachers how to organise assessment todeal with diversity of students.
How do the Perceptions of Assessment of Students from Various Groups, Classified Based on Gender, Grade, and Race, Compare?
The results of this study suggest no gender differences in students’ perception ofassessment. Although statistically significant differences in favour of male students
Dow
nloa
ded
by [
INA
SP -
Pak
ista
n (P
ER
I)]
at 0
2:54
27
Mar
ch 2
014
Science Students’ Perceptions of Assessment 1277
were observed, these differences were treated as of low importance because the effectsize values were at a low level using Cohen’s (1969) classification. The Form 4 andForm 5 students’ perception data on assessment produced similar results as those ofgender, which is only two out five comparisons statistically significant with low effectsize values. Therefore, it was concluded that Form 4 and Form 5 students’ percep-tions of assessment were comparable.
The results of this study revealed that students’ perceptions of assessment, whenthey were classified on the basis of their race, were different. The Chinese studentsrecorded a statistically significantly low average scale-item mean score on all thescales when compared with Malay students and students grouped under Others.The perceptions of students grouped as Others and as Malays were comparable intheir perception on four out of five scales, with a moderate-level effect size for theAAL scale. This implies that Chinese students perceived their involvement in decid-ing assessment tasks at a much lower level as compared with the other two groups ofstudents, whose perceptions were comparable.
Discussion
The results of this study revealed that the SPAQ was valid and reliable for assessingBruneian upper secondary students’ perceptions of assessment. However, some ofthe items in the original instrument proved to be less reliable. Under this condition,the SCA scale was left with only four items. These items need modification so thatthey measure the required element of respective dimension. In the Australianversion, all the items satisfactorily factorised into their scales (Fisher et al., 2005).Future research covering the factors that influenced these items in the Bruneiancontext and how these items can be modified is desirable.
The average scale-item mean values for all the scales are lower than the optimumvalue; therefore, there is scope for improvement of students’ perception of assess-ment by improving classroom practices. The student consultation on assessment,diversity in assessment, and assessment of applied learning dimensions of assess-ment scored a low average scale-item mean score, indicating that these dimensionsrequire special attention. This is a challenge for teachers to look for ways that theycan consult students on assessment, cater assessment for individualised needs, andassess the application of knowledge. This outcome can partly be achieved by trainingteachers in this area at teacher education institutes.
Given the size of the standard deviation for each of the scales, it is clear thatstudents were not uniform in their perceptions of the assessment process. It ispossible that some students could have been consistently high or low, but it isclear that a range of perceptions were present. In this study, it is not as importantthat students responses were low or high, or that they had differing views, butrather what teachers could do to address these perceptions. These possible actionsare the focus of the next stage of this research. At this stage, it is not possible tobe definitive about the scale means as to whether the reported mean is desirable.However, it is possible to compare classes with the sample mean and have
Dow
nloa
ded
by [
INA
SP -
Pak
ista
n (P
ER
I)]
at 0
2:54
27
Mar
ch 2
014
1278 H. S. Dhindsa et al.
teachers reflect on whether they feel it is important to maintain or change theseperceptions.
While comparing the data of various groups of students, using Cohen’s classifica-tion of effect size, some of the differences were treated as of little educationalimportance. The readers should be careful when considering these results because ina complex situation like this where assessment variables and other learning variablesinteract with each other, these small differences could play significant roles (seeRennie, 1998).
This research is different from most other research into assessment. It does notfocus on particular assessment techniques, like many other studies into students’views about assessment (Falchikov, 2004; McDonald & Bond, 2003), but ratherexamines their perceptions of the process of assessment. In fact, much previousresearch examines the impact of student peer-assessment on learning. How teachersrespond to these perceptions will be varied. Some teachers will accept them as is andtry to teach students in somewhat mechanistic ways that will reinforce these percep-tions. Other teachers will endeavour to make changes to how students perceive theassessment process. As the United Nations Convention on Children’s Rights infers,these teachers will engage students in the assessment process and will give thesestudents a voice that will illuminate students’ perceptions of assessment. There willbe students who believe that the assessment process is detached from them and thatthe student should have no input into the process. One could then examine whetherinvolving the students in the process does change their views. The fact that thispaper shows differences among various ethnic groups needs further elaboration. It ispossible that these differences are real, but does that mean that teaching approacheswill need to be addressed? It might be reflecting parental expectations and what theirsociety values as important. This possibility is beyond the scope of this study. It ispossible that these results are reflecting the cultural learning environment of thosestudents.
Acknowledgement
The authors want to acknowledge the cooperation of an Australian ResearchCouncil project entitled “Improving Assessment in Science through the Use ofStudents’ Perceptions” conducted by Professor Darrell Fisher (Curtin Universityof Technology, Perth, Australia), Associate Professor Bruce Waldrip (University ofSouthern Queensland, Australia), and Associate Professor Jeff Dorman (AustralianCatholic University, Brisbane, Australia).
References
Biggs, J. (1998). Assessment and classroom learning: a role for summative assessment? Assessmentin Education, 5(1), 103–110.
Black, P., & William, D. (1998). Assessment and classroom learning. Assessment in Education, 5(1),7–74.
Dow
nloa
ded
by [
INA
SP -
Pak
ista
n (P
ER
I)]
at 0
2:54
27
Mar
ch 2
014
Science Students’ Perceptions of Assessment 1279
Brookhart, S. M. (1999). The art and science of classroom assessment: The missing part ofpedagogy. ASHE-ERIC Higher Education Report, 27(1), 7–13.
Centre for Educational Research and Innovation. (2005). Formative assessment. Improving learningin secondary classrooms. Paris, France: OECD publications.
Cohen, J. (1969). Statistical power analysis for behavioural sciences. New York: Academic Press.Crooks, T. J. (1988). The impact of classroom evaluation practices on students. Review of
Educational Research, 58, 438–481.Darling-Hammond, L. (1999). Target time toward teachers. Journal of Staff Development,
Spring, 20(2). Retrieved April 27, 2005, from http://www.nsdc.org/library/publications/jsd/darling202.cfm
Dhindsa, H. S. (2005). Cultural learning environment of upper secondary science students.International Journal of Science Education, 27(5), 575–592.
Dhindsa, H. S., & Fraser, B. J. (2004). Socio-cultural factors of pre-service teachers’ learningenvironments. Learning Environment Research: An International Journal, 7, 165–181.
Falchikov, N. (2004). Improving assessment through student involvement: Practical solutions for higherand further education teaching and learning. London: Routledge.
Fisher, D. L., Waldrip, B. G., & Dorman, J. (2005, April). Student perceptions of assessment:Development and validation of a questionnaire. Paper presented at the Annual Meeting of theAmerican Educational Research Association, Montreal, Canada.
Flutter, J., & Rudduck, J. (2004). Supporting learning. London: Routledge Falmer.Goodrum, D., Hackling, M., & Rennie, L. (2001). The status and quality of teaching and learning in
Australian schools. Canberra, Australia: Department of Education, Training and Youth Affairs.Harlen, W. (2001). Teaching, learning & assessing science 5–12. London: Paul Chapman Publishing.Hobden, P. (1998). The role of routine problems in science teaching. In B. Fraser & K. Tobin (Eds.),
International handbook of science education (pp. 219–232). Dordrecht, The Netherlands: Kluwer.Mavrommattis, Y. (1997). Understanding assessment in the classroom: Phases of the assessment
process—the assessment episode. Assessment in Education, 4(3), 381–399.McDonald, B., & Bond, D. (2003). The impact of self-assessment on achievement: The effects of
self-assessment training on performance in external examinations. Assessment in Education:Principles, Policy & Practice, 10(2), 209–221.
Mcintyre, A. M., Pedder, D., & Reay, D. (2003). Consultation in the classroom: Pupil perspectives onteaching and learning. Cambridge, UK: Pearson Publishing.
Mintzes, J. J., Wandersee, J. H., & Novak, J. D. (1999). Assessing science understanding. A humanconstructivist view. San Diego, CA: Academic Press.
Plake, B. S. (1993). Teacher assessment literacy: Teachers’ competencies in the educationalassessment of students. Mid-Western Educational Researcher, 6, 21–27.
Popham, W. J. (1997). Consequential validity: Right concern–wrong concept. EducationalMeasurement: Issues and Practice, 16(2), 9–13.
Radnor, H. (1996). Evaluation of key stage3 assessment in 1995 and 1996. Research report,University of Exeter, England.
Rennie, L. J. (1998). Improving the interpretation and reporting of quantitative research. Journalof Research in Science Teaching, 35, 237–248.
Reynolds, D. S., Doran, R. L., Allers, R. H., & Agruso, S. A. (1995). Alternative assessment inscience: A teacher’s guide. Buffalo, NY: University of Buffalo.
Rogoff, B. (2001, September 14). Student assessment for the information age. The Chronicle ofHigher Education, 48(3), B17.
Sambell, K., McDowell, L., & Brown, S. (1997). But is it fair?: An exploratory study of studentperceptions of the consequential validity of assessment. Studies in Educational Evaluation,23(4), 349–371.
Schaffner, M., Burry-Stock, J. A., Cho, G., Boney, T., & Hamilton, G. (2000, April). What do kidsthink when their teachers grade? Paper presented at the Annual Meeting of the AmericanEducational Research Association, New Orleans, LA.
Dow
nloa
ded
by [
INA
SP -
Pak
ista
n (P
ER
I)]
at 0
2:54
27
Mar
ch 2
014
1280 H. S. Dhindsa et al.
She, H., & Fisher, D. (2002). Teacher communication behaviour and its association withstudents’ cognitive and attitudinal outcomes in science in Taiwan and Australia. Journal ofResearch in Science Teaching, 39, 63–78.
Smith. K. (2000). Negotiating assessment with secondary school pupils. In M. P. Breen & A.Littlejohn (Eds.), Classroom decision-making. Negotiating and process syllabuses in practice(pp. 55–62). Cambridge, UK: Cambridge University Press.
Steinberg, J. (2000, December 22). Student failure causes states to retool testing programs. TheNew York Times, p. A1.
Stern, L., & Ahlgren, A. (2002) Analysis of students’ assessments in middle school curriculummaterials: Aiming precisely at benchmarks and standards. Journal of Research in ScienceTeaching, 39, 889–910.
Stiggins, R. (1994). Student-centered classroom assessment. Ontario, Canada: Macmillan CollegePublishing Co.
United Nations. (1989). Convention of the Rights of the Child. Geneva, Switzerland: Office of theUnited Nations High Commissioner for Human Rights.
WFB. (2006). The world fact book. Retrieved June 5, 2006, from http://www.cia.gov/cia/publications/factbook/geos/bx.html
Wilson, M. R., & BertenthaL, M. W. (2005). Systems for state science assessment. Washington, DC:National Academies Press.
Dow
nloa
ded
by [
INA
SP -
Pak
ista
n (P
ER
I)]
at 0
2:54
27
Mar
ch 2
014