Embed Size (px)
Citation preview
The Behavioural Insights Team
Update Report 2015-16

2
Update Report 2015-16
© Behavioural Insights Ltd. Not to be reproduced without the permission of the Behavioural Insights Team © Behavioural Insights Ltd. Not to be reproduced without the permission of the Behavioural Insights Team© Behavioural Insights Ltd. Not to be reproduced without the permission of the Behavioural Insights Team
3
Update Report 2015-16
© Behavioural Insights Ltd. Not to be reproduced without the permission of the Behavioural Insights Team
Contents
Forewords 4
Rt. Hon. Ben Gummer, Minister for the Cabinet OfficeSir Jeremy Heywood, Cabinet Secretary and Head of the Civil Service
Executive Summary 6
1. Health and Wellbeing 11
2. Education and Skills 19
3. Home Affairs 29
4. Energy, Sustainability and Consumers 38
5. Growth, Employment and Productivity 45
6. Giving and Social Action 50
7. Reducing Fraud, Error and Debt 55
8. Manchester, Local and Devolved Authorities 59
9. International Programmes 67
10. Australia 74
11. North America 81
12. Singapore 89
Conclusion 94
Endnotes 96
© Behavioural Insights Ltd. Not to be reproduced without the permission of the Behavioural Insights Team © Behavioural Insights Ltd. Not to be reproduced without the permission of the Behavioural Insights Team
4
Update Report 2015-16
© Behavioural Insights Ltd. Not to be reproduced without the permission of the Behavioural Insights Team © Behavioural Insights Ltd. Not to be reproduced without the permission of the Behavioural Insights Team
To govern is to serve: we build the foundations – security, a legal system, education, infrastructure, health services, social protection – on which people build their lives. Traditionally, that relationship is mediated through legislation, legislation devised according to an educated guess at how people will respond. Too often that guess is wrong: we have to return to problems we thought had been solved or to correct perverse outcomes that were not anticipated at the beginning. Perhaps most importantly, opportunities were missed to achieve a policy end without the need for writing new law.
Herein lies the strength of the Behavioural Insights Team (BIT). By employing behavioural evidence and empirically-based research, BIT can help ensure that where possible we deliver policy aims by working with the way that people live their lives, rather than interposing – often to little effect – with the crude armoury of the legislating state; and where legislation is necessary, BIT can help ensure that it is designed correctly so that is has the greatest chance of achieving its desired ends.
If you want proof of BIT’s success, look no further than the fact that even though it was only established in 2010, it is now a central part of how government goes about its business. So successful is it that its services are now purchased by other governments and organisations around the world. That work, both in the UK and abroad, has grown even in the last year – in complexity, scale and importance – as this report amply reflects.
We can be very proud that the Behavioural Insights Team is a creation of this government, this Civil Service and this country. It has grown to become a recognised world-leader in helping governments better help the people we are elected to serve. This report illustrates that remarkable journey and points to the still more considerable achievements that lie ahead.
Ben Gummer
Rt. Hon. Ben Gummer, Minister for the Cabinet Office
Foreword
5
Update Report 2015-16
© Behavioural Insights Ltd. Not to be reproduced without the permission of the Behavioural Insights Team
In September last year I spoke at the Behavioural Exchange conference hosted by the Behavioural Insights Team (BIT). There were 90 speakers, including Daniel Kahneman, Richard Thaler and Steven Pinker; and 900 delegates representing more than 30 different countries, including 200 people from UK government departments.
In my remarks, I explained how and why the UK has embraced the use of behavioural science. A number of the world-leading academics in attendance mentioned that, while many of the academic findings from the behavioural science field originate from US research, the UK Government was now considered to be the global leader in application of the field.
When you read this report you will see why. It shows how almost every government department is now using behavioural science to help improve the way that public services are run or policies are delivered. It also shows how the scale and level of ambition have risen over the years – something that I have seen first hand as the chair of the Commissioning Board that sets BIT’s priorities for its UK government work.
This report shows how the early work that BIT started with HMRC to reduce fraud, error and debt has been just as effective in countries around the world. In Costa Rica, it’s helping to treble tax declarations rates. Similar interventions in Poland helped increase payments by 17 per cent. The thinking behind these interventions is now underpinning the Foreign Office’s strategy towards tackling corruption around the world.
Similarly, this report shows how behavioural insights can be used in targeted areas, from encouraging doctors to reduce the number of antibiotics they prescribe, to encouraging young learners to persist with their studies. But it also illustrates how behavioural insights can be used to inform system design, such as reshaping markets to work better for vulnerable consumers, or refashioning government procurement platforms to make them more ‘intuitive’ to use, saving money in the process.
Chairing the BIT’s Commissioning Board and learning about some of these low or no cost, high-impact, policy interventions, remains one of my most interesting, and often enjoyable, responsibilities as Cabinet Secretary. BIT has brought a fresh and empirical lens to thinking about the challenges we face. It also illustrates a wider point: that governments and public services must – and can – be innovative, creative, and person-centred, yet also pragmatic, fleet-of-foot, and literally experimental, testing and learning all the time. I’m proud that the UK Civil Service has produced such an institution, and delighted to see its work being taken up across the public sector and the world.
Jeremy Heywood
Sir Jeremy Heywood, Cabinet Secretary and Head of the Civil Service
Foreword
6
Update Report 2015-16
© Behavioural Insights Ltd. Not to be reproduced without the permission of the Behavioural Insights Team © Behavioural Insights Ltd. Not to be reproduced without the permission of the Behavioural Insights Team
Introduction
The Behavioural Insights Team (BIT) exists to achieve social impact by introducing a more realistic model of human behaviour to policy making. This report summarises the range and impact of BIT’s work over the past 12 months. In addition to the projects we have undertaken with the UK government, the report provides summaries of work conducted by our offices in Sydney, New York, and Singapore.
Health and Wellbeing
Over the past year, BIT’s health work has grown in ambition and impact. This report sets out the results from several large scale trials, including our work on antimicrobial resistance. This showed that informing doctors that they are prescribing more antibiotics relative to 80 per cent of their medical peers, reduces the number of unnecessary prescriptions by 3.3 per cent (more than 73,000 prescriptions) – helping to address what the Chief Medical Officer has identified as perhaps the greatest medical threat of our age.
We present the findings from our Counting Calories paper, which fundamentally re-examines the way that official statistics measure calorie consumption, itself part of our wider programme of work with Public Health England and others to make it easier for citizens to live healthier lives. And we explain the new ways in which BIT has applied behavioural insights to healthcare systems - for example through our innovative work on procurement.
Education and Skills
BIT has now run a variety of interventions in educational settings. In this report we set out findings from some of the largest trials ever run in Further Education (FE) Colleges. The two year ‘Alert’ trial showed that regular text messages designed to encourage learners to keep going increased pass rates by 12 per cent. A trial that sought to improve learners’ ‘grit’ via a set of online modules increased attendance rates by nearly 10 per cent. And the ‘Study Support’ trial, in which learners nominate two people to help them, increased FE College attendance by 11 per cent.
We also explain the work BIT is undertaking on apprenticeship policy, and the research we have undertaken on young people’s study and career options. Alongside this policy work we set out new findings from trials with employers. In one trial we sent CVs containing different qualifications to job advertisements. We then measured which were most likely to get a response. Including Functional Skills increases responses by more than 50 per cent; while including GCSEs more than doubles responses.
David Halpern, Chief Executive of BIT and National Advisor on ‘What Works’
Owain Service, Managing Director of BIT
Executive Summary
7
Update Report 2015-16
© Behavioural Insights Ltd. Not to be reproduced without the permission of the Behavioural Insights Team
Home Affairs
The report covers new findings from our work with the Home Office, police and local authorities in relation to crime and policing. This includes the latest version of the Mobile Phone Theft Index, whose aim is to inform consumers and to encourage manufacturers’ efforts to improve security. This year’s Index shows that the HTC M8 phone is now the most targeted phone in London, closely followed by the Samsung Galaxy S6 Edge.
We also present the results from our analysis of inappropriate calls received by the police. One of the most intriguing findings from the analysis is that even a very slight pause in answering leads to a dramatic reduction in the proportion of inappropriate calls. For example, after a 3 second pause, the number of inappropriate calls is cut by a half; and after 6 seconds they are reduced by almost 90 per cent. Analysis like this could help police to respond more rapidly to citizens who most need assistance.
Energy, Sustainability and Consumers
Our work on consumers, energy and sustainability has continued to have a strong focus on helping people to save energy (and money). The first stage of our evaluations of Nest ‘smart thermostats’ have shown very promising early results, and the Department of Business, Energy and Industrial Strategy (BEIS) has launched a new programme of evaluations to test alternatives to in-home displays in smart meters.
Meanwhile, we have published a new report (with Citizens Advice) on what behavioural science might add to our understanding of how to regulate consumer markets. The report argues that regulators should be designing remedies with ‘behavioural market failures’ at the forefront of their thinking. Such behaviourally-based remedies can greatly improve market functioning: lowering costs, improving quality, and particularly, protecting more vulnerable consumers.
Productivity and Growth
We have a long running programme of work on productivity and growth. Many of these initiatives need time for their results to emerge. In this year’s report we are sharing the details of several new projects that we think will be of widespread interest, including some of the first trials aimed at addressing the role of ‘animal spirits’ in the economy – swings between over-optimism and excessive pessimism by business and consumers, that can lead to bubbles on the one hand, or ‘irrationally’ choke off growth on the other.
We also detail the work that we have done in relation to reducing implicit bias in recruitment practices. This includes the new online platform that we have built – Applied – which enables organisations to use these insights to reduce bias, and increase predictive accuracy in recruitment.
8
Update Report 2015-16
© Behavioural Insights Ltd. Not to be reproduced without the permission of the Behavioural Insights Team © Behavioural Insights Ltd. Not to be reproduced without the permission of the Behavioural Insights Team
Giving and Social Action
We have many new findings relating to giving and social action. This includes a series of trials on Youth Social Action Fund interventions, which show that such programmes help to improve participants’ skills for work and life compared with those who do not attend the programmes.
We set out results from work with the National Citizen Service (NCS) that tested the most effective ways of encouraging young people to sign up to the programme. The preliminary findings show that introductory videos showcasing the activities of NCS alumni increase expressions of interest in participation in the programme by 32 per cent.
Reducing Fraud, Error and Debt
In this year’s report, we are including several results from new work with HMRC. The first group of trials demonstrates the impact of different letters helping to prevent people incurring tax debts and fines by prompting individuals before the payment deadline. SMS messages that gave feedback to those who had been late before increased subsequent payment rates by nearly 50 per cent.
We also present results from a set of trials that seek to change the behaviour of corporations that fail to pay their tax on time. These show that simple changes in communications can help and encourage them to pay what they owed. For example, a trial showed that a letter with a more educational content (containing helpful tips to make payment easier) increased payments by 15 per cent.
Manchester, Local and Devolved Government
In May 2016, BIT opened a new office in Manchester. The office will work directly with the Greater Manchester Combined Authority (GMCA), which will act as BIT’s new hub in the North of England. The initial work is likely to focus on improving the efficiency of services; and over time it will focus on more complex interventions in areas like health and social care.
Alongside this work in Manchester, we have conducted numerous trials with local authorities across England and Wales, on areas including Council Tax payment, social care charges and voter registration. A Council Tax trial in Medway showed that the use of social norms in letters increased payments by 11 per cent (and would lead to £2 million being brought forward if rolled out). Changes to social care statement letters in Surrey increased payments amongst those who had just started receiving adult social care by 32 per cent.
9
Update Report 2015-16
© Behavioural Insights Ltd. Not to be reproduced without the permission of the Behavioural Insights Team
International Programmes
Over the past year, we have expanded the number, range and ambition of overseas programmes that we support from the UK. Our tax compliance work has shown impressive results in Costa Rica and Poland. In Costa Rica, for example, behavioural reminders nearly tripled the rates of declarations. The new letters in Poland increased payments by 17 per cent, which would have brought forward $1.1 million of additional tax revenue if they had been sent to all taxpayers. The work with tax authorities is now being expanded through a new programme with the Global Innovation Fund.
We have begun projects that are tackling more entrenched behaviours – such as maternal health in Mexico, medical adherence in Moldova, and a new programme of work on anti-corruption in the wake of the Prime Minister’s summit in May 2016.
Australia
One of BIT’s longest and most impactful global partnerships is with the Government of New South Wales (NSW). BIT helped the Department for Premier and Cabinet (DPC) to create their own dedicated Behavioural Insights Unit (BIU) from 2012. BIT continues to support the New South Wales team, whose work was recognised internationally when it was awarded the ‘Global Practitioners Award’ at last September’s Behavioural Exchange conference.
Alongside findings from the partnership with New South Wales Department of Premier and Cabinet, we report on trials BIT has conducted with other partners, including VicHealth and Movember. One trial, using FitBit activity trackers, showed that giving more personalised feedback significantly increases levels of activity. And that this effect was most pronounced for the least active, who took 2,646 steps when given personalised feedback, but only 1,800 when given more generic feedback.
North America
In September 2015, BIT set-up a new office in New York. The first six months of activity have focused exclusively on supporting the Bloomberg Philanthropies ‘What Works Cities’ initiative. In this report, we set out the results from lots of the early trials across six US cities, all of which involve small changes to policies and processes that have had a disproportionate impact.
In Denver, postcard prompts helped increase by 8 per cent the number of people renewing their license plates online. In Chattanooga, behaviourally informed courtesy letters helped increase by 13 per cent the number of people paying their bills (and thereby avoid follow-up action). And in New Orleans, text message prompts helped encourage hundreds of people to book free doctors appointments.
10
Update Report 2015-16
© Behavioural Insights Ltd. Not to be reproduced without the permission of the Behavioural Insights Team © Behavioural Insights Ltd. Not to be reproduced without the permission of the Behavioural Insights Team
Singapore
In July 2016, BIT established a new office in Singapore. This builds on the programmes we have been running since 2012 with the Ministry of Manpower, and more recently with the Public Services Division of the Prime Minister’s Office. The new office will enable BIT to provide more on-the-ground support to the Singaporean Civil Service.
Our findings from trials run over the past year show that simplifying and pre-committing individuals to appointments for retirement savings advice more than doubled attendance rates. Changing the parking fines webpage, including through the use of social norms, can reduce unnecessary appeals by 13.7 per cent.
Conclusion
It has been another exciting year for the field of behavioural insights, which is now becoming more mainstream across the UK Civil Service and increasingly, amongst governments around the world. Not only are we now seeing behavioural insights being applied in more areas, but we are also seeing the development of more complex interventions and evaluations. This report illustrates these changes. But it also offers insights into where we might go next, to help have even greater social impact over the coming months and years.
Finally, we include in the report interventions that did not work too: where the effect of the intervention was no better than the control group. It is as important to know what does not work, as well as what does. Understandably, governments – and even academics – often worry about publishing ‘null results’. But we believe it is much better to establish that an intervention or change does not work on a small scale, rather than blindly leap to implementation on a larger or national scale. We hope that the lead that BIT has taken on this practice will help to make it easier for others to do the same.
11
Update Report 2015-16
© Behavioural Insights Ltd. Not to be reproduced without the permission of the Behavioural Insights Team
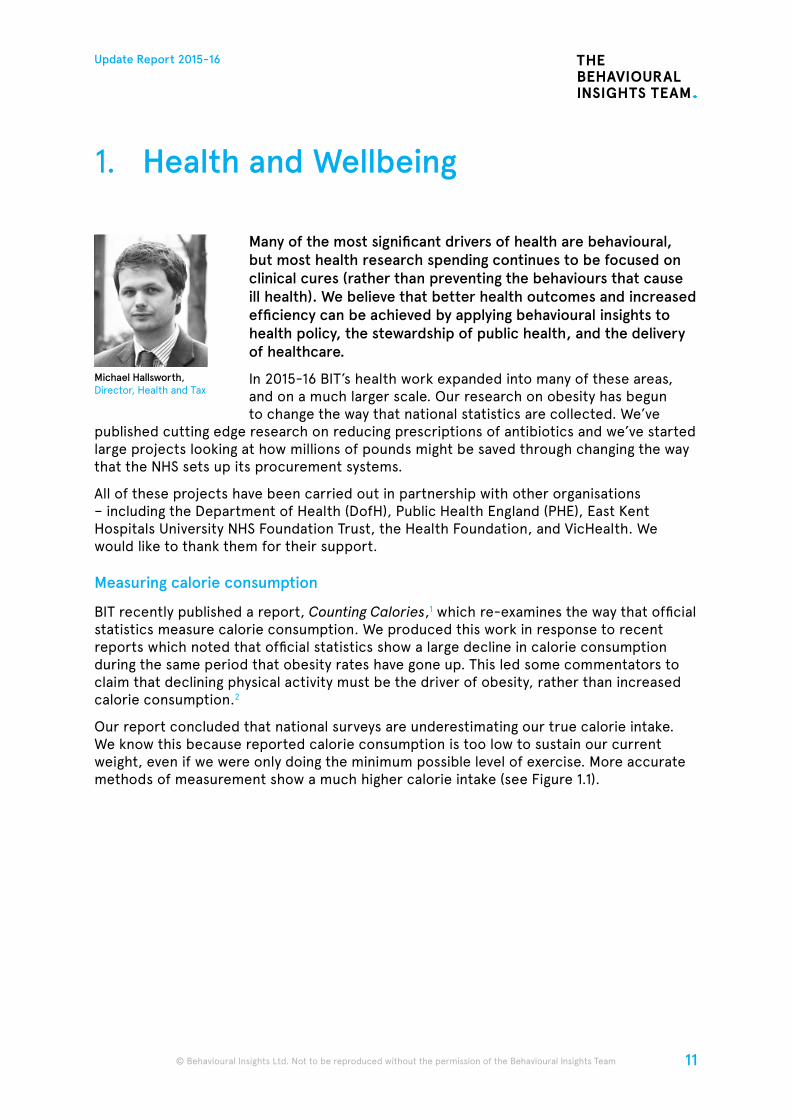
Many of the most significant drivers of health are behavioural, but most health research spending continues to be focused on clinical cures (rather than preventing the behaviours that cause ill health). We believe that better health outcomes and increased efficiency can be achieved by applying behavioural insights to health policy, the stewardship of public health, and the delivery of healthcare.
In 2015-16 BIT’s health work expanded into many of these areas, and on a much larger scale. Our research on obesity has begun to change the way that national statistics are collected. We’ve
published cutting edge research on reducing prescriptions of antibiotics and we’ve started large projects looking at how millions of pounds might be saved through changing the way that the NHS sets up its procurement systems.
All of these projects have been carried out in partnership with other organisations – including the Department of Health (DofH), Public Health England (PHE), East Kent Hospitals University NHS Foundation Trust, the Health Foundation, and VicHealth. We would like to thank them for their support.
Measuring calorie consumption
BIT recently published a report, Counting Calories,1 which re-examines the way that official statistics measure calorie consumption. We produced this work in response to recent reports which noted that official statistics show a large decline in calorie consumption during the same period that obesity rates have gone up. This led some commentators to claim that declining physical activity must be the driver of obesity, rather than increased calorie consumption.2
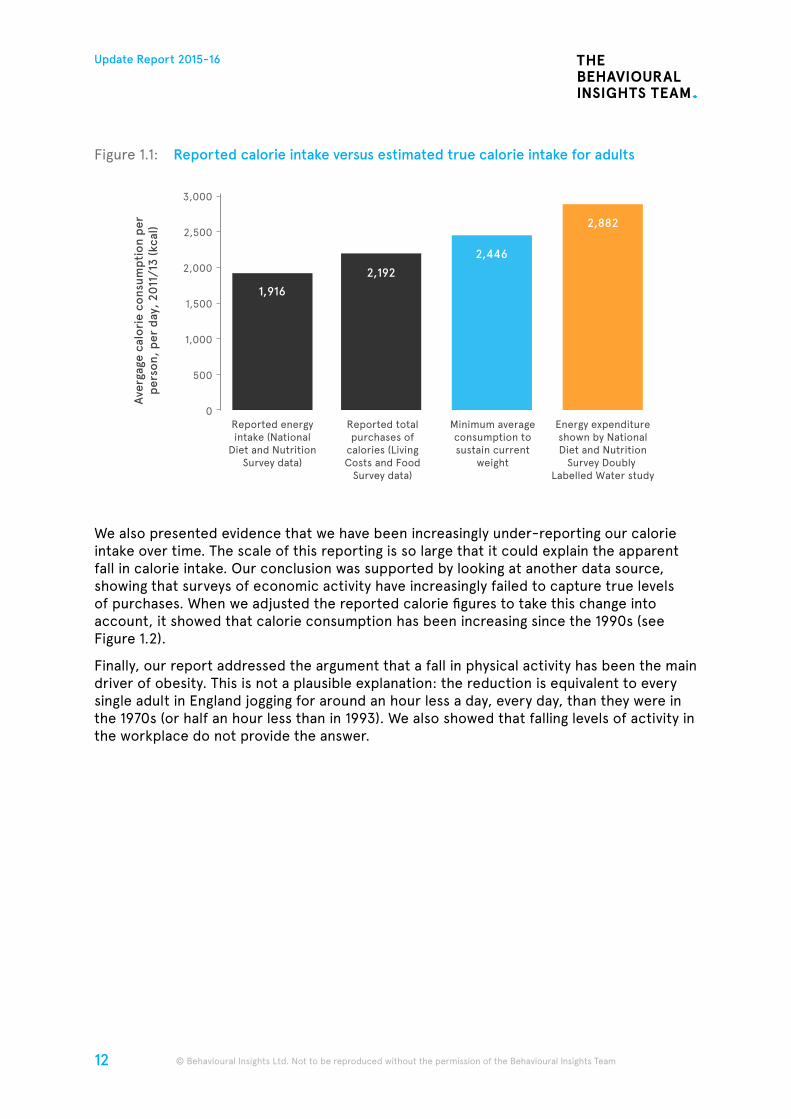
Our report concluded that national surveys are underestimating our true calorie intake. We know this because reported calorie consumption is too low to sustain our current weight, even if we were only doing the minimum possible level of exercise. More accurate methods of measurement show a much higher calorie intake (see Figure 1.1).
Michael Hallsworth, Director, Health and Tax
1. Health and Wellbeing
12
Update Report 2015-16
© Behavioural Insights Ltd. Not to be reproduced without the permission of the Behavioural Insights Team © Behavioural Insights Ltd. Not to be reproduced without the permission of the Behavioural Insights Team
Figure 1.1: Reported calorie intake versus estimated true calorie intake for adults
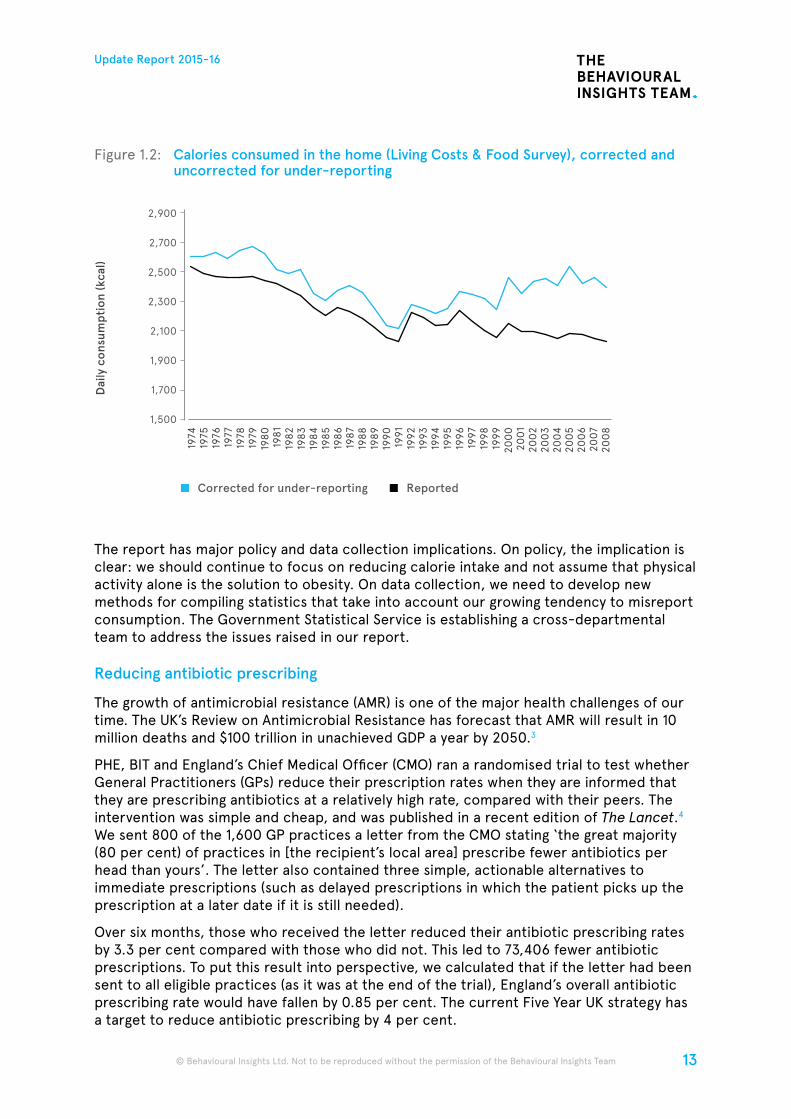
We also presented evidence that we have been increasingly under-reporting our calorie intake over time. The scale of this reporting is so large that it could explain the apparent fall in calorie intake. Our conclusion was supported by looking at another data source, showing that surveys of economic activity have increasingly failed to capture true levels of purchases. When we adjusted the reported calorie figures to take this change into account, it showed that calorie consumption has been increasing since the 1990s (see Figure 1.2).
Finally, our report addressed the argument that a fall in physical activity has been the main driver of obesity. This is not a plausible explanation: the reduction is equivalent to every single adult in England jogging for around an hour less a day, every day, than they were in the 1970s (or half an hour less than in 1993). We also showed that falling levels of activity in the workplace do not provide the answer.
1,500
1,000
500
3,000
2,000
2,500
Ave
rgag
e ca
lori
e co
nsum
ptio
n pe
rpe
rson
, per
day
, 20
11/1
3 (k
cal)
0Reported energyintake (National
Diet and NutritionSurvey data)
Reported totalpurchases of
calories (LivingCosts and Food
Survey data)
Minimum averageconsumption tosustain current
weight
Energy expenditureshown by NationalDiet and Nutrition
Survey Doubly Labelled Water study
1,916
2,192
2,446
2,882
13
Update Report 2015-16
© Behavioural Insights Ltd. Not to be reproduced without the permission of the Behavioural Insights Team
Figure 1.2: Calories consumed in the home (Living Costs & Food Survey), corrected and uncorrected for under-reporting
The report has major policy and data collection implications. On policy, the implication is clear: we should continue to focus on reducing calorie intake and not assume that physical activity alone is the solution to obesity. On data collection, we need to develop new methods for compiling statistics that take into account our growing tendency to misreport consumption. The Government Statistical Service is establishing a cross-departmental team to address the issues raised in our report.
Reducing antibiotic prescribing
The growth of antimicrobial resistance (AMR) is one of the major health challenges of our time. The UK’s Review on Antimicrobial Resistance has forecast that AMR will result in 10 million deaths and $100 trillion in unachieved GDP a year by 2050.3
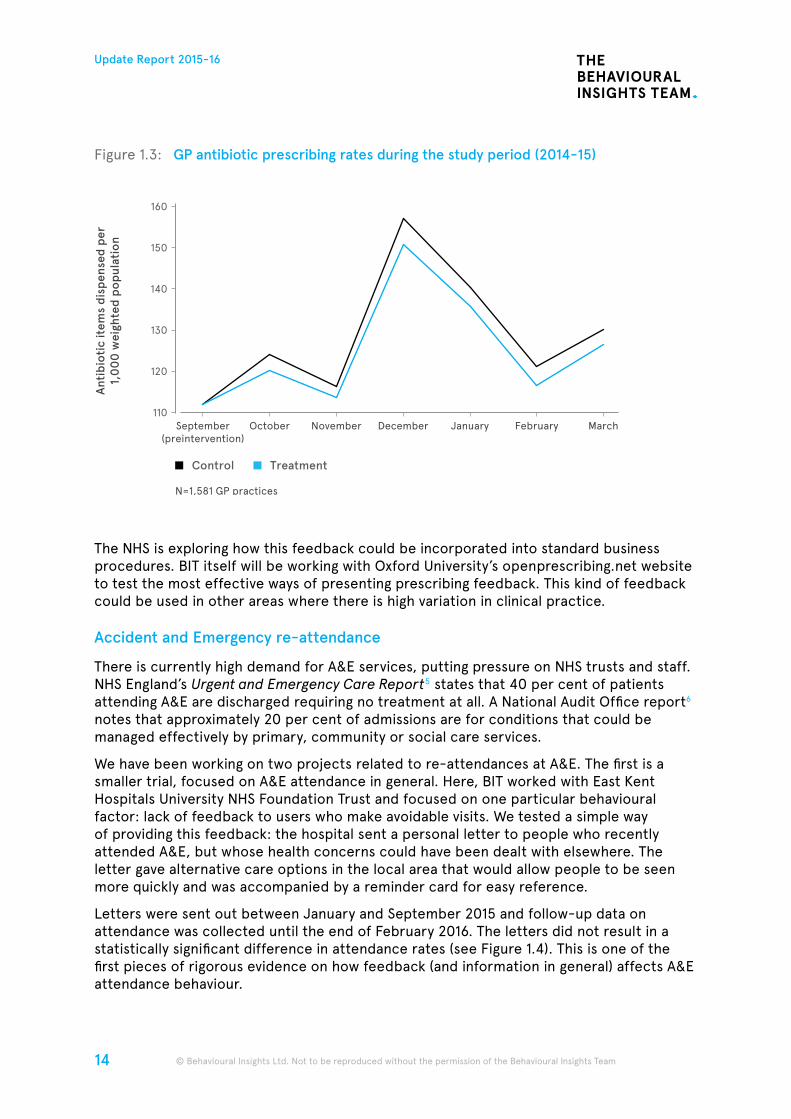
PHE, BIT and England’s Chief Medical Officer (CMO) ran a randomised trial to test whether General Practitioners (GPs) reduce their prescription rates when they are informed that they are prescribing antibiotics at a relatively high rate, compared with their peers. The intervention was simple and cheap, and was published in a recent edition of The Lancet.4 We sent 800 of the 1,600 GP practices a letter from the CMO stating ‘the great majority (80 per cent) of practices in [the recipient’s local area] prescribe fewer antibiotics per head than yours’. The letter also contained three simple, actionable alternatives to immediate prescriptions (such as delayed prescriptions in which the patient picks up the prescription at a later date if it is still needed).
Over six months, those who received the letter reduced their antibiotic prescribing rates by 3.3 per cent compared with those who did not. This led to 73,406 fewer antibiotic prescriptions. To put this result into perspective, we calculated that if the letter had been sent to all eligible practices (as it was at the end of the trial), England’s overall antibiotic prescribing rate would have fallen by 0.85 per cent. The current Five Year UK strategy has a target to reduce antibiotic prescribing by 4 per cent.
1974
1975
1976
1977
1978
1979
1980
1981
1982
1983
1984
1985
1986
1987
1988
1989
1990
1991
1992
1993
1994
1995
1996
1997
1998
1999
200
020
01
200
220
03
200
420
05
200
620
07
200
8
Dai
ly c
onsu
mpt
ion
(kca
l)
Corrected for under-reporting Reported
1,500
1,700
1,900
2,100
2,300
2,500
2,900
2,700
14
Update Report 2015-16
© Behavioural Insights Ltd. Not to be reproduced without the permission of the Behavioural Insights Team © Behavioural Insights Ltd. Not to be reproduced without the permission of the Behavioural Insights Team
Figure 1.3: GP antibiotic prescribing rates during the study period (2014-15)
The NHS is exploring how this feedback could be incorporated into standard business procedures. BIT itself will be working with Oxford University’s openprescribing.net website to test the most effective ways of presenting prescribing feedback. This kind of feedback could be used in other areas where there is high variation in clinical practice.
Accident and Emergency re-attendance
There is currently high demand for A&E services, putting pressure on NHS trusts and staff. NHS England’s Urgent and Emergency Care Report5 states that 40 per cent of patients attending A&E are discharged requiring no treatment at all. A National Audit Office report6 notes that approximately 20 per cent of admissions are for conditions that could be managed effectively by primary, community or social care services.
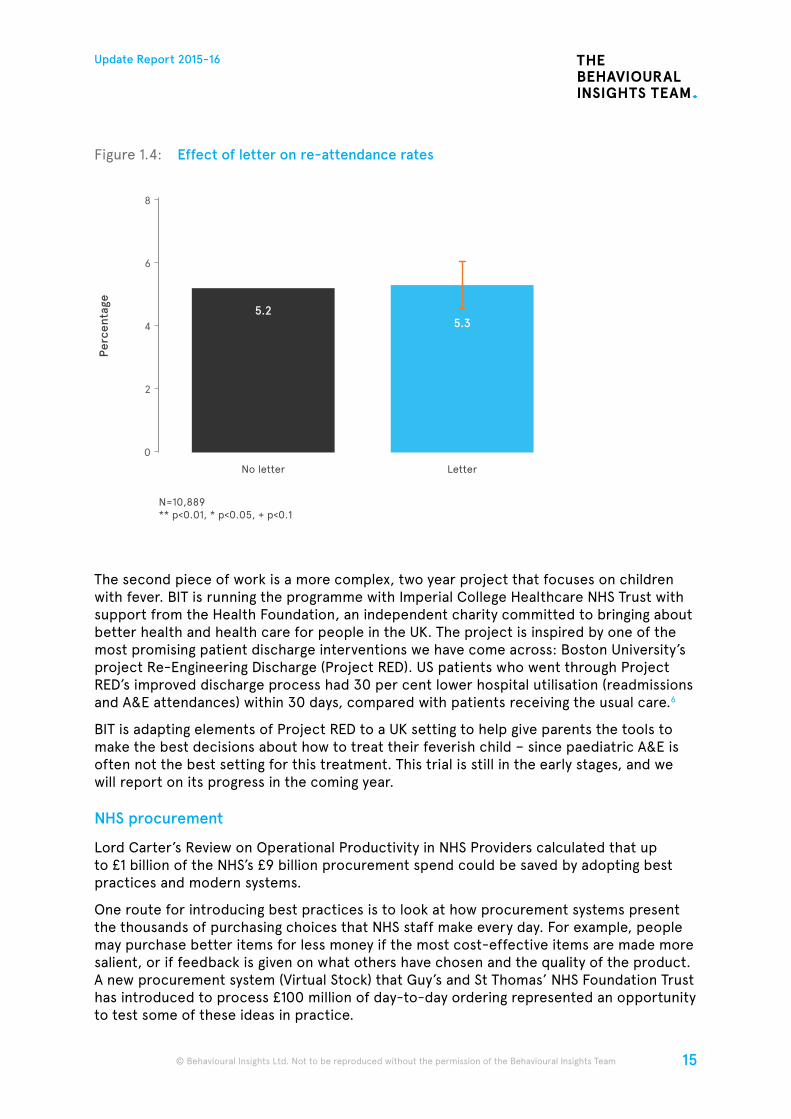
We have been working on two projects related to re-attendances at A&E. The first is a smaller trial, focused on A&E attendance in general. Here, BIT worked with East Kent Hospitals University NHS Foundation Trust and focused on one particular behavioural factor: lack of feedback to users who make avoidable visits. We tested a simple way of providing this feedback: the hospital sent a personal letter to people who recently attended A&E, but whose health concerns could have been dealt with elsewhere. The letter gave alternative care options in the local area that would allow people to be seen more quickly and was accompanied by a reminder card for easy reference.
Letters were sent out between January and September 2015 and follow-up data on attendance was collected until the end of February 2016. The letters did not result in a statistically significant difference in attendance rates (see Figure 1.4). This is one of the first pieces of rigorous evidence on how feedback (and information in general) affects A&E attendance behaviour.
Ant
ibio
tic
item
s di
spen
sed
per
1,0
00
wei
ghte
d po
pula
tion
Control Treatment
110
120
130
140
160
150
OctoberSeptember(preintervention)
N=1,581 GP practices
November December January February March
15
Update Report 2015-16
© Behavioural Insights Ltd. Not to be reproduced without the permission of the Behavioural Insights Team
Figure 1.4: Effect of letter on re-attendance rates
The second piece of work is a more complex, two year project that focuses on children with fever. BIT is running the programme with Imperial College Healthcare NHS Trust with support from the Health Foundation, an independent charity committed to bringing about better health and health care for people in the UK. The project is inspired by one of the most promising patient discharge interventions we have come across: Boston University’s project Re-Engineering Discharge (Project RED). US patients who went through Project RED’s improved discharge process had 30 per cent lower hospital utilisation (readmissions and A&E attendances) within 30 days, compared with patients receiving the usual care.6
BIT is adapting elements of Project RED to a UK setting to help give parents the tools to make the best decisions about how to treat their feverish child – since paediatric A&E is often not the best setting for this treatment. This trial is still in the early stages, and we will report on its progress in the coming year.
NHS procurement
Lord Carter’s Review on Operational Productivity in NHS Providers calculated that up to £1 billion of the NHS’s £9 billion procurement spend could be saved by adopting best practices and modern systems.
One route for introducing best practices is to look at how procurement systems present the thousands of purchasing choices that NHS staff make every day. For example, people may purchase better items for less money if the most cost-effective items are made more salient, or if feedback is given on what others have chosen and the quality of the product. A new procurement system (Virtual Stock) that Guy’s and St Thomas’ NHS Foundation Trust has introduced to process £100 million of day-to-day ordering represented an opportunity to test some of these ideas in practice.
2
8
4
6
0
Perc
enta
ge
No letter
N=10,889** p<0.01, * p<0.05, + p<0.1
Letter
5.25.3
16
Update Report 2015-16
© Behavioural Insights Ltd. Not to be reproduced without the permission of the Behavioural Insights Team © Behavioural Insights Ltd. Not to be reproduced without the permission of the Behavioural Insights Team
With support from the Health Foundation, BIT is running a set of trials with King’s College London that test the best ways of framing choices to reduce waste and improve efficiency. The trials are likely to include: using design features or prompts, social norm messages, informing purchasers of which products other people selected, the provision of cost and savings feedback, and the impact of providing product quality ratings. Alongside these trials we will assess the overall impact of introducing the new system in order to inform a possible wider roll-out of throughout the NHS. We will report on the progress of this project in next year’s Update Report.
Sugar-sweetened beverages in hospitals
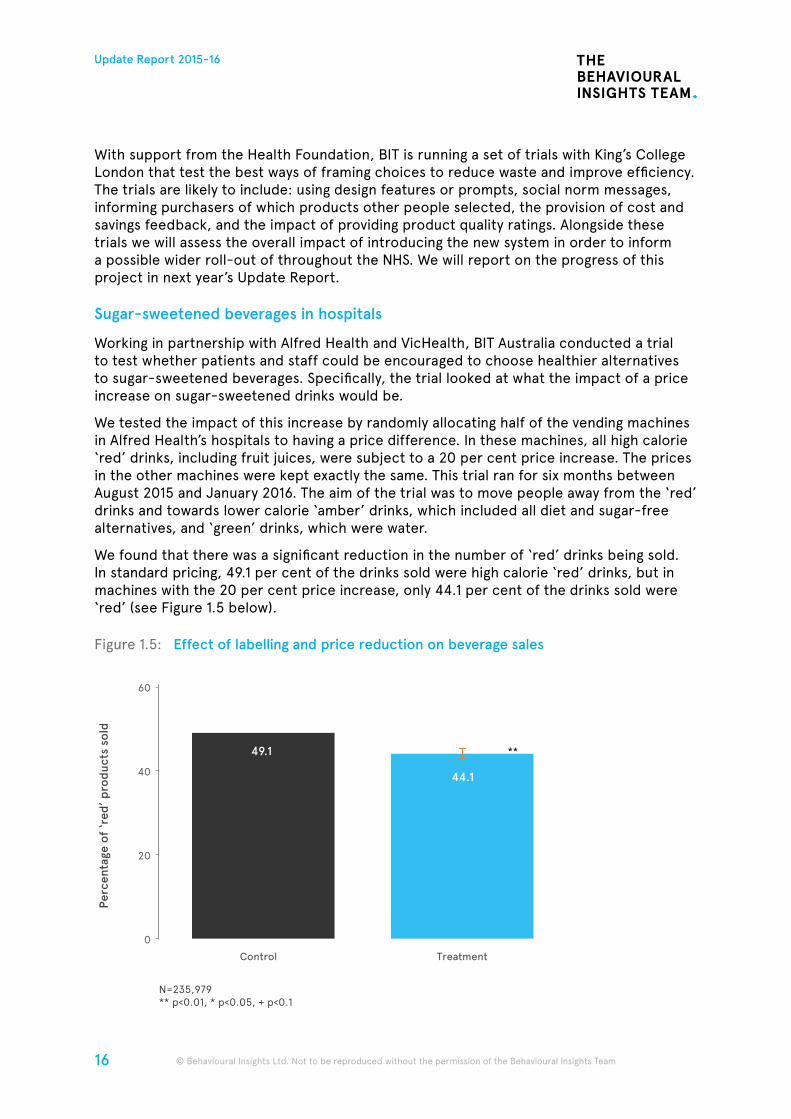
Working in partnership with Alfred Health and VicHealth, BIT Australia conducted a trial to test whether patients and staff could be encouraged to choose healthier alternatives to sugar-sweetened beverages. Specifically, the trial looked at what the impact of a price increase on sugar-sweetened drinks would be.
We tested the impact of this increase by randomly allocating half of the vending machines in Alfred Health’s hospitals to having a price difference. In these machines, all high calorie ‘red’ drinks, including fruit juices, were subject to a 20 per cent price increase. The prices in the other machines were kept exactly the same. This trial ran for six months between August 2015 and January 2016. The aim of the trial was to move people away from the ‘red’ drinks and towards lower calorie ‘amber’ drinks, which included all diet and sugar-free alternatives, and ‘green’ drinks, which were water.
We found that there was a significant reduction in the number of ‘red’ drinks being sold. In standard pricing, 49.1 per cent of the drinks sold were high calorie ‘red’ drinks, but in machines with the 20 per cent price increase, only 44.1 per cent of the drinks sold were ‘red’ (see Figure 1.5 below).
Figure 1.5: Effect of labelling and price reduction on beverage sales
20
60
40
0
Perc
enta
ge o
f ‘r
ed’ p
rod
ucts
sol
d
Control
N=235,979** p<0.01, * p<0.05, + p<0.1
Treatment
49.1
44.1
**
17
Update Report 2015-16
© Behavioural Insights Ltd. Not to be reproduced without the permission of the Behavioural Insights Team
We also investigated whether there was a significant impact on the total sales of drinks. We did not find a statistically significant difference in the total number of sales between the treatment and the control group. Interestingly, we did find that fewer litres of drinks overall were being consumed. This seemed to be driven by the fact that the 20 per cent price differential also had an effect on the size of drinks that were being purchased. Among the ‘red’ drinks, we found a significant decrease in sales for the larger products (costing more than $4) but a small increase in the sales for smaller products (which cost less than $4).
This trial was one of the many that BIT Australia conducted with VicHealth, the full details of which are set out in David Halpern’s final report: Behavioural Insights and Healthier Lives.8
Diabetes prevention
Type 2 diabetes is a growing problem in the UK and worldwide, and treatment costs of £8.8 billion a year account for just under 9 per cent of the annual NHS budget.9 There are currently 5 million people in England at high risk of developing Type 2 diabetes - but positive changes to lifestyle, including improved diet and greater levels of physical activity can help to prevent this happening.
Increasing physical activity is recommended by The National Institute for Health and Care Excellence (NICE) to prevent Type 2 diabetes in people at high risk.10 As a result, many local authorities provide free physical activity courses for people at risk. We wanted to see whether the impact of these programmes could be improved by enhancing them with motivational SMS messages (which would also be cheap to implement).
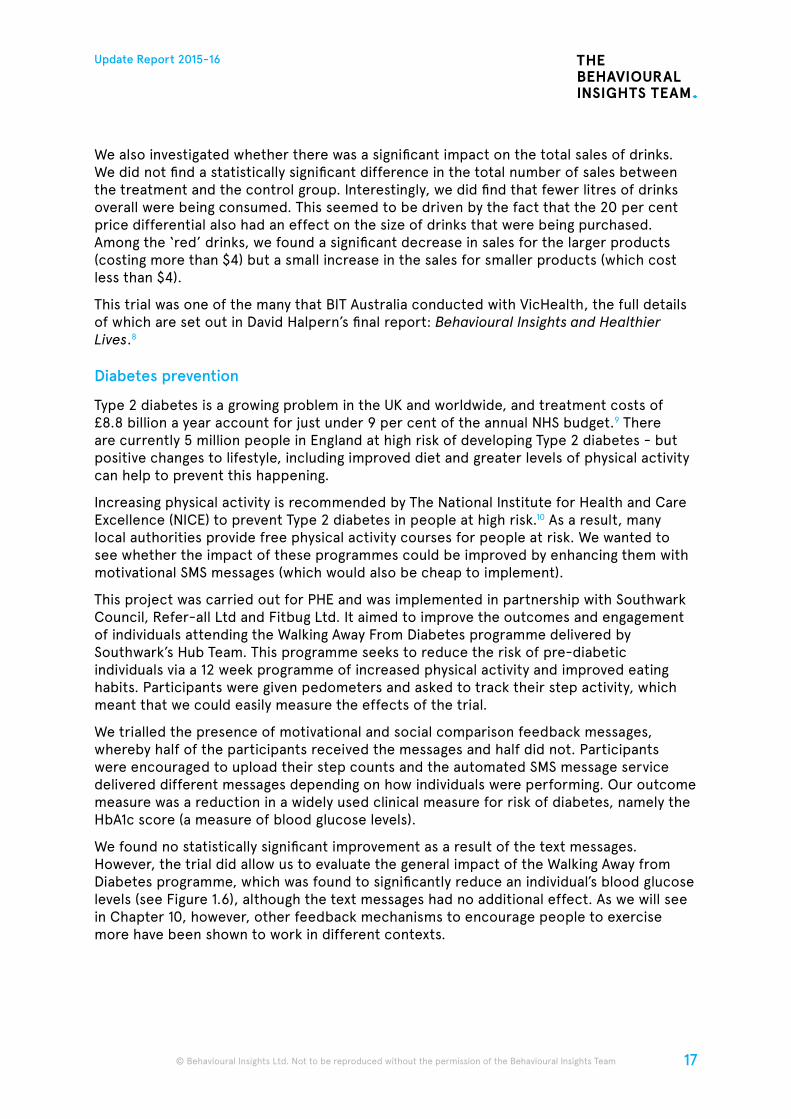
This project was carried out for PHE and was implemented in partnership with Southwark Council, Refer-all Ltd and Fitbug Ltd. It aimed to improve the outcomes and engagement of individuals attending the Walking Away From Diabetes programme delivered by Southwark’s Hub Team. This programme seeks to reduce the risk of pre-diabetic individuals via a 12 week programme of increased physical activity and improved eating habits. Participants were given pedometers and asked to track their step activity, which meant that we could easily measure the effects of the trial.
We trialled the presence of motivational and social comparison feedback messages, whereby half of the participants received the messages and half did not. Participants were encouraged to upload their step counts and the automated SMS message service delivered different messages depending on how individuals were performing. Our outcome measure was a reduction in a widely used clinical measure for risk of diabetes, namely the HbA1c score (a measure of blood glucose levels).
We found no statistically significant improvement as a result of the text messages. However, the trial did allow us to evaluate the general impact of the Walking Away from Diabetes programme, which was found to significantly reduce an individual’s blood glucose levels (see Figure 1.6), although the text messages had no additional effect. As we will see in Chapter 10, however, other feedback mechanisms to encourage people to exercise more have been shown to work in different contexts.
18
Update Report 2015-16
© Behavioural Insights Ltd. Not to be reproduced without the permission of the Behavioural Insights Team © Behavioural Insights Ltd. Not to be reproduced without the permission of the Behavioural Insights Team
Figure 1.6: HbA1c readings before and after the Walking Away From Diabetes programme
Realising the ValueAnother programme of work for BIT this year has been the Realising the Value project, a major collaboration between BIT and the Health Foundation, Nesta, Voluntary Voices, Newcastle University and PPL (an independent consultancy). The programme as a whole makes the case for adopting person- and community-centred approaches in the UK’s healthcare system. A key objective of Realising the Value is to change the relationship between citizens and the health system from one of passive patient to active participant.
One of the first outputs from this programme was a paper authored by BIT,11 which starts from the principle that person- and community-centred health and care approaches require a certain set of behaviours to be effective. It concluded that to introduce effective person- and community-centred programmes, we must first identify the relevant behaviours, understand their drivers and the barriers to achieving them and then propose evidence-based ways to facilitate these behaviours.
This paper was followed up by two toolkits which showed how these principles could be applied. The first provides practitioners, volunteers, carers and individual citizens with practical ways that people living with long term conditions can establish self-management behaviours and habits. The second was aimed at people working within the health and care system (whether in statutory bodies as practitioners or commissioners, or community and voluntary sectors) and summarises promising ways that person- and community-centred self-management approaches can be spread.
20
10
50
30
40
0
HbA
1c r
eadi
ngs
Pre
N=245** p<0.01, * p<0.05, + p<0.1
Post
**
42.443.6
19
Update Report 2015-16
© Behavioural Insights Ltd. Not to be reproduced without the permission of the Behavioural Insights Team
The last year has seen a huge growth in interest in the application of behavioural science to education and skills policy in the UK and in the rigorous use of evaluations to test and trial ‘what works’ in educational settings. Much of the credit for this change has to go to the Education Endowment Foundation (EEF), which more than any other organisation has helped to show how it is possible to run large scale evaluations in school settings.
BIT has also been at the forefront of this agenda, not least through the dedicated Behavioural Research Centre for Adult Skills and Knowledge (ASK) that we set up with backing from the Department
for Business, Innovation and Skills in September 2014. Last year, we reported some of the early findings from the small trials we had run through ASK in its first year. This year, we can report on some of the biggest trials ever run in the sector.
We are also conducting a number of projects with the then-Department for Business, Innovation and Skills, now Department for Education (DfE), on apprenticeship policy and with the Careers and Enterprise Company (CEC) on how young people make their study and career choices. This will ultimately result in behavioural science influencing policy in these important areas in the future.
Adult Learner Engagement and Retention
One of the major reasons for creating ASK was to enhance our understanding of interventions that might help adults to become more literate and numerate.
In our previous Update Report, we gave interim results for a trial that aimed to improve attendance rates at adult numeracy and literacy classes by sending learners weekly text messages. We called this ALERT (the Adult Learner Engagement and Retention Trial). These messages were designed to encourage learners to keep going even if they were struggling with the material and to create a sense of social belonging in their college. The interim results showed that after three weeks these weekly messages increased attendance compared to the control group.
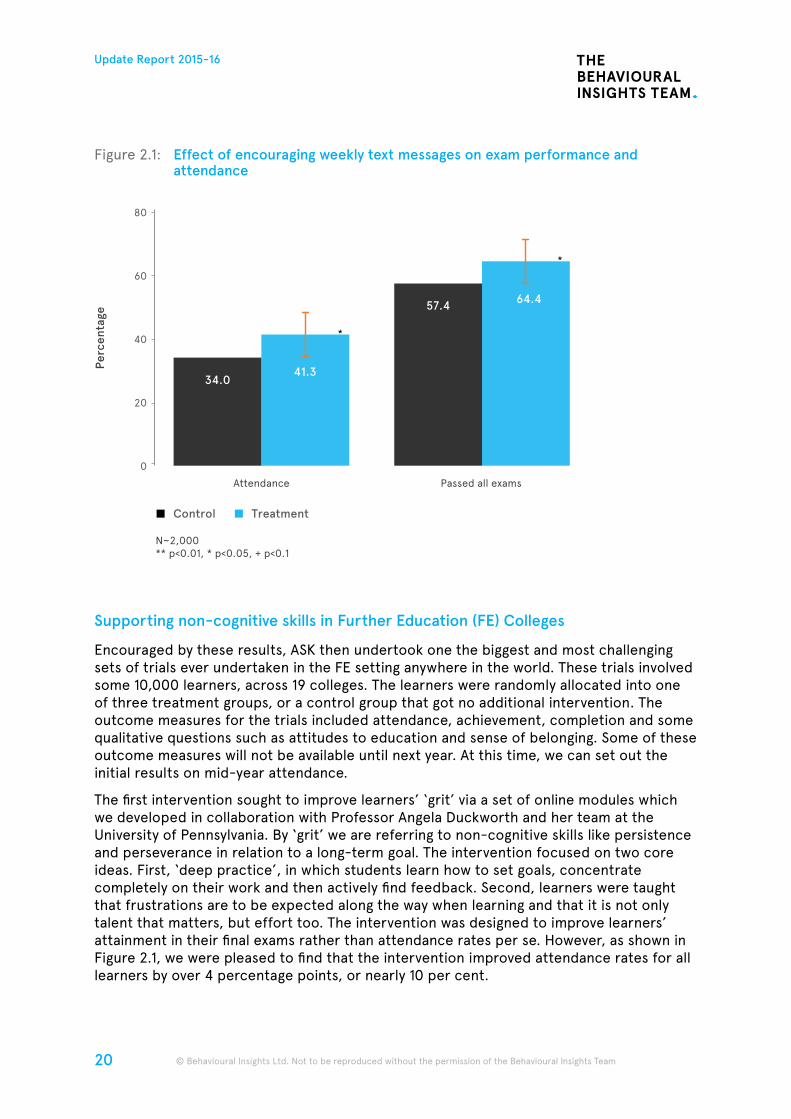
We now have the final results of the trial, which are shown in Figure 2.1. They show that the improvement in attendance, compared with the control group, persisted all the way through to the end of the year. More importantly, they show that learners who received our text messages were also 12 per cent more likely to pass all of their exams.
Zhi Soon, Director, Productivity
2. Education and Skills
20
Update Report 2015-16
© Behavioural Insights Ltd. Not to be reproduced without the permission of the Behavioural Insights Team © Behavioural Insights Ltd. Not to be reproduced without the permission of the Behavioural Insights Team
Figure 2.1: Effect of encouraging weekly text messages on exam performance and attendance
Supporting non-cognitive skills in Further Education (FE) Colleges
Encouraged by these results, ASK then undertook one the biggest and most challenging sets of trials ever undertaken in the FE setting anywhere in the world. These trials involved some 10,000 learners, across 19 colleges. The learners were randomly allocated into one of three treatment groups, or a control group that got no additional intervention. The outcome measures for the trials included attendance, achievement, completion and some qualitative questions such as attitudes to education and sense of belonging. Some of these outcome measures will not be available until next year. At this time, we can set out the initial results on mid-year attendance.
The first intervention sought to improve learners’ ‘grit’ via a set of online modules which we developed in collaboration with Professor Angela Duckworth and her team at the University of Pennsylvania. By ‘grit’ we are referring to non-cognitive skills like persistence and perseverance in relation to a long-term goal. The intervention focused on two core ideas. First, ‘deep practice’, in which students learn how to set goals, concentrate completely on their work and then actively find feedback. Second, learners were taught that frustrations are to be expected along the way when learning and that it is not only talent that matters, but effort too. The intervention was designed to improve learners’ attainment in their final exams rather than attendance rates per se. However, as shown in Figure 2.1, we were pleased to find that the intervention improved attendance rates for all learners by over 4 percentage points, or nearly 10 per cent.
20
80
40
60
Perc
enta
ge
0
Attendance Passed all exams
Control Treatment
N~2,000** p<0.01, * p<0.05, + p<0.1
34.041.3
57.4 64.4
*
*
21
Update Report 2015-16
© Behavioural Insights Ltd. Not to be reproduced without the permission of the Behavioural Insights Team
The second intervention was an online Values Affirmation (VA) exercise, which we developed with Professor Geoffrey Cohen and his team at Stanford. The intervention involved, amongst other things, an exercise in which students were encouraged to think about what is most important to them in their lives, and then to write about times when these values were particularly important to them and why.
There is substantial research, including that conducted by BIT, which has shown that exercises of this kind are effective at helping people to overcome ‘stereotype threat’, a situation where people are or feel themselves to be at risk of conforming to stereotypes about their group. ‘Stereotype threat’ can create a self-fulfilling prophecy where underperformance confirms the stereotype. Our extensive qualitative work in FE colleges combined with the existing behavioural science literature has led us to believe that some FE college students might be experiencing ‘stereotype threat’, particularly those who had previously struggled to attain maths and English qualifications. The intervention was designed to improve attainment and also learners’ attendance.
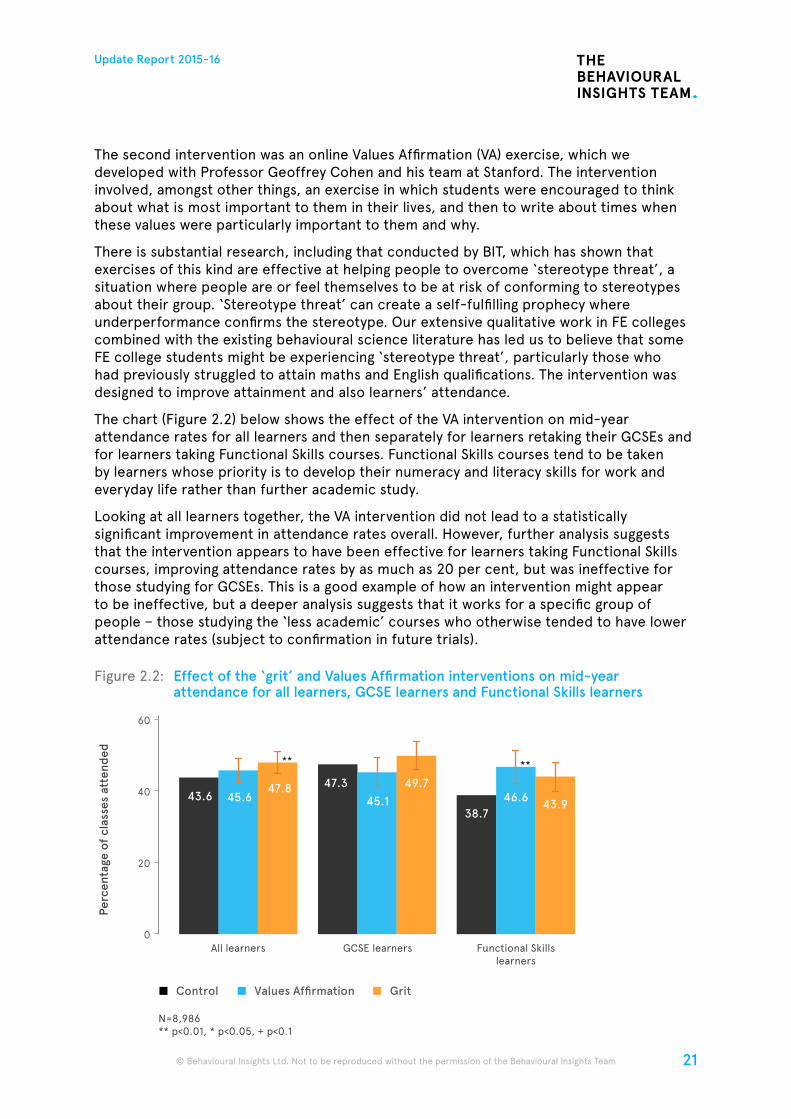
The chart (Figure 2.2) below shows the effect of the VA intervention on mid-year attendance rates for all learners and then separately for learners retaking their GCSEs and for learners taking Functional Skills courses. Functional Skills courses tend to be taken by learners whose priority is to develop their numeracy and literacy skills for work and everyday life rather than further academic study.
Looking at all learners together, the VA intervention did not lead to a statistically significant improvement in attendance rates overall. However, further analysis suggests that the intervention appears to have been effective for learners taking Functional Skills courses, improving attendance rates by as much as 20 per cent, but was ineffective for those studying for GCSEs. This is a good example of how an intervention might appear to be ineffective, but a deeper analysis suggests that it works for a specific group of people – those studying the ‘less academic’ courses who otherwise tended to have lower attendance rates (subject to confirmation in future trials).
Figure 2.2: Effect of the ‘grit’ and Values Affirmation interventions on mid-year attendance for all learners, GCSE learners and Functional Skills learners
20
60
40
Perc
enta
ge o
f cl
asse
s at
tend
ed
0All learners GCSE learners Functional Skills
learners
Control Values Affirmation Grit
N=8,986** p<0.01, * p<0.05, + p<0.1
****
43.6 45.647.8 47.3
45.1
49.7
38.746.6 43.9
22
Update Report 2015-16
© Behavioural Insights Ltd. Not to be reproduced without the permission of the Behavioural Insights Team © Behavioural Insights Ltd. Not to be reproduced without the permission of the Behavioural Insights Team
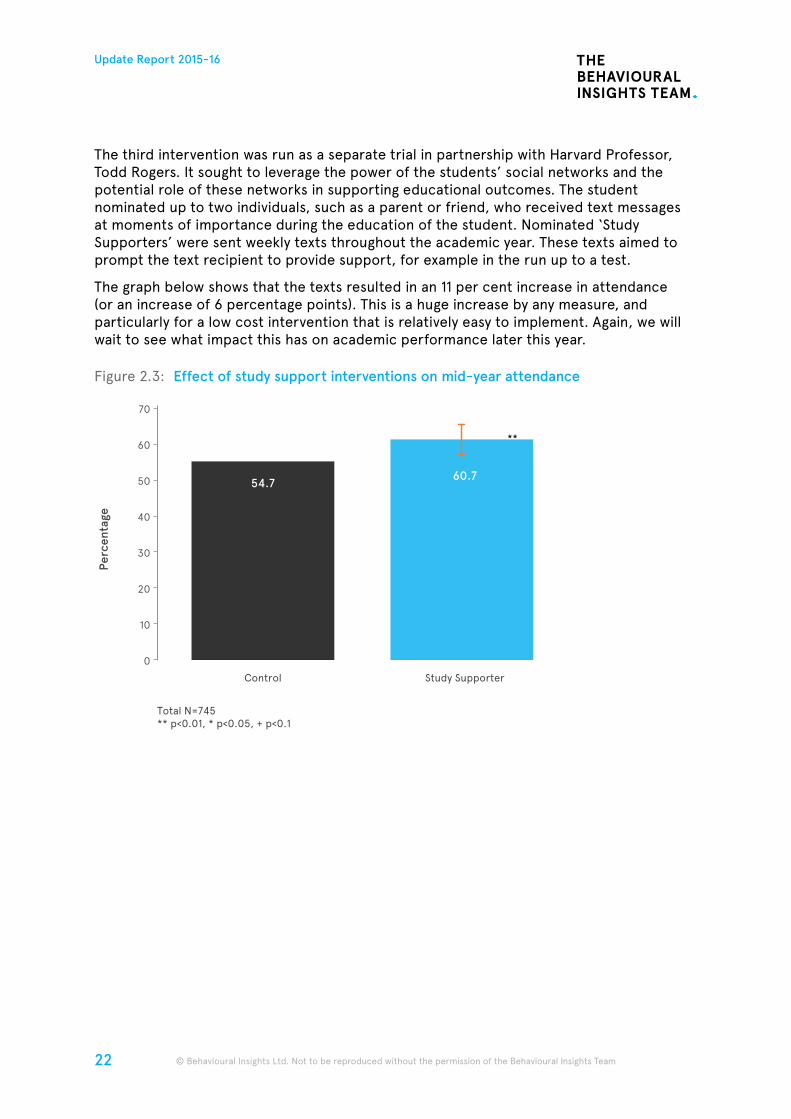
The third intervention was run as a separate trial in partnership with Harvard Professor, Todd Rogers. It sought to leverage the power of the students’ social networks and the potential role of these networks in supporting educational outcomes. The student nominated up to two individuals, such as a parent or friend, who received text messages at moments of importance during the education of the student. Nominated ‘Study Supporters’ were sent weekly texts throughout the academic year. These texts aimed to prompt the text recipient to provide support, for example in the run up to a test.
The graph below shows that the texts resulted in an 11 per cent increase in attendance (or an increase of 6 percentage points). This is a huge increase by any measure, and particularly for a low cost intervention that is relatively easy to implement. Again, we will wait to see what impact this has on academic performance later this year.
Figure 2.3: Effect of study support interventions on mid-year attendance
Perc
enta
ge
Total N=745** p<0.01, * p<0.05, + p<0.1
70
60
50
40
30
20
10
0
Control Study Supporter
**
60.754.7
23
Update Report 2015-16
© Behavioural Insights Ltd. Not to be reproduced without the permission of the Behavioural Insights Team
Box 2.1: Learning lessons from implementing complex interventions in the field
Alongside the quantitative work in the trials with FE Colleges, we also undertook qualitative research to better understand how the trials were working in practice and to learn lessons on the implementation of future interventions. This included carrying out 25 in-depth interviews with learners in relation to each of the three interventions to capture their experiences and perceptions of the exercises and the challenges associated with the implementation. Additionally, we interviewed tutors who delivered the interventions in their classrooms.
These interviews, particularly with learners, were overwhelmingly positive. Learners mentioned that the exercises had helped them express themselves, and had even improved their relationships with their study supporters. For example, one interviewee
said, “it was helpful because… I don’t think I would have got through the year without having someone to support [me]…”
The qualitative work also revealed some of the challenges in trial implementation. For example, in order to maintain the rigour of the trial, the tutors were not able to know of the content of each of the intervention groups. This proved to be a source of frustration, which tutors felt made it harder for them to play as strong a role as they would have liked in actively encouraging learners to engage in the programme.
BIT believes that, wherever possible, it is worth conducting qualitative work of this kind alongside a quantitative study, and using the results to add nuance and to inform future work.
Network nudges to raise awareness of workplace learning
Some large organisations offer in-house English and maths functional skills classes, tailored to the working context. These classes are a great opportunity for employees to improve their skills, but employers sometimes face challenges with take-up. We worked with a large public transport network provider to raise awareness of the classes on offer.
We wanted to test the impact of peer networks on sign-ups, so we divided up learners who had attended classes over the past three years and got in touch with learners to see whether they would refer their friends. This idea takes forward the concept of ‘network nudges’ that we reported on in last year’s Update Report in relation to charitable giving. The first group simply received an email asking for feedback on their experience. The second group were asked to reach out to their friends and colleagues. The third group got an incentive: anyone who signed up to a class would go into a lottery to win shopping vouchers worth £250 or £25. We had postulated that the incentive would motivate past learners to notify their friends, and then those friends, to sign up to courses.
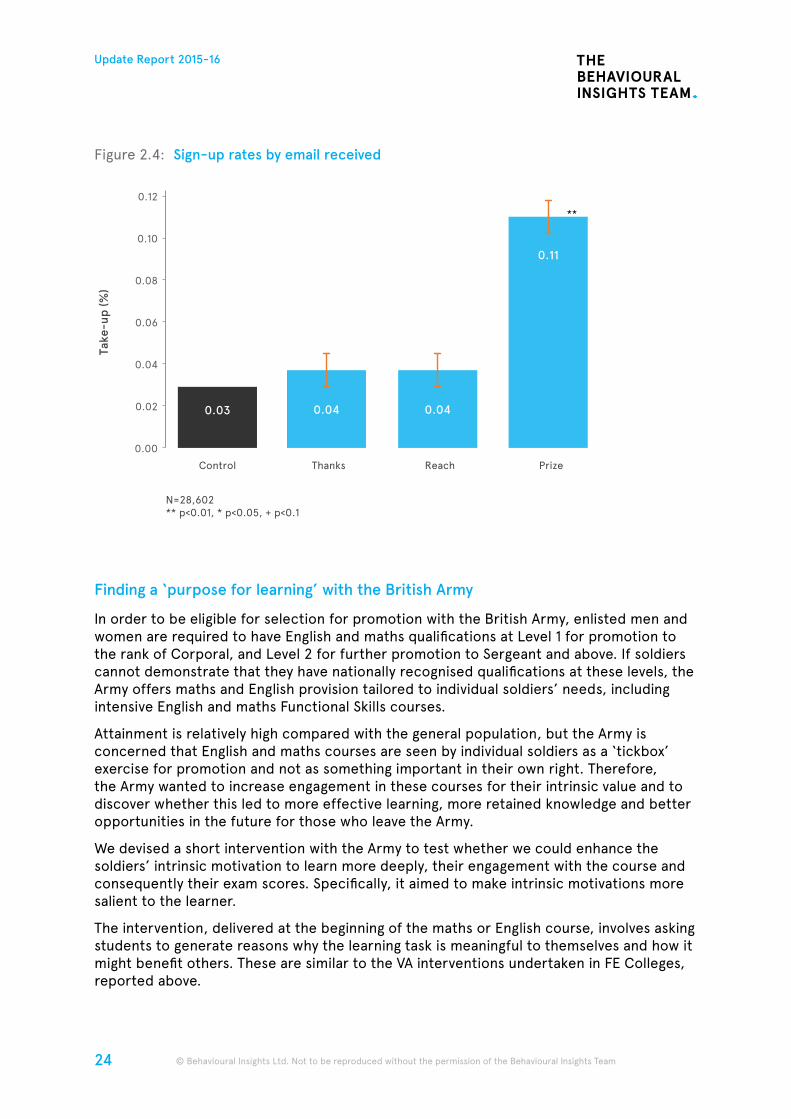
This third group had sign-up rates more than double those of the other two. At first glance, there is a relatively simple explanation. Offering an incentive increases the number of people who sign up. However, we think that something more interesting may be going on. There is a chance that the lottery may help to destigmatise signing up for a course by providing an alternative rationale for the learner (instead of admitting that their maths was not up to scratch, learners could say it was because of the prize). That said, it is worth noting that the sign-up rates overall were extremely low: even in the most successful arm, only around one in 1,000 staff responded to a prompt from their colleague.
24
Update Report 2015-16
© Behavioural Insights Ltd. Not to be reproduced without the permission of the Behavioural Insights Team © Behavioural Insights Ltd. Not to be reproduced without the permission of the Behavioural Insights Team
Figure 2.4: Sign-up rates by email received
Finding a ‘purpose for learning’ with the British Army
In order to be eligible for selection for promotion with the British Army, enlisted men and women are required to have English and maths qualifications at Level 1 for promotion to the rank of Corporal, and Level 2 for further promotion to Sergeant and above. If soldiers cannot demonstrate that they have nationally recognised qualifications at these levels, the Army offers maths and English provision tailored to individual soldiers’ needs, including intensive English and maths Functional Skills courses.
Attainment is relatively high compared with the general population, but the Army is concerned that English and maths courses are seen by individual soldiers as a ‘tickbox’ exercise for promotion and not as something important in their own right. Therefore, the Army wanted to increase engagement in these courses for their intrinsic value and to discover whether this led to more effective learning, more retained knowledge and better opportunities in the future for those who leave the Army.
We devised a short intervention with the Army to test whether we could enhance the soldiers’ intrinsic motivation to learn more deeply, their engagement with the course and consequently their exam scores. Specifically, it aimed to make intrinsic motivations more salient to the learner.
The intervention, delivered at the beginning of the maths or English course, involves asking students to generate reasons why the learning task is meaningful to themselves and how it might benefit others. These are similar to the VA interventions undertaken in FE Colleges, reported above.
N=28,602** p<0.01, * p<0.05, + p<0.1
Take
-up
(%)
Control Thanks Reach Prize
0.06
0.04
0.02
0.12
0.08
0.10
0.00
**
0.03 0.04 0.04
0.11
25
Update Report 2015-16
© Behavioural Insights Ltd. Not to be reproduced without the permission of the Behavioural Insights Team
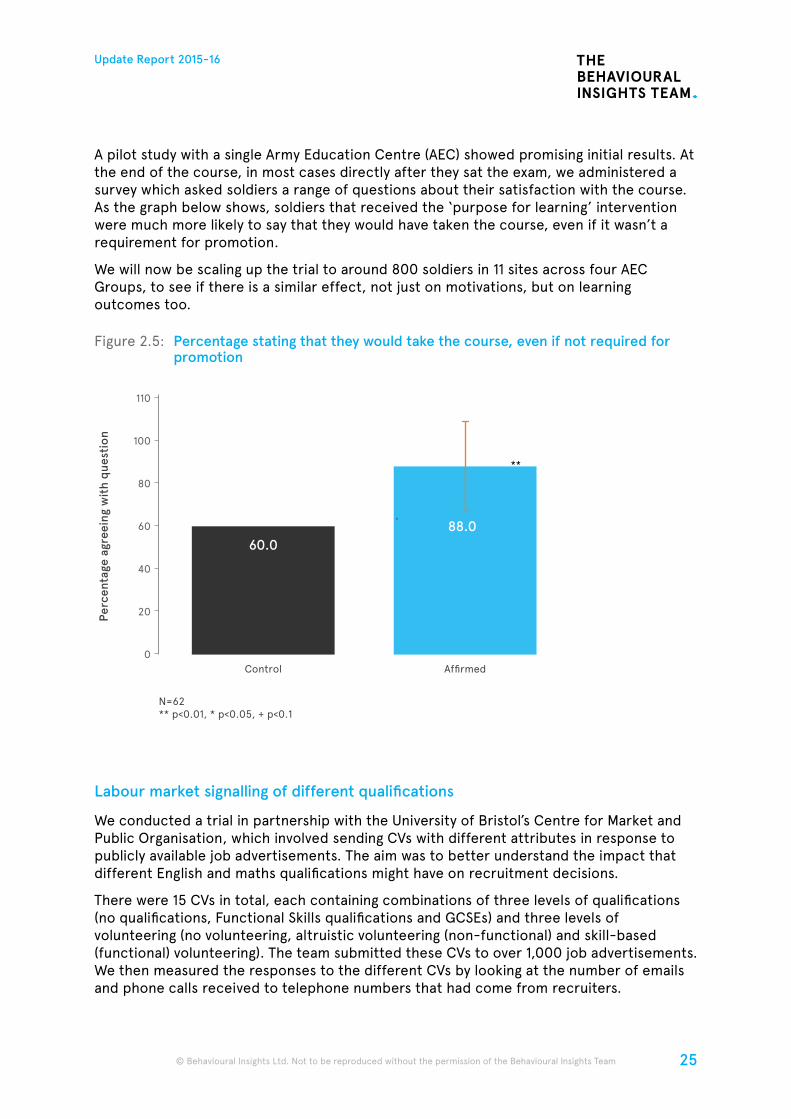
A pilot study with a single Army Education Centre (AEC) showed promising initial results. At the end of the course, in most cases directly after they sat the exam, we administered a survey which asked soldiers a range of questions about their satisfaction with the course. As the graph below shows, soldiers that received the ‘purpose for learning’ intervention were much more likely to say that they would have taken the course, even if it wasn’t a requirement for promotion.
We will now be scaling up the trial to around 800 soldiers in 11 sites across four AEC Groups, to see if there is a similar effect, not just on motivations, but on learning outcomes too.
Figure 2.5: Percentage stating that they would take the course, even if not required for promotion
Labour market signalling of different qualifications
We conducted a trial in partnership with the University of Bristol’s Centre for Market and Public Organisation, which involved sending CVs with different attributes in response to publicly available job advertisements. The aim was to better understand the impact that different English and maths qualifications might have on recruitment decisions.
There were 15 CVs in total, each containing combinations of three levels of qualifications (no qualifications, Functional Skills qualifications and GCSEs) and three levels of volunteering (no volunteering, altruistic volunteering (non-functional) and skill-based (functional) volunteering). The team submitted these CVs to over 1,000 job advertisements. We then measured the responses to the different CVs by looking at the number of emails and phone calls received to telephone numbers that had come from recruiters.
100
80
60
40
20
110
0
Perc
enta
ge a
gree
ing
wit
h qu
esti
on
Control
N=62** p<0.01, * p<0.05, + p<0.1
Affirmed
**
60.088.0
26
Update Report 2015-16
© Behavioural Insights Ltd. Not to be reproduced without the permission of the Behavioural Insights Team © Behavioural Insights Ltd. Not to be reproduced without the permission of the Behavioural Insights Team
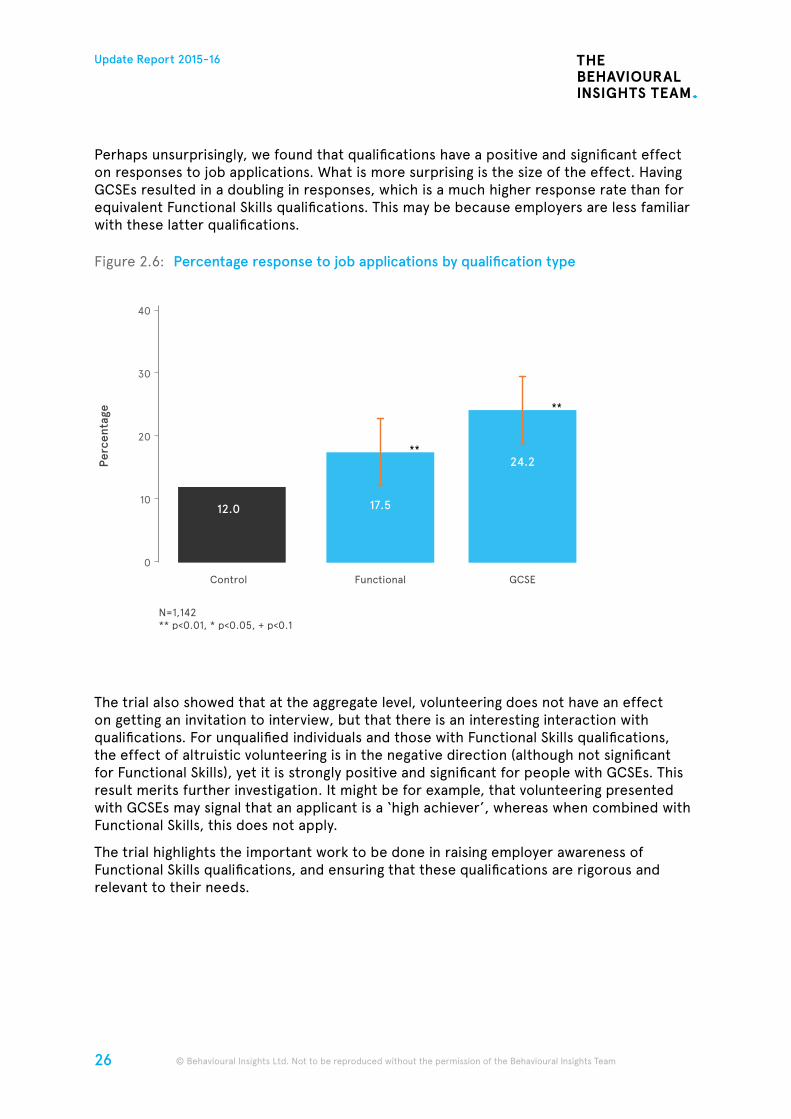
Perhaps unsurprisingly, we found that qualifications have a positive and significant effect on responses to job applications. What is more surprising is the size of the effect. Having GCSEs resulted in a doubling in responses, which is a much higher response rate than for equivalent Functional Skills qualifications. This may be because employers are less familiar with these latter qualifications.
Figure 2.6: Percentage response to job applications by qualification type
The trial also showed that at the aggregate level, volunteering does not have an effect on getting an invitation to interview, but that there is an interesting interaction with qualifications. For unqualified individuals and those with Functional Skills qualifications, the effect of altruistic volunteering is in the negative direction (although not significant for Functional Skills), yet it is strongly positive and significant for people with GCSEs. This result merits further investigation. It might be for example, that volunteering presented with GCSEs may signal that an applicant is a ‘high achiever’, whereas when combined with Functional Skills, this does not apply.
The trial highlights the important work to be done in raising employer awareness of Functional Skills qualifications, and ensuring that these qualifications are rigorous and relevant to their needs.
Control
N=1,142** p<0.01, * p<0.05, + p<0.1
Functional GCSE
10
40
20
30
Perc
enta
ge
0
**
**
12.0 17.5
24.2
27
Update Report 2015-16
© Behavioural Insights Ltd. Not to be reproduced without the permission of the Behavioural Insights Team
Supporting the new Apprenticeships Policy
In June 2015, the UK Government gave renewed priority to apprenticeships. The commitment was made to reach 3 million apprenticeships by 2020, and to put them legally on a par with degrees. As a result of this new push, the DfE asked BIT to support it in rolling out and communicating the new arrangements.
One of the main focuses of BIT’s work is to support DfE to incorporate a range of behavioural insights into the key touch points for the new apprenticeship levy and the digital apprenticeship service account. In addition, we are working with teams from the Skills Funding Agency to drive greater employer engagement with apprenticeships. We are also investigating how an ‘apprenticeship social contract’ might increase quality, completion, and benefits for apprentices, employers and training providers.
Much of this work involves running large-scale field trials. Some of these trials will test mechanisms to encourage the hiring of apprentices. This should provide DfE and employers with ongoing feedback on what the best ways of increasing uptake might be, as the Government progresses towards its 3 million apprenticeship target. As an organisation that now meets the threshold for hiring apprentices, BIT may also soon have some first-hand experience of the system.
Supporting young people’s study and career decisions
Young people face a difficult challenge as they navigate the increasingly complex pathways from education to work. In many ways it is positive that they face a wealth of choices and opportunities that earlier generations could not have imagined. However, this wealth of choice brings its own challenges.
The CEC commissioned BIT, together with the Cabinet Office Policy Lab, to conduct independent, theoretically and empirically grounded research on what kind of information supports young people to make informed choices about their study and career options.
We attempted to track the young people in our sample through their career decision-making journeys, and to understand at what point they sought information and about what. We plotted this on two axes to develop a segmentation model (see Figure 2.7).
28
Update Report 2015-16
© Behavioural Insights Ltd. Not to be reproduced without the permission of the Behavioural Insights Team © Behavioural Insights Ltd. Not to be reproduced without the permission of the Behavioural Insights Team
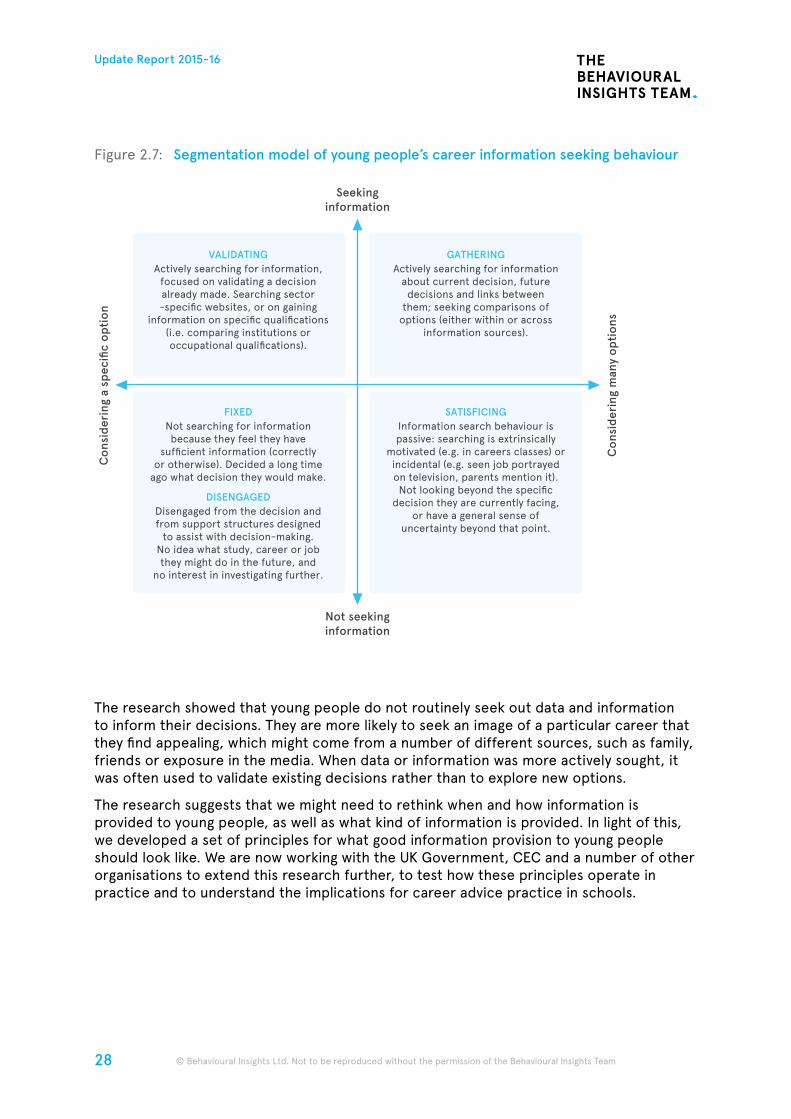
Figure 2.7: Segmentation model of young people’s career information seeking behaviour
The research showed that young people do not routinely seek out data and information to inform their decisions. They are more likely to seek an image of a particular career that they find appealing, which might come from a number of different sources, such as family, friends or exposure in the media. When data or information was more actively sought, it was often used to validate existing decisions rather than to explore new options.
The research suggests that we might need to rethink when and how information is provided to young people, as well as what kind of information is provided. In light of this, we developed a set of principles for what good information provision to young people should look like. We are now working with the UK Government, CEC and a number of other organisations to extend this research further, to test how these principles operate in practice and to understand the implications for career advice practice in schools.
Con
side
ring
man
y op
tion
s
Con
side
ring
a s
peci
fic o
ptio
n
VALIDATINGActively searching for information,
focused on validating a decision already made. Searching sector-specific websites, or on gaining
information on specific qualifications (i.e. comparing institutions or occupational qualifications).
DISENGAGEDDisengaged from the decision and from support structures designed
to assist with decision-making.No idea what study, career or job they might do in the future, and
no interest in investigating further.
FIXEDNot searching for information because they feel they have
sufficient information (correctlyor otherwise). Decided a long time
ago what decision they would make.
SATISFICINGInformation search behaviour is passive: searching is extrinsically
motivated (e.g. in careers classes) or incidental (e.g. seen job portrayed on television, parents mention it).Not looking beyond the specific
decision they are currently facing,or have a general sense of
uncertainty beyond that point.
GATHERINGActively searching for information
about current decision, future decisions and links between
them; seeking comparisons of options (either within or across
information sources).
Seekinginformation
Not seekinginformation
29
Update Report 2015-16
© Behavioural Insights Ltd. Not to be reproduced without the permission of the Behavioural Insights Team
In last year’s Update Report, we pointed out that, historically, there has been little tradition of conducting behavioural studies in the policy areas of crime, immigration and national security. There are good reasons for this: these are complex, sometimes sensitive policy areas, and it can often take a long time to see the effect of interventions.
At the same time, it should be recognised that most aspects of Home Affairs policy are ultimately about human behaviour. And those studies that have been conducted, such as our work with Avon and Somerset Constabulary on increasing diversity in police recruitment, seem to show that – in some but by no means all cases – relatively small changes can have big impacts.
So, with this in mind, we are delighted that, as a result of a few of our early studies and the efforts of our partners in police forces, the Home Office and innovative organisations like the Dawes Trust, a behavioural approach – including a commitment to testing and trialling – is becoming more widespread in Home Affairs and related policy areas.
In this section, we report the launch of many new interventions, findings from recent studies, and several trial results. This includes the latest findings from the Mobile Phone Risk Index and analysis on police demand.
The Mobile Phone Risk Ratio
In March 2016, the Home Office and BIT jointly published the second edition of Reducing Mobile Phone Theft and Improving Security,12 a paper which details the nature of mobile phone theft across England and Wales, including how and when phones are stolen, and who is most at risk.
A core part of this paper is a second edition of the Mobile Phone Risk Ratio. The ratio was developed by BIT to show which phones are ‘over-stolen’ – in other words, the extent to which a particular make and model of phone is stolen more than we would have anticipated given its share of available phones. It is calculated based on our analysis of data provided by the Metropolitan Police Service (MPS) on mobile phone thefts during 2015.
Simon Ruda, Director, Home Affairs and International Programmes
3. Home Affairs
30
Update Report 2015-16
© Behavioural Insights Ltd. Not to be reproduced without the permission of the Behavioural Insights Team © Behavioural Insights Ltd. Not to be reproduced without the permission of the Behavioural Insights Team
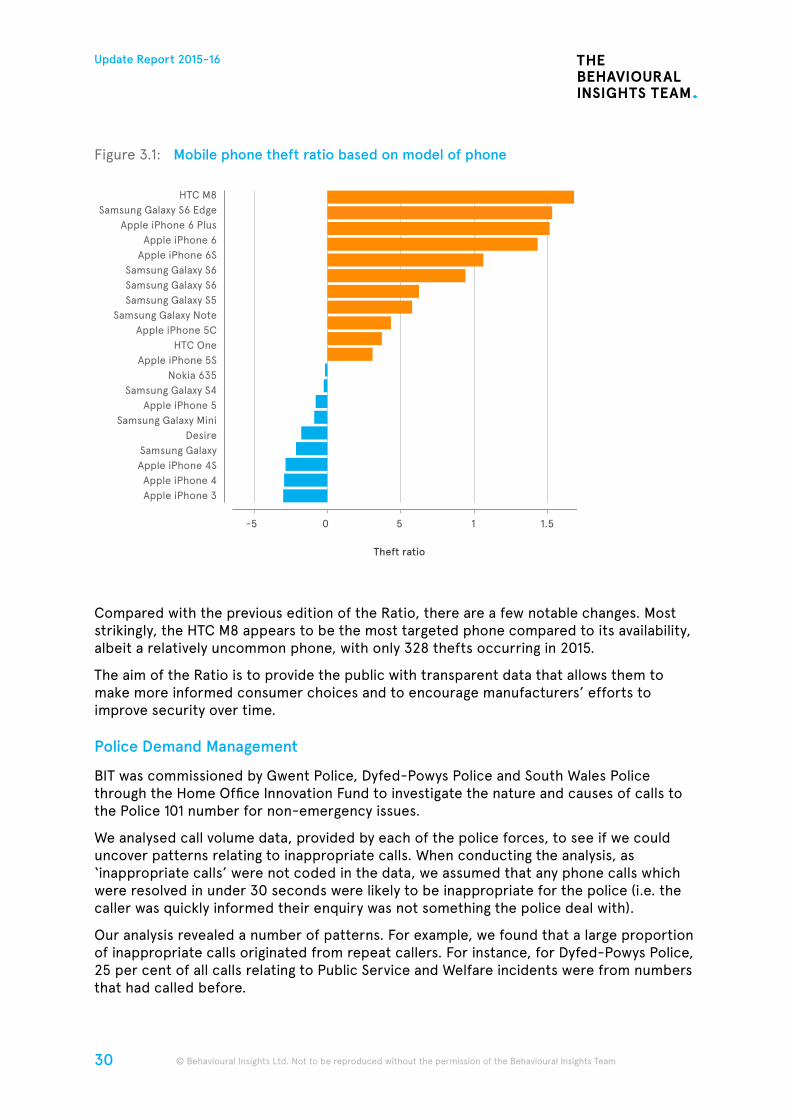
Figure 3.1: Mobile phone theft ratio based on model of phone
Compared with the previous edition of the Ratio, there are a few notable changes. Most strikingly, the HTC M8 appears to be the most targeted phone compared to its availability, albeit a relatively uncommon phone, with only 328 thefts occurring in 2015.
The aim of the Ratio is to provide the public with transparent data that allows them to make more informed consumer choices and to encourage manufacturers’ efforts to improve security over time.
Police Demand Management
BIT was commissioned by Gwent Police, Dyfed-Powys Police and South Wales Police through the Home Office Innovation Fund to investigate the nature and causes of calls to the Police 101 number for non-emergency issues.
We analysed call volume data, provided by each of the police forces, to see if we could uncover patterns relating to inappropriate calls. When conducting the analysis, as ‘inappropriate calls’ were not coded in the data, we assumed that any phone calls which were resolved in under 30 seconds were likely to be inappropriate for the police (i.e. the caller was quickly informed their enquiry was not something the police deal with).
Our analysis revealed a number of patterns. For example, we found that a large proportion of inappropriate calls originated from repeat callers. For instance, for Dyfed-Powys Police, 25 per cent of all calls relating to Public Service and Welfare incidents were from numbers that had called before.
-5 0 5
Theft ratio
1 1.5
HTC M8Samsung Galaxy S6 Edge
Apple iPhone 6 PlusApple iPhone 6
Apple iPhone 6SSamsung Galaxy S6Samsung Galaxy S6Samsung Galaxy S5
Samsung Galaxy NoteApple iPhone 5C
HTC OneApple iPhone 5S
Nokia 635Samsung Galaxy S4
Apple iPhone 5Samsung Galaxy Mini
DesireSamsung GalaxyApple iPhone 4SApple iPhone 4Apple iPhone 3
31
Update Report 2015-16
© Behavioural Insights Ltd. Not to be reproduced without the permission of the Behavioural Insights Team
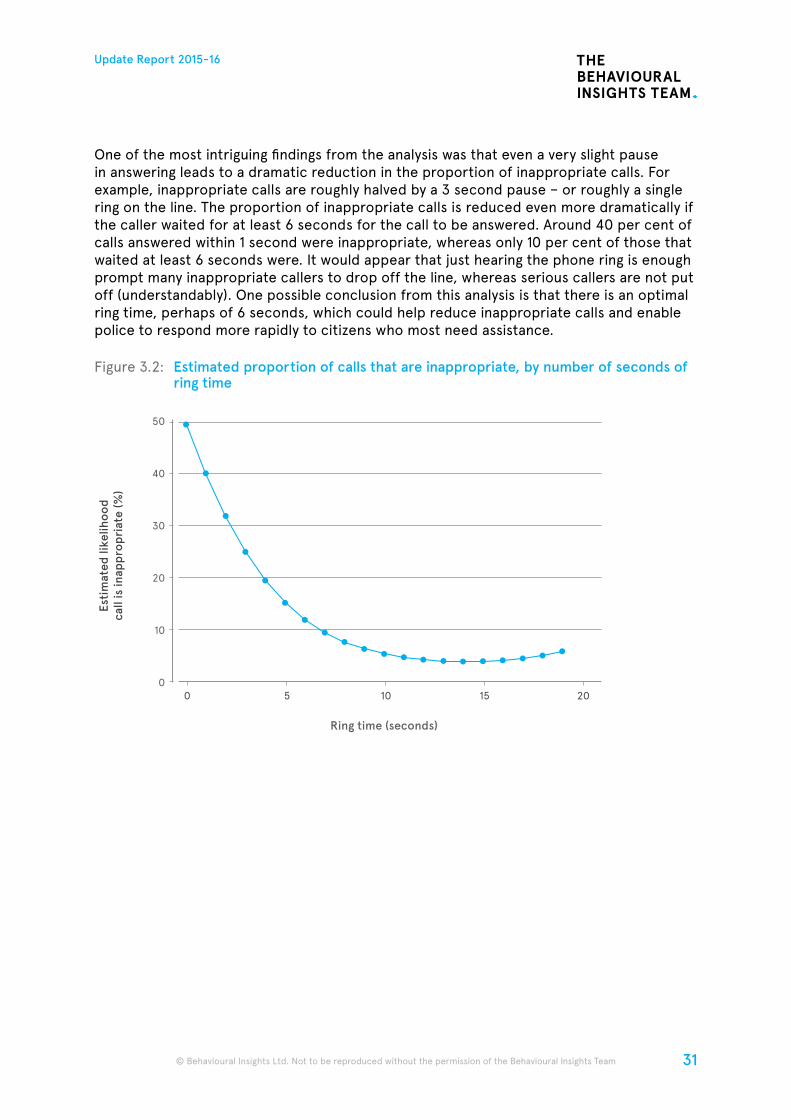
One of the most intriguing findings from the analysis was that even a very slight pause in answering leads to a dramatic reduction in the proportion of inappropriate calls. For example, inappropriate calls are roughly halved by a 3 second pause – or roughly a single ring on the line. The proportion of inappropriate calls is reduced even more dramatically if the caller waited for at least 6 seconds for the call to be answered. Around 40 per cent of calls answered within 1 second were inappropriate, whereas only 10 per cent of those that waited at least 6 seconds were. It would appear that just hearing the phone ring is enough prompt many inappropriate callers to drop off the line, whereas serious callers are not put off (understandably). One possible conclusion from this analysis is that there is an optimal ring time, perhaps of 6 seconds, which could help reduce inappropriate calls and enable police to respond more rapidly to citizens who most need assistance.
Figure 3.2: Estimated proportion of calls that are inappropriate, by number of seconds of ring time
0
20
50
30
40
Esti
mat
ed li
kelih
ood
call
is in
appr
opri
ate
(%)
10
Ring time (seconds)
5 10 15 200

32
Update Report 2015-16
© Behavioural Insights Ltd. Not to be reproduced without the permission of the Behavioural Insights Team © Behavioural Insights Ltd. Not to be reproduced without the permission of the Behavioural Insights Team
Behavioural trials with West Midlands Police
In 2015, we partnered with West Midlands Police, England’s second largest police force, to deliver a series of trials in policing. West Midlands Police have a strong commitment to innovative approaches to policing and understanding ‘what works’. We are grateful for the efforts of our colleagues there, particularly, the support of Chief Superintendent Alex Murray, Commander of Solihull Local Policing Unit and founder of the Society of Evidence Based Policing.
With support from the Dawes Trust, a charity dedicated to supporting innovative ways to reduce crime,13 we are now just over a year into an 18 month programme of work that aims to assess the potential for rapid, practical, low-cost, behaviourally-informed interventions to reduce crime and aid police work.
We are trialling a wide range of interventions with West Midlands Police. One of the most innovative of these is a message written on cell walls in police custody suites (see Figure 3.3 below). The messages were written with the help of an ex-offender who wanted to help others to turn their lives around as he has. They aim to reduce reoffending by prompting detainees to identify the triggers and obstacles that might make them more likely to reoffend in the future and encouraging them to consider steps they could take to avoid those triggers.
Figure 3.3: A trial to test whether behaviourally-informed messages on cell walls reduces reoffending amongst those who have been held in police custody
33
Update Report 2015-16
© Behavioural Insights Ltd. Not to be reproduced without the permission of the Behavioural Insights Team
Another trial will test the impact of sending timely messages to young offenders, drawing on the ‘fresh start’ opportunities around birthdays to encourage behavioural change.
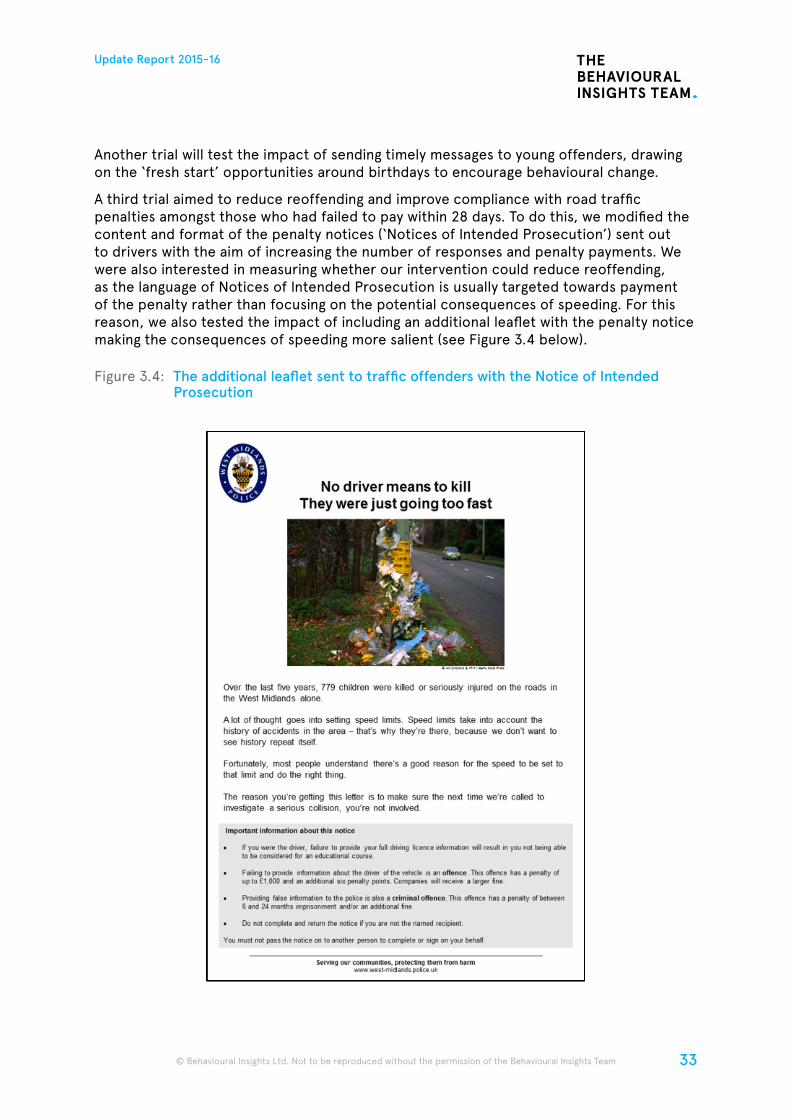
A third trial aimed to reduce reoffending and improve compliance with road traffic penalties amongst those who had failed to pay within 28 days. To do this, we modified the content and format of the penalty notices (‘Notices of Intended Prosecution’) sent out to drivers with the aim of increasing the number of responses and penalty payments. We were also interested in measuring whether our intervention could reduce reoffending, as the language of Notices of Intended Prosecution is usually targeted towards payment of the penalty rather than focusing on the potential consequences of speeding. For this reason, we also tested the impact of including an additional leaflet with the penalty notice making the consequences of speeding more salient (see Figure 3.4 below).
Figure 3.4: The additional leaflet sent to traffic offenders with the Notice of Intended Prosecution
34
Update Report 2015-16
© Behavioural Insights Ltd. Not to be reproduced without the permission of the Behavioural Insights Team © Behavioural Insights Ltd. Not to be reproduced without the permission of the Behavioural Insights Team
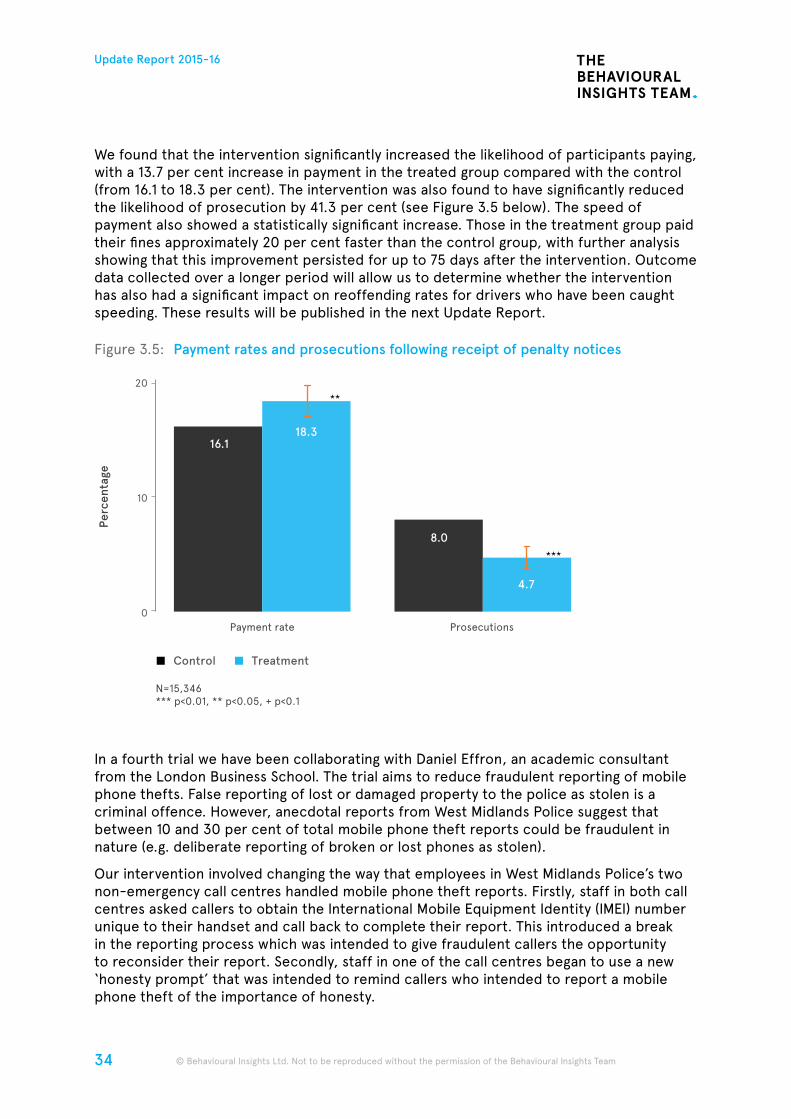
We found that the intervention significantly increased the likelihood of participants paying, with a 13.7 per cent increase in payment in the treated group compared with the control (from 16.1 to 18.3 per cent). The intervention was also found to have significantly reduced the likelihood of prosecution by 41.3 per cent (see Figure 3.5 below). The speed of payment also showed a statistically significant increase. Those in the treatment group paid their fines approximately 20 per cent faster than the control group, with further analysis showing that this improvement persisted for up to 75 days after the intervention. Outcome data collected over a longer period will allow us to determine whether the intervention has also had a significant impact on reoffending rates for drivers who have been caught speeding. These results will be published in the next Update Report.
Figure 3.5: Payment rates and prosecutions following receipt of penalty notices
In a fourth trial we have been collaborating with Daniel Effron, an academic consultant from the London Business School. The trial aims to reduce fraudulent reporting of mobile phone thefts. False reporting of lost or damaged property to the police as stolen is a criminal offence. However, anecdotal reports from West Midlands Police suggest that between 10 and 30 per cent of total mobile phone theft reports could be fraudulent in nature (e.g. deliberate reporting of broken or lost phones as stolen).
Our intervention involved changing the way that employees in West Midlands Police’s two non-emergency call centres handled mobile phone theft reports. Firstly, staff in both call centres asked callers to obtain the International Mobile Equipment Identity (IMEI) number unique to their handset and call back to complete their report. This introduced a break in the reporting process which was intended to give fraudulent callers the opportunity to reconsider their report. Secondly, staff in one of the call centres began to use a new ‘honesty prompt’ that was intended to remind callers who intended to report a mobile phone theft of the importance of honesty.
20
10
Perc
enta
ge
0Payment rate Prosecutions
16.118.3
**
8.0
4.7
***
Control Treatment
N=15,346*** p<0.01, ** p<0.05, + p<0.1
35
Update Report 2015-16
© Behavioural Insights Ltd. Not to be reproduced without the permission of the Behavioural Insights Team
One of the most important trials is testing ways of increasing the number of witnesses and victims who attend court to give evidence. Around 15 per cent of all cases in the Magistrates’ Court do not take place on the day they are scheduled,14 often because a key witness has not attended court to give evidence. In our trial, we are testing whether revised communications (conversation guides, letters or text message reminders) can encourage victims and witnesses to attend court to give evidence.
Increasing the diversity of the police workforce
BIT has been conducting trials with UK police forces to explore how to attract a more diverse workforce. Earlier work with Avon and Somerset Constabulary (ASC) targeted a psychological concept known as ‘stereotype threat’ which is likely to impede candidates from a minority background performing to the best of their abilities. ‘Stereotype threat’ occurs when an individual performs a task for which their group suffers a negative stereotype.15 This can impair performance because cognitive resources are consumed as the individual has to suppress thoughts about the negative stereotype, deal with a stress response to the situation, and monitor their own performance more closely to try to maintain performance quality. For example, if there is a stereotype that women are less good at maths than men, when women are confronted with a maths task, mentally dealing with the negative stereotype can cause them to perform less well.
Building on evidence that the negative effects of ‘stereotype threat’ can be reduced with different types of positive prompts,16 we implemented a randomised controlled trial (RCT) with ASC that tested whether a combination of positive prompts could boost performance of black and minority ethnic (BME) candidates on an online Situational Judgment Test. These positive prompts were added to the email that invited candidates to take the test. Our intervention resulted in higher test scores for BME candidates and increased the probability that a BME applicant passed the test (compared to BME candidates who received the control email), whilst not affecting those from a non-BME background.
Following this, as part of the programme of work with West Midlands Police and the Dawes Trust, BIT wanted to assess whether a similarly light-touch intervention could make an impact in a quite different – although related – context: a face-to-face assessment.
To do this, we sent a reminder email to candidates one day before they attended the assessment centre stage of the recruitment process, with the treatment email containing an additional paragraph. This read:
‘Before you take part in this stage of the assessment, we would like you to take some time to think about why you want to be a police constable. For example, what is it about being a police constable that means the most to you and your community?’
It should also be noted that this study does not feature the same control condition as our initial study in Avon and Somerset. In the previous study, the control group was an official, not especially friendly email. In this study, both the treatment and control email used the more informal, ‘friendlier’ text, with only the paragraph above varying between the two conditions.
The results of the trial showed that the intervention did not have a statistically significant impact on the likelihood of candidates passing the assessment centre (see results below). The different context may explain why we did not see an effect. For example, as the trial was conducted at a later stage in the recruitment process, and before a face-to-face
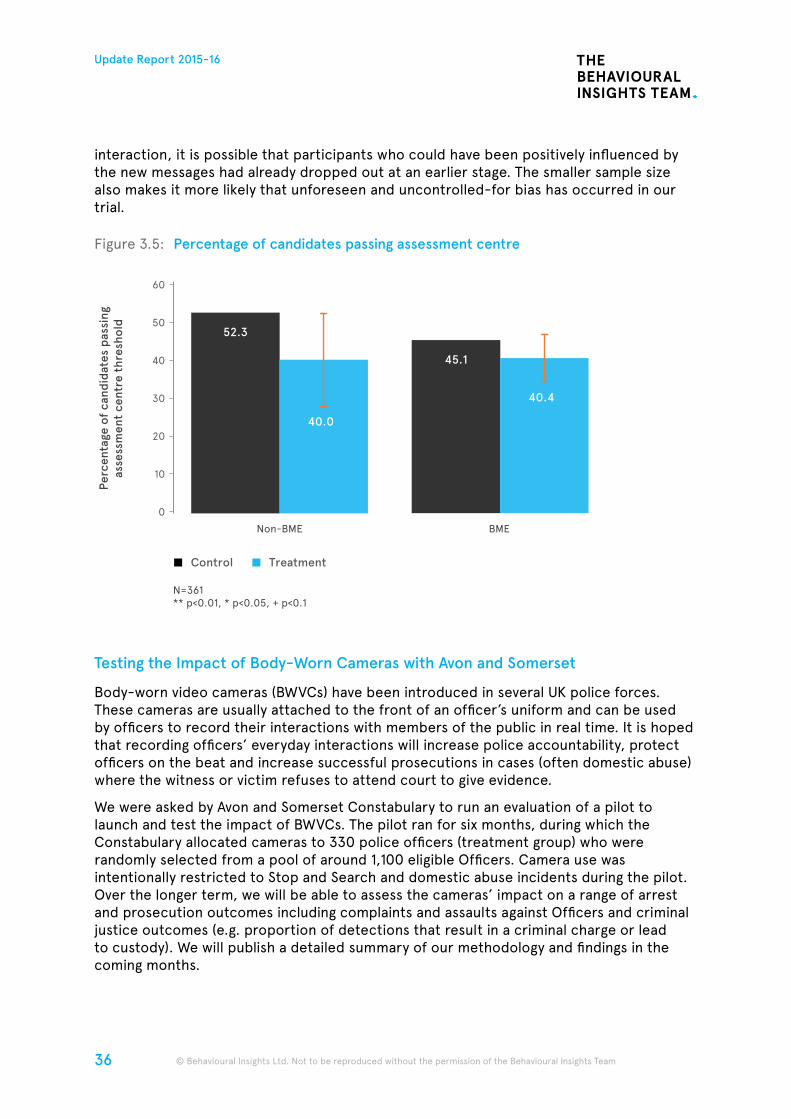
36
Update Report 2015-16
© Behavioural Insights Ltd. Not to be reproduced without the permission of the Behavioural Insights Team © Behavioural Insights Ltd. Not to be reproduced without the permission of the Behavioural Insights Team
interaction, it is possible that participants who could have been positively influenced by the new messages had already dropped out at an earlier stage. The smaller sample size also makes it more likely that unforeseen and uncontrolled-for bias has occurred in our trial.
Figure 3.5: Percentage of candidates passing assessment centre
Testing the Impact of Body-Worn Cameras with Avon and Somerset
Body-worn video cameras (BWVCs) have been introduced in several UK police forces. These cameras are usually attached to the front of an officer’s uniform and can be used by officers to record their interactions with members of the public in real time. It is hoped that recording officers’ everyday interactions will increase police accountability, protect officers on the beat and increase successful prosecutions in cases (often domestic abuse) where the witness or victim refuses to attend court to give evidence.
We were asked by Avon and Somerset Constabulary to run an evaluation of a pilot to launch and test the impact of BWVCs. The pilot ran for six months, during which the Constabulary allocated cameras to 330 police officers (treatment group) who were randomly selected from a pool of around 1,100 eligible Officers. Camera use was intentionally restricted to Stop and Search and domestic abuse incidents during the pilot. Over the longer term, we will be able to assess the cameras’ impact on a range of arrest and prosecution outcomes including complaints and assaults against Officers and criminal justice outcomes (e.g. proportion of detections that result in a criminal charge or lead to custody). We will publish a detailed summary of our methodology and findings in the coming months.
20
10
60
40
30
50
Perc
enta
ge o
f ca
ndid
ates
pas
sing
asse
ssm
ent
cent
re t
hres
hold
0
Non-BME BME
Control Treatment
N=361** p<0.01, * p<0.05, + p<0.1
52.3
40.0
45.1
40.4
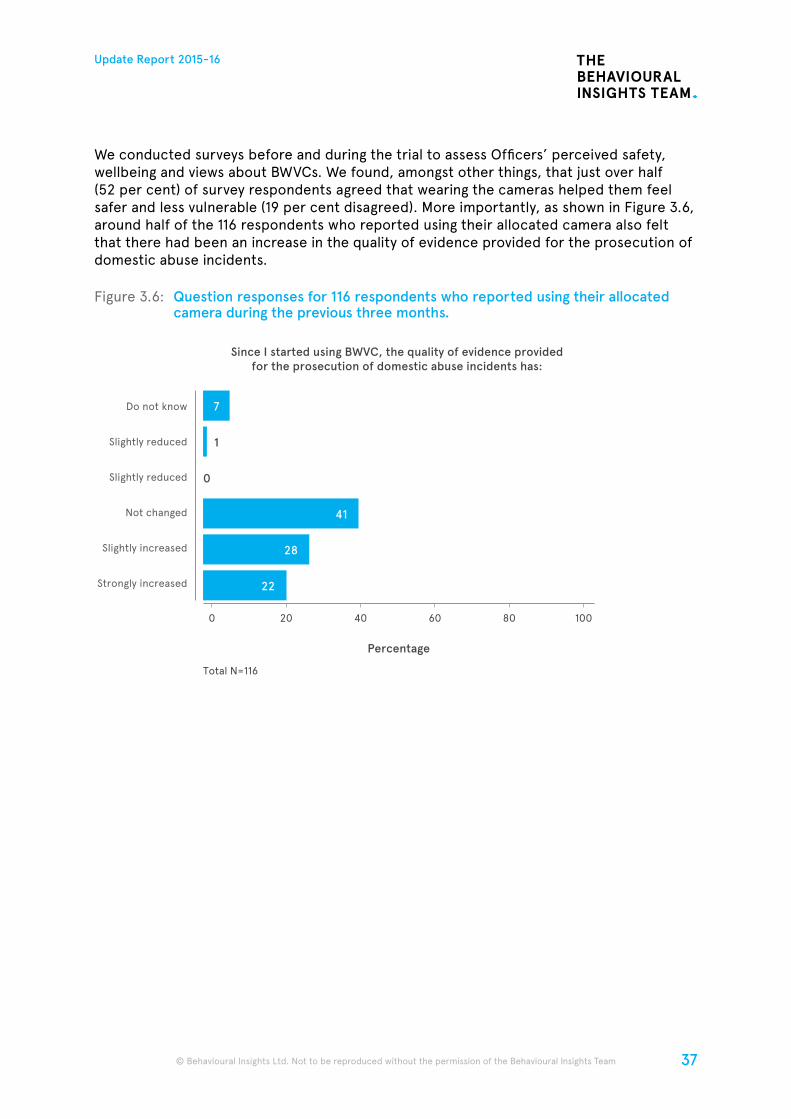
37
Update Report 2015-16
© Behavioural Insights Ltd. Not to be reproduced without the permission of the Behavioural Insights Team
We conducted surveys before and during the trial to assess Officers’ perceived safety, wellbeing and views about BWVCs. We found, amongst other things, that just over half (52 per cent) of survey respondents agreed that wearing the cameras helped them feel safer and less vulnerable (19 per cent disagreed). More importantly, as shown in Figure 3.6, around half of the 116 respondents who reported using their allocated camera also felt that there had been an increase in the quality of evidence provided for the prosecution of domestic abuse incidents.
Figure 3.6: Question responses for 116 respondents who reported using their allocated camera during the previous three months.
0 20 40
Percentage
Total N=116
Since I started using BWVC, the quality of evidence providedfor the prosecution of domestic abuse incidents has:
60 80 100
Do not know
Slightly reduced
Slightly reduced
Not changed
Slightly increased
Strongly increased 22
28
41
0
1
7
38
Update Report 2015-16
© Behavioural Insights Ltd. Not to be reproduced without the permission of the Behavioural Insights Team © Behavioural Insights Ltd. Not to be reproduced without the permission of the Behavioural Insights Team
BIT has always had a strong focus on consumer markets and how we can encourage behavioural change to help people save money and make more environmentally sustainable choices. In the early days of BIT for example, we published a strategy document with the Department for Business (DfB) on ‘consumer empowerment’17 covering a range of sectors, and a paper with the Department for Energy and Climate Change (DECC) on energy and behavioural change.18 Our early work also helped to shape the creation and role of the Competition and Markets Authority.
Over the past year, this work has expanded and the level of ambition of the interventions we have begun to run has increased. For example, our ground breaking studies with Nest are showing that smarter heating controls can reduce energy consumption and bills. Our latest publication on the regulation of consumer markets takes our original thinking on consumer empowerment to a new level – by setting out a vision for what a new regulatory system would look like if we were to take a more behaviourally informed approach.
At the same time, we have continued to conduct randomised evaluations of interventions, to test whether small changes can help improve outcomes for citizens. Many of these are showing positive effects. However, we are also publishing several trials that have not had the desired outcomes – part of our efforts to find out ‘what works’, so that we can do more of the things that do work, and fewer of the things that do not.
Smart heating controls
In 2012, space heating accounted for approximately 60 per cent of energy consumption in homes and over 15 per cent of the total UK energy use. Despite this, heating controls installed in many households are often reported as being difficult to use, unintuitive and not conducive to energy efficient heating practices.
The Nest Learning Thermostat (NLT) has been designed to address these issues, aiming to provide users with easier and more intuitive control over household heating. It uses adaptive algorithms to automatically change heating settings in response to varied occupancy and weather conditions.
This latest generation of smart technology is of particular interest to the UK Department for Business, Energy and Industrial Strategy (BEIS), which is responsible for overseeing the government’s carbon budget commitments. However, to date there has been a shortage of robust, UK-based evidence on the effectiveness of smart heating technology.
To help increase the evidence base, BIT has been commissioned by Nest to carry out an independent evaluation of the effect of the NLT on the energy consumption of existing Nest and Npower customers. This study is the first of its kind in the UK.
Elisabeth Costa, Head of Consumers, Energy and Sustainability
4. Energy, Sustainability and Consumers
39
Update Report 2015-16
© Behavioural Insights Ltd. Not to be reproduced without the permission of the Behavioural Insights Team
Random allocation of NLTs was not possible, so we undertook a quasi-experimental study, making use of a propensity score match between existing Nest customers and non-Nest customers. This was based on historical gas consumption and a range of household and postcode level characteristics (see Box 4.1 below). This allowed us to compare like-for-like when observing the trends in energy consumption of households who have opted into Nest, and a matched sample of non-Nest households, whilst controlling for observable characteristics including historic energy consumption, temperature differences and a range of demographic and household variables.
The results of this research have provided statistically significant evidence that the NLT saves substantial amounts of energy. These phase one findings (which were explorative in nature with some data restrictions) have informed the second phase of this research, which will be run during the winters of 2016/17, and has been designed to determine the energy saving potential of the NLT to a much higher degree of precision. This will be achieved by drawing upon higher quality, smart-meter data from homes in a small-scale randomised controlled trial (RCT), merged with classic meter data and survey responses from a larger cohort of self-selected Nest and non-Nest homes. This approach aims to maintain the many benefits of an RCT whilst also benefiting from a much larger sample than would be feasible with a pure RCT.
Box 4.1: Propensity Score Matching (PSM)
Observational or quasi-experimental studies can be similar to RCTs as they have well defined treatment groups and interventions, but differ in that the assignment of the intervention is not random and often motivated by practical or ethical considerations. For example in the Nest study above, it was not possible to randomly assign NLTs. Instead, we were restricted to studying households who had opted into buying the devices (or not) themselves.
Measuring the impact of non-randomly assigned interventions can be problematic due to the risk of self-selection bias. Those opting into the intervention may be systematically different to those that do not and as such we cannot be sure if an observed difference in outcome is due to the intervention or to pre-existing differences between groups. Matching is a technique to create a control group that is similar, on all observable characteristics, to the group that received the intervention. In theory, this allows us to compare ‘apples-to-apples’ and therefore to isolate the
causal effect of the intervention on the outcome.
There are a range of possible matching techniques. Propensity Score Matching (PSM) uses regression analysis to identify the extent to which covariates predict participants’ propensity to receive the treatment. We then match each treated participant (i.e. they have a Nest device) with an untreated participant with a similar propensity score. In the case of the Nest study, we know that members of our treatment group have opted into buying a NLT, so we will build a model based upon the extent to which various characteristics are predictive of doing so (for example, household size, type, occupancy, age and socio-economic status might all be correlated with the tendency to buy a NLT, to varying degrees). For each NLT household we then select, from a larger pool of non-Nest households, the household with the most similar propensity to buy an NLT, based on the same characteristics, and assign it as the ‘control’.
40
Update Report 2015-16
© Behavioural Insights Ltd. Not to be reproduced without the permission of the Behavioural Insights Team © Behavioural Insights Ltd. Not to be reproduced without the permission of the Behavioural Insights Team
Invariably, there are limitations to the causal inferences possible with these techniques. Principally, that it is only possible to match on observable characteristics. We have to assume that by matching on these observable covariates, we have also matched on characteristics we cannot observe that might also affect the outcome variable. For example with the Nest study, we were able to match households on house type, occupancy, location and
various socio-economic factors. However, we could not match on characteristics for which we have no data (such as ‘environmental awareness’), despite their obvious importance to our outcome measure of gas consumption. Therefore, we used a variety of matching methods and supplementary statistical techniques to overcome some of the potential bias. All of these methods lead to a common finding that the NLT saves energy.
Smart meter roll-out
By the end of 2020, energy suppliers are required to offer all households in England, Scotland and Wales the opportunity to have a smart meter installed. Smart meters are expected to deliver a direct reduction in energy demand and support a range of parallel policy objectives, such as enhanced retail competition, security of supply and as a foundation for more active management of the demand for energy in the future. As part of the roll-out, consumers will be able to access real-time information about their energy usage through freely offered ‘in-home displays’.
There is recognition that innovative feedback channels such as mobile phone apps, or home energy reports, might provide equivalent (or additional) benefits to consumers and potentially reduce costs. The problem is that, at present, the quality of the GB evidence base relating to specific approaches is not robust. As a result, the Department of Energy and Climate Change (now the Department for Business, Energy and Industrial Strategy) has recently amended Licence Conditions to provide enablers for suppliers to trial the potential for alternatives to in-home displays. We are supporting BEIS in setting the criteria for evaluations of approaches that might be alternatives to ‘in-home displays’ to ensure that supplier trials generate robust, useful evidence.
The criteria allow for trials at varying scales, with a range of research objectives, designed to deliver a comprehensive evidence base on alternative products, while also meeting supplier objectives. A key requirement for BEIS is evidence on the impact of alternative products on the level of consumer energy consumption relative to an ‘in-home display’ counterfactual. Guidance issued to suppliers also includes requirements for qualitative and quantitative research into consumer acceptance of alternative products and the mechanisms by which they enable energy savings.
BEIS will consider the need to amend smart metering policy in light of the evidence gathered. We think that this programme of work has the potential to help taxpayers and consumers to save money on their energy bills and in turn can help showcase significant energy and carbon wins from innovative approaches. The evaluation of alternatives in itself demonstrates how testing and trialling can be integrated with a department’s operational programme to good effect.
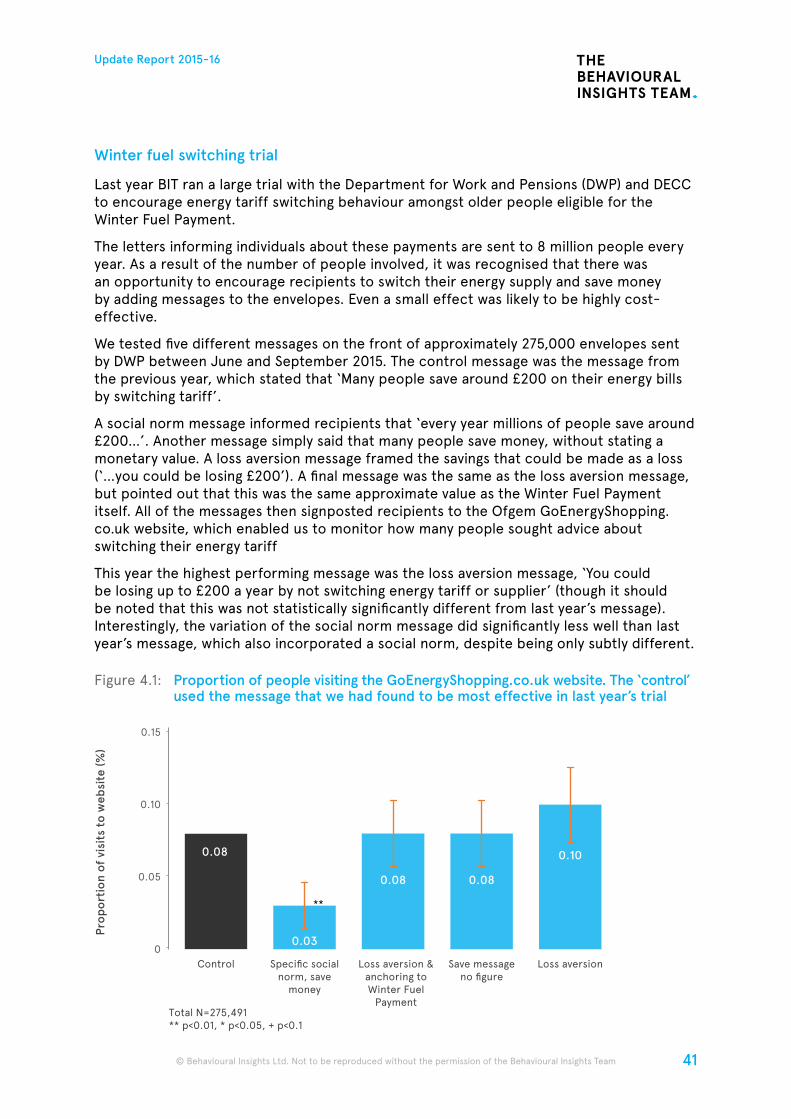
41
Update Report 2015-16
© Behavioural Insights Ltd. Not to be reproduced without the permission of the Behavioural Insights Team
Winter fuel switching trial
Last year BIT ran a large trial with the Department for Work and Pensions (DWP) and DECC to encourage energy tariff switching behaviour amongst older people eligible for the Winter Fuel Payment.
The letters informing individuals about these payments are sent to 8 million people every year. As a result of the number of people involved, it was recognised that there was an opportunity to encourage recipients to switch their energy supply and save money by adding messages to the envelopes. Even a small effect was likely to be highly cost-effective.
We tested five different messages on the front of approximately 275,000 envelopes sent by DWP between June and September 2015. The control message was the message from the previous year, which stated that ‘Many people save around £200 on their energy bills by switching tariff’.
A social norm message informed recipients that ‘every year millions of people save around £200…’. Another message simply said that many people save money, without stating a monetary value. A loss aversion message framed the savings that could be made as a loss (‘…you could be losing £200’). A final message was the same as the loss aversion message, but pointed out that this was the same approximate value as the Winter Fuel Payment itself. All of the messages then signposted recipients to the Ofgem GoEnergyShopping.co.uk website, which enabled us to monitor how many people sought advice about switching their energy tariff
This year the highest performing message was the loss aversion message, ‘You could be losing up to £200 a year by not switching energy tariff or supplier’ (though it should be noted that this was not statistically significantly different from last year’s message). Interestingly, the variation of the social norm message did significantly less well than last year’s message, which also incorporated a social norm, despite being only subtly different.
Figure 4.1: Proportion of people visiting the GoEnergyShopping.co.uk website. The ‘control’ used the message that we had found to be most effective in last year’s trial
Control
Total N=275,491** p<0.01, * p<0.05, + p<0.1
Specific socialnorm, save
money
Loss aversionSave messageno figure
Loss aversion &anchoring toWinter Fuel
Payment
0.15
0.05
0.10
Prop
orti
on o
f vi
sits
to
web
site
(%)
0
**
0.08
0.08 0.08
0.10
0.03
42
Update Report 2015-16
© Behavioural Insights Ltd. Not to be reproduced without the permission of the Behavioural Insights Team © Behavioural Insights Ltd. Not to be reproduced without the permission of the Behavioural Insights Team
Following these trials, DWP printed the best performing message on the envelopes of all 8 million Winter Fuel Payment letters sent out last winter.
Plymouth thermal imaging trial
One of the challenges with encouraging people to insulate their homes is that the benefits are often felt in the long term or are difficult to visualise (the potential to make your house warmer and cosier). Anything that makes the potential benefits more tangible to consumers might help to encourage more of them to take action.
In 2014, BIT became aware of research by Plymouth University academics that found that showing householders detailed thermal images of their own homes led to them reduce their energy use in the following year.19 BIT led a collaboration between Plymouth Council and Plymouth University to test if showing householders thermal images would increase the uptake of a generous Government grant, in which they could claim up to £4,200 towards the costs of solid wall home insulation.
Using infra-red photography, Plymouth University took photographs of Plymouth homes that showed the warmth radiating through the walls of typical homes when the heating was on, to show the difference between houses that had good insulation and those that did not.
With BIT’s support, Plymouth Council (through Plymouth Energy Community) sent letters to its residents. Run as a RCT, the control was a simple letter outlining the grant money on offer. The second variant included an image of a typical uninsulated home, glowing orange with escaping energy; while the third variant showed an additional image, which allowed the resident to see what a typical home that had been insulated looked like compared with the uninsulated house. Those living in Victorian homes were sent images of a Victorian property, and those living in a concrete home were sent images of a concrete home.
In this case, the new letters actually resulted in fewer people making a phone call to enquire about the scheme relative to the control. When we see results like this, it is important to go back to why we test and trial in the first place: to see if something works.
One reason why the images may not have been effective at encouraging take-up of insulation is that they may not have seemed relevant to the recipient, as the pictures were generic and were not taken of their own home. Another reason may have been that householders may not have understood them. In this specific trial, the thermal images were not successful at encouraging solid wall insulation, but Plymouth University continue to build the evidence base for thermal imaging as a communication tool. Plymouth Council are considering various approaches to encourage energy efficient behaviours.
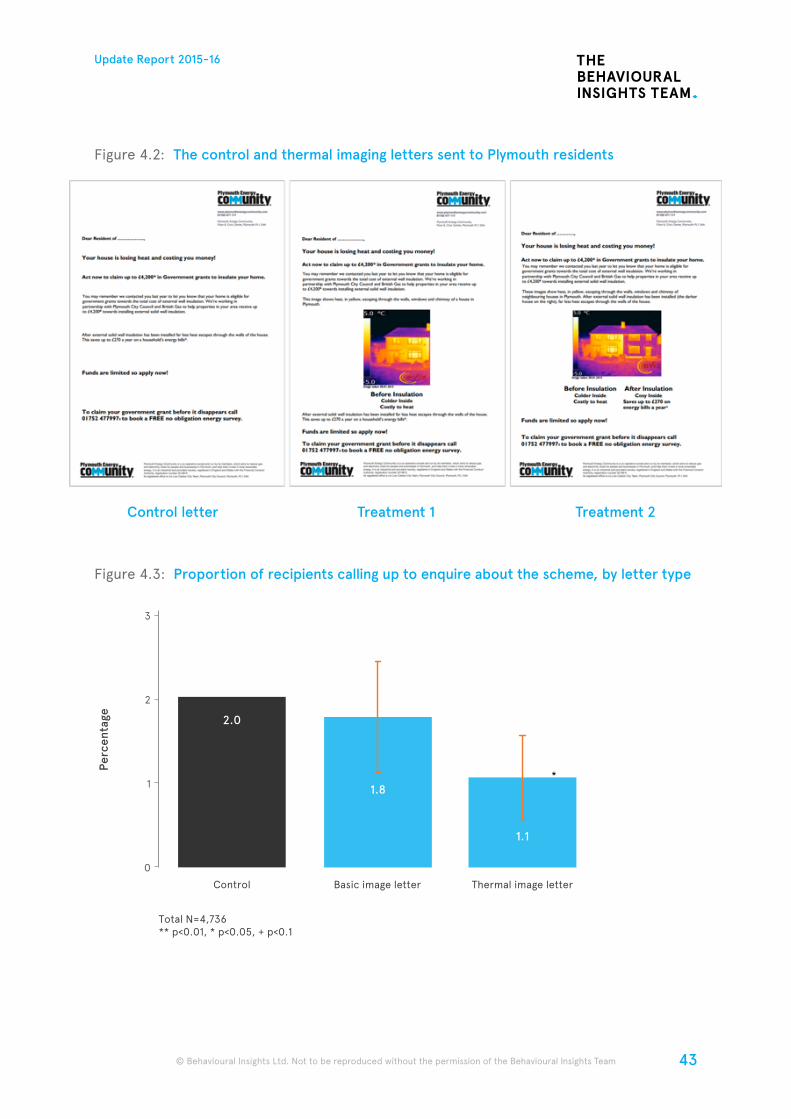
43
Update Report 2015-16
© Behavioural Insights Ltd. Not to be reproduced without the permission of the Behavioural Insights Team
Figure 4.2: The control and thermal imaging letters sent to Plymouth residents
Control letter Treatment 1 Treatment 2
Figure 4.3: Proportion of recipients calling up to enquire about the scheme, by letter type
Control
Total N=4,736** p<0.01, * p<0.05, + p<0.1
Basic image letter Thermal image letter
3
1
2
Perc
enta
ge
0
*
2.0
1.8
1.1

44
Update Report 2015-16
© Behavioural Insights Ltd. Not to be reproduced without the permission of the Behavioural Insights Team © Behavioural Insights Ltd. Not to be reproduced without the permission of the Behavioural Insights Team
Regulating consumer markets
In 2016, we were commissioned by Citizens Advice to produce a new paper on the regulation of consumer markets. The paper enabled us to bring together a compelling case for changing the way in which consumer markets are regulated with an analysis of Citizens Advice data on consumer advice trends.20
The paper argues that the core role of regulators has historically been focused on the correction of market failures and the consumer detriment that arises from those failures. Our contention is that the traditional approach to regulation often fails to take full account of the ways in which consumers behave in practice. For example, consumers often stick with the incumbent provider rather than switching supplier (‘status quo bias’). Giving consumers more options when they are making choices does not necessarily lead to better outcomes and can, in some cases, lead to a situation where they experience ‘choice overload’.
In the paper, we therefore proposed a different approach to what it means to regulate. At the heart of this new vision is what we call ‘behavioural market failures’ as an additional justification for, and focus of, regulatory intervention. We still advocate what economics has long strived for in market design: good outcomes for consumers, but instead of trying to make people more like rational economic actors, we argue that markets should deliver good outcomes by being designed in line with human behaviour.
The paper argues that, to achieve this vision, regulators should:
• Set the criteria for what a well-functioning market looks like from a consumer perspective;
• Collect and publish data to see whether markets are performing in line with these criteria;
• Design remedies for overcoming behavioural market failures, if these are present; and
• Test if these remedies are having the intended effect.
We are now working with regulators and the UK Government to follow-up this work with a view to developing it further and applying the ideas in practice.
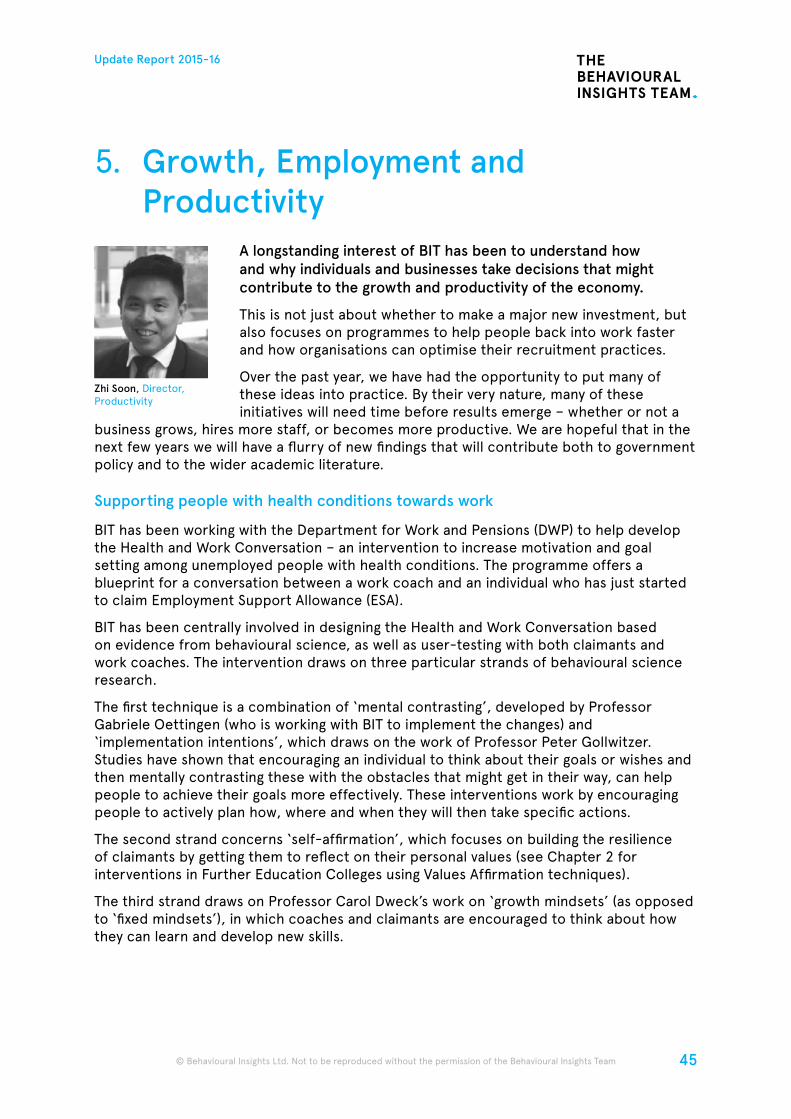
45
Update Report 2015-16
© Behavioural Insights Ltd. Not to be reproduced without the permission of the Behavioural Insights Team
A longstanding interest of BIT has been to understand how and why individuals and businesses take decisions that might contribute to the growth and productivity of the economy.
This is not just about whether to make a major new investment, but also focuses on programmes to help people back into work faster and how organisations can optimise their recruitment practices.
Over the past year, we have had the opportunity to put many of these ideas into practice. By their very nature, many of these initiatives will need time before results emerge – whether or not a
business grows, hires more staff, or becomes more productive. We are hopeful that in the next few years we will have a flurry of new findings that will contribute both to government policy and to the wider academic literature.
Supporting people with health conditions towards work
BIT has been working with the Department for Work and Pensions (DWP) to help develop the Health and Work Conversation – an intervention to increase motivation and goal setting among unemployed people with health conditions. The programme offers a blueprint for a conversation between a work coach and an individual who has just started to claim Employment Support Allowance (ESA).
BIT has been centrally involved in designing the Health and Work Conversation based on evidence from behavioural science, as well as user-testing with both claimants and work coaches. The intervention draws on three particular strands of behavioural science research.
The first technique is a combination of ‘mental contrasting’, developed by Professor Gabriele Oettingen (who is working with BIT to implement the changes) and ‘implementation intentions’, which draws on the work of Professor Peter Gollwitzer. Studies have shown that encouraging an individual to think about their goals or wishes and then mentally contrasting these with the obstacles that might get in their way, can help people to achieve their goals more effectively. These interventions work by encouraging people to actively plan how, where and when they will then take specific actions.
The second strand concerns ‘self-affirmation’, which focuses on building the resilience of claimants by getting them to reflect on their personal values (see Chapter 2 for interventions in Further Education Colleges using Values Affirmation techniques).
The third strand draws on Professor Carol Dweck’s work on ‘growth mindsets’ (as opposed to ‘fixed mindsets’), in which coaches and claimants are encouraged to think about how they can learn and develop new skills.
5. Growth, Employment and Productivity
Zhi Soon, Director, Productivity
46
Update Report 2015-16
© Behavioural Insights Ltd. Not to be reproduced without the permission of the Behavioural Insights Team © Behavioural Insights Ltd. Not to be reproduced without the permission of the Behavioural Insights Team
BIT has worked with DWP to test the Health and Work Conversation in seven Jobcentres across the country. This involved training work coaches in the new approach, observing them deliver it to claimants and getting qualitative feedback from work coaches. Currently, we are also trying out the Health and Work Conversation in one Jobcentre that has already switched to Universal Credit. The qualitative evaluation of the tests is currently underway by DWP.
Trials to reduce discrimination against pregnancy and maternity
Earlier this year, BIT partnered with the Equality and Human Rights Commission (EHRC) to look at ways to reduce discrimination against women around pregnancy and maternity. In particular, we looked at how behavioural science could help increase the number of jobs advertised as open to flexible working, increase the number of managers who proactively manage pregnancy-related health and safety issues and reduce unconscious bias towards pregnant women or women of childbearing age in recruitment. We are now running two separate trials looking at different ways to encourage employers to behave in ways that improve the workplace for pregnant women and new mothers and therefore boost gender equality.
The first trial will be conducted in partnership with a recruitment website. The aim is to see if making behaviourally informed changes to the job advert template can increase the number of employers or recruiters who offer flexible working options when posting a vacancy. The second trial focuses on improving the relationship between line managers and pregnant staff with a view to improving how supported women feel, reducing any negative impact on the health and wellbeing of pregnant members of staff and increasing the likelihood of women staying in employment.
The behavioural science of recruitment and selection
In Autumn 2015, BIT completed an analysis of the behavioural science of recruitment and selection processes on behalf of the Chartered Institute of Personnel and Development (CIPD). CIPD recognised that behavioural science literature had much to offer in relation to how recruiters make recruitment decisions and wanted to harness the latest available knowledge to help improve hiring practices. The result was a major new BIT report: A Head for Hiring: the Behavioural Science of Recruitment and Selection.21
The report first examines the growing evidence that how employers conduct outreach efforts and utilise existing networks will determine who ends up in their applicant pool. One advantage of in-house outreach teams is that they can be set objectives for diversifying the talent search. Recent evidence from behavioural science also shows that even small changes to how a job advert is framed can have a disproportionate effect on who applies and subsequently, how they perform on the job. As one illustration, stereotypically masculine words such as ‘challenge’ or ‘pride’ were more likely to attract male candidates compared to stereotypically feminine words such as ‘nurture’ and ‘support’.22
The second section of the report surveys the evidence behind the use of selection and assessment tools as well as the biases and judgement errors that may occur when using these tools. Fortunately, there are often simple tweaks that can be made to use the tools in a more effective way. Anonymising or jointly comparing CVs helps assessors to concentrate on the information that matters, for example.
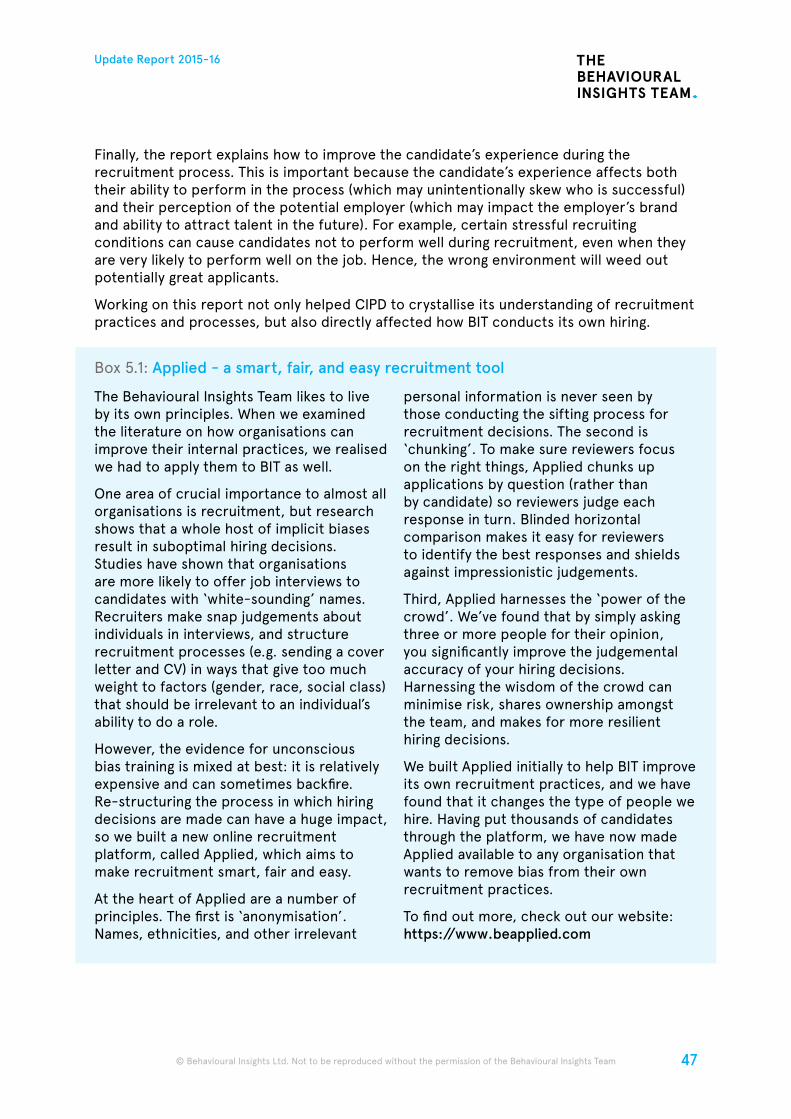
47
Update Report 2015-16
© Behavioural Insights Ltd. Not to be reproduced without the permission of the Behavioural Insights Team
Finally, the report explains how to improve the candidate’s experience during the recruitment process. This is important because the candidate’s experience affects both their ability to perform in the process (which may unintentionally skew who is successful) and their perception of the potential employer (which may impact the employer’s brand and ability to attract talent in the future). For example, certain stressful recruiting conditions can cause candidates not to perform well during recruitment, even when they are very likely to perform well on the job. Hence, the wrong environment will weed out potentially great applicants.
Working on this report not only helped CIPD to crystallise its understanding of recruitment practices and processes, but also directly affected how BIT conducts its own hiring.
Box 5.1: Applied - a smart, fair, and easy recruitment tool
The Behavioural Insights Team likes to live by its own principles. When we examined the literature on how organisations can improve their internal practices, we realised we had to apply them to BIT as well.
One area of crucial importance to almost all organisations is recruitment, but research shows that a whole host of implicit biases result in suboptimal hiring decisions. Studies have shown that organisations are more likely to offer job interviews to candidates with ‘white-sounding’ names. Recruiters make snap judgements about individuals in interviews, and structure recruitment processes (e.g. sending a cover letter and CV) in ways that give too much weight to factors (gender, race, social class) that should be irrelevant to an individual’s ability to do a role.
However, the evidence for unconscious bias training is mixed at best: it is relatively expensive and can sometimes backfire. Re-structuring the process in which hiring decisions are made can have a huge impact, so we built a new online recruitment platform, called Applied, which aims to make recruitment smart, fair and easy.
At the heart of Applied are a number of principles. The first is ‘anonymisation’. Names, ethnicities, and other irrelevant
personal information is never seen by those conducting the sifting process for recruitment decisions. The second is ‘chunking’. To make sure reviewers focus on the right things, Applied chunks up applications by question (rather than by candidate) so reviewers judge each response in turn. Blinded horizontal comparison makes it easy for reviewers to identify the best responses and shields against impressionistic judgements.
Third, Applied harnesses the ‘power of the crowd’. We’ve found that by simply asking three or more people for their opinion, you significantly improve the judgemental accuracy of your hiring decisions. Harnessing the wisdom of the crowd can minimise risk, shares ownership amongst the team, and makes for more resilient hiring decisions.
We built Applied initially to help BIT improve its own recruitment practices, and we have found that it changes the type of people we hire. Having put thousands of candidates through the platform, we have now made Applied available to any organisation that wants to remove bias from their own recruitment practices.
To find out more, check out our website: https://www.beapplied.com
48
Update Report 2015-16
© Behavioural Insights Ltd. Not to be reproduced without the permission of the Behavioural Insights Team © Behavioural Insights Ltd. Not to be reproduced without the permission of the Behavioural Insights Team
Boosting growth through a better understanding of ‘animal spirits’
Economists have long understood that psychological factors influence the economy. John Maynard Keynes famously referred to the importance of ‘animal spirits’ on the decisions we take – that many of our economic decisions are the result of a ‘spontaneous urge to action’ rather than the ‘outcome of a weighted average of quantitative benefits multiplied by quantitative probabilities’.23
Despite the importance of ‘animal spirits’ in explaining economic outcomes, very little work has been done to see whether or not we can use the existing ‘urge to action’ to encourage businesses to engage in more productive economic activity.24 For instance, can systematic biases – such as paying more attention to bad rather than good economic news – be reduced?
BIT has set about doing what we think is a global first: building on an understanding of ‘animal spirits’ to design practical interventions to improve market functioning and boost economic growth. The first such intervention draws on a well-established behavioural effect that BIT has used in many policy areas: ‘declarative’ social norms to inform individuals about what other people are already doing. This has been an effective way to encourage more people to pay their taxes and fines and to discourage GPs from prescribing unnecessary antibiotics (see Chapter 1).
We have begun a programme of work with the Department for International Trade (formerly UK Trade and Investment) and the Confederation of British Industry to test whether comparative information can encourage businesses to change their behaviour. For example, can messages about what comparable businesses are doing encourage a company to export or hire more employees? If this works, it may be one of the first examples of ‘animal spirits’ as a potential policy tool.
Encouraging long-term investments
A growing body of evidence suggests that short-termism – i.e. a tendency to focus on short term rewards over longer-term benefits – is more prevalent with respect to economic behaviours in the UK than in other advanced economies. This may help to explain for example, why UK businesses spend less on research and development than other G7 countries – avoiding short-term expenditure at the cost of long-term returns.
There is a huge range of behavioural science literature on temporal discounting and in particular, our tendency to prefer rewards in the present to (larger) rewards in the future. With this and other behavioural biases in mind, the Treasury has asked BIT to support a programme of work on ‘long-termism’. BIT’s initial research has centred on an extensive literature review and qualitative interviews with individuals who are in a position to take long-term investment decisions.
These pieces of research are revealing a number of patterns that show how the environment in which decisions are made (the ‘choice architecture’) has the potential to affect the nature of decisions. For example, executives often feel under pressure to demonstrate short-term returns as a result of quarterly reporting. Although quarterly
49
Update Report 2015-16
© Behavioural Insights Ltd. Not to be reproduced without the permission of the Behavioural Insights Team
reporting is not a requirement for London Stock Exchange listings, firms can fear they will be seen as hiding something unless they publicise such short-term results. Similarly, though many firms have put in place pay and reward packages intended to promote the longer term growth of shareholder value, our research suggests that many of these are too complex or inadequately salient to have the intended effect.
Our hope is that by analysing the way in which investment decisions are taken, and the environment in which they are made, we can put in place practices that will help encourage longer-term decisions – and that will in turn support future economic productivity and growth.
50
Update Report 2015-16
© Behavioural Insights Ltd. Not to be reproduced without the permission of the Behavioural Insights Team © Behavioural Insights Ltd. Not to be reproduced without the permission of the Behavioural Insights Team
BIT has always had a strong focus on giving and social action. Whether it’s helping charities to raise money, supporting social purpose organisations to enhance their impact, or understanding whether social purpose activities have an impact on people’s wider outcomes.
As we explained in last year’s Update Report, there is a good reason why we care about this area: research shows that giving both time and money not only benefits the causes that are supported, but it is good for the givers and for society at large.
Over the past year, we have expanded this work. In some areas (like charitable giving), this has meant growing the depth and range
of trials that we have run, to help organisations understand in even more detail what drives donations. In other areas, like youth social action, it has meant running innovative evaluations to understand better (and sometimes for the first time) ‘what works’.
We will continue to develop our work within this area over the coming year and will share the final results of various trials in next year’s Update Report.
Evaluating Youth Social Action
In 2013, the Centre for Social Action (led by the Cabinet Office) and the Education Endowment Foundation invited applications to receive grants from a £5 million Youth Social Action Fund. The aim was to support a diverse range of social action projects targeted at young people who were given funding through the programme.
The Youth Social Action Fund was also seen as an opportunity to capture high quality data on the extent to which participating in social action initiatives might help to prepare young people for adulthood and specifically, work. To this end, BIT was commissioned to conduct an evaluation of the programmes. Whilst most projects of this kind have relied on qualitative data, we set out to collect quantitative data that might show whether or not social action causes and catalyses the development of skills for work and life in young people who take part.
BIT ran a set of evaluations, including randomised controlled trials (RCTs), to help compare the outcomes for young people who took part in the programmes against those who did not. In January 2016, we published the final report for this major evaluation exercise.25 The evaluations revealed that those who participated in the programmes showed small but significant improvements in their skills for work and life compared with their counterparts, as measured by reliable and validated questions.
Figure 6.1a shows the effects of participating in the Citizenship Foundation (CF) programme, which teaches young people about citizenship. We found that this programme increased a number of psychological traits including ‘empathy’ and ‘grit’ (non-cognitive skills like persistence and perseverance in relation to a long-term goal) in its participants.
Michael Sanders, Chief Scientist and Head of Research and Evaluation
6. Giving and Social Action
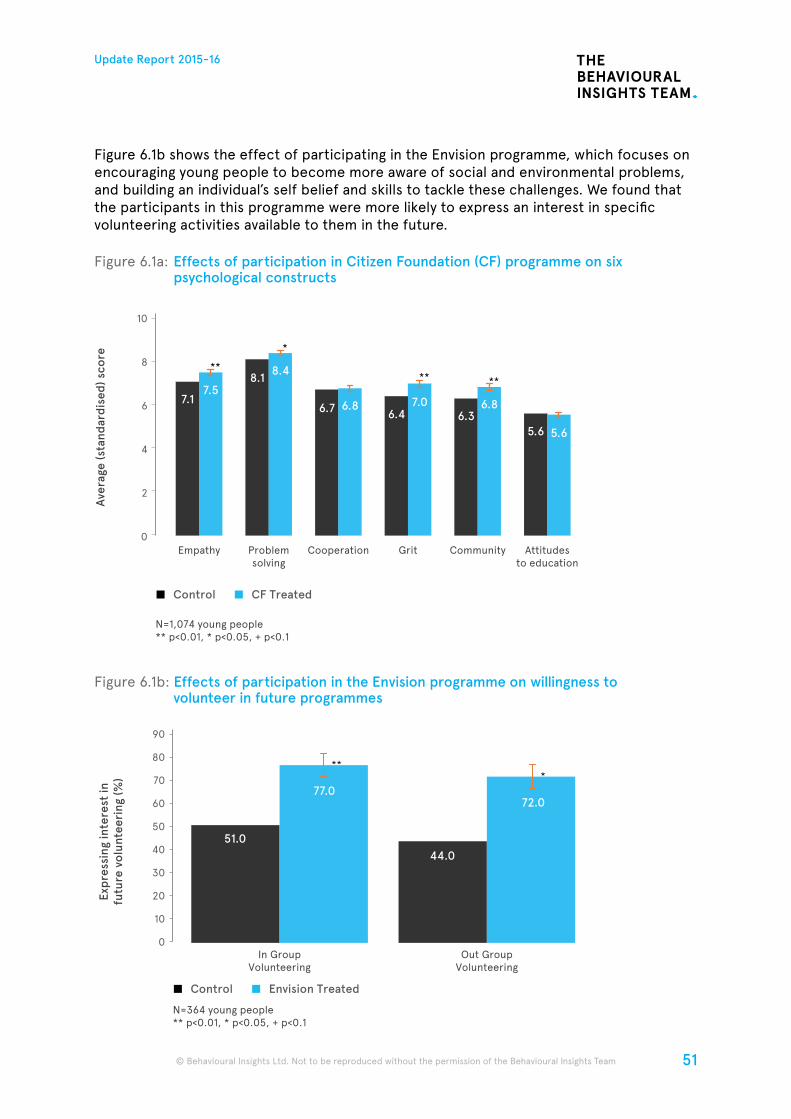
51
Update Report 2015-16
© Behavioural Insights Ltd. Not to be reproduced without the permission of the Behavioural Insights Team
Figure 6.1b shows the effect of participating in the Envision programme, which focuses on encouraging young people to become more aware of social and environmental problems, and building an individual’s self belief and skills to tackle these challenges. We found that the participants in this programme were more likely to express an interest in specific volunteering activities available to them in the future.
Figure 6.1a: Effects of participation in Citizen Foundation (CF) programme on six psychological constructs
Figure 6.1b: Effects of participation in the Envision programme on willingness to volunteer in future programmes
Empathy Problemsolving
Cooperation Grit Community Attitudesto education
10
6
4
2
8
Ave
rage
(sta
ndar
dise
d) s
core
0
1.1
N=1,074 young people** p<0.01, * p<0.05, + p<0.1
Control CF Treated
**
*
** **
7.17.5
8.18.4
6.7 6.86.4
7.06.3
6.8
5.6 5.6
20
10
80
40
30
50
60
70
Expr
essi
ng in
tere
st in
futu
re v
olun
teer
ing
(%)
90
0In Group
VolunteeringOut Group
Volunteering
51.0
77.0
44.0
72.0
***
N=364 young people** p<0.01, * p<0.05, + p<0.1
Control Envision Treated
52
Update Report 2015-16
© Behavioural Insights Ltd. Not to be reproduced without the permission of the Behavioural Insights Team © Behavioural Insights Ltd. Not to be reproduced without the permission of the Behavioural Insights Team
Perhaps surprisingly, we also found that those who had participated in the programmes were less willing to donate money to charity when given discretion to use a small amount of money – possibly because these young people already felt that they had ‘done their bit’.
National Citizen Service
The National Citizen Service (NCS) is a voluntary programme for 15-17 year olds. It is funded by the Cabinet Office, and designed to encourage young people to have an adventure, learn new skills and participate in social action activities. Around 200,000 young people have already participated in NCS, making it the fastest growing youth movement in the UK in 100 years. Previous evaluations of NCS have found it to have a positive impact on social mixing, the transition to adulthood, teamwork, communication and on leadership and community involvement.
In the 2015 Spending Review, it was announced that the NCS programme would be expanded further. The aim is to create a further 300,000 places by 2020, to ensure that even more young people are given the opportunity to participate and learn from the activities on offer. The NCS team contacted BIT to support a large programme of interventions. The aim was to learn which methods were most effective at getting young people to sign up to NCS, to reduce the rate at which young people drop out of the programme prior to turning up, and to improve future outcomes and experiences of these young people via the NCS curriculum.
This work is still in its early stages, but we have run several trials for the sign-up process which are already offering some early insights into which communication channels work best. Some have shown strong, positive impacts, while others show that initial instincts do not always result in positive effects.
One of the principal routes through which NCS recruits young people is via school assemblies. Therefore, one question that NCS was interested in was whether it is more effective to have NCS alumnus on stage talking about the experiences they have had (which might appear to be more ‘real’, and enables young people to ask questions); or whether it is better to use videos (which might enable more engaging materials to be used).
The preliminary answer seems to be that in this instance, an introductory video from NCS alumnus is most effective. The on-stage presence of young people who have participated in the programme previously was found not to be more effective than the standard school presentation at getting people to express an interest in NCS.
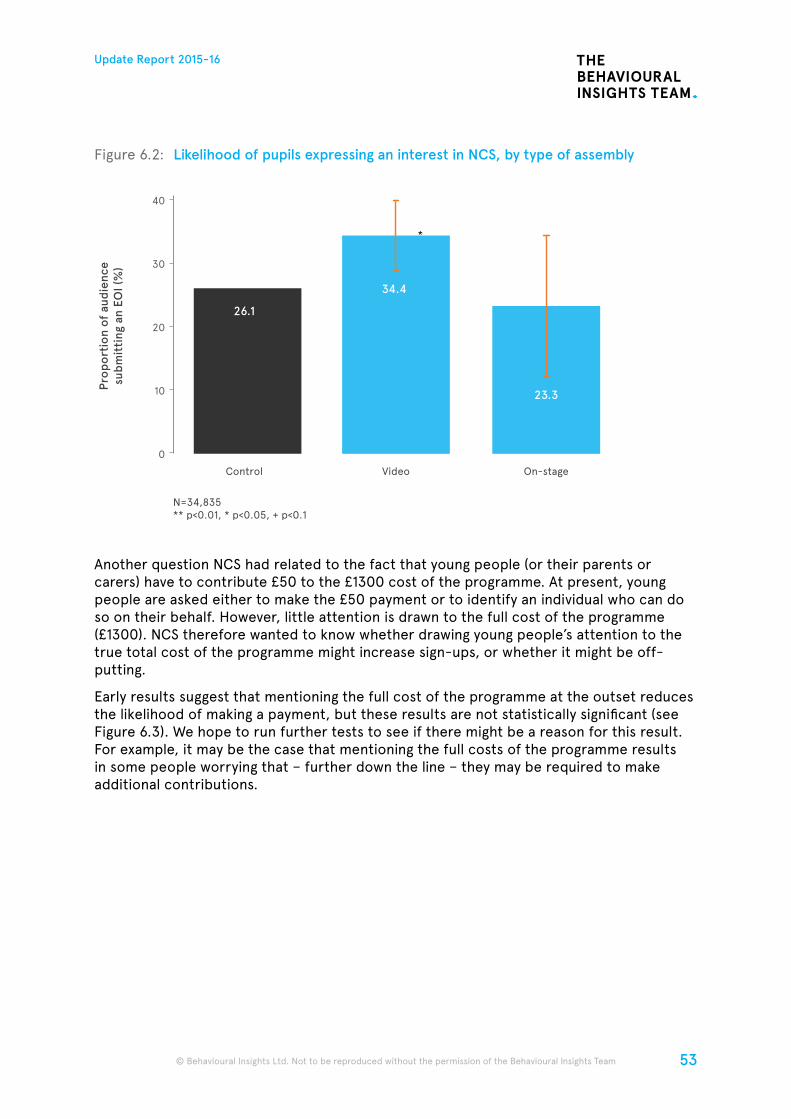
53
Update Report 2015-16
© Behavioural Insights Ltd. Not to be reproduced without the permission of the Behavioural Insights Team
Figure 6.2: Likelihood of pupils expressing an interest in NCS, by type of assembly
Another question NCS had related to the fact that young people (or their parents or carers) have to contribute £50 to the £1300 cost of the programme. At present, young people are asked either to make the £50 payment or to identify an individual who can do so on their behalf. However, little attention is drawn to the full cost of the programme (£1300). NCS therefore wanted to know whether drawing young people’s attention to the true total cost of the programme might increase sign-ups, or whether it might be off-putting.
Early results suggest that mentioning the full cost of the programme at the outset reduces the likelihood of making a payment, but these results are not statistically significant (see Figure 6.3). We hope to run further tests to see if there might be a reason for this result. For example, it may be the case that mentioning the full costs of the programme results in some people worrying that – further down the line – they may be required to make additional contributions.
Control
N=34,835** p<0.01, * p<0.05, + p<0.1
Video On-stage
10
40
20
30
Prop
orti
on o
f au
dien
cesu
bmit
ting
an
EOI (
%)
0
*
26.1
34.4
23.3
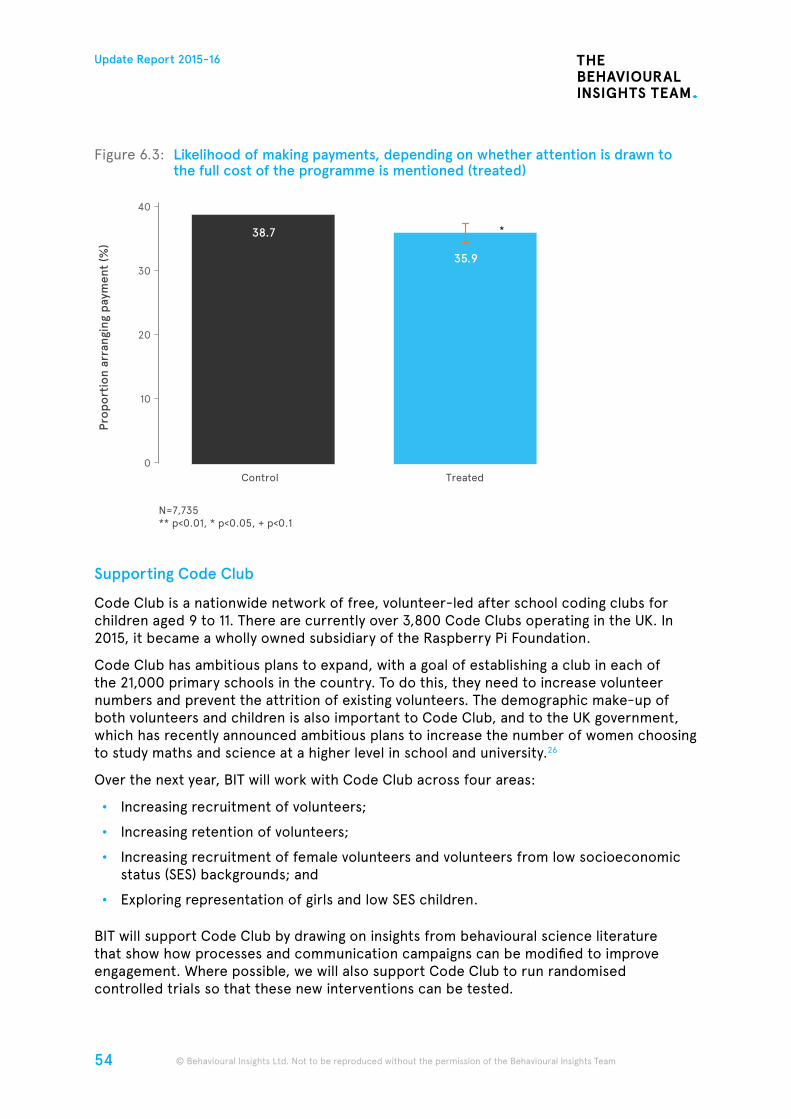
54
Update Report 2015-16
© Behavioural Insights Ltd. Not to be reproduced without the permission of the Behavioural Insights Team © Behavioural Insights Ltd. Not to be reproduced without the permission of the Behavioural Insights Team
Figure 6.3: Likelihood of making payments, depending on whether attention is drawn to the full cost of the programme is mentioned (treated)
Supporting Code Club
Code Club is a nationwide network of free, volunteer- led after school coding clubs for children aged 9 to 11. There are currently over 3,800 Code Clubs operating in the UK. In 2015, it became a wholly owned subsidiary of the Raspberry Pi Foundation.
Code Club has ambitious plans to expand, with a goal of establishing a club in each of the 21,000 primary schools in the country. To do this, they need to increase volunteer numbers and prevent the attrition of existing volunteers. The demographic make-up of both volunteers and children is also important to Code Club, and to the UK government, which has recently announced ambitious plans to increase the number of women choosing to study maths and science at a higher level in school and university.26
Over the next year, BIT will work with Code Club across four areas:
• Increasing recruitment of volunteers;
• Increasing retention of volunteers;
• Increasing recruitment of female volunteers and volunteers from low socioeconomic status (SES) backgrounds; and
• Exploring representation of girls and low SES children.
BIT will support Code Club by drawing on insights from behavioural science literature that show how processes and communication campaigns can be modified to improve engagement. Where possible, we will also support Code Club to run randomised controlled trials so that these new interventions can be tested.
30
20
10
40
0
Prop
orti
on a
rran
ging
pay
men
t (%
)
Control
N=7,735** p<0.01, * p<0.05, + p<0.1
Treated
*38.7
35.9
55
Update Report 2015-16
© Behavioural Insights Ltd. Not to be reproduced without the permission of the Behavioural Insights Team
7. Reducing Fraud, Error and Debt
Since 2010, BIT has conducted numerous trials aimed at reducing fraud, error and debt with the UK Government. This work has historically focused on increasing payments by changing the messages sent in letters to individuals who were late to declare their income tax. We have previously reported the social impact that these trials have had – helping to bring forward hundreds of millions of pounds in additional revenue to the UK Exchequer.
Over the past few years, the insights at the heart of these letters trials have been built upon, both by BIT through our work with local authorities and international governments (documented elsewhere in this report) and by the HMRC Behavioural and Customer Insight Team.
This section shows BIT’s work on new aspects of tax compliance. It includes trials that show how we can: help people avoid being late with their tax in the first place (rather than improving the pursuit of late payments); influence corporations (not just individuals); and use new communication channels (like SMS prompts).
Preventing tax debts
The first trial focused on people who were due to make a Self-Assessment payment at the end of July 2015. The aim was to help prevent people from incurring tax debts and fines by prompting them before the payment deadline.
Ten days before the deadline, people were divided into two groups. The ‘Letter’ group was made up of people who did not have a valid mobile phone number according to HMRC records and the ‘SMS’ group comprised those who did.
Within the ‘Letter’ group, people were randomly allocated to receive a reminder letter, or no reminder. Which reminder letter the individual received depended on which one of three groups the person fell into. The first letter was for people who were new to Self-Assessment, but had missed their first payment, due in January 2015 (these are labelled ‘New’ in Figure 7.1). Letters to this group included a sentence noting the previous late payment.
The second letter was for those who had been late several times in the past. Letters to this group included a sentence noting these previous late payments (‘Recurring’). The third letter was for people who had been late in the past, but had made their last payment on time. Letters to this group thanked the recipient for the recent timely payment, while noting the previous late payments (‘Reformed’).
Receiving a reminder letter significantly increased payment rates. It increased ‘New’ people paying by 34 per cent; ‘Recurring’ late payers by 59 per cent; and ‘Reformed’ individuals by 22 per cent (see Figure 7.2). Importantly, these effects endured even after HMRC had undertaken other enforcement actions: three months later, the payment rates of those receiving letters were still higher.
Michael Hallsworth, Director, Health and Tax
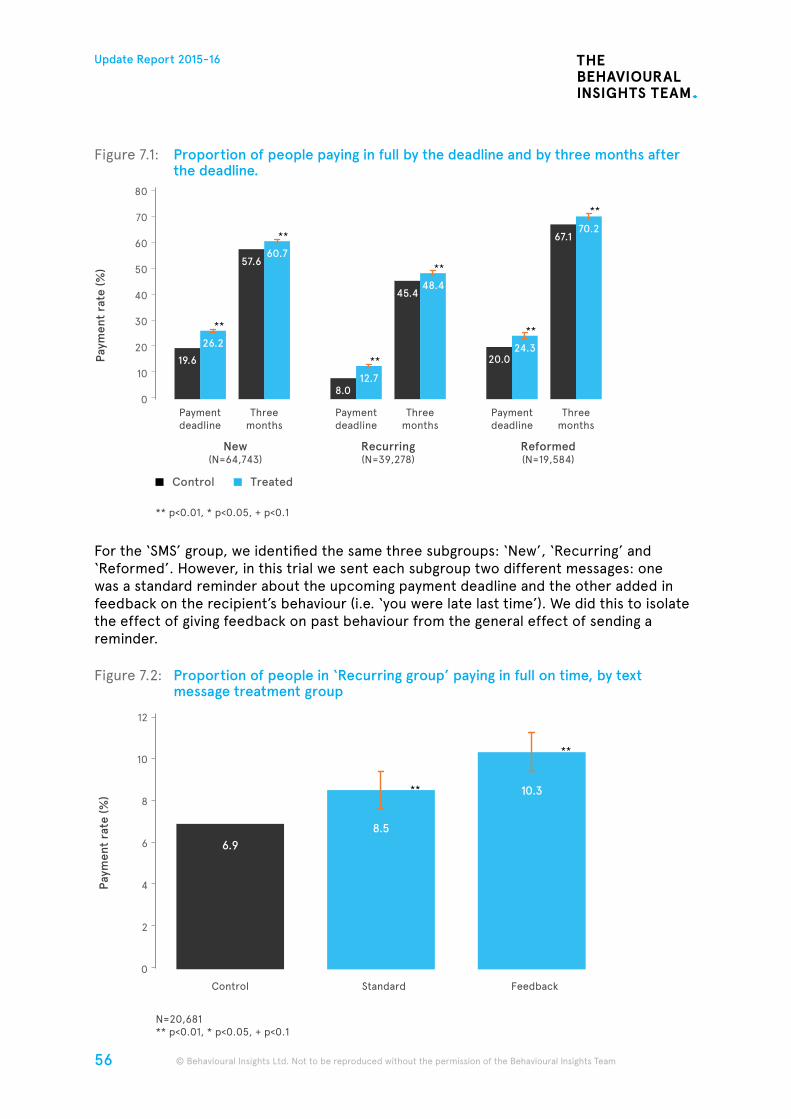
56
Update Report 2015-16
© Behavioural Insights Ltd. Not to be reproduced without the permission of the Behavioural Insights Team © Behavioural Insights Ltd. Not to be reproduced without the permission of the Behavioural Insights Team
Figure 7.1: Proportion of people paying in full by the deadline and by three months after the deadline.
For the ‘SMS’ group, we identified the same three subgroups: ‘New’, ‘Recurring’ and ‘Reformed’. However, in this trial we sent each subgroup two different messages: one was a standard reminder about the upcoming payment deadline and the other added in feedback on the recipient’s behaviour (i.e. ‘you were late last time’). We did this to isolate the effect of giving feedback on past behaviour from the general effect of sending a reminder.
Figure 7.2: Proportion of people in ‘Recurring group’ paying in full on time, by text message treatment group
Paymentdeadline
** p<0.01, * p<0.05, + p<0.1
Threemonths
New(N=64,743)
Recurring(N=39,278)
Reformed(N=19,584)
Paymentdeadline
Threemonths
Paymentdeadline
Threemonths
80
60
40
50
20
30
10
70
Paym
ent
rate
(%)
0
Control Treated
19.6
26.2
57.660.7
**
**
8.012.7
45.448.4
**
**
20.024.3
67.170.2
**
**
Control
N=20,681** p<0.01, * p<0.05, + p<0.1
Standard Feedback
6
4
2
12
8
10
Paym
ent
rate
(%)
0
**
**
6.98.5
10.3
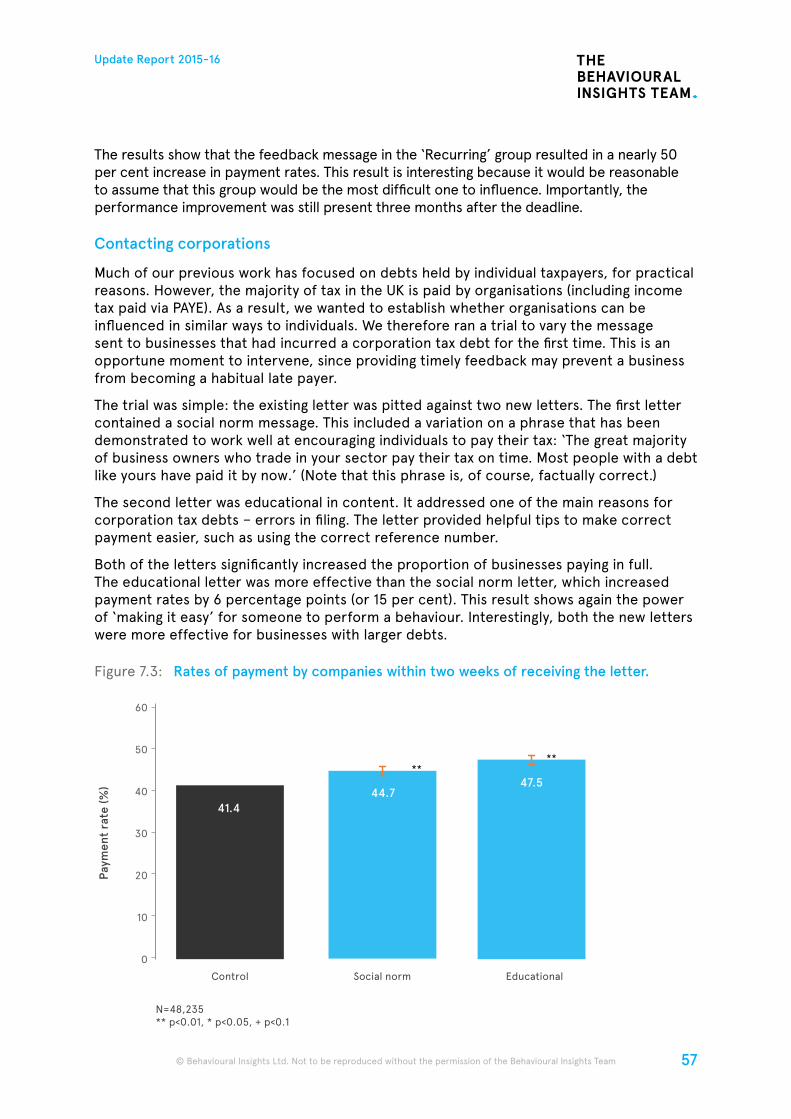
57
Update Report 2015-16
© Behavioural Insights Ltd. Not to be reproduced without the permission of the Behavioural Insights Team
The results show that the feedback message in the ‘Recurring’ group resulted in a nearly 50 per cent increase in payment rates. This result is interesting because it would be reasonable to assume that this group would be the most difficult one to influence. Importantly, the performance improvement was still present three months after the deadline.
Contacting corporations
Much of our previous work has focused on debts held by individual taxpayers, for practical reasons. However, the majority of tax in the UK is paid by organisations (including income tax paid via PAYE). As a result, we wanted to establish whether organisations can be influenced in similar ways to individuals. We therefore ran a trial to vary the message sent to businesses that had incurred a corporation tax debt for the first time. This is an opportune moment to intervene, since providing timely feedback may prevent a business from becoming a habitual late payer.
The trial was simple: the existing letter was pitted against two new letters. The first letter contained a social norm message. This included a variation on a phrase that has been demonstrated to work well at encouraging individuals to pay their tax: ‘The great majority of business owners who trade in your sector pay their tax on time. Most people with a debt like yours have paid it by now.’ (Note that this phrase is, of course, factually correct.)
The second letter was educational in content. It addressed one of the main reasons for corporation tax debts – errors in filing. The letter provided helpful tips to make correct payment easier, such as using the correct reference number.
Both of the letters significantly increased the proportion of businesses paying in full. The educational letter was more effective than the social norm letter, which increased payment rates by 6 percentage points (or 15 per cent). This result shows again the power of ‘making it easy’ for someone to perform a behaviour. Interestingly, both the new letters were more effective for businesses with larger debts.
Figure 7.3: Rates of payment by companies within two weeks of receiving the letter.
Control
N=48,235** p<0.01, * p<0.05, + p<0.1
Social norm Educational
30
20
10
60
40
50
Paym
ent
rate
(%)
0
****
41.444.7
47.5
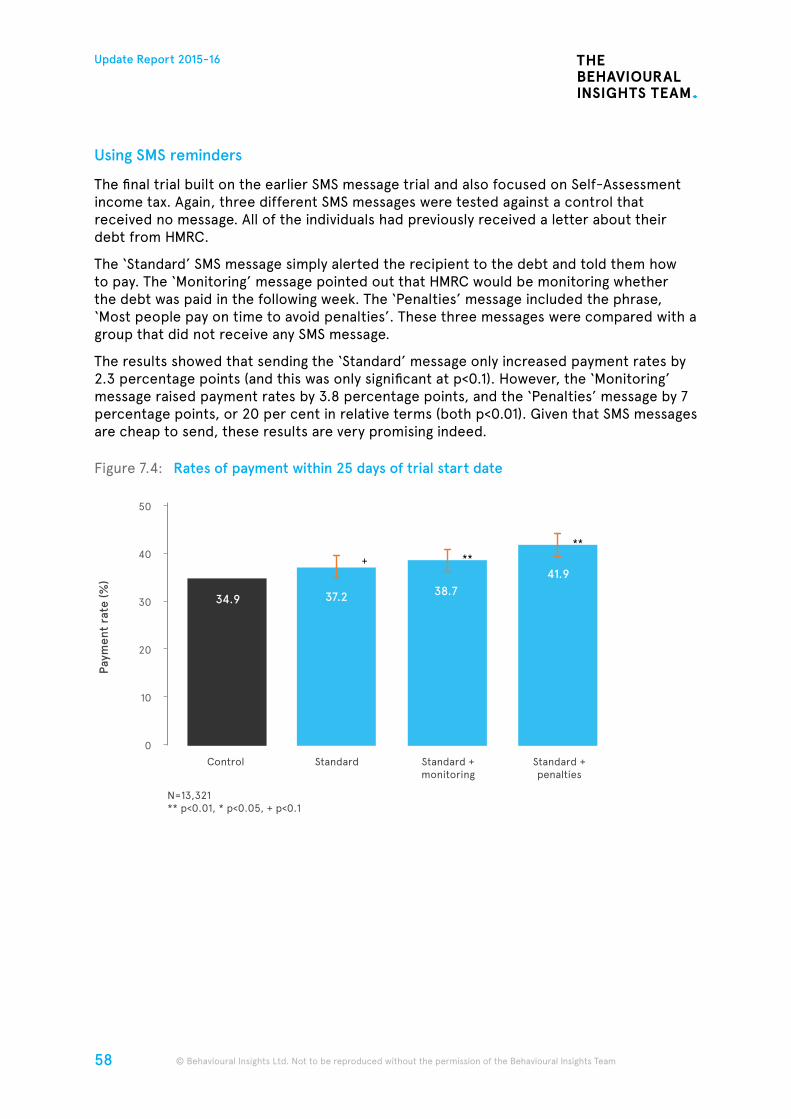
58
Update Report 2015-16
© Behavioural Insights Ltd. Not to be reproduced without the permission of the Behavioural Insights Team © Behavioural Insights Ltd. Not to be reproduced without the permission of the Behavioural Insights Team
Using SMS reminders
The final trial built on the earlier SMS message trial and also focused on Self-Assessment income tax. Again, three different SMS messages were tested against a control that received no message. All of the individuals had previously received a letter about their debt from HMRC.
The ‘Standard’ SMS message simply alerted the recipient to the debt and told them how to pay. The ‘Monitoring’ message pointed out that HMRC would be monitoring whether the debt was paid in the following week. The ‘Penalties’ message included the phrase, ‘Most people pay on time to avoid penalties’. These three messages were compared with a group that did not receive any SMS message.
The results showed that sending the ‘Standard’ message only increased payment rates by 2.3 percentage points (and this was only significant at p<0.1). However, the ‘Monitoring’ message raised payment rates by 3.8 percentage points, and the ‘Penalties’ message by 7 percentage points, or 20 per cent in relative terms (both p<0.01). Given that SMS messages are cheap to send, these results are very promising indeed.
Figure 7.4: Rates of payment within 25 days of trial start date
Control
N=13,321** p<0.01, * p<0.05, + p<0.1
Standard Standard +monitoring
Standard +penalties
20
10
50
30
40
Paym
ent
rate
(%)
0
+ ****
34.9 37.2 38.741.9
59
Update Report 2015-16
© Behavioural Insights Ltd. Not to be reproduced without the permission of the Behavioural Insights Team
BIT has always recognised the great potential for local authorities taking up the behavioural insights baton. Some of our earliest reports – on fraud, error and debt and on energy and sustainability – showed how local authorities were able to quickly introduce new practices that saved significant sums of money, or improved existing practices.
Until recently, BIT has been limited in its capacity to support specific local authorities. Over the course of the last year, this has started to change. BIT has developed a local and devolved government team, which is helping local authorities across England. We have also responded to a request by the Welsh Government to harness insights from the behavioural sciences to improve its service delivery.
This programme of work has been given a boost by the devolution agenda, which has given English cities powers to test new initiatives. As a result of these changes, this year we started a programme of work with the Greater Manchester Combined Authority (GMCA) and set up a new office in Manchester to act as BIT’s regional hub in the North of England.
BIT’s new office: Manchester
BIT opened its new Manchester office in May 2016 and will work directly with the GMCA. Manchester is at the forefront of the new devolution agenda with agreements covering several major policy areas – health and social care spending, children’s services, planning, skills and criminal justice.
It is likely that the work in Manchester will begin by focusing on areas that can quickly show how behavioural insights can help improve the efficiency of a new service, while also bringing in additional revenues to the city (e.g. charges or council tax collection).
Over time, BIT will start to focus on more complex policy areas that are priorities for the GMCA, for example, in health and social care. This will result in BIT establishing new partnerships with organisations across the region and beyond. This might include police forces, NHS trusts and other cities with devolution agreements who want to apply behavioural insights to their policy areas. It will also provide a quick route for us to test central government priorities at a regional level.
Alongside these specific projects, BIT will build behavioural insights capacity and capability within Greater Manchester, just as we have done in Australia, the US and Singapore (see Chapters 10, 11, and 12). This will help ensure that the models that we put in place are self-sustaining, and should deliver greater impact at larger scale more quickly.
8. Manchester, Local and Devolved Authorities
Felicity Algate, Director, BIT UK:North
60
Update Report 2015-16
© Behavioural Insights Ltd. Not to be reproduced without the permission of the Behavioural Insights Team © Behavioural Insights Ltd. Not to be reproduced without the permission of the Behavioural Insights Team
London councils
In London, we have started a programme of work with London Councils that will use behavioural insights to test and trial the delivery and design of local services. The project is sponsored by Capital Ambition and led by Croydon Council.
The work will cover two types of projects. The first will be two relatively simple trials that will focus on improving services in areas where we can draw on existing work and which have already proven to be effective. These will aim to increase the collection of council tax and recycling rates in Croydon.
The second set of projects includes scoping studies that consider the role for behavioural insights in more complex areas. The studies will focus on hospital discharge (linked to our health team’s work on Accident and Emergency services, as described in Chapter 1), public health and on adult and children’s social care.
We hope that the findings from these London projects will be informed by, and help to feed back to, our work in Manchester and with other local authorities across the country.
Local Government Association
We have begun a partnership with the Local Government Association (LGA). The LGA is keen to test how behavioural insights can be used in the high demand areas of public health, adult social care and skills. Therefore, they are sponsoring projects across three different cities and counties.
In Liverpool, we are focusing on improving public health. Specifically, we are working with Liverpool City Council and a supermarket to help people switch to lower sugar products by considering approaches like location of products as well as signage (see Chapter 1 for the results of similar trials that have been shown to be effective elsewhere).
In Leeds, we are running a trial with the adult social care team to see if we can help people live independently for longer. To do this we are testing a change to the phone scripts at the initial point of contact between potential users of adult social care and the council.
In Lincolnshire, we are testing different ways of encouraging employers to improve the skills of their workforce.
We will be working with the LGA to disseminate the results of these trials across local government once new findings are available.
Social workers’ decision making
In April 2014, BIT published a qualitative study, commissioned by the Department for Education (DfE), examining how social workers make decisions at the ‘front door’ of the social care system and which factors might be influencing these decisions. The ‘front door’ is the point at which members of the public or other professionals raise concerns about a child, and a social worker must decide whether or not to progress the case for further action (for example, conducting a full Child and Family Assessment).
In July 2016, we published our follow-up report, in which we used data analysis to examine the factors that influenced social worker decision-making in over 120,000 cases. This report is the first of its kind and analysed cases covering around 49,000 children from three local authorities over five years.
61
Update Report 2015-16
© Behavioural Insights Ltd. Not to be reproduced without the permission of the Behavioural Insights Team
The paper examined how ten sets of factors correlated with a case’s likelihood of progressing to further action and whether subsequent, more serious steps are taken (for example, putting in place a Child Protection Plan). These include:
• Factors about the child or family (such as the child’s age or previous family involvement in social care);
• Contextual factors about how the case is received (for example who makes the referral or what day of the week it comes in); and
• Factors about the social worker making the decision (for example their experience level).
The most striking overall theme is how mixed the picture is across the three local authorities involved. The impact of a range of key factors varied not just in scale but also in direction. For example, in some local authorities an increase in a team’s caseload or a child’s age was associated with an increased chance of a case progressing. Whereas, in other local authorities it was associated with a reduced chance.
We also found that some factors are consistently associated with an increased or decreased chance of progression in all three areas studied. For example, there is a consistently lower likelihood of cases progressing to further action when the referral is received at a weekend. Similarly, referrals received by email (or another written form) are consistently less likely to progress to further action than those received by more immediate or personal means (by phone call or a personal visit, for example).
These results are interesting because they suggest that in many cases, the effect of these factors on decision-making is being moderated by other contextual factors. They also show the power of this type of approach in public services, indicating the considerable and currently untapped potential in exploring datasets of this type. Over the coming year we intend to expand our capacity in big data and machine learning approaches, using data analytics at scale to help inform the behavioural insights we bring to bear on policy challenges of this kind.
Council tax payments in Lewisham
BIT has run many trials that show how making simple changes to tax letters can result in an increase in tax payments. Almost all of these trials have been at national level (with HMRC), the latest findings from which are described in Chapter 7. We are now running trials of a similar kind with local authorities.
The first of our trials took place in Lewisham, where we redesigned the first reminder letter sent to those who had missed a council tax payment. The aim of the trial was to increase collection of tax as well as the number of people signing up to Direct Debit.
We tested three new versions of the letter. The first was a simplified letter with preferred methods of payment (Direct Debit and PayPoint) on the front page, a separate Direct Debit sign up form and a prepaid addressed envelope (Treatment 1). The second was the same simplified letter, but sent in an envelope with the message, ‘Sign up for Direct Debit and you have a chance to win £25,000’ (Treatment 2). This was part of a wider prize draw operating in London, rather than something specific to Lewisham.
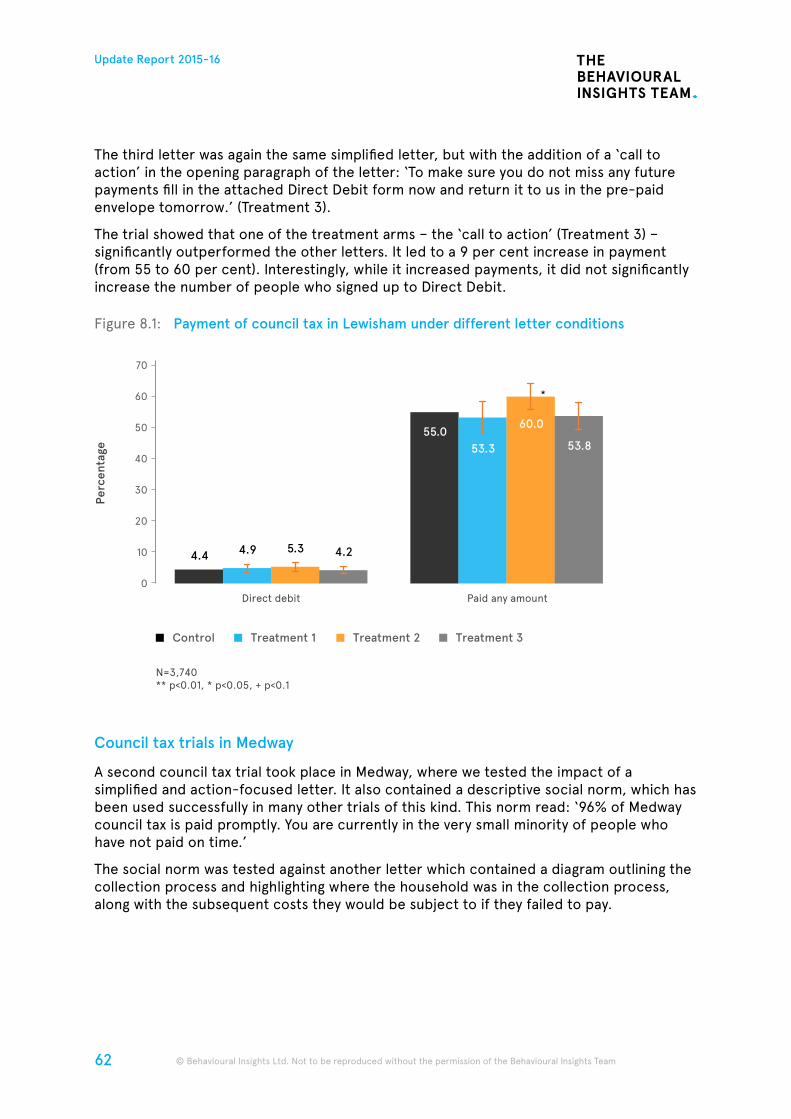
62
Update Report 2015-16
© Behavioural Insights Ltd. Not to be reproduced without the permission of the Behavioural Insights Team © Behavioural Insights Ltd. Not to be reproduced without the permission of the Behavioural Insights Team
The third letter was again the same simplified letter, but with the addition of a ‘call to action’ in the opening paragraph of the letter: ‘To make sure you do not miss any future payments fill in the attached Direct Debit form now and return it to us in the pre-paid envelope tomorrow.’ (Treatment 3).
The trial showed that one of the treatment arms – the ‘call to action’ (Treatment 3) – significantly outperformed the other letters. It led to a 9 per cent increase in payment (from 55 to 60 per cent). Interestingly, while it increased payments, it did not significantly increase the number of people who signed up to Direct Debit.
Figure 8.1: Payment of council tax in Lewisham under different letter conditions
Council tax trials in Medway
A second council tax trial took place in Medway, where we tested the impact of a simplified and action-focused letter. It also contained a descriptive social norm, which has been used successfully in many other trials of this kind. This norm read: ‘96% of Medway council tax is paid promptly. You are currently in the very small minority of people who have not paid on time.’
The social norm was tested against another letter which contained a diagram outlining the collection process and highlighting where the household was in the collection process, along with the subsequent costs they would be subject to if they failed to pay.
Perc
enta
ge
Direct debit Paid any amount
70
60
50
40
30
20
10
0
1.1
N=3,740** p<0.01, * p<0.05, + p<0.1
Control Treatment 1 Treatment 2 Treatment 3
4.4 4.9 5.3 4.2
55.053.3
60.0
53.8
*
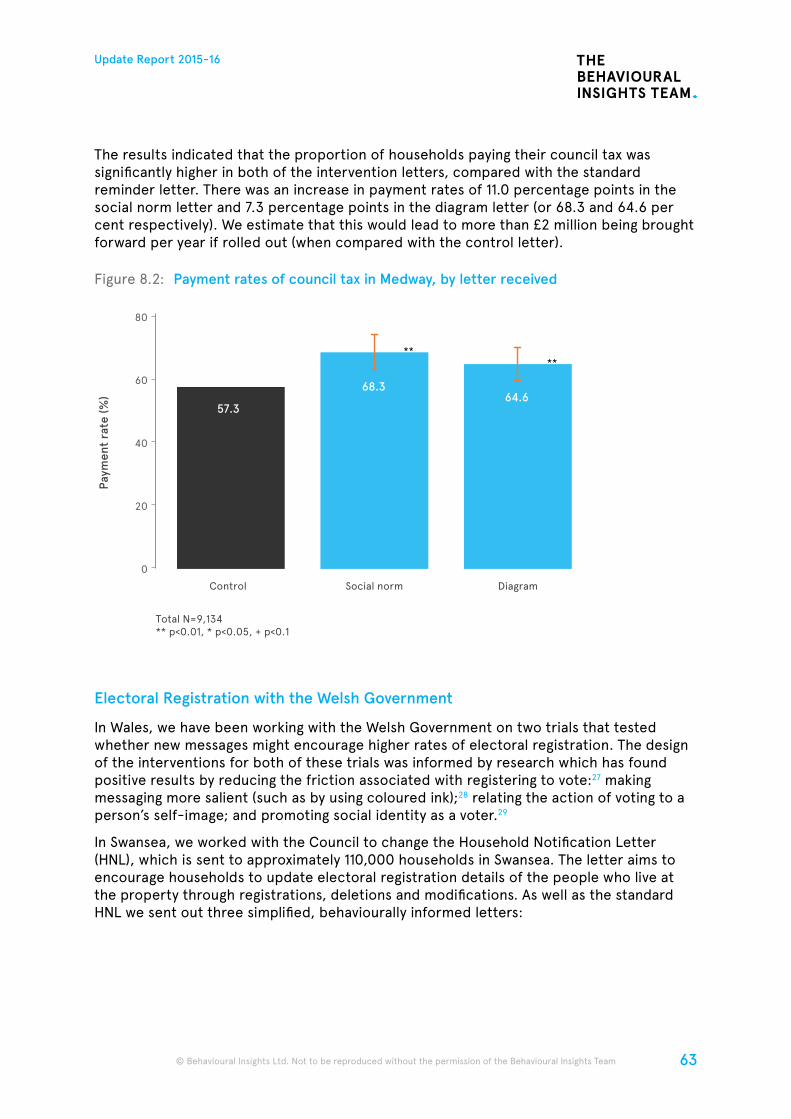
63
Update Report 2015-16
© Behavioural Insights Ltd. Not to be reproduced without the permission of the Behavioural Insights Team
The results indicated that the proportion of households paying their council tax was significantly higher in both of the intervention letters, compared with the standard reminder letter. There was an increase in payment rates of 11.0 percentage points in the social norm letter and 7.3 percentage points in the diagram letter (or 68.3 and 64.6 per cent respectively). We estimate that this would lead to more than £2 million being brought forward per year if rolled out (when compared with the control letter).
Figure 8.2: Payment rates of council tax in Medway, by letter received
Electoral Registration with the Welsh Government
In Wales, we have been working with the Welsh Government on two trials that tested whether new messages might encourage higher rates of electoral registration. The design of the interventions for both of these trials was informed by research which has found positive results by reducing the friction associated with registering to vote:27 making messaging more salient (such as by using coloured ink);28 relating the action of voting to a person’s self-image; and promoting social identity as a voter.29
In Swansea, we worked with the Council to change the Household Notification Letter (HNL), which is sent to approximately 110,000 households in Swansea. The letter aims to encourage households to update electoral registration details of the people who live at the property through registrations, deletions and modifications. As well as the standard HNL we sent out three simplified, behaviourally informed letters:
Control
Total N=9,134** p<0.01, * p<0.05, + p<0.1
Social norm Diagram
20
80
40
60
Paym
ent
rate
(%)
0
****
57.3
68.364.6
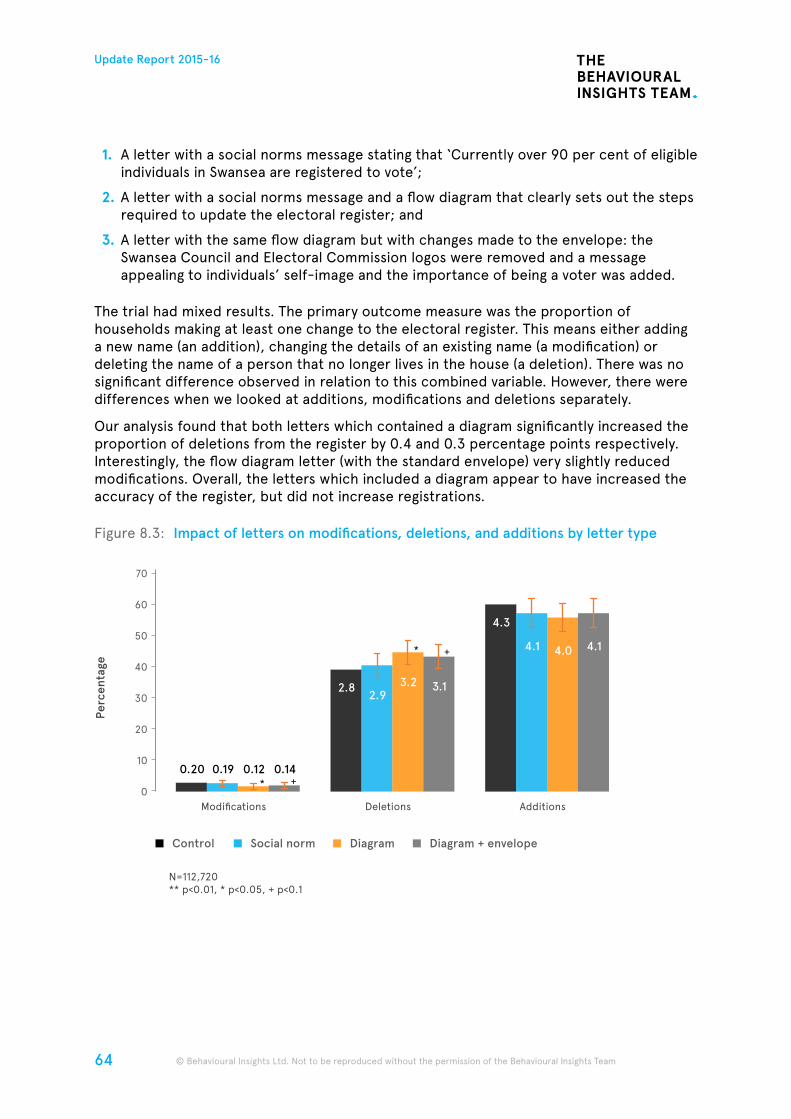
64
Update Report 2015-16
© Behavioural Insights Ltd. Not to be reproduced without the permission of the Behavioural Insights Team © Behavioural Insights Ltd. Not to be reproduced without the permission of the Behavioural Insights Team
1. A letter with a social norms message stating that ‘Currently over 90 per cent of eligible individuals in Swansea are registered to vote’;
2. A letter with a social norms message and a flow diagram that clearly sets out the steps required to update the electoral register; and
3. A letter with the same flow diagram but with changes made to the envelope: the Swansea Council and Electoral Commission logos were removed and a message appealing to individuals’ self-image and the importance of being a voter was added.
The trial had mixed results. The primary outcome measure was the proportion of households making at least one change to the electoral register. This means either adding a new name (an addition), changing the details of an existing name (a modification) or deleting the name of a person that no longer lives in the house (a deletion). There was no significant difference observed in relation to this combined variable. However, there were differences when we looked at additions, modifications and deletions separately.
Our analysis found that both letters which contained a diagram significantly increased the proportion of deletions from the register by 0.4 and 0.3 percentage points respectively. Interestingly, the flow diagram letter (with the standard envelope) very slightly reduced modifications. Overall, the letters which included a diagram appear to have increased the accuracy of the register, but did not increase registrations.
Figure 8.3: Impact of letters on modifications, deletions, and additions by letter type
Perc
enta
ge
Modifications Deletions Additions
70
60
50
40
30
20
10
0
N=112,720** p<0.01, * p<0.05, + p<0.1
Control Social norm Diagram Diagram + envelope
0.20 0.19 0.12 0.14
2.82.9
3.2 3.1
4.3
4.1 4.0 4.1
* +
* +
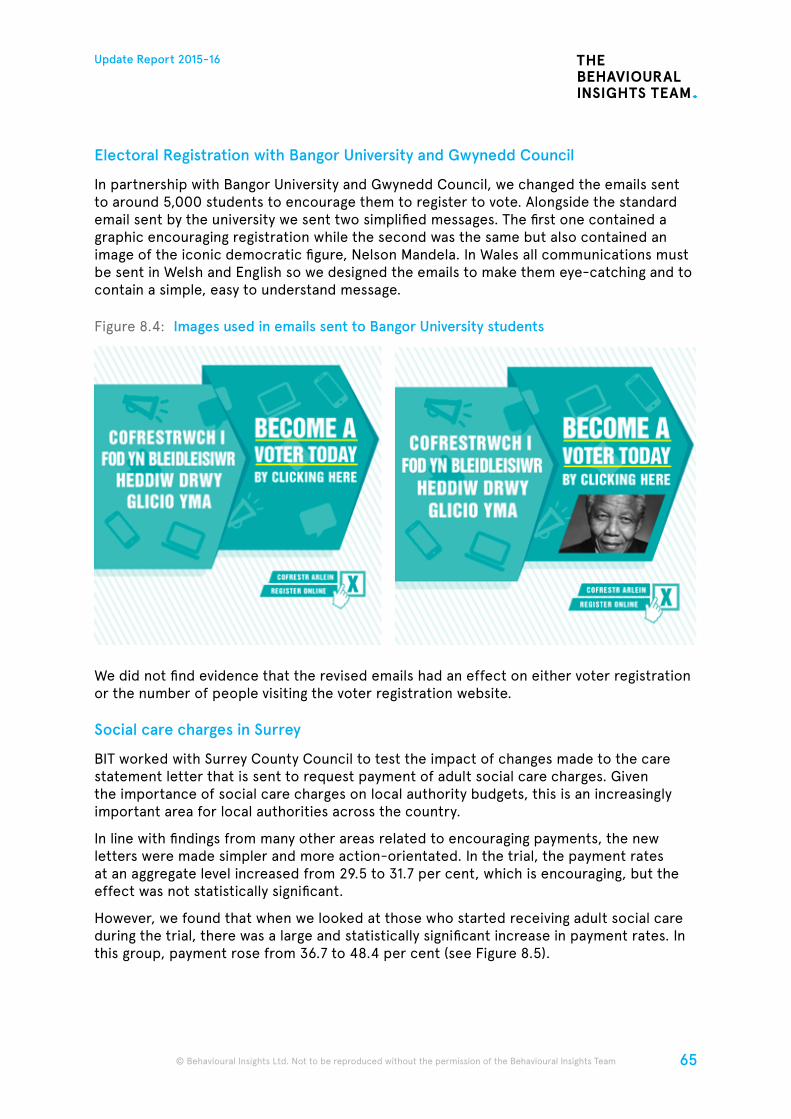
65
Update Report 2015-16
© Behavioural Insights Ltd. Not to be reproduced without the permission of the Behavioural Insights Team
Electoral Registration with Bangor University and Gwynedd Council
In partnership with Bangor University and Gwynedd Council, we changed the emails sent to around 5,000 students to encourage them to register to vote. Alongside the standard email sent by the university we sent two simplified messages. The first one contained a graphic encouraging registration while the second was the same but also contained an image of the iconic democratic figure, Nelson Mandela. In Wales all communications must be sent in Welsh and English so we designed the emails to make them eye-catching and to contain a simple, easy to understand message.
Figure 8.4: Images used in emails sent to Bangor University students
We did not find evidence that the revised emails had an effect on either voter registration or the number of people visiting the voter registration website.
Social care charges in Surrey
BIT worked with Surrey County Council to test the impact of changes made to the care statement letter that is sent to request payment of adult social care charges. Given the importance of social care charges on local authority budgets, this is an increasingly important area for local authorities across the country.
In line with findings from many other areas related to encouraging payments, the new letters were made simpler and more action-orientated. In the trial, the payment rates at an aggregate level increased from 29.5 to 31.7 per cent, which is encouraging, but the effect was not statistically significant.
However, we found that when we looked at those who started receiving adult social care during the trial, there was a large and statistically significant increase in payment rates. In this group, payment rose from 36.7 to 48.4 per cent (see Figure 8.5).
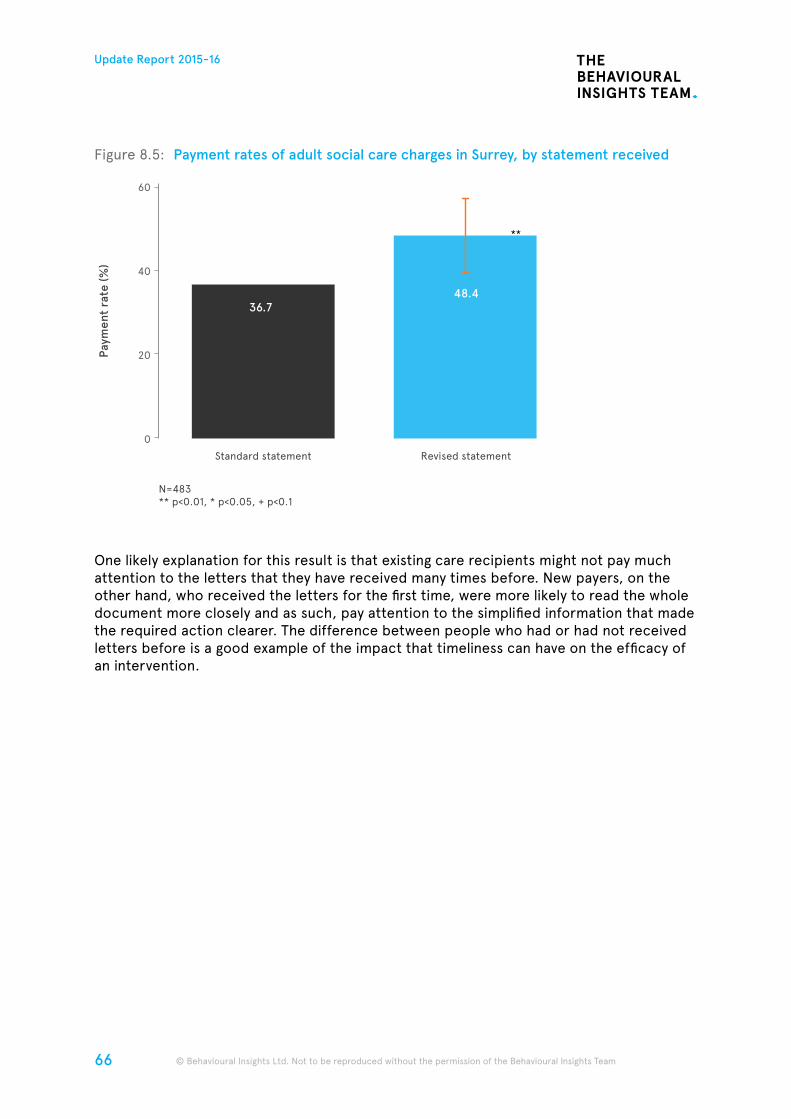
66
Update Report 2015-16
© Behavioural Insights Ltd. Not to be reproduced without the permission of the Behavioural Insights Team © Behavioural Insights Ltd. Not to be reproduced without the permission of the Behavioural Insights Team
Figure 8.5: Payment rates of adult social care charges in Surrey, by statement received
One likely explanation for this result is that existing care recipients might not pay much attention to the letters that they have received many times before. New payers, on the other hand, who received the letters for the first time, were more likely to read the whole document more closely and as such, pay attention to the simplified information that made the required action clearer. The difference between people who had or had not received letters before is a good example of the impact that timeliness can have on the efficacy of an intervention.
Standard statement
N=483** p<0.01, * p<0.05, + p<0.1
Revised statement
60
20
40
Paym
ent
rate
(%)
0
**
36.748.4

67
Update Report 2015-16
© Behavioural Insights Ltd. Not to be reproduced without the permission of the Behavioural Insights Team
9. International Programmes
In last year’s Update Report, we described how behavioural approaches were becoming increasingly popular with policymakers across the world, with BIT very much at the heart of that movement. We also described the results from our first trial on tax compliance in Guatemala, which tripled tax revenues from late income tax payers. These results showed that it was possible to translate findings from low cost interventions originally implemented in the UK to very different contexts around the world.
In the past year, we have increased the number, range and ambition of overseas programmes that we support from the UK.
Our tax compliance interventions have shown similarly impressive results in Costa Rica and Poland, and our projects are being extended through an exciting new partnership with the Global Innovation Fund.
We have also begun a new set of projects tackling more entrenched behaviours – such as health seeking behaviour during pregnancy in Mexico, medication adherence in Moldova, and a big new programme of work on anti-corruption. Some of these projects will take time to deliver findings, so in this year’s report we introduce the details of our interventions.
Increasing tax payments in Costa Rica
In March 2015, a BIT and World Bank partnership set up three trials in Costa Rica. The trials evaluated the impact of sending behaviourally informed email and SMS reminders to 80,000 firms that failed to submit their 2014 income tax declarations. In addition, we tested the impact of including third-party information: transactions recorded by other firms, state institutions and credit or debit card sales.
The first trial involved 12,515 firms for which the tax authority had a registered email address and third-party information. These firms were randomly allocated to either a control group that received no email, a treatment group that received a behaviourally-informed email reminder with a general statement highlighting use of third-party information or a treatment group which received a similar email, but with an example of third-party information detailing specific transactions made by that firm during the financial year.
Our results are presented in the following two graphs. The first graph shows how the behavioural reminders nearly tripled the rate of declaration by firms from 11.5 to 32.5 per cent. Including third-party information increased declaration further still (to 34.2 per cent). The second graph shows the impact on payment (converted to USD). The behavioural emails increased the average amount paid from $9 to $24, with specific third-party information increasing payment further to $27 (although this was not statistically significantly different from the behavioural emails without third-party information).
Simon Ruda, Director, Home Affairs and International Programmes
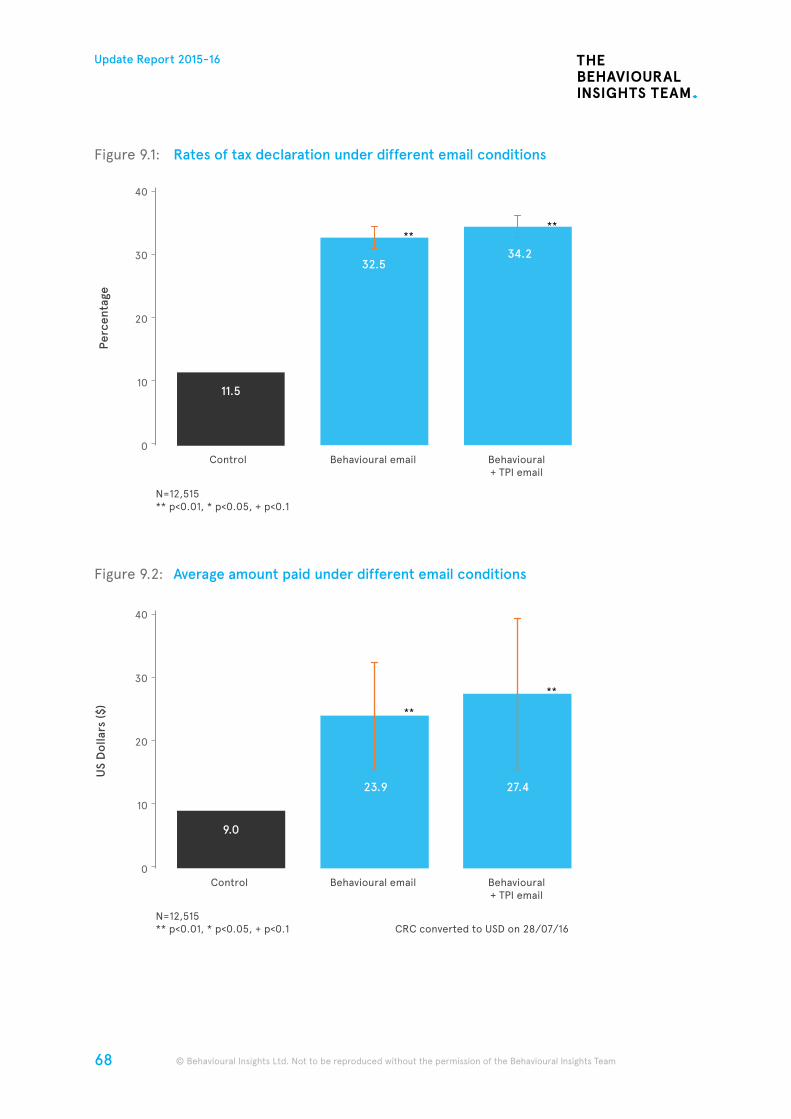
68
Update Report 2015-16
© Behavioural Insights Ltd. Not to be reproduced without the permission of the Behavioural Insights Team © Behavioural Insights Ltd. Not to be reproduced without the permission of the Behavioural Insights Team
Figure 9.1: Rates of tax declaration under different email conditions
Figure 9.2: Average amount paid under different email conditions
Control
N=12,515** p<0.01, * p<0.05, + p<0.1
Behavioural email Behavioural+ TPI email
10
40
20
30
Perc
enta
ge
0
****
11.5
32.534.2
Control
N=12,515** p<0.01, * p<0.05, + p<0.1 CRC converted to USD on 28/07/16
Behavioural email Behavioural+ TPI email
10
40
20
30
US
Dol
lars
($)
0
**
**
9.0
23.9 27.4
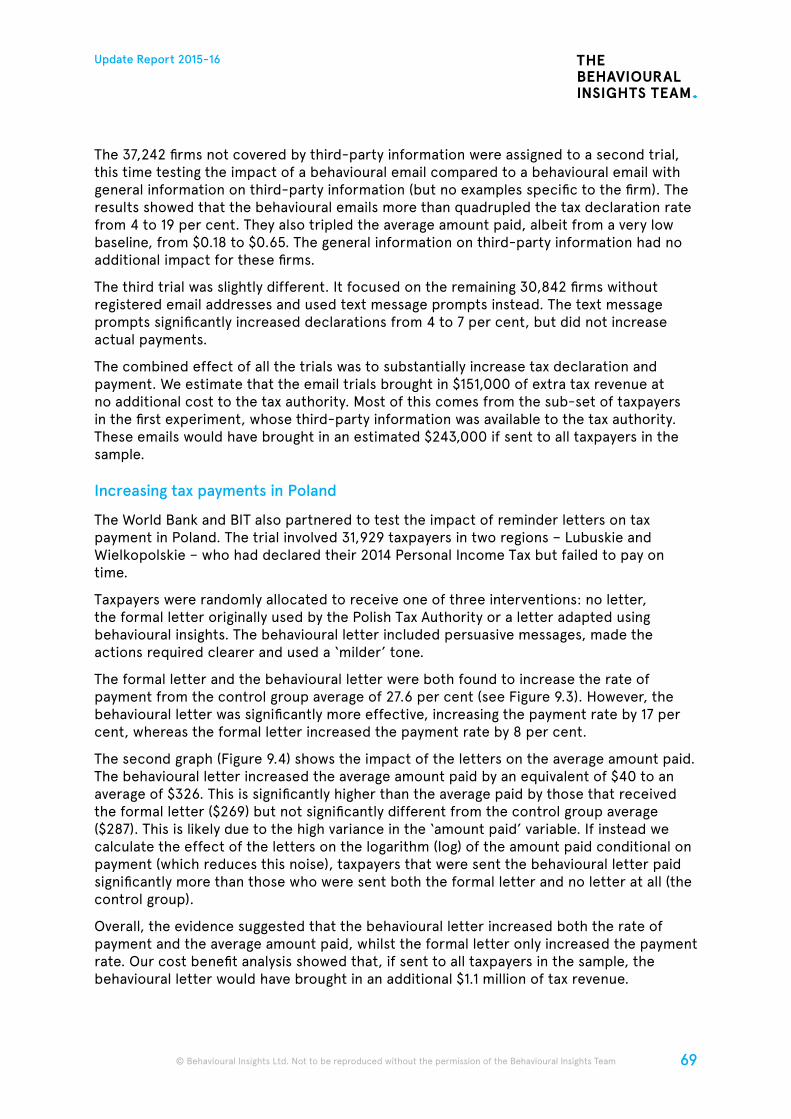
69
Update Report 2015-16
© Behavioural Insights Ltd. Not to be reproduced without the permission of the Behavioural Insights Team
The 37,242 firms not covered by third-party information were assigned to a second trial, this time testing the impact of a behavioural email compared to a behavioural email with general information on third-party information (but no examples specific to the firm). The results showed that the behavioural emails more than quadrupled the tax declaration rate from 4 to 19 per cent. They also tripled the average amount paid, albeit from a very low baseline, from $0.18 to $0.65. The general information on third-party information had no additional impact for these firms.
The third trial was slightly different. It focused on the remaining 30,842 firms without registered email addresses and used text message prompts instead. The text message prompts significantly increased declarations from 4 to 7 per cent, but did not increase actual payments.
The combined effect of all the trials was to substantially increase tax declaration and payment. We estimate that the email trials brought in $151,000 of extra tax revenue at no additional cost to the tax authority. Most of this comes from the sub-set of taxpayers in the first experiment, whose third-party information was available to the tax authority. These emails would have brought in an estimated $243,000 if sent to all taxpayers in the sample.
Increasing tax payments in Poland
The World Bank and BIT also partnered to test the impact of reminder letters on tax payment in Poland. The trial involved 31,929 taxpayers in two regions – Lubuskie and Wielkopolskie – who had declared their 2014 Personal Income Tax but failed to pay on time.
Taxpayers were randomly allocated to receive one of three interventions: no letter, the formal letter originally used by the Polish Tax Authority or a letter adapted using behavioural insights. The behavioural letter included persuasive messages, made the actions required clearer and used a ‘milder’ tone.
The formal letter and the behavioural letter were both found to increase the rate of payment from the control group average of 27.6 per cent (see Figure 9.3). However, the behavioural letter was significantly more effective, increasing the payment rate by 17 per cent, whereas the formal letter increased the payment rate by 8 per cent.
The second graph (Figure 9.4) shows the impact of the letters on the average amount paid. The behavioural letter increased the average amount paid by an equivalent of $40 to an average of $326. This is significantly higher than the average paid by those that received the formal letter ($269) but not significantly different from the control group average ($287). This is likely due to the high variance in the ‘amount paid’ variable. If instead we calculate the effect of the letters on the logarithm (log) of the amount paid conditional on payment (which reduces this noise), taxpayers that were sent the behavioural letter paid significantly more than those who were sent both the formal letter and no letter at all (the control group).
Overall, the evidence suggested that the behavioural letter increased both the rate of payment and the average amount paid, whilst the formal letter only increased the payment rate. Our cost benefit analysis showed that, if sent to all taxpayers in the sample, the behavioural letter would have brought in an additional $1.1 million of tax revenue.
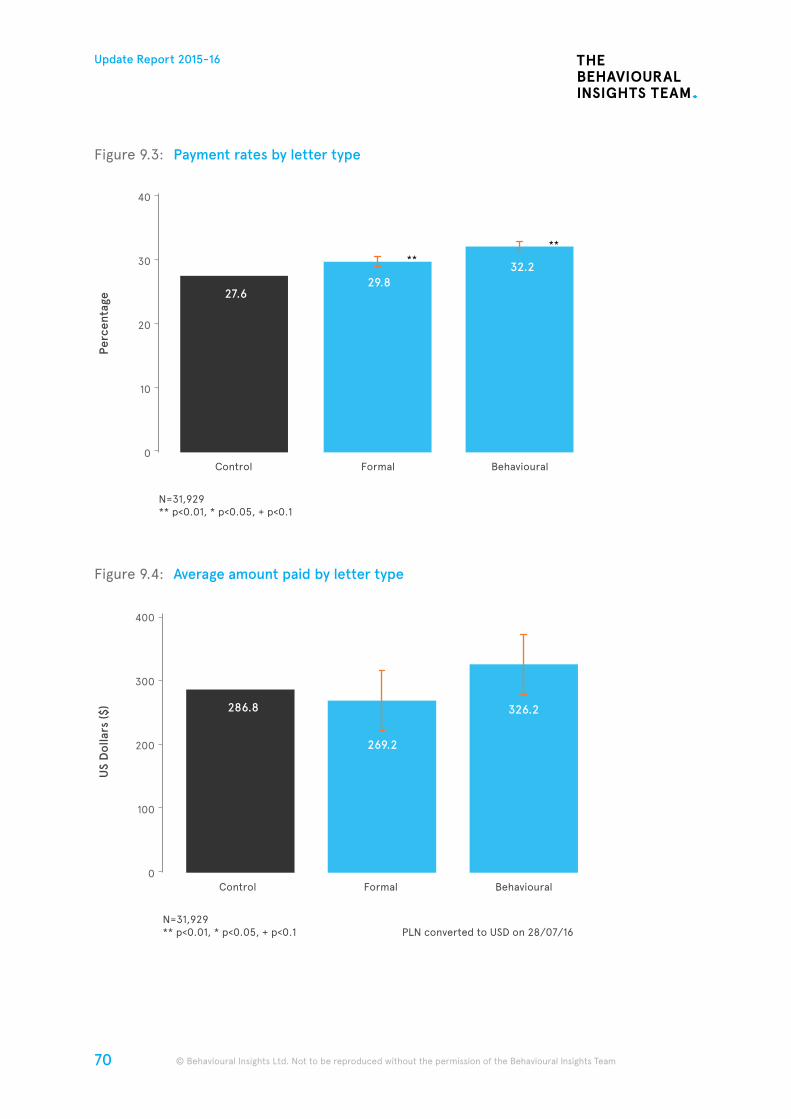
70
Update Report 2015-16
© Behavioural Insights Ltd. Not to be reproduced without the permission of the Behavioural Insights Team © Behavioural Insights Ltd. Not to be reproduced without the permission of the Behavioural Insights Team
Figure 9.3: Payment rates by letter type
Figure 9.4: Average amount paid by letter type
Control
N=31,929** p<0.01, * p<0.05, + p<0.1
Formal Behavioural
10
40
20
30
Perc
enta
ge
0
****
27.629.8
32.2
Control
N=31,929** p<0.01, * p<0.05, + p<0.1 PLN converted to USD on 28/07/16
Formal Behavioural
100
400
200
300
US
Dol
lars
($)
0
286.8
269.2
326.2
71
Update Report 2015-16
© Behavioural Insights Ltd. Not to be reproduced without the permission of the Behavioural Insights Team
Increasing tax payments in Guatemala
BIT and the World Bank also implemented a second trial in Guatemala. It aimed to prime honesty among Guatemalan taxpayers filing online declarations. This second trial, however, was found to have no impact on tax declaration
In the trial, 715,190 taxpayers over a four month period were exposed to one of six behavioural messages, or a control message. These six intervention messages were informed by various insights from behavioural literature and were included as part of a pop up CAPTCHA (Completely Automated Public Turing test to tell Computers and Humans Apart). This CAPTCHA was located on the tax declaration website, immediately prior to individuals reaching a declaration form.
The results of the trial showed that none of the treatments had a significant impact on tax declaration. Many factors may have contributed to the interventions not increasing declarations; we can only speculate on the main cause. However, as each of the six interventions was ineffective, we suggest that it may have been the way the information was conveyed that was crucial here, rather than the content of the messages. Specifically, including the messages in a CAPTCHA box rather than on the declaration form itself, may have meant that individuals ignored the prompts as they focused on progressing to the main form.
It is important to acknowledge null results and their importance. Doing so reduces the ‘file-drawer’ problem and helps researchers and evidence-based policy makers make more informed decisions.
Scaling Interventions and building government capacity with the Global Innovation Fund
We have now shown that behaviourally informed tax interventions can have a dramatic impact across a diverse range of countries, including Guatemala, Costa Rica and Poland. As a result of this experience, and our work partnering with foreign governments to build capacity (see more in Australia and Singapore sections of this update), BIT have launched a major new partnership with the Global Innovation Fund. This partnership will take the underlying principles of our previous projects to scale over several lower-middle income countries.
Our aim is to institutionalise our approach to testing and trialling interventions, with a focus on increasing tax compliance and reducing the impact of the informal economy. We will also work on other policy areas where behavioural interventions can improve the lives of those living on less than $5 per day. Finally, we will use this long-term partnership to collect more comprehensive and longer-term outcome measures to better understand the impact of behavioural solutions on transforming the lives of those who face disadvantage.
Maternal Health in Mexico
Over the past year, BIT has been fortunate to have had the chance to work on Prospera, Mexico’s world famous cash transfer programme. Prospera is a Conditional Cash Transfer programme (CCT) that provides conditional financial incentives for families. Prospera was initially rolled out as a randomised control trial in 1997 and several studies have found that it improved health and education outcomes. There is, however, limited evidence of the impact of CCTs on health seeking behaviour outside of the direct CCT conditions, for example, planning for emergencies or the use of nutritional supplements.
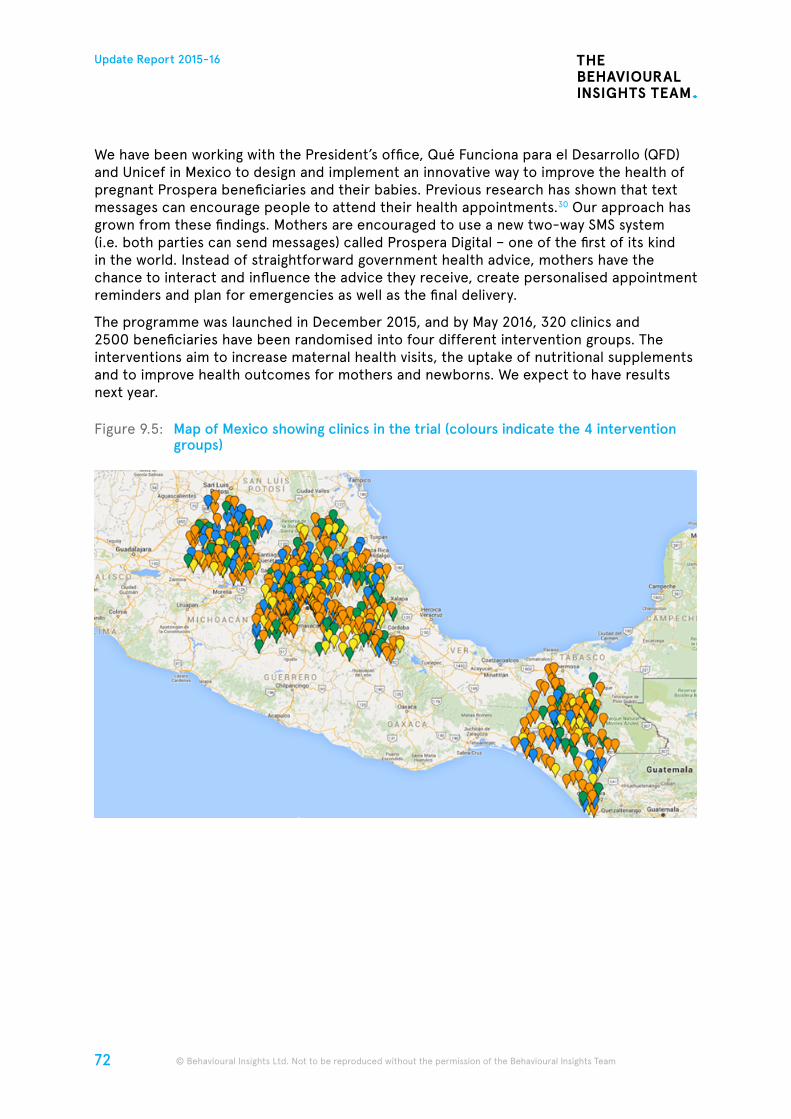
72
Update Report 2015-16
© Behavioural Insights Ltd. Not to be reproduced without the permission of the Behavioural Insights Team © Behavioural Insights Ltd. Not to be reproduced without the permission of the Behavioural Insights Team
We have been working with the President’s office, Qué Funciona para el Desarrollo (QFD) and Unicef in Mexico to design and implement an innovative way to improve the health of pregnant Prospera beneficiaries and their babies. Previous research has shown that text messages can encourage people to attend their health appointments.30 Our approach has grown from these findings. Mothers are encouraged to use a new two-way SMS system (i.e. both parties can send messages) called Prospera Digital – one of the first of its kind in the world. Instead of straightforward government health advice, mothers have the chance to interact and influence the advice they receive, create personalised appointment reminders and plan for emergencies as well as the final delivery.
The programme was launched in December 2015, and by May 2016, 320 clinics and 2500 beneficiaries have been randomised into four different intervention groups. The interventions aim to increase maternal health visits, the uptake of nutritional supplements and to improve health outcomes for mothers and newborns. We expect to have results next year.
Figure 9.5: Map of Mexico showing clinics in the trial (colours indicate the 4 intervention groups)
73
Update Report 2015-16
© Behavioural Insights Ltd. Not to be reproduced without the permission of the Behavioural Insights Team
Tuberculosis (TB) medication adherence in Moldova
One of the world’s big behavioural challenges is getting people to take all of their pills as prescribed. In last year’s Update Report, we announced the launch of a 16 month trial which aimed to increase the wellbeing of tuberculosis (TB) patients and their adherence to medication in Chisinau, the capital of Moldova.
The typical treatment course for TB involves six months of antibiotics. In Moldova, patients are required to take this daily medication in the presence of a clinician. This interpretation of the World Health Organisation’s recommended Daily Observed Treatment (DOT) presents a big friction (time) cost to patients and staff every day. For our trial we randomly allocated patients to receive Virtually Observed Treatment (VOT). Instead of having to travel to their clinic every day, VOT patients are asked to use an app to send a video of them taking their medication. These videos are evaluated by trained ‘VOT observers’, who then send the patient’s feedback. The trial is currently underway and we should have the results next year.
We believe that this trial will be of interest to many governments around the world tackling TB and more widely, the global health issue of encouraging people to take all of their pills.
The Anti-Corruption Summit
The first global Anti-Corruption Summit, held in London in May 2016, focused on the practical steps that could be taken to tackle corruption across the world. Popular and policy accounts of corruption can often misinterpret why people engage in corrupt behaviours. It is often assumed that corruption is the result of individuals weighing up the benefits and costs, including the probability of being caught and the potential penalties. The traditional response to corruption under this ‘rational’ model would be to increase the penalties or the probability of detection.
Behavioural studies have revealed that the causes of corruption and honesty are more complex.31 Corruption and honesty can be motivated by social pressure, a lack of trust in the contexts in which transactions take place or due to ‘moral licensing’. Research also shows that observed social norms can influence our likelihood of engaging in dishonest behaviour32 and that people are more likely to be dishonest if they can do so by omission (not providing or updating information) rather than by commission (actively providing false information).33
At the Anti-Corruption Summit, the Prime Minister announced that BIT will be partnering with UK Government departments to trial the effectiveness of behavioural approaches across a range of policy areas susceptible to corrupt practices. Starting this year, we will be working in Mexico, Argentina and Colombia to test this approach. Whilst we recognise that corruption is a complex and challenging issue, we are excited to discover areas where behavioural approaches can be effectively applied.
74
Update Report 2015-16
© Behavioural Insights Ltd. Not to be reproduced without the permission of the Behavioural Insights Team © Behavioural Insights Ltd. Not to be reproduced without the permission of the Behavioural Insights Team
When BIT began a long term programme of work with the New South Wales Department of Premier and Cabinet in December 2012, it was the only unit of its kind in Australia. Since then, the application of behavioural insights has gone from strength to strength in terms of reach and impact.
Over the past year, the Department of Premier and Cabinet in Victoria has set up a new Behavioural Insights Unit, and the Federal Government has established the ‘Behavioural Economics Team of the Australian Government’ (BETA). Even where there aren’t dedicated units present, public sector organisations across Australia are drawing on behavioural insights to inform policy design and delivery.
As a result of this exciting growth in the use of behavioural insights, BIT’s own team in Australia has grown significantly. We have doubled the size of our Sydney office over the past 12 months and we are now working with a number of state governments and federal agencies, local councils and not-for-profits across Australia and New Zealand. As well as running trials, some of the results of which are set out below, we have also provided policy advice and interventions in a range of domains, from social housing reforms to insurance disclosure.34
BIT Australia’s Partnership with New South Wales DPC
One of BIT’s longest and most impactful global partnerships is with the Government of New South Wales (NSW). In 2012, BIT helped the Department for Premier and Cabinet (DPC) to create their own dedicated Behavioural Insights Unit (BIU). The original team started with just two members, but this has since been expanded to 12, enabling the unit to implement increasingly complex interventions with partners across the NSW government. The impact of the NSW team’s work was recognised internationally when it was awarded the Global Practitioners Award at Behavioural Exchange 2015.
In some areas, the NSW BIU has been able to replicate, adapt and scale interventions from the UK, demonstrating that these techniques translate well across national borders. For example, the unit worked with St Vincent’s Hospital in Darlinghurst, Sydney, to trial whether different versions of text message reminders could affect the rate of people attending outpatient appointments. This built on trials that BIT had run with NHS Trusts in the UK, which showed that informing people about the costs to the NHS of missing an appointment (£160) reduced missed appointments substantially.35
Rory Gallagher, Managing Director, Asia Pacific
10. Australia
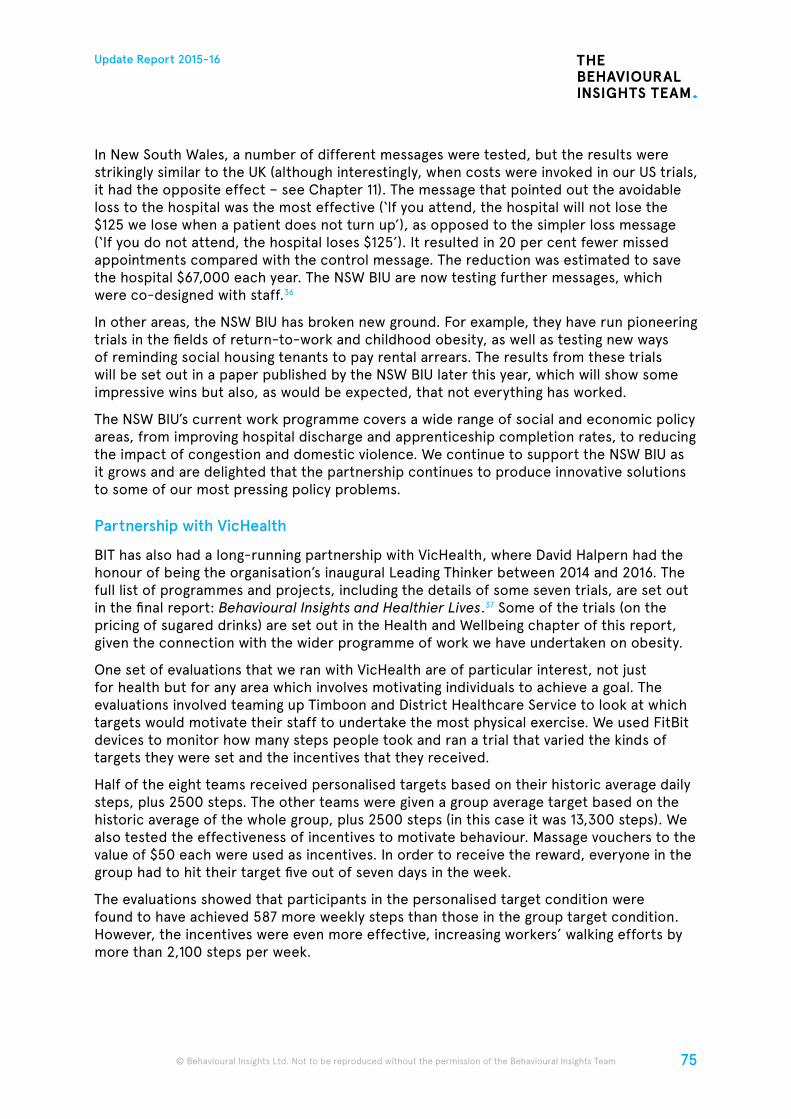
75
Update Report 2015-16
© Behavioural Insights Ltd. Not to be reproduced without the permission of the Behavioural Insights Team
In New South Wales, a number of different messages were tested, but the results were strikingly similar to the UK (although interestingly, when costs were invoked in our US trials, it had the opposite effect – see Chapter 11). The message that pointed out the avoidable loss to the hospital was the most effective (‘lf you attend, the hospital will not lose the $125 we lose when a patient does not turn up’), as opposed to the simpler loss message (‘If you do not attend, the hospital loses $125’). It resulted in 20 per cent fewer missed appointments compared with the control message. The reduction was estimated to save the hospital $67,000 each year. The NSW BIU are now testing further messages, which were co-designed with staff.36
In other areas, the NSW BIU has broken new ground. For example, they have run pioneering trials in the fields of return-to-work and childhood obesity, as well as testing new ways of reminding social housing tenants to pay rental arrears. The results from these trials will be set out in a paper published by the NSW BIU later this year, which will show some impressive wins but also, as would be expected, that not everything has worked.
The NSW BIU’s current work programme covers a wide range of social and economic policy areas, from improving hospital discharge and apprenticeship completion rates, to reducing the impact of congestion and domestic violence. We continue to support the NSW BIU as it grows and are delighted that the partnership continues to produce innovative solutions to some of our most pressing policy problems.
Partnership with VicHealth
BIT has also had a long-running partnership with VicHealth, where David Halpern had the honour of being the organisation’s inaugural Leading Thinker between 2014 and 2016. The full list of programmes and projects, including the details of some seven trials, are set out in the final report: Behavioural Insights and Healthier Lives.37 Some of the trials (on the pricing of sugared drinks) are set out in the Health and Wellbeing chapter of this report, given the connection with the wider programme of work we have undertaken on obesity.
One set of evaluations that we ran with VicHealth are of particular interest, not just for health but for any area which involves motivating individuals to achieve a goal. The evaluations involved teaming up Timboon and District Healthcare Service to look at which targets would motivate their staff to undertake the most physical exercise. We used FitBit devices to monitor how many steps people took and ran a trial that varied the kinds of targets they were set and the incentives that they received.
Half of the eight teams received personalised targets based on their historic average daily steps, plus 2500 steps. The other teams were given a group average target based on the historic average of the whole group, plus 2500 steps (in this case it was 13,300 steps). We also tested the effectiveness of incentives to motivate behaviour. Massage vouchers to the value of $50 each were used as incentives. In order to receive the reward, everyone in the group had to hit their target five out of seven days in the week.
The evaluations showed that participants in the personalised target condition were found to have achieved 587 more weekly steps than those in the group target condition. However, the incentives were even more effective, increasing workers’ walking efforts by more than 2,100 steps per week.
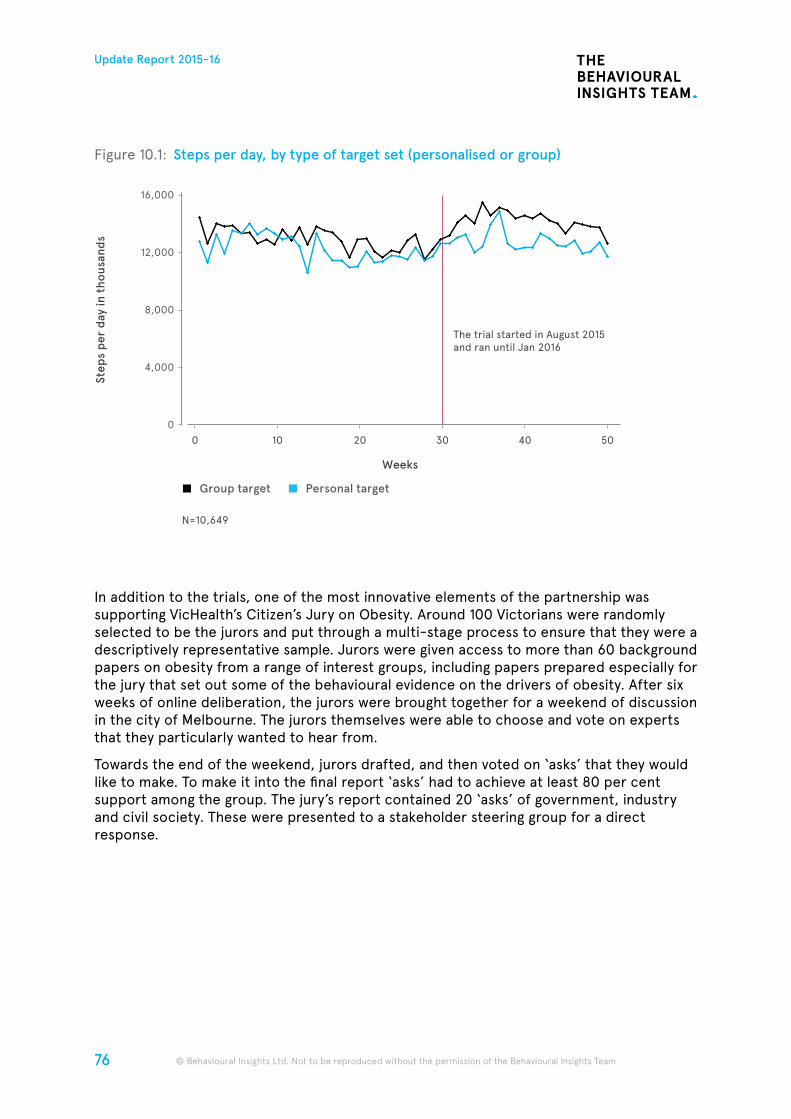
76
Update Report 2015-16
© Behavioural Insights Ltd. Not to be reproduced without the permission of the Behavioural Insights Team © Behavioural Insights Ltd. Not to be reproduced without the permission of the Behavioural Insights Team
Figure 10.1: Steps per day, by type of target set (personalised or group)
In addition to the trials, one of the most innovative elements of the partnership was supporting VicHealth’s Citizen’s Jury on Obesity. Around 100 Victorians were randomly selected to be the jurors and put through a multi-stage process to ensure that they were a descriptively representative sample. Jurors were given access to more than 60 background papers on obesity from a range of interest groups, including papers prepared especially for the jury that set out some of the behavioural evidence on the drivers of obesity. After six weeks of online deliberation, the jurors were brought together for a weekend of discussion in the city of Melbourne. The jurors themselves were able to choose and vote on experts that they particularly wanted to hear from.
Towards the end of the weekend, jurors drafted, and then voted on ‘asks’ that they would like to make. To make it into the final report ‘asks’ had to achieve at least 80 per cent support among the group. The jury’s report contained 20 ‘asks’ of government, industry and civil society. These were presented to a stakeholder steering group for a direct response.
16,000
8,000
4,000
12,000
Step
s pe
r da
y in
tho
usan
ds
00 10 20
Weeks
30
The trial started in August 2015and ran until Jan 2016
40 50
Group target Personal target
N=10,649
77
Update Report 2015-16
© Behavioural Insights Ltd. Not to be reproduced without the permission of the Behavioural Insights Team
VicHealth’s Citizens’ Jury on Obesity proved effective, decisive and moving. The Victorians that were selected for the process came from all walks of life and from across the state. During the weekend of face-to-face deliberations, the jurors threw themselves into the topic with seriousness and diligence. The 20 plus ‘asks’ that made it through, far from being the confused or weak list that some had feared, were coherent and strong.38 It is too early to conclude whether these recommendations will be fully implemented, but the process showed policymakers, retailers and producers that they may be substantially misreading, and perhaps underestimating, public support for interventions like a sugar tax. It also laid to rest the arguments that issues like obesity are too complex for the public to understand and that a jury of citizens would act in a narrow and self-interested way. Perhaps, even more importantly, it has shown governments across the world how such an approach can be used to consult the public using behavioural evidence, whilst pushing the frontiers of combining both online and in-person debate.
Encouraging people to get more active
The work with VicHealth helped to inspire a larger programme of trials aimed at unpacking various aspects of group motivation to exercise more. In this context, we were fortunate to be contacted by the Movember Foundation, which since 2003 has raised £402 million and funded around 1,000 projects focused on tackling prostate cancer, testicular cancer, poor mental health and physical activity.
Movember put BIT in touch with Lendlease, who offer employees subsidised FitBits to help them track their performance. They are then encouraged to take further exercise. Our challenge, for Movember 2015, was to devise new ways of increasing levels of physical activity and to use the FitBit devices to measure individuals’ daily step count.
Fifty teams (totalling 646 individuals) had been competing in a step challenge. We randomly assigned the teams into two groups, who each received different kinds of feedback. The first group received generic leaderboard information that told them which teams were in the lead. The second group received personalised team performance information that told them what their current rank was as a team, how far they were from the lead team and who the most active individuals in the team were.
The participants’ progress was then monitored over three weeks, with one message sent at the beginning of each week. We were interested in the number of steps reached, the amount of energy expended and the number of active minutes.
The personalised team feedback intervention significantly outperformed the generic leaderboard information against each of the outcome measures. It was particularly effective at increasing the activity of women and the effect was strongest for those who were least active.
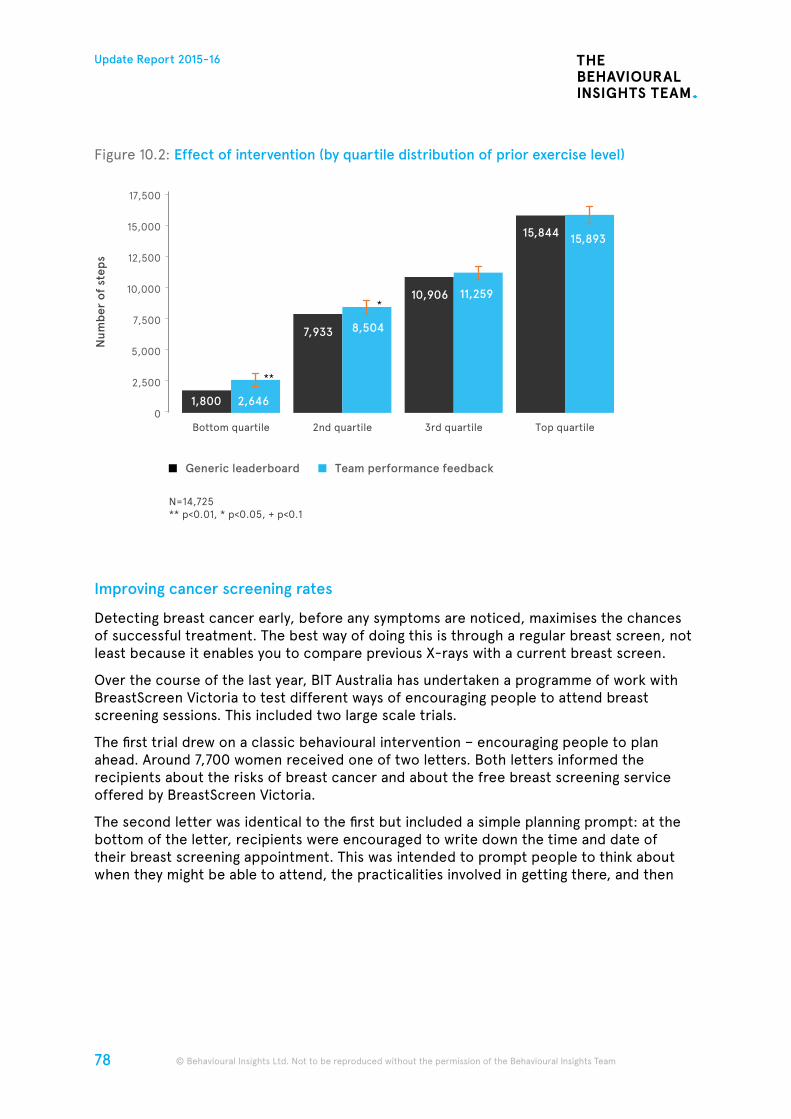
78
Update Report 2015-16
© Behavioural Insights Ltd. Not to be reproduced without the permission of the Behavioural Insights Team © Behavioural Insights Ltd. Not to be reproduced without the permission of the Behavioural Insights Team
Figure 10.2: Effect of intervention (by quartile distribution of prior exercise level)
Improving cancer screening rates
Detecting breast cancer early, before any symptoms are noticed, maximises the chances of successful treatment. The best way of doing this is through a regular breast screen, not least because it enables you to compare previous X-rays with a current breast screen.
Over the course of the last year, BIT Australia has undertaken a programme of work with BreastScreen Victoria to test different ways of encouraging people to attend breast screening sessions. This included two large scale trials.
The first trial drew on a classic behavioural intervention – encouraging people to plan ahead. Around 7,700 women received one of two letters. Both letters informed the recipients about the risks of breast cancer and about the free breast screening service offered by BreastScreen Victoria.
The second letter was identical to the first but included a simple planning prompt: at the bottom of the letter, recipients were encouraged to write down the time and date of their breast screening appointment. This was intended to prompt people to think about when they might be able to attend, the practicalities involved in getting there, and then
17,500
12,500
7,500
10,000
2,500
5,000
15,000
Num
ber
of s
teps
0
N=14,725** p<0.01, * p<0.05, + p<0.1
Generic leaderboard Team performance feedback
3rd quartile
10,906 11,259
Top quartile
15,844 15,893
Bottom quartile
2,6461,800
**
2nd quartile
7,933 8,504
*
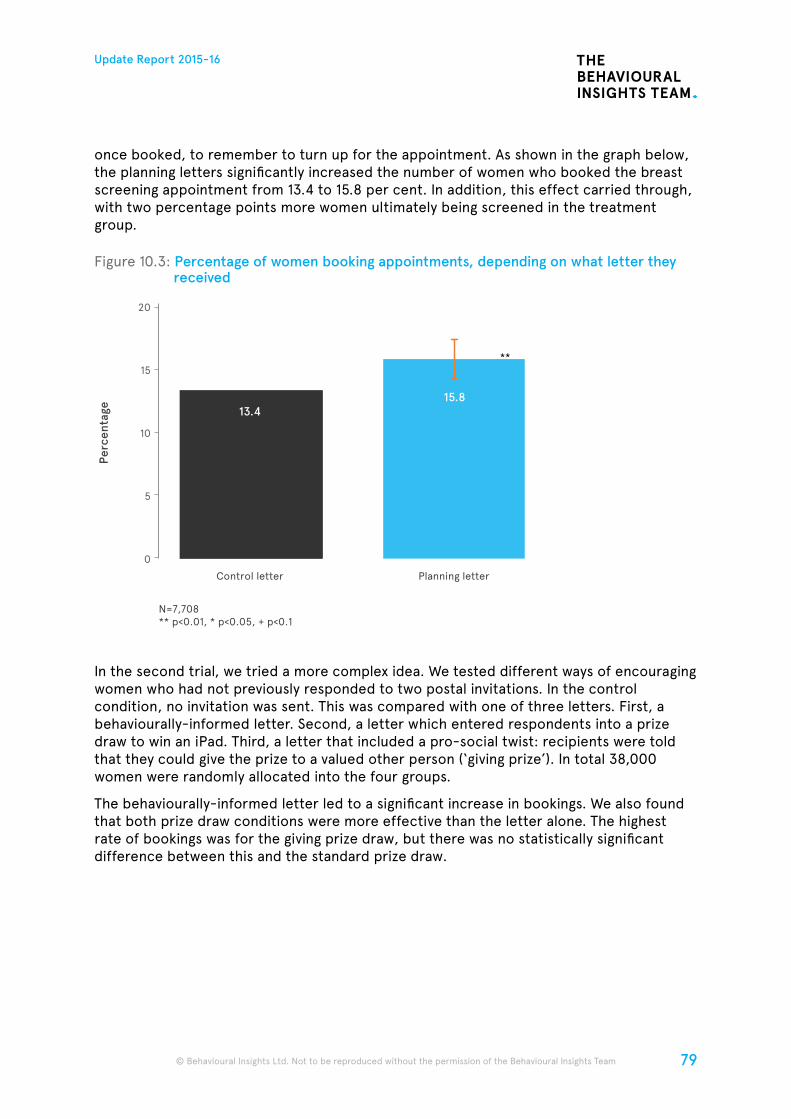
79
Update Report 2015-16
© Behavioural Insights Ltd. Not to be reproduced without the permission of the Behavioural Insights Team
once booked, to remember to turn up for the appointment. As shown in the graph below, the planning letters significantly increased the number of women who booked the breast screening appointment from 13.4 to 15.8 per cent. In addition, this effect carried through, with two percentage points more women ultimately being screened in the treatment group.
Figure 10.3: Percentage of women booking appointments, depending on what letter they received
In the second trial, we tried a more complex idea. We tested different ways of encouraging women who had not previously responded to two postal invitations. In the control condition, no invitation was sent. This was compared with one of three letters. First, a behaviourally-informed letter. Second, a letter which entered respondents into a prize draw to win an iPad. Third, a letter that included a pro-social twist: recipients were told that they could give the prize to a valued other person (‘giving prize’). In total 38,000 women were randomly allocated into the four groups.
The behaviourally-informed letter led to a significant increase in bookings. We also found that both prize draw conditions were more effective than the letter alone. The highest rate of bookings was for the giving prize draw, but there was no statistically significant difference between this and the standard prize draw.
Control letter
N=7,708** p<0.01, * p<0.05, + p<0.1
Planning letter
20
10
5
15
Perc
enta
ge
0
**
13.415.8
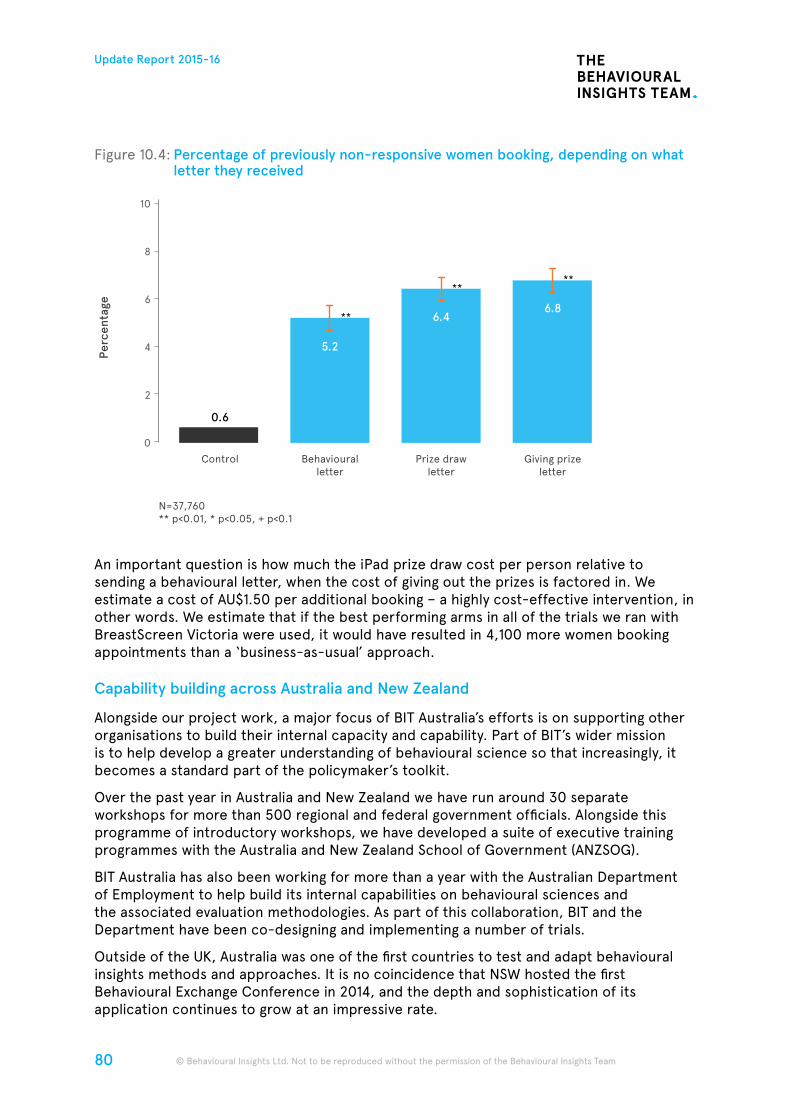
80
Update Report 2015-16
© Behavioural Insights Ltd. Not to be reproduced without the permission of the Behavioural Insights Team © Behavioural Insights Ltd. Not to be reproduced without the permission of the Behavioural Insights Team
Figure 10.4: Percentage of previously non-responsive women booking, depending on what letter they received
An important question is how much the iPad prize draw cost per person relative to sending a behavioural letter, when the cost of giving out the prizes is factored in. We estimate a cost of AU$1.50 per additional booking – a highly cost-effective intervention, in other words. We estimate that if the best performing arms in all of the trials we ran with BreastScreen Victoria were used, it would have resulted in 4,100 more women booking appointments than a ‘business-as-usual’ approach.
Capability building across Australia and New Zealand
Alongside our project work, a major focus of BIT Australia’s efforts is on supporting other organisations to build their internal capacity and capability. Part of BIT’s wider mission is to help develop a greater understanding of behavioural science so that increasingly, it becomes a standard part of the policymaker’s toolkit.
Over the past year in Australia and New Zealand we have run around 30 separate workshops for more than 500 regional and federal government officials. Alongside this programme of introductory workshops, we have developed a suite of executive training programmes with the Australia and New Zealand School of Government (ANZSOG).
BIT Australia has also been working for more than a year with the Australian Department of Employment to help build its internal capabilities on behavioural sciences and the associated evaluation methodologies. As part of this collaboration, BIT and the Department have been co-designing and implementing a number of trials.
Outside of the UK, Australia was one of the first countries to test and adapt behavioural insights methods and approaches. It is no coincidence that NSW hosted the first Behavioural Exchange Conference in 2014, and the depth and sophistication of its application continues to grow at an impressive rate.
Control
N=37,760** p<0.01, * p<0.05, + p<0.1
Behaviouralletter
Prize drawletter
Giving prizeletter
6
4
2
10
8
Perc
enta
ge
0
**
****
0.6
5.2
6.46.8
81
Update Report 2015-16
© Behavioural Insights Ltd. Not to be reproduced without the permission of the Behavioural Insights Team
11. North America
This year BIT set up an office in New York to serve our North American partners more effectively. Led by Elspeth Kirkman and Elizabeth Linos, the first six months of BIT North America’s work focused on projects with mid-sized cities across the country, as part of the Bloomberg Philanthropies’ What Works Cities initiative.
Under the Bloomberg Philanthropies programme, BIT has already run more than 20 randomised controlled trials (RCTs) with six different US cities – Denver, Chattanooga, Lexington, Louisville, New Orleans, and San Jose.
We will be publishing a detailed report of these evaluations later in the year, so in this Update, we have given an overview of some of the latest findings from three policy areas – encouraging people to move to online services, increasing payments, and public health.
Boosting use of online services in Denver
A common theme of BIT’s work with the City of Denver has been finding ways to encourage residents to use online services instead of more costly and time consuming alternatives. We have been testing changes in three areas: getting drivers to use online services when renewing their licence plates with the Department of Motor Vehicles (DMV), encouraging businesses to register for online tax filing and increasing traffic to Denver’s online public service platform, PocketGov.
To encourage drivers to use DMV’s online services, we ran a three arm trial in which residents approaching the deadline to renew their license plates were sent either one of two postcards or no postcard at all. This postcard was sent in addition to the existing reminder letter, which already emphasised the convenience of using the online channel.
Each postcard drew on behavioural insights to turn plans or intentions into actions. One used a checklist format for key actions, while the other asked the recipient to write a completion date next to each action. The results were striking: the postcards resulted in a 7-8 per cent boost in online renewals, which would translate into around 9,000 additional online renewals (relative to residents who did not receive the postcard annually).
Elspeth Kirkman, Director, BIT North America
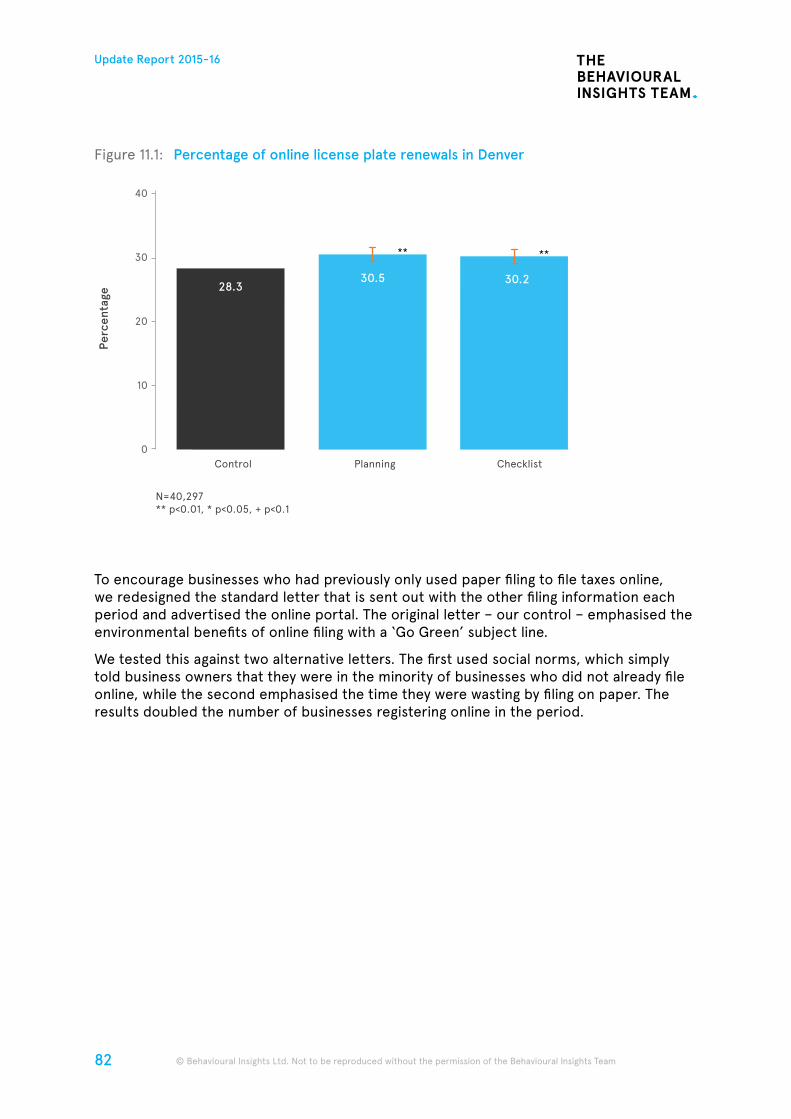
82
Update Report 2015-16
© Behavioural Insights Ltd. Not to be reproduced without the permission of the Behavioural Insights Team © Behavioural Insights Ltd. Not to be reproduced without the permission of the Behavioural Insights Team
Figure 11.1: Percentage of online license plate renewals in Denver
To encourage businesses who had previously only used paper filing to file taxes online, we redesigned the standard letter that is sent out with the other filing information each period and advertised the online portal. The original letter – our control – emphasised the environmental benefits of online filing with a ‘Go Green’ subject line.
We tested this against two alternative letters. The first used social norms, which simply told business owners that they were in the minority of businesses who did not already file online, while the second emphasised the time they were wasting by filing on paper. The results doubled the number of businesses registering online in the period.
Control
N=40,297** p<0.01, * p<0.05, + p<0.1
Planning Checklist
10
40
20
30
Perc
enta
ge
0
** **
28.330.5 30.2
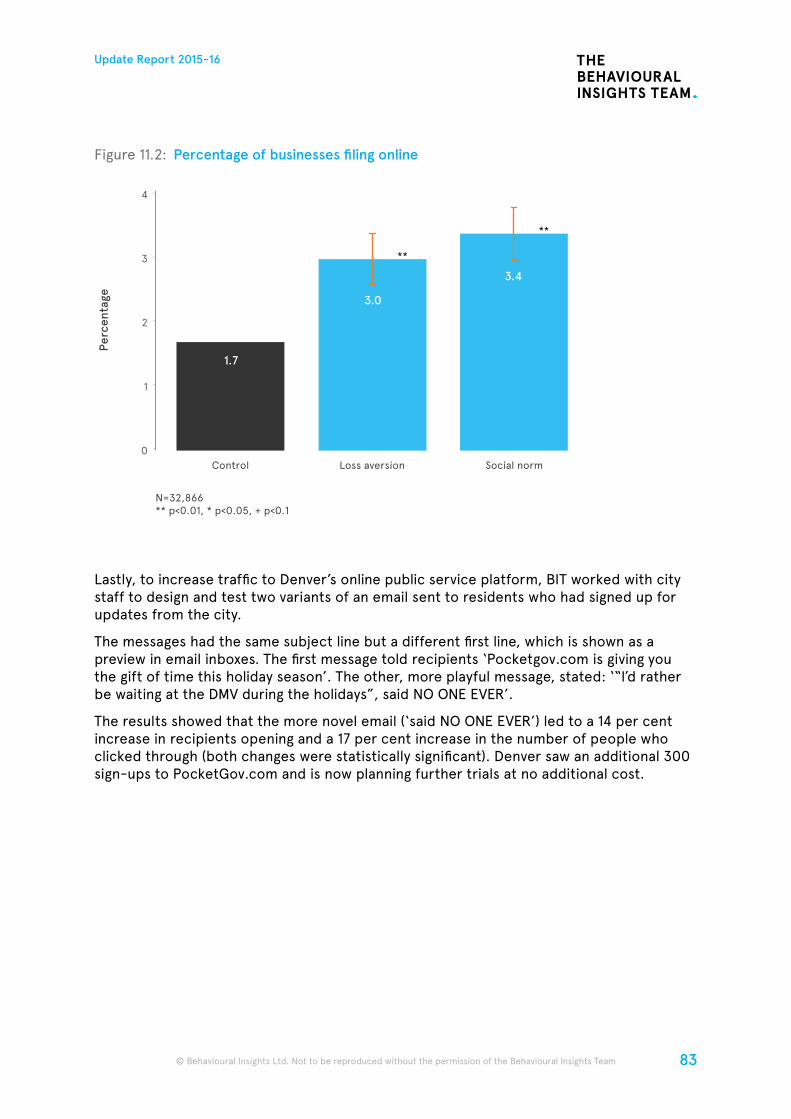
83
Update Report 2015-16
© Behavioural Insights Ltd. Not to be reproduced without the permission of the Behavioural Insights Team
Figure 11.2: Percentage of businesses filing online
Lastly, to increase traffic to Denver’s online public service platform, BIT worked with city staff to design and test two variants of an email sent to residents who had signed up for updates from the city.
The messages had the same subject line but a different first line, which is shown as a preview in email inboxes. The first message told recipients ‘Pocketgov.com is giving you the gift of time this holiday season’. The other, more playful message, stated: ‘“I’d rather be waiting at the DMV during the holidays”, said NO ONE EVER’.
The results showed that the more novel email (‘said NO ONE EVER’) led to a 14 per cent increase in recipients opening and a 17 per cent increase in the number of people who clicked through (both changes were statistically significant). Denver saw an additional 300 sign-ups to PocketGov.com and is now planning further trials at no additional cost.
Control
N=32,866** p<0.01, * p<0.05, + p<0.1
Loss aversion Social norm
1
4
2
3
Perc
enta
ge
0
**
**
1.7
3.0
3.4
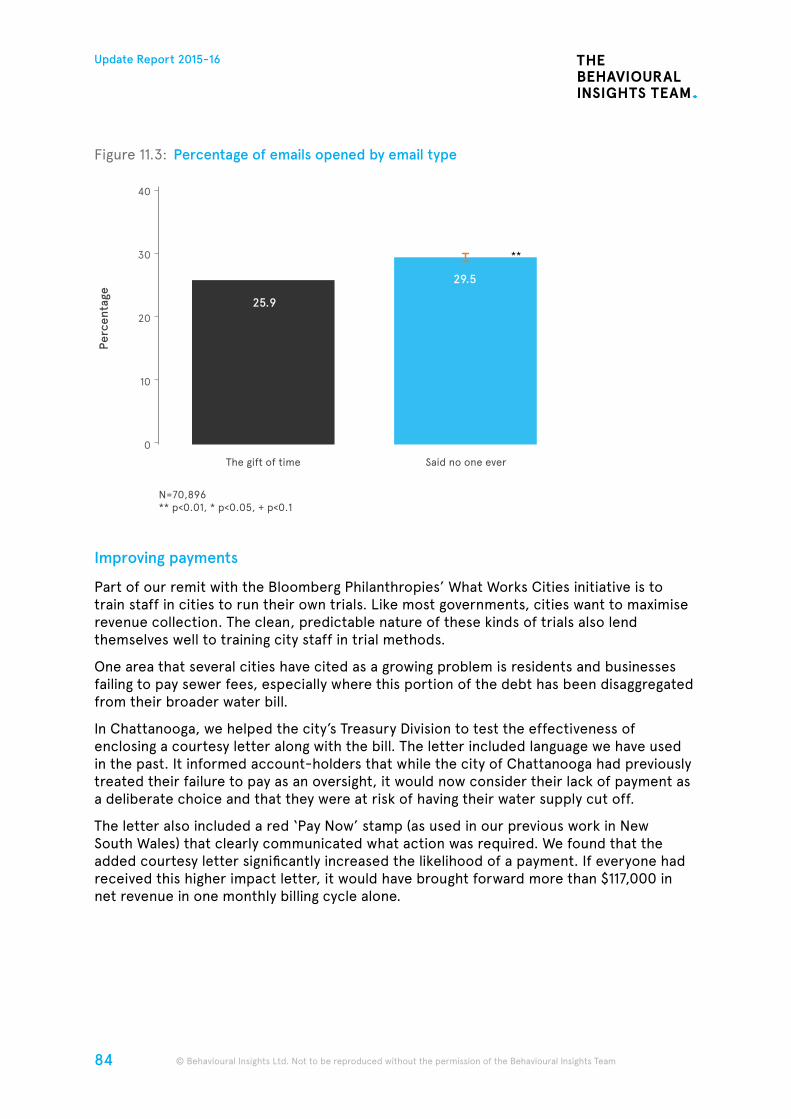
84
Update Report 2015-16
© Behavioural Insights Ltd. Not to be reproduced without the permission of the Behavioural Insights Team © Behavioural Insights Ltd. Not to be reproduced without the permission of the Behavioural Insights Team
Figure 11.3: Percentage of emails opened by email type
Improving payments
Part of our remit with the Bloomberg Philanthropies’ What Works Cities initiative is to train staff in cities to run their own trials. Like most governments, cities want to maximise revenue collection. The clean, predictable nature of these kinds of trials also lend themselves well to training city staff in trial methods.
One area that several cities have cited as a growing problem is residents and businesses failing to pay sewer fees, especially where this portion of the debt has been disaggregated from their broader water bill.
In Chattanooga, we helped the city’s Treasury Division to test the effectiveness of enclosing a courtesy letter along with the bill. The letter included language we have used in the past. It informed account-holders that while the city of Chattanooga had previously treated their failure to pay as an oversight, it would now consider their lack of payment as a deliberate choice and that they were at risk of having their water supply cut off.
The letter also included a red ‘Pay Now’ stamp (as used in our previous work in New South Wales) that clearly communicated what action was required. We found that the added courtesy letter significantly increased the likelihood of a payment. If everyone had received this higher impact letter, it would have brought forward more than $117,000 in net revenue in one monthly billing cycle alone.
The gift of time
N=70,896** p<0.01, * p<0.05, + p<0.1
Said no one ever
40
20
10
30
Perc
enta
ge
0
25.9
**
29.5
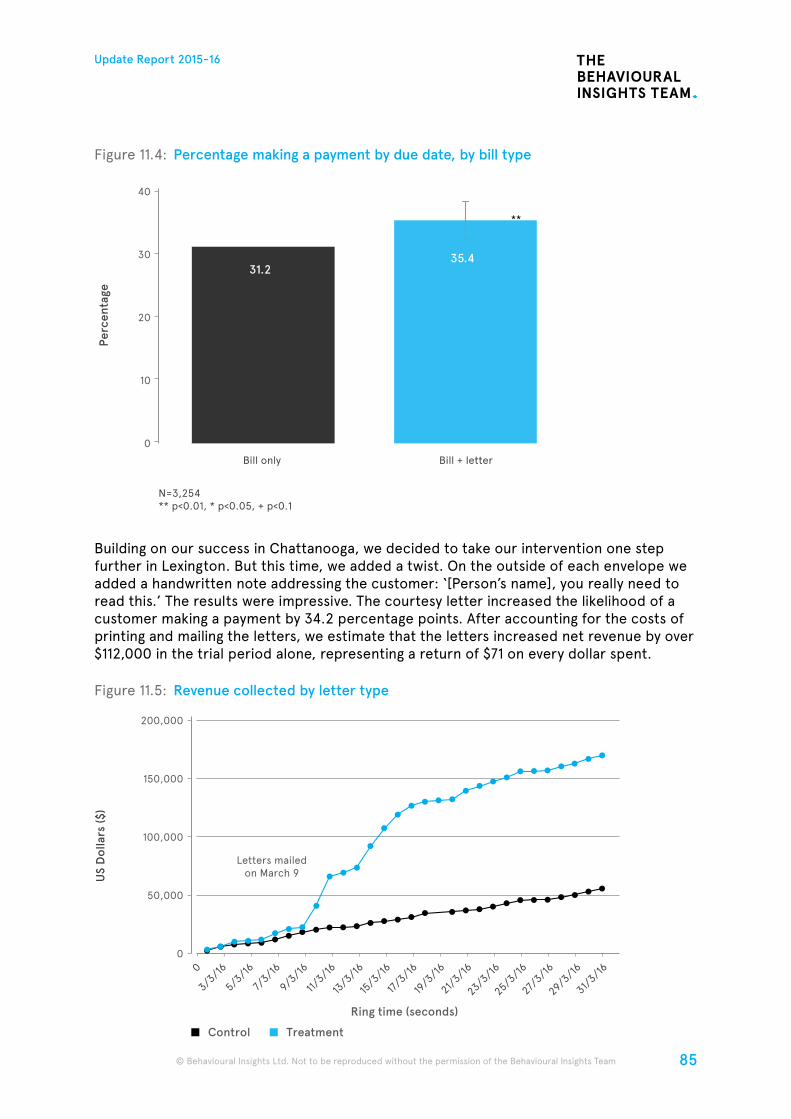
85
Update Report 2015-16
© Behavioural Insights Ltd. Not to be reproduced without the permission of the Behavioural Insights Team
Figure 11.4: Percentage making a payment by due date, by bill type
Building on our success in Chattanooga, we decided to take our intervention one step further in Lexington. But this time, we added a twist. On the outside of each envelope we added a handwritten note addressing the customer: ‘[Person’s name], you really need to read this.’ The results were impressive. The courtesy letter increased the likelihood of a customer making a payment by 34.2 percentage points. After accounting for the costs of printing and mailing the letters, we estimate that the letters increased net revenue by over $112,000 in the trial period alone, representing a return of $71 on every dollar spent.
Figure 11.5: Revenue collected by letter type
Bill only
N=3,254** p<0.01, * p<0.05, + p<0.1
Bill + letter
40
20
10
30
Perc
enta
ge
0
**
35.431.2
0
50,000
Letters mailedon March 9
200,000
100,000
150,000
US
Dol
lars
($)
Ring time (seconds)
Control Treatment
3/3/1
60
5/3/1
6
7/3/1
6
9/3/1
6
11/3/1
6
13/3
/16
15/3
/16
17/3
/16
19/3
/16
21/3/1
6
23/3/1
6
25/3/1
6
27/3/1
6
29/3/1
6
31/3/1
6
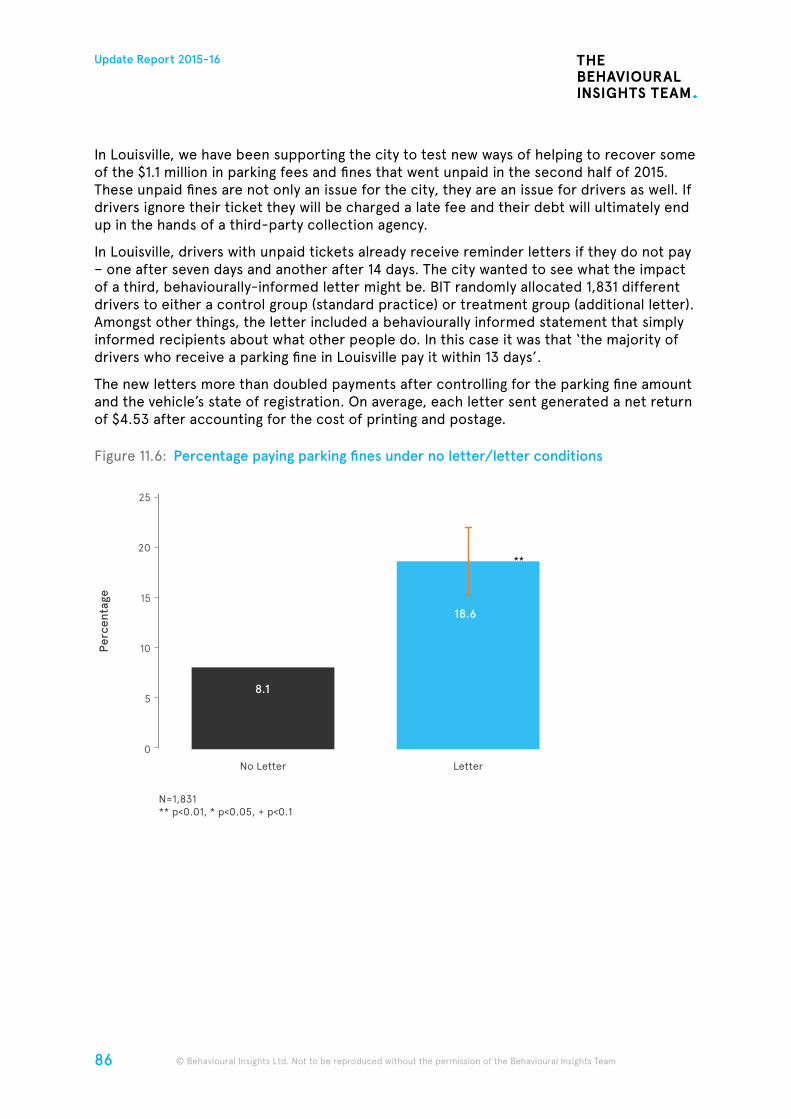
86
Update Report 2015-16
© Behavioural Insights Ltd. Not to be reproduced without the permission of the Behavioural Insights Team © Behavioural Insights Ltd. Not to be reproduced without the permission of the Behavioural Insights Team
In Louisville, we have been supporting the city to test new ways of helping to recover some of the $1.1 million in parking fees and fines that went unpaid in the second half of 2015. These unpaid fines are not only an issue for the city, they are an issue for drivers as well. If drivers ignore their ticket they will be charged a late fee and their debt will ultimately end up in the hands of a third-party collection agency.
In Louisville, drivers with unpaid tickets already receive reminder letters if they do not pay – one after seven days and another after 14 days. The city wanted to see what the impact of a third, behaviourally-informed letter might be. BIT randomly allocated 1,831 different drivers to either a control group (standard practice) or treatment group (additional letter). Amongst other things, the letter included a behaviourally informed statement that simply informed recipients about what other people do. In this case it was that ‘the majority of drivers who receive a parking fine in Louisville pay it within 13 days’.
The new letters more than doubled payments after controlling for the parking fine amount and the vehicle’s state of registration. On average, each letter sent generated a net return of $4.53 after accounting for the cost of printing and postage.
Figure 11.6: Percentage paying parking fines under no letter/letter conditions
N=1,831** p<0.01, * p<0.05, + p<0.1
25
15
10
5
20
Perc
enta
ge
0
No Letter
8.1
Letter
18.6
**
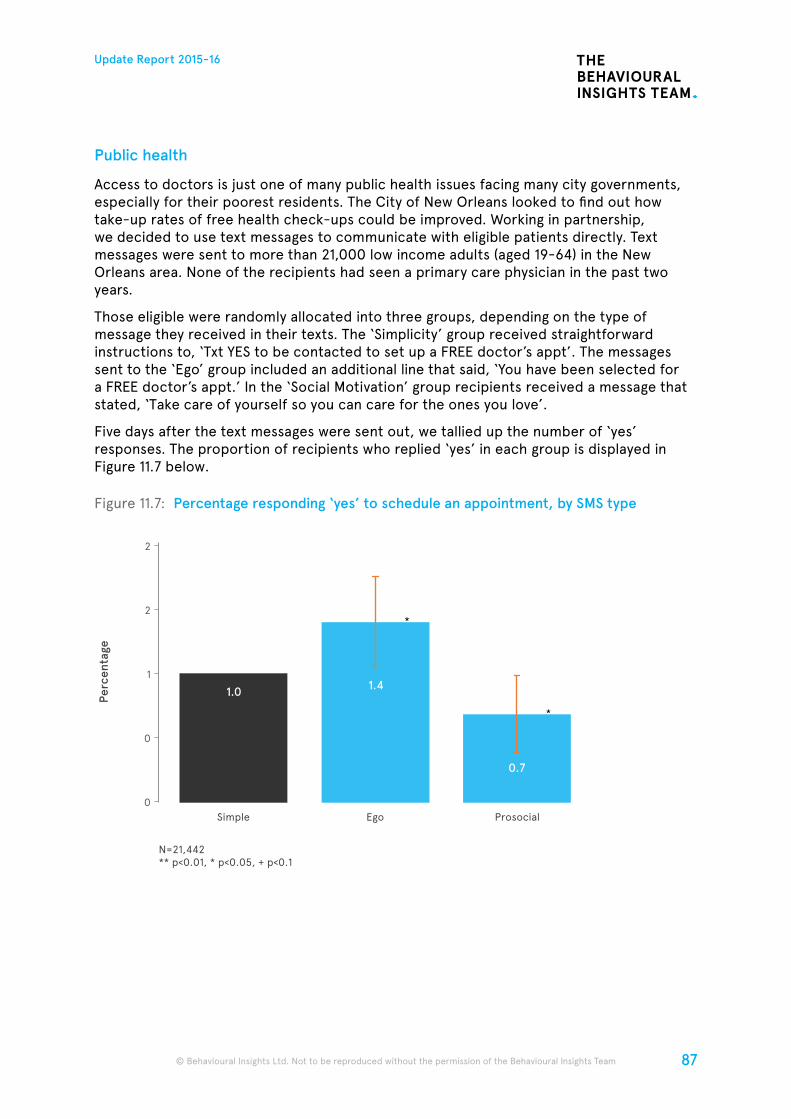
87
Update Report 2015-16
© Behavioural Insights Ltd. Not to be reproduced without the permission of the Behavioural Insights Team
Public health
Access to doctors is just one of many public health issues facing many city governments, especially for their poorest residents. The City of New Orleans looked to find out how take-up rates of free health check-ups could be improved. Working in partnership, we decided to use text messages to communicate with eligible patients directly. Text messages were sent to more than 21,000 low income adults (aged 19-64) in the New Orleans area. None of the recipients had seen a primary care physician in the past two years.
Those eligible were randomly allocated into three groups, depending on the type of message they received in their texts. The ‘Simplicity’ group received straightforward instructions to, ‘Txt YES to be contacted to set up a FREE doctor’s appt’. The messages sent to the ‘Ego’ group included an additional line that said, ‘You have been selected for a FREE doctor’s appt.’ In the ‘Social Motivation’ group recipients received a message that stated, ‘Take care of yourself so you can care for the ones you love’.
Five days after the text messages were sent out, we tallied up the number of ‘yes’ responses. The proportion of recipients who replied ‘yes’ in each group is displayed in Figure 11.7 below.
Figure 11.7: Percentage responding ‘yes’ to schedule an appointment, by SMS type
Simple
N=21,442** p<0.01, * p<0.05, + p<0.1
Ego Prosocial
0
2
1
2
Perc
enta
ge
0
1.0 1.4
*
0.7
*
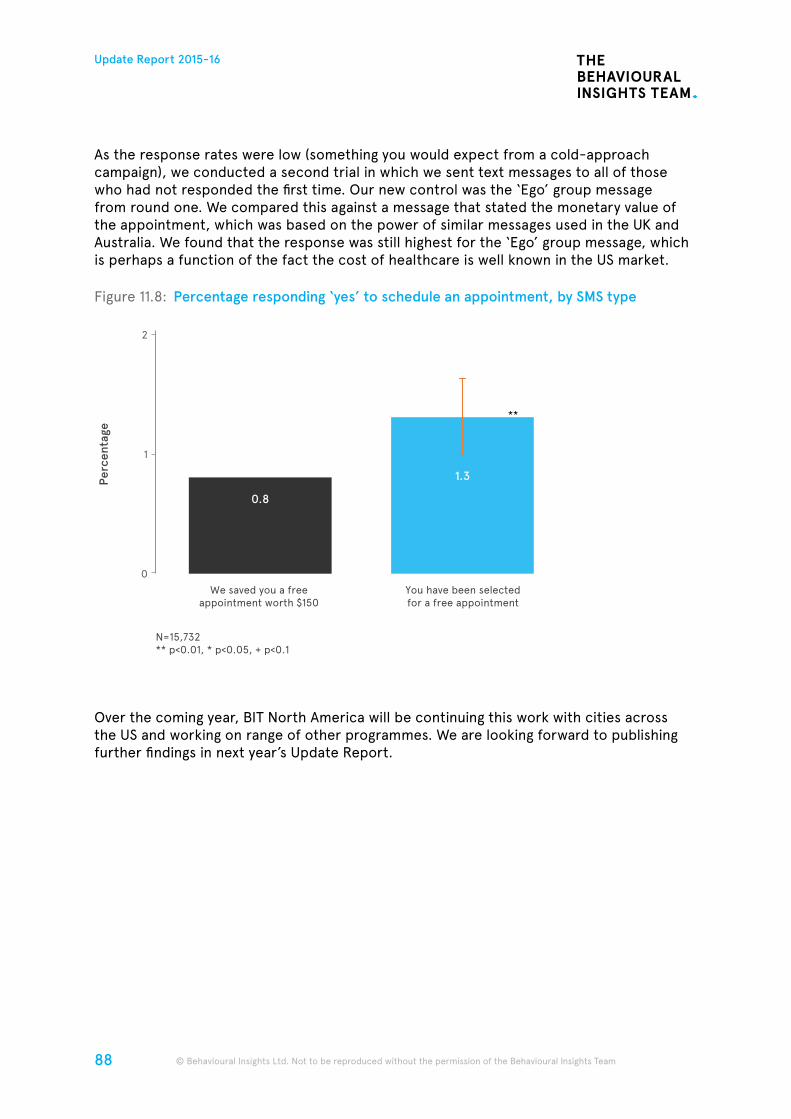
88
Update Report 2015-16
© Behavioural Insights Ltd. Not to be reproduced without the permission of the Behavioural Insights Team © Behavioural Insights Ltd. Not to be reproduced without the permission of the Behavioural Insights Team
As the response rates were low (something you would expect from a cold-approach campaign), we conducted a second trial in which we sent text messages to all of those who had not responded the first time. Our new control was the ‘Ego’ group message from round one. We compared this against a message that stated the monetary value of the appointment, which was based on the power of similar messages used in the UK and Australia. We found that the response was still highest for the ‘Ego’ group message, which is perhaps a function of the fact the cost of healthcare is well known in the US market.
Figure 11.8: Percentage responding ‘yes’ to schedule an appointment, by SMS type
Over the coming year, BIT North America will be continuing this work with cities across the US and working on range of other programmes. We are looking forward to publishing further findings in next year’s Update Report.
We saved you a freeappointment worth $150
N=15,732** p<0.01, * p<0.05, + p<0.1
You have been selectedfor a free appointment
2
1
Perc
enta
ge
0
0.8
1.3
**
89
Update Report 2015-16
© Behavioural Insights Ltd. Not to be reproduced without the permission of the Behavioural Insights Team
BIT has been working with the Singaporean Civil Service, and specifically with the Ministry of Manpower (MOM), since 2012. We have helped and continue to support MOM to build its in-house capability in applying behavioural insights to employment-related issues. In particular, MOM has become a global leader in blending behavioural science with human-centred design approaches.
The Singaporean government has established a number of behavioural insights units within departments and agencies. BIT has supported the growth of these units through a long-term programme of work with the Public Services Division (PSD) of
the Prime Minister’s Office, which will cover a wide range of policy areas. In this report, we are setting out the results from the first of these trials, which focus on improving administrative efficiency.
We have also run various education programmes to help spread the use of behavioural insights and randomised controlled trials (RCTs) through partnerships with the Singaporean Civil Service College and the Lee Kuan Yew School of Public Policy. Additionally, we have supported the use of behavioural insights in several innovative new areas, for example, to inform policy around the use of driverless vehicles.
This year, given these exciting developments, BIT decided to establish a small office in Singapore, which will enable us to provide more dedicated on-the-ground support. Remaining true to BIT’s core objectives, BIT Singapore will aim to work with the government of Singapore to help make public services more cost effective and easier for citizens to use, improve outcomes by introducing a more realistic model of human behaviour and enable people to make better choices for themselves.
Helping Small and Medium-sized Enterprises (SMEs) to comply with employment laws
MOM makes compliance visits to workplaces to help employees understand their employment rights and to ensure that employers fulfil their obligations under the Employment Act. Quantitative analysis and qualitative research by MOM found that SMEs find it hard to comply with employment laws. This is because they find the laws too complex and they do not have the time or dedicated human resources, so they need ready-made solutions. SMEs’ behaviour tends to be sticky – once a system that complies with employment law has been put in place, they are less likely to revert to their old ways.
With this understanding, MOM designed and tested three key interventions – i) salience, ii) timeliness and iii) make it easy to help SMEs comply with employment laws.
In the first intervention group, MOM rewrote the letter that is sent to employers to inform them of an upcoming compliance visit and information about the documents they would need to prepare. The revised letter highlighted the four priority areas of the inspection
Samual Hanes, Director, Singapore
12. Singapore

90
Update Report 2015-16
© Behavioural Insights Ltd. Not to be reproduced without the permission of the Behavioural Insights Team © Behavioural Insights Ltd. Not to be reproduced without the permission of the Behavioural Insights Team
and outlined the specific steps that the employer would need to take. Making the next steps and required actions salient has been effective in a wide range of behavioural trials across the world. In addition, this letter made the potential penalties for non-compliance much clearer.
For the second intervention group, MOM gave employers two months’ notice before the compliance visit (instead of 10 days’ notice) since some SMEs who were non-compliant would need more time to take actions to improve their employment practices.
For the third intervention group, MOM bundled these interventions and also included a ‘Do it Right’ toolkit with step-by-step instructions, easy to use templates and an implementation plan.
Figure 12.1: Percentage of businesses complying with employment laws, by letter type
Both the ‘salience’ and ‘timeliness’ interventions showed a dramatic improvement in workplace practices by the time of the inspection. However, the bundled interventions with the toolkit were less effective and not statistically significantly different from the control letter. Qualitative feedback from inspectors and employers post-trial indicated that the overtly helpful tone and colourful nature of the toolkit could have detracted from the seriousness of the compliance visit letter. This reinforces other BIT findings that communications that are seen as too friendly could reduce compliance rates. Furthermore, the toolkit with more than ten pages might have led to a perceived high level of effort required to comply and hence, discouraged employers from trying.
As a result of these findings, MOM ran a second trial testing the best performing letter from the previous trial with and without the old toolkit used in the first trial, as well as against a revised toolkit. The new toolkit was condensed into one page and adopted a firm tone in line with that of the inspection letter. Useful templates were attached as an annex.
Control
N=366** p<0.01, * p<0.05, + p<0.1
T1: Salience T2: Timeliness T3: T1 + T2:Make it easy
60
40
20
120
100
80
Perc
enta
ge
0
61.070.0
92.0
**
90.0
**
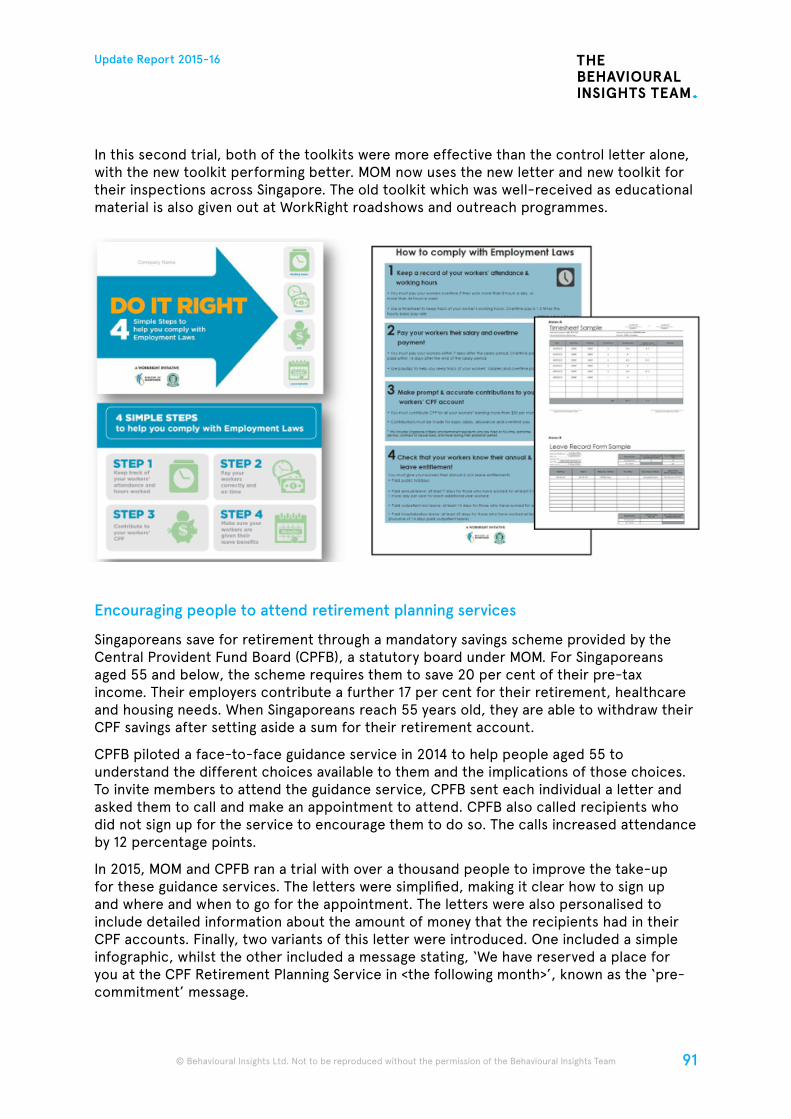
91
Update Report 2015-16
© Behavioural Insights Ltd. Not to be reproduced without the permission of the Behavioural Insights Team
In this second trial, both of the toolkits were more effective than the control letter alone, with the new toolkit performing better. MOM now uses the new letter and new toolkit for their inspections across Singapore. The old toolkit which was well-received as educational material is also given out at WorkRight roadshows and outreach programmes.
Encouraging people to attend retirement planning services
Singaporeans save for retirement through a mandatory savings scheme provided by the Central Provident Fund Board (CPFB), a statutory board under MOM. For Singaporeans aged 55 and below, the scheme requires them to save 20 per cent of their pre-tax income. Their employers contribute a further 17 per cent for their retirement, healthcare and housing needs. When Singaporeans reach 55 years old, they are able to withdraw their CPF savings after setting aside a sum for their retirement account.
CPFB piloted a face-to-face guidance service in 2014 to help people aged 55 to understand the different choices available to them and the implications of those choices. To invite members to attend the guidance service, CPFB sent each individual a letter and asked them to call and make an appointment to attend. CPFB also called recipients who did not sign up for the service to encourage them to do so. The calls increased attendance by 12 percentage points.
In 2015, MOM and CPFB ran a trial with over a thousand people to improve the take-up for these guidance services. The letters were simplified, making it clear how to sign up and where and when to go for the appointment. The letters were also personalised to include detailed information about the amount of money that the recipients had in their CPF accounts. Finally, two variants of this letter were introduced. One included a simple infographic, whilst the other included a message stating, ‘We have reserved a place for you at the CPF Retirement Planning Service in <the following month>’, known as the ‘pre-commitment’ message.
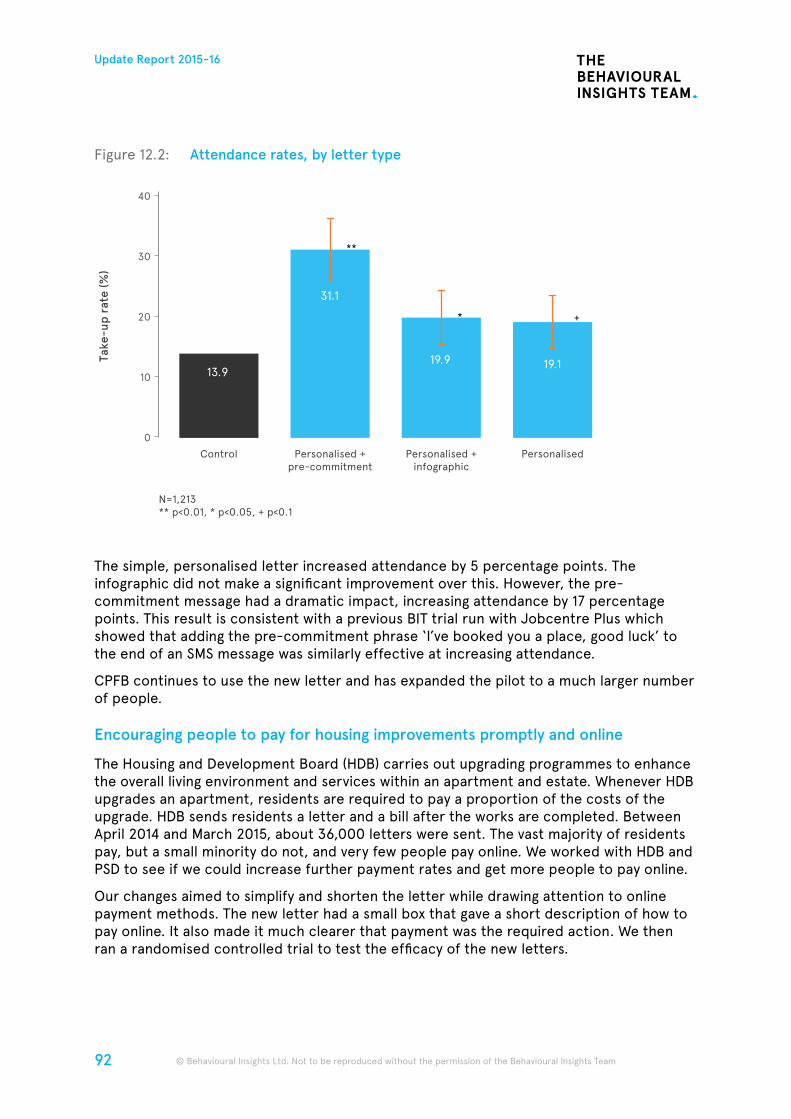
92
Update Report 2015-16
© Behavioural Insights Ltd. Not to be reproduced without the permission of the Behavioural Insights Team © Behavioural Insights Ltd. Not to be reproduced without the permission of the Behavioural Insights Team
Figure 12.2: Attendance rates, by letter type
The simple, personalised letter increased attendance by 5 percentage points. The infographic did not make a significant improvement over this. However, the pre-commitment message had a dramatic impact, increasing attendance by 17 percentage points. This result is consistent with a previous BIT trial run with Jobcentre Plus which showed that adding the pre-commitment phrase ‘I’ve booked you a place, good luck’ to the end of an SMS message was similarly effective at increasing attendance.
CPFB continues to use the new letter and has expanded the pilot to a much larger number of people.
Encouraging people to pay for housing improvements promptly and online
The Housing and Development Board (HDB) carries out upgrading programmes to enhance the overall living environment and services within an apartment and estate. Whenever HDB upgrades an apartment, residents are required to pay a proportion of the costs of the upgrade. HDB sends residents a letter and a bill after the works are completed. Between April 2014 and March 2015, about 36,000 letters were sent. The vast majority of residents pay, but a small minority do not, and very few people pay online. We worked with HDB and PSD to see if we could increase further payment rates and get more people to pay online.
Our changes aimed to simplify and shorten the letter while drawing attention to online payment methods. The new letter had a small box that gave a short description of how to pay online. It also made it much clearer that payment was the required action. We then ran a randomised controlled trial to test the efficacy of the new letters.
Control
N=1,213** p<0.01, * p<0.05, + p<0.1
Personalised +pre-commitment
Personalised +infographic
Personalised
10
40
30
20
Take
-up
rate
(%)
0
13.9
31.1
**
19.9
*
19.1
+
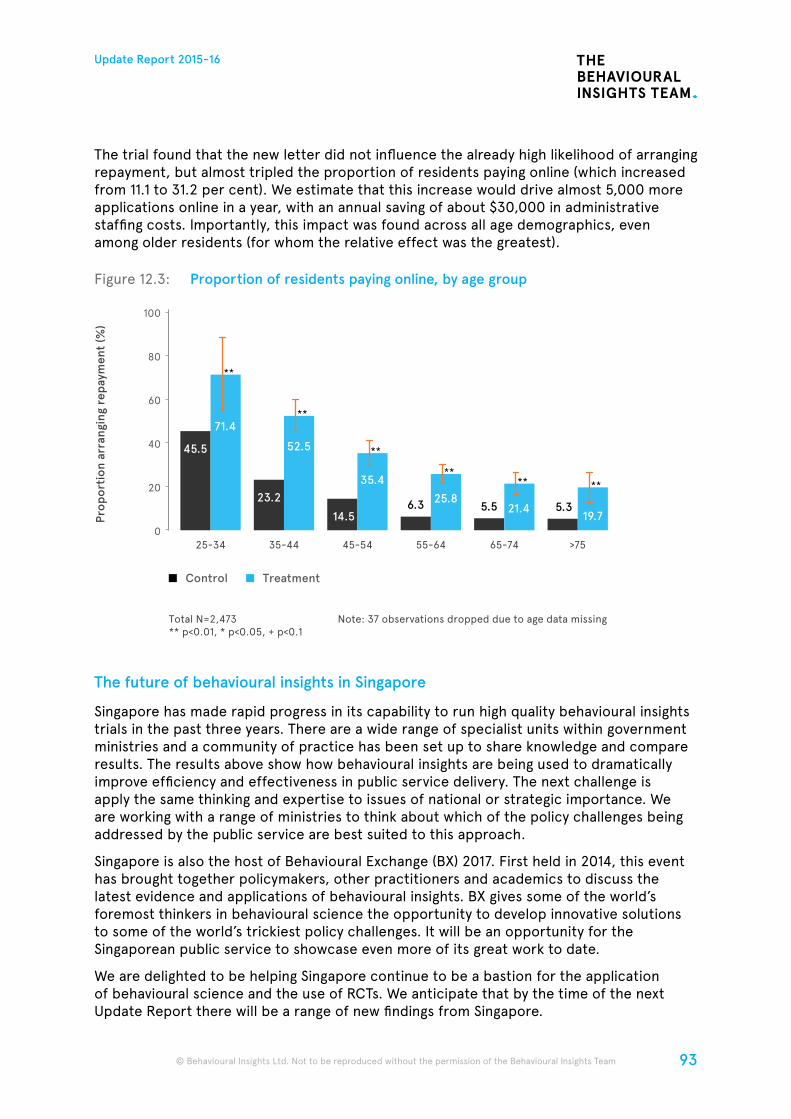
93
Update Report 2015-16
© Behavioural Insights Ltd. Not to be reproduced without the permission of the Behavioural Insights Team
The trial found that the new letter did not influence the already high likelihood of arranging repayment, but almost tripled the proportion of residents paying online (which increased from 11.1 to 31.2 per cent). We estimate that this increase would drive almost 5,000 more applications online in a year, with an annual saving of about $30,000 in administrative staffing costs. Importantly, this impact was found across all age demographics, even among older residents (for whom the relative effect was the greatest).
Figure 12.3: Proportion of residents paying online, by age group
The future of behavioural insights in Singapore
Singapore has made rapid progress in its capability to run high quality behavioural insights trials in the past three years. There are a wide range of specialist units within government ministries and a community of practice has been set up to share knowledge and compare results. The results above show how behavioural insights are being used to dramatically improve efficiency and effectiveness in public service delivery. The next challenge is apply the same thinking and expertise to issues of national or strategic importance. We are working with a range of ministries to think about which of the policy challenges being addressed by the public service are best suited to this approach.
Singapore is also the host of Behavioural Exchange (BX) 2017. First held in 2014, this event has brought together policymakers, other practitioners and academics to discuss the latest evidence and applications of behavioural insights. BX gives some of the world’s foremost thinkers in behavioural science the opportunity to develop innovative solutions to some of the world’s trickiest policy challenges. It will be an opportunity for the Singaporean public service to showcase even more of its great work to date.
We are delighted to be helping Singapore continue to be a bastion for the application of behavioural science and the use of RCTs. We anticipate that by the time of the next Update Report there will be a range of new findings from Singapore.
100
60
20
40
80
Prop
orti
on a
rran
ging
rep
aym
ent
(%)
0
Total N=2,473** p<0.01, * p<0.05, + p<0.1
Note: 37 observations dropped due to age data missing
Control Treatment
25-34 35-44 45-54 55-64 >7565-74
45.5
71.4
**
23.2
52.5
**
14.5
35.4
**
25.86.3
**
21.45.5
**
19.75.3
**
94
Update Report 2015-16
© Behavioural Insights Ltd. Not to be reproduced without the permission of the Behavioural Insights Team © Behavioural Insights Ltd. Not to be reproduced without the permission of the Behavioural Insights Team
This Update Report gives us a chance to reflect on the work of BIT in the UK and our new offices around the world. But it’s also an opportunity to think about how far the behavioural insights agenda has developed, and is likely to continue to develop, over the coming months and years.
A number of patterns, that we began to pick up in last year’s Update Report, are now becoming clearer. And some new ones are emerging. They are that:
1. Behavioural insights is becoming more mainstream in the UK Civil Service. Over the past year, the UK Government has continued to embrace behavioural insights. There are now 15 UK Government Departments or Agencies that either have their own behavioural insights unit or individuals appointed to coordinate behavioural insight activities; or have directly commissioned projects. As a result, behavioural insight thinking and practice is becoming increasingly mainstream amongst UK policymakers.
2. The global spread of behavioural insights is continuing. Those governments that previously established behavioural insight functions have continued to build their capacity and capability. In Singapore, Australia, the US, Canada, Germany, Denmark, and a host of other countries, behavioural insights are becoming increasingly embedded. The same is happening within international organisations – including the World Bank, UNDP, the European Commission and the OECD. BIT is, of course, part of these developments, with our network of offices in Sydney, New York and Singapore.
3. Behavioural insights is being applied to more complex areas. This report shows that there remain many powerful ways of applying behavioural insights to improve administrative processes. For example, there are lots of new examples that demonstrate simple ways of increasing tax compliance, fine collections, and encouraging people online. Such applications remain important, and can lead to dramatic improvements, particularly in contexts where compliance rates are low. However, over the last year, BIT has significantly expanded its work into more complex interventions and policy areas. This includes: our large scale trials in Further Education Colleges; our examination of the under-reporting of calorie consumption; and the work on important policy challenges like anti-corruption and obesity.
4. Developing tools, as well as policy interventions. Sometimes a better answer to a policy problem than new legislation or a new government policy, is to encourage or offer a new tool (such as a website, an app, or a physical product). This can be difficult to do inside government, and was one of the reasons why the Cabinet Office wanted BIT to become a social purpose company (and to have the innovation charity Nesta as a partner). The first of BIT’s new such tools – Applied – which helps organisations to remove bias from their own recruitment practices, is described in this report. We hope that this will be the first of many such tools: products that serve a specific social purpose but that do not require ongoing government subsidy.
Conclusion
95
Update Report 2015-16
© Behavioural Insights Ltd. Not to be reproduced without the permission of the Behavioural Insights Team
5. Understanding what doesn’t work, as well as what does. In this report, we have continued to emphasise the importance of setting out findings from trials that have shown null effects – in other words, the interventions have not worked. This includes the Plymouth energy efficiency trials; and the electoral registration trials in Wales. We think that it is incredibly important for practitioners around the world to be able to be open and transparent about interventions that do not work, which helps to add to the body of knowledge just as much as those that have positive results. In this sense, a ‘null result’ is not a negative result, but a precious finding. It is certainly better to identify that something does not work on a small scale, than implement it at national level, as we have too often done in the past.
The year ahead is likely to be another exciting one for those working in the field of behavioural insights. The range and impact of behavioural approaches, increasingly woven into the design of public services and policy, continues to grow – across countries and across challenges.
As a social purpose company, co-owned by the UK Cabinet Office and the charity Nesta, BIT has made it our policy to publish and share our findings so that they can be used widely across the public sector. It is also important, in our view, that governments, public bodies, and even third sector organisations and companies that use behavioural approaches be open with citizens about their use. Ultimately, the use of this powerful approach, and the experimentation that accompanies it, rests on the approval of citizens.
For those public sector practitioners and academics across the world, we hope to see many of you at next year’s Behavioural Exchange conference – in Singapore in 2017 – so that we can continue to share new ideas, and develop new insights together. For others, including members of the public and public service professionals with a more general interest, we hope that you have found this report a useful and stimulating document. And if you have a behavioural insight that suggests how a public service outcome or service might be improved, do let us know!
96
Update Report 2015-16
© Behavioural Insights Ltd. Not to be reproduced without the permission of the Behavioural Insights Team © Behavioural Insights Ltd. Not to be reproduced without the permission of the Behavioural Insights Team
1. Harper, H., & Hallsworth, M. (2016). How under-reporting can explain the apparent fall in calorie intake. Available at: http://www.behaviouralinsights.co.uk/publications/counting-calories-how-under-reporting-can-explain-the-apparent-fall-in-calorie-intake/
2. For example: Institute for Economic Affairs (2014). The Fat Lie. Available at: https://iea.org.uk/publications/research/the-fat-lie; Institute for Fiscal Studies (2013). Gluttony in England? Long-term change in diet. Available at: http://www.ifs.org.uk/bns/bn142.pdf; Griffith, R., Lluberas, R., & Luhrmann, M. (2016). Gluttony and Sloth? Calories, labour market activity and the rise of obesity. London: Centre for Economic Policy Research. Available at: http://www.cepr.org/active/publications/discussion_papers/dp.php?dpno=11086
3. O’Neill, J. (2016). Tackling drug-resistant infections globally: final report and recommendations. London: Wellcome Trust & HM Government. Available at: http://amr-review.org/
4. Hallsworth, M., Chadborn, T., Sallis, A., Sanders, M., Berry, D., Greaves, F & Davies, S. C. (2016). Provision of social norm feedback to high prescribers of antibiotics in general practice: a pragmatic national randomised controlled trial. The Lancet. Available at: http://www.sciencedirect.com/science/article/pii/S0140673616002154
5. NHS England, (2013). Transforming urgent and emergency care services in England. Urgent and emergency care review end of phase, 1.
6. National Audit Office (2013). Emergency admissions to hospital: managing the demand. Available at: https://www.nao.org.uk/wp-content/uploads/2013/10/10288-001-Emergency-admissions.pdf
7. Jack, B. W. et al. (2009). A reengineered hospital discharge program to decrease rehospitalization: a randomized trial. Annals of internal medicine,150(3), 178-187
8. Halpern, D. (2016). Behavioural Insights and Healthier Lives: VicHealth’s inaugural Leading Thinkers residency. Victorian Health Promotion Foundation. Available at: https://www.vichealth.vic.gov.au/media-and-resources/publications/behavioural-insights-and-healthier-lives
9. NHS England (2016) Retrieved from: https://www.england.nhs.uk/ourwork/qual-clin-lead/diabetes-prevention/
10. Chatterton, H., Younger, T., Fischer, A. & Khunti, K. (2012). Risk identification and interventions to prevent type 2 diabetes in adults at high risk: summary of NICE guidance.
11. Burd, H. & Hallsworth, M. (2016) Making the change: Behavioural factors in person- and community centred approaches for health and wellbeing. Available at: http://www.behaviouralinsights.co.uk/publications/making-the-change-behavioural-factors-in-person-and-community-centred-approaches-for-health-and-wellbeing/
12. Home Office (2016) Reducing Mobile Phone Theft and Improving Security. Available at: https://www.gov.uk/government/uploads/system/uploads/attachment_data/file/509846/WEB-6-1946-HO-Reducing_Mobile_Phone_Theft_and_Improving_Security_March_2....pdf
13. The Dawes Trust’s main objective is the fighting of crime including organised crime by the protection of people and property, the preservation of public order and the prevention and detection of crime for the public benefit.
14. Ministry of Justice (2016) Criminal Court Statistics Quarterly, October to December 2015. Available at: https://www.gov.uk/government/uploads/system/uploads/attachment_data/file/512100/bulletin.pdf
15. Stricker, L. J., Rock, D. A., & Bridgeman, B. (2015). Stereotype Threat, Inquiring About Test Takers’ Race and Gender, and Performance on Low-Stakes Tests in a Large-Scale Assessment. ETS Research Report Series, 2015(1), 1-12.
16. Harackiewicz, J. M., Canning, E. A., Tibbetts, Y., Giffen, C. J., Blair, S. S., Rouse, D. I., & Hyde, J. S. (2014). Closing the social class achievement gap for first-generation students in undergraduate biology. Journal of Educational Psychology, 106(2), 375.
17. Department for Business, Innovation and Skills and the Cabinet Office (2011). Better Choices: Better Deals. Available at: https://www.gov.uk/government/uploads/system/uploads/attachment_data/file/294798/bis-11-749-better-choices-better-deals-consumers-powering-growth.pdf
18. The Behavioural Insights Team (2011). Behaviour change and energy use. Available at: http://neweconomists.org/files/Behaviour_and_Energy.pdf
Endnotes
97
Update Report 2015-16
© Behavioural Insights Ltd. Not to be reproduced without the permission of the Behavioural Insights Team
19. Goodhew, J., Pahl, S., Auburn, T. & Goodhew, S. (2014). Making Heat Visible: Promoting Energy Conservation Behaviors Through Thermal Imaging. Environment and Behavior 2015, Vol. 47(10) 1059–1088. Available at: http://eab.sagepub.com/content/early/2014/09/09/0013916514546218
20. Costa, E., King, K., Dutta, R. & Algate, F. (2016). Applying behavioural insights to regulated markets. Available at: http://www.behaviouralinsights.co.uk/publications/applying-behavioural-insights-to-regulated-markets/
21. Linos, E. & Reinhard, J. (2016). A head for hiring: The behavioural science of recruitment and selection. Available at: https://www.cipd.co.uk/binaries/a-head-for-hiring_2015-behavioural-science-of-recruitment-and-selection.pdf
22. Gaucher, D., Friesen, J. & Kay, A. C. (2011). Evidence that gendered wording in job advertisements exists and sustains gender inequality. Journal of personality and social psychology, 101(1), 109.
23. Keynes, J. M. (2007). General theory of employment, interest and money. Atlantic Publishers & Dist.
24. Akerlof, G. A. & Shiller, R. J. (2010). Animal spirits: How human psychology drives the economy, and why it matters for global capitalism. Princeton University Press.
25. Kirkman, E., Sanders, M., Emanuel, N. & Larkin, C. (2016) Evaluating Youth Social Action. Available at: http://38r8om2xjhhl25mw24492dir.wpengine.netdna-cdn.com/wp-content/uploads/2016/01/YSA-Report-Final-Version1.pdf
26. Government Equalities Office (2016). Nicky Morgan: Nowhere left to hide for gender inequality. Available at: https://www.gov.uk/government/news/nicky-morgan-nowhere-left-to-hide-for-gender-inequality
27. United States Election Assistance Commission (1995). The Impact of The National Voter Registration Act of 1993 on the Administration of Elections for Federal Office 1995-1996. A Report to the 105th Congress. Available at: http://www.eac.gov/assets/1/AssetManager/The%20Impact%20of%20the%20National%20Voter%20Registration%20Act%20on%20Federal%20Elections%201995-1996.pdf
28. Edwards, P. J., Roberts, I. G., Clarke, M. J., DiGuiseppi, C., Wentz, R., Kwan, I. & Pratap, S. (2007). Methods to increase response rates to postal questionnaires. The Cochrane Library.
29. Bryan, C. J., Walton, G. M., Rogers, T. & Dweck, C. S. (2011). Motivating voter turnout by invoking the self. Proceedings of the National Academy of Sciences, 108(31), 12653-12656.
30. Gurol-Urganci, I., de Jongh, T., Vodopivec-Jamsek, V., Atun, R. & Car, J. (2013). Mobile phone messaging reminders for attendance at healthcare appointments. The Cochrane Library.
31. Mazar, N., Amir, O., & Ariely, D. (2008). The dishonesty of honest people: A theory of self-concept maintenance. Journal of marketing research, 45(6), 633-644.
32. Gino, F., Ayal, S. & Ariely, D. (2009). Contagion and differentiation in unethical behaviour: the effect of one bad apple on the barrel. Available at: http://www.ncbi.nlm.nih.gov/pubmed/19254236
33. Mazar, N., Amir, O., & Ariely, D. (2008). The dishonesty of honest people: A theory of self-concept maintenance. Journal of marketing research, 45(6), 633-644.
34. BIT Australia’s Ravi Dutta contributed to the Insurance Council of Australia’s report on insurance disclosure. Available at: http://www.insurancecouncil.com.au/assets/Effective%20Disclosure%20Report.pdf
35. Hallsworth, M., Berry, D., Sanders, M., Sallis, A., King, D., Vlaev, I., & Darzi, A. (2015). Stating Appointment Costs in SMS Reminders Reduces Missed Hospital Appointments: Findings from Two Randomised Controlled Trials. PloS one, 10(9), e0137306.
36. For more detail on the trials undertaken by the BIU in New South Wales, see their summary report available at: http://bi.dpc.nsw.gov.au/assets/Behavioural-Insights/Library/Spotlight-on-Health-Results-Behavioural-Insights-Short-Report.pdf
37. Halpern, D. (2016). Behavioural Insights and Healthier Lives: VicHealth’s inaugural Leading Thinkers residency. Victorian Health Promotion Foundation. Available at: https://www.vichealth.vic.gov.au/media-and-resources/publications/behavioural-insights-and-healthier-lives
38. VicHealth (2015). Citizens’ Jury on Obesity. Available at: https://www.vichealth.vic.gov.au/~/media/ProgramsandProjects/HealthyEating/Attachments/VicHealth%20Citizens%20Jury%20on%20Obesity%20-%20Final%20Report%20-%20October%2018th%202015.pdf

98
Update Report 2015-16
© Behavioural Insights Ltd. Not to be reproduced without the permission of the Behavioural Insights Team © Behavioural Insights Ltd. Not to be reproduced without the permission of the Behavioural Insights Team
99
Update Report 2015-16
© Behavioural Insights Ltd. Not to be reproduced without the permission of the Behavioural Insights Team
The Behavioural Insights Team (BIT) started life inside 10 Downing Street as a government unit dedicated to the application of behavioural sciences. In 2014 we became a social purpose company, jointly owned by the UK Government; Nesta (the innovation charity); and our employees.
Our objectives remain the same as they always have been:
• Making public services more cost-effective and easier for citizens to use;
• Improving outcomes by introducing a more realistic model of human behaviour to policy; and wherever possible,
• Enabling people to make ‘better choices for themselves’
We do this by redesigning public services and drawing on ideas from the behavioural science literature. We are also highly empirical; we test and trial these ideas before they are scaled up. This enables us to understand what works and (importantly) what does not work.
We have around 100 employees, who have either a strong academic grounding in economics, psychology and research methods; or a background in government policy-making. Our headquarters are in London. We also have offices in Manchester, Sydney, Singapore and New York.
If you would like to find out more about the team’s work, please visit our website: www.behaviouralinsights.co.uk
If you would like to contact us, including to discuss potential projects, you can send us an email at: [email protected]
For press enquiries please email: [email protected] or call 0800 3688760
About Us

Behavioural Insights Team 4 Matthew Parker Street London SW1H 9NP
Behavioural Insights Ltd is a limited company registered in England and Wales. Registration number: 08567792.