Embed Size (px)
DESCRIPTION
Update on Curriculum Enrollment, Student Characteristics & Student Success. Leadership Council September 10, 2013. Enrollment as of the Census Point. Ten Year Fall Curriculum Headcount. Highest Ever. Fall Curriculum FTE – Ten Years. - PowerPoint PPT Presentation
Citation preview

LEADERSHIP COUNCIL
SEPTEMBER 10, 2013
Update on Curriculum Enrollment, Student
Characteristics & Student Success

Enrollment as of the Census Point
Headcount Assigned Seats Potential FTE*
Fall 2013 Fall 2012 Fall 2013 Fall 2012 Fall 2013 Fall 2012
Central Campus 10,612 9,869 26,987 22,727 2,840.4 2,731.4
Merancas Campus 1,664 1,516 3,991 3,011 425.7 383.2
Cato Campus 2,211 1,968 4,456 3,577 416.3 376.2
Levine Campus 4,315 4,101 11,105 10,051 1,040.4 1,002.3
Harper Campus 1,200 1,118 2,478 2,140 325.9 311.8
Harris Campus 850 765 1,295 1,144 141.5 142.1
City View Center 29
58
25.4
Off Campus 334 321 362 352 132.7 130.5
Virtual Campus 10,269 10,461 18,469 18,848 1,919.1 1,952.3
All College (unduplicated)
20,454 19,373 69,201 61,850 7,267.4 7,029.8
Increase 5.6% 12.0% 3.3%

Ten Year Fall Curriculum Headcount
Highest Ever

Fall Curriculum FTE – Ten Years
2013 is estimated FTE, 37% increase in FTE since Fall 2006
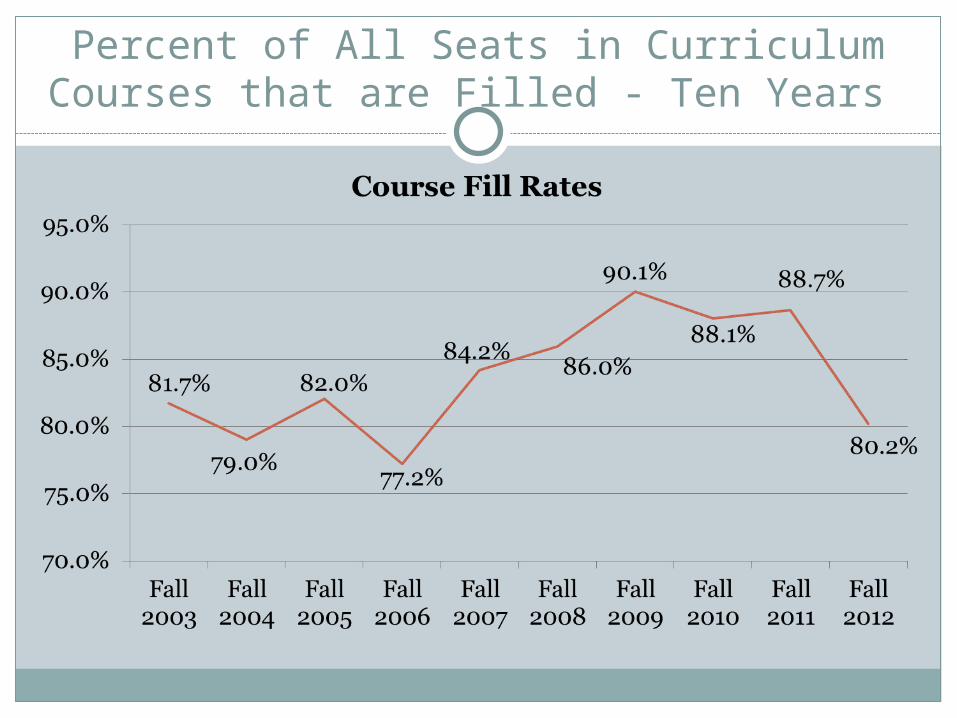
Percent of All Seats in Curriculum Courses that are Filled - Ten Years

Changes in Gender

Changes in Curriculum Numbers by Age
50% increase

Changes in Curriculum Headcount by Race

Assigned Seats Growth by Campus

Virtual Campus – Most Growth in 10 Years
Course Grades in Seated Versus Online Courses (same courses)
Level GradeFall 2010 Fall 2011 Fall 2012
Seated Online Seated Online Seated OnlineN % N % N % N % N % N %
Develop-mental
A-C or Pass
5,814 67% 406 65% 5,665 68% 358 58% 5,854 73% 407 60%
Total 8662 623 8339 621 8059 677
100 Level Courses
A-C Grades
23971
71%5795 64% 23945 73% 6390 66%2425
874% 6614 67%
Total3360
0 9108 32700 9733
32829
9888
200 Level Courses
A-C Grades
6902 77%1830 69% 6776 77% 2058 71% 6605 81% 2109 72%
Total 9008 2648 8776 2901 8169 2923
Seated Classes have 2-13% more A-C grades – Greatest Difference in Developmental Courses
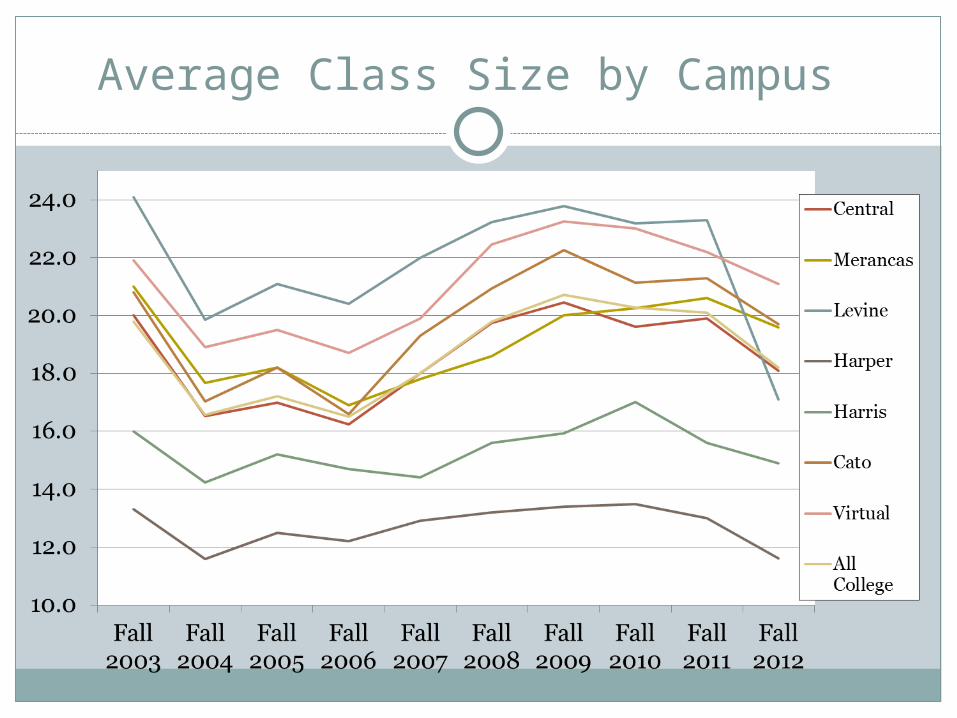
Average Class Size by Campus

Measures of Student Behavior
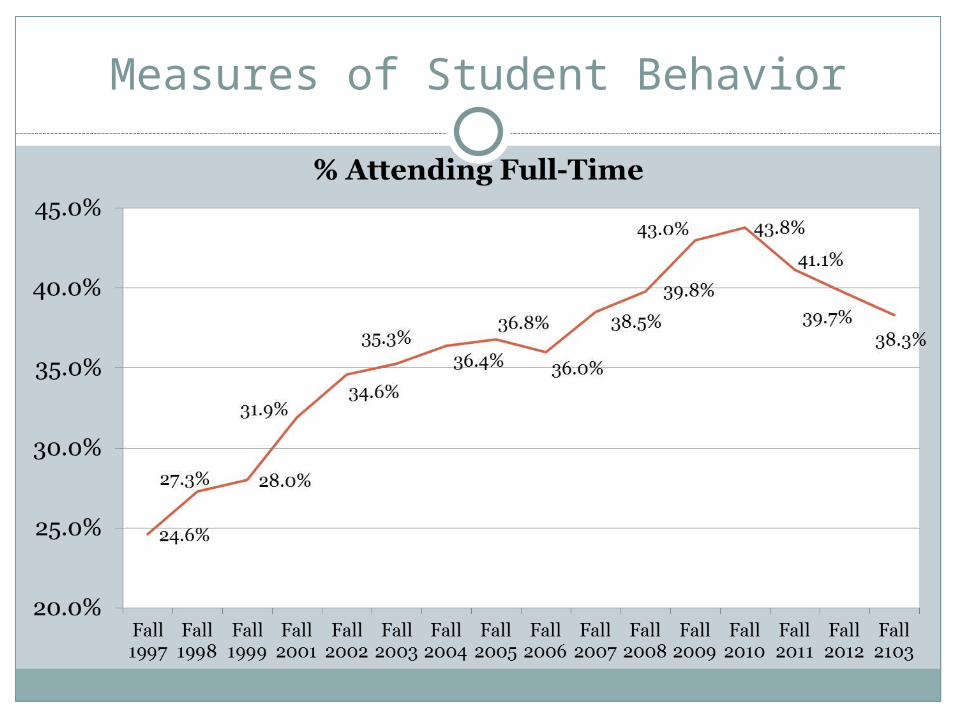
Measures of Student Behavior
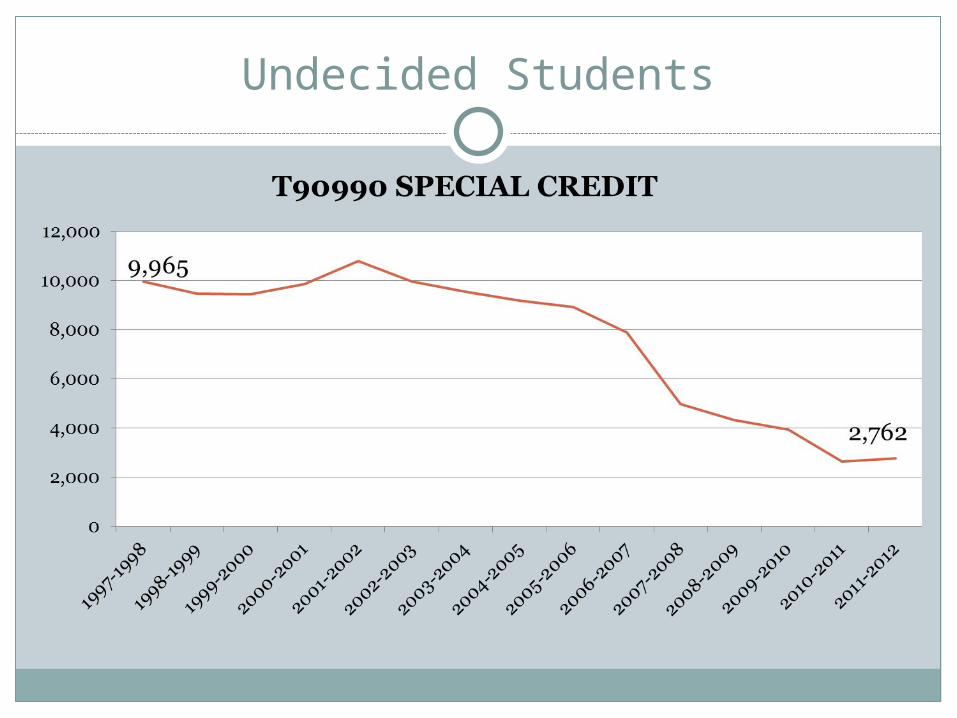
Undecided Students

A-C Grades in All Curriculum Courses
Change in Withdrawal Policy – Fall 2008
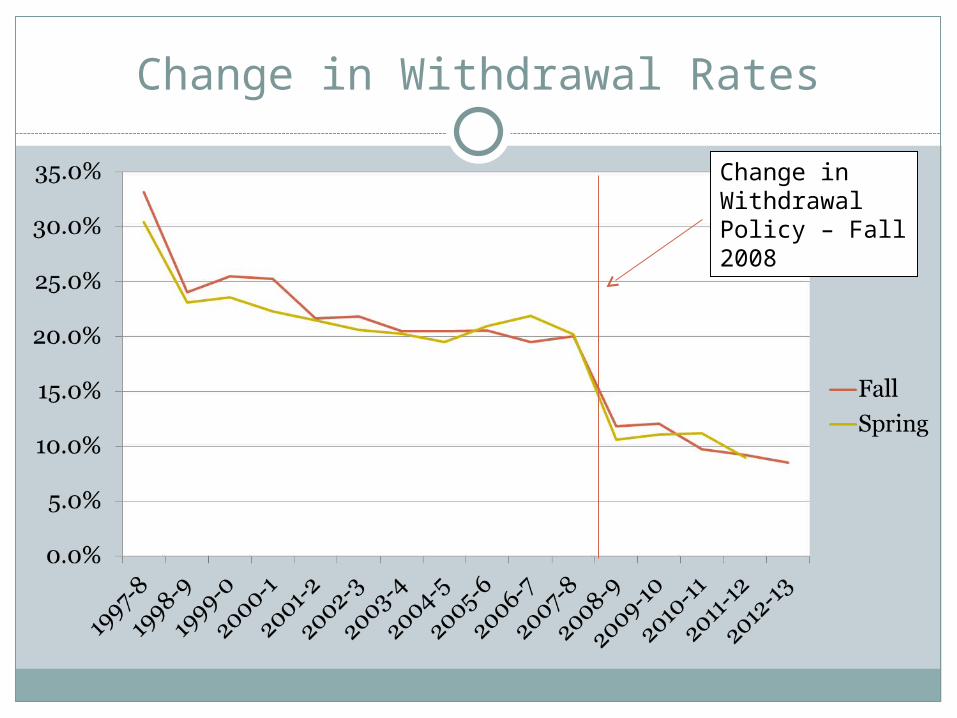
Change in Withdrawal Rates
Change in Withdrawal Policy – Fall 2008
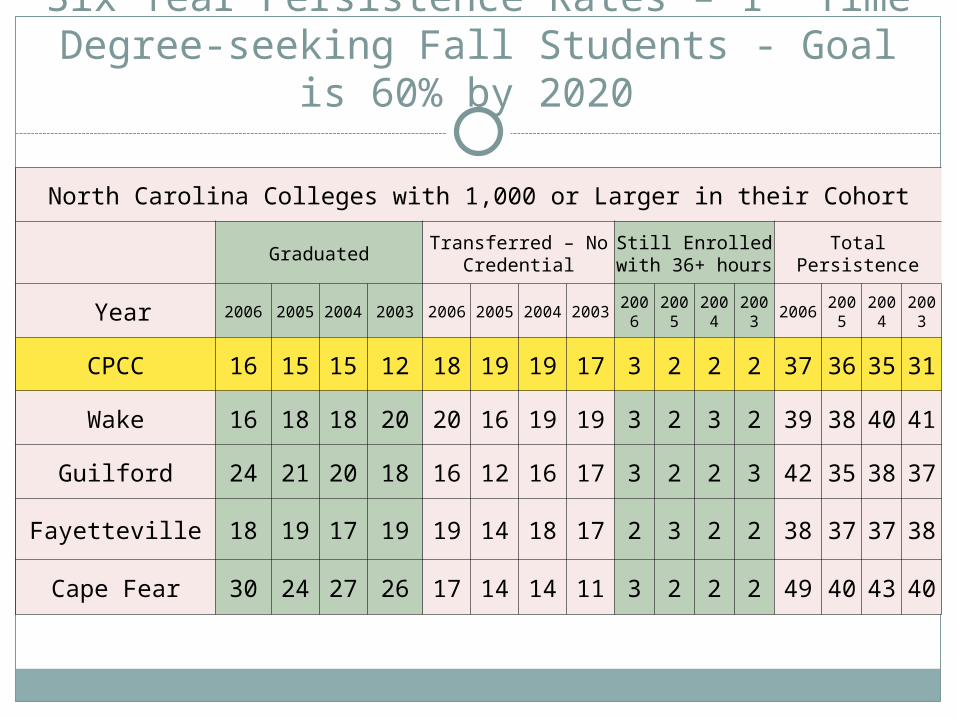
Six Year Persistence Rates – 1st Time Degree-seeking Fall Students - Goal is 60%
by 2020
North Carolina Colleges with 1,000 or Larger in their Cohort
Graduated Transferred – No Credential
Still Enrolled with 36+ hours Total Persistence
Year 2006 2005 2004 2003 2006 2005 2004 2003 2006 2005 2004 2003 2006 2005 2004 2003
CPCC 16 15 15 12 18 19 19 17 3 2 2 2 37 36 35 31
Wake 16 18 18 20 20 16 19 19 3 2 3 2 39 38 40 41
Guilford 24 21 20 18 16 12 16 17 3 2 2 3 42 35 38 37
Fayetteville 18 19 17 19 19 14 18 17 2 3 2 2 38 37 37 38
Cape Fear 30 24 27 26 17 14 14 11 3 2 2 2 49 40 43 40

Fall to Spring Retention(69% for all students)

Fall to Fall Retention(43% for all students)

Tracking the Fall 2010 Cohort (N=4254)
Persistence by GroupReturned Spring
2011
Returned Fall 2011
Returned
Spring 2012
Returned Fall 2012
Returned
Spring 2013
Completed in Three
Years
Transferred
Total (N=4254) 67.4% 43.4% 36.8% 24.6% 20.6% 5.9% 19.8%
Less than 20 years old (N=1685)
74.1% 50.9% 43.7% 30.2% 25.3% 4.2%25.2%
Females (N=2170) 67.7% 44.1% 37.7% 25.3% 21.6% 6.4% 20.0%
Males (N=2084) 67.0% 42.7% 35.7% 23.8% 19.6% 5.4% 19.6%
White, Non-Hispanic (N=2111)
66.3% 44.9% 37.7% 24.8% 20.7% 7.3% 22.4%
Total Minority (N=2143) 68.5% 42.0% 35.8% 24.5% 20.5% 4.6% 17.3%
Full Time (N=2032) 79.2% 51.9% 43.7% 28.7% 23.0% 8.5% 20.3%
Part Time (N=2222) 56.6% 35.7% 30.5% 20.8% 18.5% 3.6% 19.4%
Received Pell in First Term (N=1910)
78.1% 45.4% 38.6% 24.7% 21.1% 5.24% 16.1%
Not Received Pell in First Term (N=2344)
58.7% 41.9% 35.3% 24.6% 20.2% 6.5% 22.9%

Tracking the Fall 2010 Cohort by Program of Study
Persistence by Program Category
Returned Spring
2011
Returned Fall 2011
Returned
Spring 2012
Returned Fall 2012
Returned
Spring 2013
Completed in Three
Years
Transferred
College Transfer Programs (N=1773)
75.2% 50.1% 42.1% 28.1% 23.7% 6.43% 23.9%
Technical Programs (N=490) 69.2% 44.5% 37.8% 25.3% 20.2% 10.00% 5.7%
Business and Technology (N=425)
67.1% 37.9% 31.1% 20.2% 16.5% 7.76% 17.6%
Engineering Sciences (N=120)
70.8% 39.2% 36.7% 27.5% 23.3% 4.17% 18.3%
Medical/ Health Programs (N=44)
86.4% 63.6% 65.9% 15.9% 11.4% 63.64% 6.8%
Protective Sciences (N=135) 55.6% 34.8% 28.9% 21.5% 20.7% 2.96% 17.0%
Education/Human Services (N=204)
47.1% 31.4% 21.1% 14.7% 14.2% 2.94% 12.7%
Health Holding Codes (N=589)
70.3% 46.3% 41.6% 28.4% 24.3% 0.51% 19.0%
Undeclared (N=468) 42.3% 25.4% 21.2% 15.2% 11.5% 2.14% 27.8%
Total 67.4% 43.5% 36.8% 24.6% 20.6% 5.93% 16.7%

Tracking the Fall 2010 Cohort by Developmental Needs
Persistence by Developmental
Placement
Returned Spring 2011
Returned Fall 2011
Returned Spring 2012
Returned Fall 2012
Returned Spring
2013
Completed in Three
Years
Transferred
1 Dev Course (N=921)
74.5% 49.6% 43.5% 30.1% 25.0% 5.9% 18.8%
2 Dev Courses (N=691)
73.1% 46.9% 40.8% 27.2% 23.6% 2.6% 16.5%
3 Dev Courses (N=887)
72.3% 44.1% 37.4% 25.0% 22.5% 1.2% 15.9%
All College Level (N=258)
80.6% 57.0% 46.9% 34.5% 29.1% 8.9% 22.5%
No Scores (n=1497)
55.2% 35.1% 28.6% 18.1% 14.0% 9.8% 23.8%

Numbers in Developmental Pipeline Huge Issue for CPCC
Combined Placement Test Scores (all subjects)
Fall 2008
Number
Fall 2008 %
Fall 2009 Number
Fall 2009 %
Fall 2010
Number
% of those with scores on file -
Fall 2010
No Scores on File 5557 28.8% 5096 25.7% 4719 23.2%
1+ Remedial Courses 11192 58.1% 12160 61.2% 12925 63.5%
No Remedial Courses 2452 12.7% 2544 12.8% 2656 13.0%
Unknown 75 0.4% 64 0.3% 59 0.3%
Total 19276 19864 20359
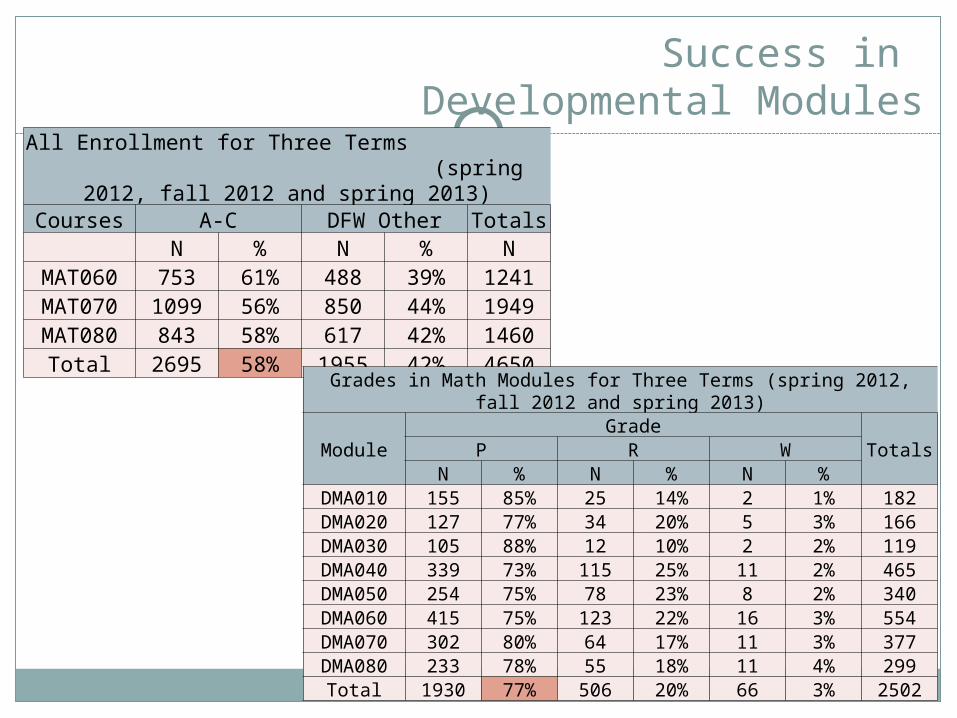
Success in Developmental Modules
All Enrollment for Three Terms (spring 2012, fall 2012 and spring
2013)Courses A-C DFW Other Totals
N % N % NMAT060 753 61% 488 39% 1241MAT070 1099 56% 850 44% 1949MAT080 843 58% 617 42% 1460
Total 2695 58% 1955 42% 4650Grades in Math Modules for Three Terms (spring 2012, fall 2012
and spring 2013)
ModuleGrade
TotalsP R WN % N % N %
DMA010 155 85% 25 14% 2 1% 182DMA020 127 77% 34 20% 5 3% 166DMA030 105 88% 12 10% 2 2% 119DMA040 339 73% 115 25% 11 2% 465DMA050 254 75% 78 23% 8 2% 340DMA060 415 75% 123 22% 16 3% 554DMA070 302 80% 64 17% 11 3% 377DMA080 233 78% 55 18% 11 4% 299
Total 1930 77% 506 20% 66 3% 2502
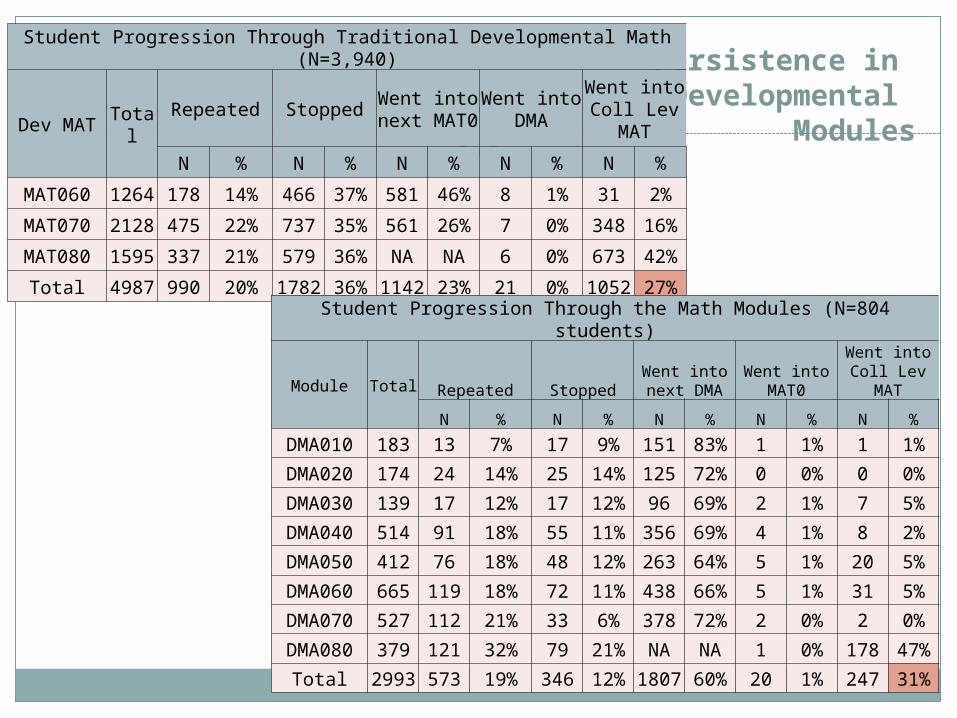
Persistence in Developmental
Modules
Student Progression Through Traditional Developmental Math (N=3,940)
Dev MAT TotalRepeated Stopped
Went into next
MAT0
Went into DMA
Went into Coll Lev
MAT
N % N % N % N % N %
MAT060 1264 178 14% 466 37% 581 46% 8 1% 31 2%
MAT070 2128 475 22% 737 35% 561 26% 7 0% 348 16%
MAT080 1595 337 21% 579 36% NA NA 6 0% 673 42%
Total 4987 990 20% 1782 36% 1142 23% 21 0% 1052 27%
Student Progression Through the Math Modules (N=804 students)
Module Total Repeated StoppedWent into next DMA
Went into MAT0
Went into Coll Lev
MAT
N % N % N % N % N %
DMA010 183 13 7% 17 9% 151 83% 1 1% 1 1%
DMA020 174 24 14% 25 14% 125 72% 0 0% 0 0%
DMA030 139 17 12% 17 12% 96 69% 2 1% 7 5%
DMA040 514 91 18% 55 11% 356 69% 4 1% 8 2%
DMA050 412 76 18% 48 12% 263 64% 5 1% 20 5%
DMA060 665 119 18% 72 11% 438 66% 5 1% 31 5%
DMA070 527 112 21% 33 6% 378 72% 2 0% 2 0%
DMA080 379 121 32% 79 21% NA NA 1 0% 178 47%
Total 2993 573 19% 346 12% 1807 60% 20 1% 247 31%

Translation
Of 19,864 students in one fall term, 5,916 took no/unknown placement tests in math (30%).
3358 tested into higher level college math (Math 155, 161, 171) (17%).
2997 tested to lower level college math (Math 115, 121, 140) but may still need highest developmental level (15%).
7593 tested into remedial math (38%). If 27% of traditional developmental math students currently make
it to college level math, that is 2,959 seats in college level math. If 31% of students in the modules make it to college level math, that is 3,283 seats (324 more) per year.
We also know that students who complete college math take an average of 46 credits before they exit the college whereas those who never complete college level math take 25-30 credits before they exit.
Results will improve with time and experience with the modules.

Final Note
The College is using data to make decisions and inform practice.
A-C grades are going up, withdrawals are going down.Still a difference in grades between seated and online
classes but the gap is closing (except in developmental).
Enrollment is heading back up – highest headcount number in a fall term this fall.
We are retaining full-time students and students under 20 at higher rates than any other group.
Developmental students are leaving us at the 2nd year point.
College-ready students graduate and transfer at much higher rates than students who need remediation.

Final Note
Class fill rates, average class size, student load and percent attending full-time increased during the recession and are all headed back down.
More minority students than majority students attend CPCC.
Average age is going down with a huge growth in students under 30.
The virtual campus have grown 343% in nine years (fastest growing and 2nd largest campus)

Contact
Presentation by:
Terri Manning, AVP, Institutional ResearchBobbie Frye, Director, Institutional ResearchCatherine Kurilla, Senior Research Analyst,
Institutional Research