Embed Size (px)
Citation preview

Journal of Integrative Agriculture 2018, 17(7): 1641–1654
REVIEW
Available online at www.sciencedirect.com
ScienceDirect
Update of Meat Standards Australia and the cuts based grading scheme for beef and sheepmeat
Sarah P. F. Bonny1, 2, Rachel A. O’Reilly1, David W. Pethick1, Graham E. Gardner1, Jean-François Hocquette2, Liselotte Pannier1
1 School of Veterinary and Life Sciences, Murdoch University, Murdoch, WA 6150, Australia 2 Clermont Université, INRA, VetAgro Sup, UMR1213, Recherches sur les Herbivores, Saint-Genès Champanelle F-63122, France
AbstractChanging markets and evolving consumer demand present new challenges for the beef and sheep industries. In response, the industry has been investing in innovations to deliver new products and management systems to consumers. One such innovation is the Meat Standards Australia (MSA) system. This system is a Total Quality Management System, aimed at delivering an eating quality guarantee to consumers, and through this adding value to the entire supply chain. At present, it is well developed for beef and still evolving for sheepmeat. MSA has identified Critical Control Points (CCPs) in the production, pre-slaughter, processing and value-adding aspects of the supply chain that impact on consumer palatability through the large-scale taste testing of meat by untrained consumers. These CCPs are used as either (1) mandatory criteria determining eligibility for grading, and (2) inputs in a model predicting the palatability of individual combinations of muscle and different cooking methods. Through the prediction of palatability, MSA increases consumer satisfaction and is used to provide assurance for branded products and new marketing innovations in Australia and internationally. This has added significant value to the Australian beef industry, with several retail examples demonstrating consumer willingness to pay more for premium quality beef and sheepmeat products based on the MSA grading scores. This price differential at retail allows the value of the carcass to be calculated based on the eating quality as well as the volume produced, thereby delivering a financial reward for farmers producing high quality carcasses. The continuous quality scale of MSA allows producers to realise the financial gain of incremental improvements in quality, as well as the precise economic weights associated with traits such as marbling, ossification score, or breed. The use of MSA in this fashion has underpinned a new and innovative supply chain where the pricing is transparent and allows producers to make informed decisions to modify both quality and yield traits. To date, the MSA system for beef has proved to be effective in predicting beef palatability not only in Australia but also in many other countries (France, Poland, Ireland, Northern Ireland, Japan, South Korea, New-Zealand, the USA and South Africa). In Europe, results of the ProSafeBeef and ProOptiBeef projects as well as other national projects demonstrate the potential to develop an MSA-like international grading system for the supply chain in the EU, despite the
Received 4 July, 2017 Accepted 21 March, 2018Correspondence Sarah P. F. Bonny, E-mail: [email protected]
© 2018, CAAS. Published by Elsevier Ltd. This is an open access art ic le under the CC BY-NC-ND l icense (http:/ /creativecommons.org/licenses/by-nc-nd/4.0/)doi: 10.1016/S2095-3119(18)61924-0
1642 Sarah P. F. Bonny et al. Journal of Integrative Agriculture 2018, 17(7): 1641–1654
1. Introduction
Consumers have difficulty selecting red meat of a consistent or reliable eating quality and this is seen as a major factor in the global decline in beef (Morgan et al. 1991; Henchion et al. 2014) and sheepmeat consumption in developed countries (Russell et al. 2005; Pethick et al. 2011). As the eating quality of beef and lamb is experienced by the consumer after purchase, it heavily influences a consumer’s intent to re-purchase the product (repeat purchase intent) (Grunert et al. 2004; Pethick et al. 2006), one of the biggest drivers of profitability for an industry. Within the red meat industry, there are many different grading systems designed to add some consistency and transparency to red meat supply chains. For beef, these systems are intended to rank individual carcasses into a number of grades. Most are designed to capture carcass shape and yield, although some claim to rank carcasses on the basis of quality. These yield and quality grades are usually determined by a variety of objective and subjective measurements such as fat depth, meat colour, marble, carcass fat and conformation scores, and texture scores (Polkinghorne and Thompson 2010). However, when related to sensory scores, these grades poorly discriminate on eating quality, generally accounting for less than 15% of the variance in consumer taste panel scores (Bonny et al. 2016b; reviewed by Polkinghorne and Thompson 2010).
Meat Standards Australia (MSA) represents a new approach to grading carcasses, differing markedly from other systems currently employed around the world. Firstly, it independently grades each cut (MSA for beef) rather than applying a common grade to the entire carcass. Muscle type, rather than breed, age or other carcass factors, explain most of the variability of beef eating quality (Jurie et al. 2007). Secondly, the definition of quality is based on responses of many thousands of untrained consumers, rather than trained consumers or instrumental measures. Since its inception in 1997, over 700 000 beef samples have been tested using more than 100 000 consumers, and testing 9 000 sheepmeat cuts involving 15 000 consumers have been evaluated (Meat and Livestock Australia 2017). Previous research had clearly shown that beef eating quality was a reflection of all the events that have occurred up until consumption, including when the steak was cooked.
Failure of only one link in this chain can increase the risk of a poor-eating experience for the consumer. Therefore, the MSA system uses a Total Quality Management System approach to grading, incorporating both pre- and post-slaughter information coupled with carcase measurements taken in the chiller (such as post-mortem stress, pH and temperature decline) (Polkinghorne et al. 2015).
This paper briefly describes the current state and future directions of MSA for both beef and sheepmeat. It describes the input parameters used to predict palatability using the MSA beef model, followed by a brief description of the Critical Control Points (CCPs) for palatability and how this is integrated into the MSA prediction model. Information will be provided describing the recent extension of the system into grading sheepmeat. Finally, research demonstrating that such a system is also applicable to international consumers and supply chains is presented.
2. Measurement of beef palatability by MSA
A decline in beef consumption was evident from the 1970’s onwards, and was a significant concern for the Australian beef industry. Since 1990, funding and research priorities have focused on supplying a more consistent product and accurately describing palatability for the consumer (CIE 1996). This was termed MSA and the program was placed in the care of the newly formed Meat and Livestock Australia (MLA) organisation, which is responsible for marketing, research and development for Australia’s red meat and livestock industry. First, the decision was made to move away from trained panellists and instrument measures of quality, and to use sensory results from consumer taste panels as the ultimate determinant of eating quality. To evaluate meat samples, untrained consumers scored samples on 100 mm line scales for four sensory traits, tenderness, juiciness, flavour liking and overall liking. In addition, consumers categorised each sample into the following quality grades; unsatisfactory (no grade), good everyday (3 star), better than everyday (4 star), or premium quality (5 star) (Watson et al. 2008a).
In order to generate a single score that described the whole of a consumer’s eating experience, the four sensory traits were combined into a single palatability or meat quality score (MQ4), by weighting tenderness, juiciness, flavour liking and overall acceptability scores by 0.4, 0.1, 0.2 and
diverse cultures and complex beef production systems within the member states. International testing in lamb has only just begun and preliminary results are discussed here.
Keywords: eating quality, consumer, beef, sheep, Meat Standards Australia, international, cut

1643Sarah P. F. Bonny et al. Journal of Integrative Agriculture 2018, 17(7): 1641–1654
0.3, respectively. These weightings were derived from a discriminant analysis (Watson et al. 2008a).
A further step was to relate MQ4 to the consumer assessed quality grades, unsatisfactory (no grade), good everyday (3 star), better than everyday (4 star), or premium quality (5 star). A discriminant analysis was then used to calculate the MQ4 scores that related to the boundaries between each of the quality grades; namely 45.5 for the ungraded and 3 star categories, 63.5 for the 3 and 4 star categories, and 76.5 for the 4 and 5 star categories (Watson et al. 2008a).
2.1. Development of a model to predict palatability
Using the MQ4 as the definition of quality, the MSA prediction model was developed using a multiple regression approach. Input variables from the production, processing and value adding sectors were included in a model to predict palatability of individual muscles for a range of cooking techniques. An important feature of the model approach was flexibility, with no single prescribed method to produce a quality product, which is a limitation of the “pathways” approach to quality. Producers have the ability to make management decisions that best suited their stock and local environment, outside of a few critical requirements pre-slaughter. At the processing and retail end, individual cuts each received a quality score for a range of cooking methods and post-mortem ageing periods, enabling the processors and retailers to use the products in the way that best fit a variety of different brands and markets. This was desirable, as consumers are not concerned by how palatability scores are derived, rather, that the palatability of the meat matches its description.
The initial MSA model was developed using consumer scores and production and processing data from 12 700 beef samples. The current 2017 version utilises data from over 100 000 consumers and 70 000 beef cuts (Meat and Livestock Australia 2017), and has undergone extensive international testing. The system is regularly updated to reflect current consumer tastes and production methods, which is essential to ensure the quality rating remains relevant and accurate for consumers. For example, the weight of the four sensory scores (tenderness, juiciness, flavour liking, overall liking) used to determine eating quality (MQ4) were modified to apply equal weightings to flavour liking and tenderness, in order to reflect changing consumer preferences. This represents the core MSA philosophy that standards should reflect the consumer and be adjusted as required, while concurrently allowing producers the flexibility to make their own management decisions. This avoids the drawbacks of being prescriptive as to the methods of production (Polkinghorne et al. 2008b).
2.2. Components of the beef MSA model
The core of MSA are the CCPs that have been selected on the basis of extensive consumer testing. They are used to manage beef palatability in two ways. Firstly, there is a set of mandatory criteria for carcasses to be eligible for grading; secondly, other CCPs have been incorporated into a continuous grading model to predict palatability for individual combinations of muscle and cooking method. The individual grading of muscles allows MSA to accurately capture CCPs that have a different level of impact on different muscles within a carcass. For example, it is well known that the hanging method used during the chilling disproportionally affects the muscles in the hindquarters, and has relatively little impact on the forequarter muscles. Other factors with a variable impact by muscle are sex, marbling and carcass weight.
A sample output from the MSA model is shown in Fig. 1. The parameters used to predict palatability in MSA are described below: Percentage of Bos indicus The percentage of Bos indicus is specified on the producer declaration form. As this is a group value and can be difficult to determine precisely, the accuracy of the measure is increased by also recording the hump height at grading and related to carcass weight. Here, there is the potential to further increase accuracy using genetic information. Sex The sex category adjusts the palatability score for females and steers. A sex adjustment is applied in two ways. One adjustment is by muscle, with various muscles showing a slight difference between sexes. The second adjustment is applied differentially in conjunction with the ossification score across all muscles. The magnitude of the sex adjustment varies with muscle and is relatively small, being of the order of 2 palatability units. The next commercial MSA model will include an adjustment for bulls. Carcass weight Carcass weight is used in conjunction with ossification score to estimate the effect of growth rate on palatability. The change in palatability with increased carcass weight differs for each ossification range and tends to decline as ossification score increases. An increase in USDA ossification score from 120 to 200 would change palatability (as measured by MQ4) by approximately 3 units out of a total of 100. The magnitude of the adjustment varies with muscle.Milk fed veal (MFV) Muscles from calves weaned at approximately 10 months of age immediately prior to slaughter receive a higher score than from earlier weaned cattle of equivalent ossification score. The magnitude of the MFV effect varies with muscle and ranges from 0 to 6 palatability units.Carcass hanging method The effect of hanging method

1644 Sarah P. F. Bonny et al. Journal of Integrative Agriculture 2018, 17(7): 1641–1654
varies for individual muscles, with different values for each muscle and hang combination. Hanging methods are AT (Achilles tendon), TS (Tenderstretch from the ligament), TX (Tenderstretch from the aitch bone) and TC (Tendercut). The Tenderstretch method was recently adopted by a private French company and used to launch a new premium beef brand (“Or Rouge”) in France. They use Tenderstretch during chilling to improve tenderness of loin and many hind quarter cuts.Marbling It is well known that intramuscular fat has a positive relationship with the eating quality of beef (Thompson 2002). Currently, there are no commercially viable methods to directly measure intramuscular fat in an abattoir. To compensate for this, two measurements of fatness, marbling score and rib fat, are used to estimate
this relationship within the MSA system. As marbling score and rib fat are positively correlated, the relationship between the two must be accounted for when calculating the palatability grade. This is achieved by evaluating the effect of marbling within defined ranges of rib fat scores. In general, an increase in USDA marble score from 250 to 1 190 (equivalent to an increase from about 2 to 20% chemical fat) results in an increase in palatability (as measured by MQ4) of 8 units for the striploin. The magnitude of the adjustment for marbling varies by muscle type.Ultimate pH Ultimate pH is the pH reached by the m. longissimus thoracis after the cessation of metabolic activity post-slaughter. It used both in the calculation of the palatability score, and as a threshold criteria in the MSA system. The threshold for ultimate pH is 5.7, and any
Description Format Name Input Cut Muscle GRL RST SFR TSL SCT CRNEstimated % Bos indicus % or X if doubt EPBI 25 Spinalis SPN081 5 4 5 4Animal sex type M/F Sex M Tenderloin TDR034 5 5Hormone growth promotant Y or ?/N HGP N Tenderloin TDR062 5 5 5 4Milk fed vealer Y/N MFV N Tenderloin TDR063 4Sale yard Y/N SlYrd N Cube roll CUB045 4 4 4 4
Striploin STA045 4 4 4 4Rinse/Flush Y/N RnFl NStriploin STP045 4 4 4 4Hot Std carcase weight Weight in kg HSCW 300Oyster blade OYS036 3 3 4 4Hang method AT/TS/TL/TC/TX Hang TXBlade BLD095 2Blade BLD096 3 3 3 3 3
Hump height mm Hump 40
Chucktender CTR085 3 3 3 3Ossification USDA USDA measure uoss 150
Rump RMP131 3 4 4 4 4Marbling USDA USDA measure umb 350
Rump RMP231 3 4 4 4Rib fat mm RbFt 5
Rump RMP005 4 4 4Ulitimate pH Metered pH UpH 5.62
Rump RMP032 4 4Loin temp at grade Metered temp C Utmp 5.2
Rump RMP087 3 4 3 3Knuckle KNU066 3 4 3 4 3
Days of ageing from kill Days aged Age 21
Knuckle KNU098 3 4 3Knuckle KNU099 2 3 3 3 3Knuckle KNU100 4 4 3Outside flat OUT005 3 3 3 4 3Outside flat OUT029 3 4 3Eye round EYE075 3 3 3 3 3 3Topside TOP001 3 3 3 3Topside TOP033 3 3 4 4Topside TOP073 2 3 3 4 3Chuck CHK068 3 3 4Chuck CHK074 3 3 3 4 4Chuck CHK078 3 3 3 3 4Chuck CHK081 3 4Chuck CHK082 3 3Thin-flank TFL051 3 3Thin-flank TFL052 4 3Thin-flank TFL064 4 3 4Rib-blade RIB041 3Brisket BRI056 2 3 3 2Brisket BRI057 2 3 3Shin FQshin 4Shin HQshin 4Intercostal INT037 3
Fig. 1 A sample output from the Meat Standards Australia (MSA) cuts based model, showing the inputs used to predict palatability (estimated Bos indicus content, sex, hormone growth promotant, milk fed vealer classification, sale yard, carcass weight, hanging technique, hump height, ossification score, USDA marbling score, rib fat depth, ultimate pH, loin temperature, days aged, and selling method, showing in left) and the outputs which comprise predicted grade (3, 4 or 5 star) by cut/muscle and cooking technique (showing in right). Those cells with a cross represent muscle/cooking combinations which failed to grade. Blank cells represent muscle/cooking combinations that have not been tested. For some cuts, different parts of the same muscles are considered. GRL, grill; RST, roast; SFR, stir fry; TSL, thin slice; SCT, casserole; CRN, corning.
1645Sarah P. F. Bonny et al. Journal of Integrative Agriculture 2018, 17(7): 1641–1654
carcasses with an ultimate pH of 5.8 or above are ineligible for grading (Thompson 2002). Ageing (or conditioning) Post-mortem aging increases the palatability of muscles, although this varies by muscle. Within MSA it is estimated differently for each muscle within each hanging option. Ageing muscles from 5 to 21 d increases the palatability score of the striploin by up to 4 palatability units.Saleyards Supply of MSA animals is possible from a saleyard if the facilities have been audited and employ best practice for handling animals including a prohibition on mixing of cattle from different sources. If animals are delivered for slaughter through an accredited saleyard system a 5 point penalty is applied to all muscles.Cooking method Palatability for individual muscles is predicted for a specific cooking method. Larger muscles generally have several cooking options. As would be expected, grilling muscles with low amounts of connective tissue resulted in the highest palatability scores. Roasting muscles with low amounts of connective tissue gave similar scores to grilling, whereas roasting gave muscles with high levels of connective tissue produced much higher palatability scores when compared with grilling. Stir frying and thin slicing gave similar results to grilling for low connective muscles, but relatively high scores in the high connective tissue muscles. The magnitude of the effect of cooking technique on palatability varies with muscle, but can be of the order of 30 palatability units. Estrogenic and androgenic growth promoting implants Hormone growth promotants (HGPs) markedly reduce the tenderness and palatability of beef, though the magnitude varies between cuts (Thompson et al. 2008a). The impact of HGP’s can be greatly reduced with post-slaughter treatments such as extended post-mortem aging and tenderstretch hanging, however the gap cannot be completely eliminated (Dunshea et al. 2005). Further work is underway to examine the impact of various types of commercially available HGPs on palatability. New factors under consideration It is important that any grading system continues to improve and evolve with new information and technological advancements, as such this is an important focus of MSA. Recent work has explored the role of genetic information, new cooking methods, and new classes of cattle in order to expand the scope of the MSA system and improve the precision of the quality prediction. For example, bulls are not presently eligible for grading within Australia, and any breed adjustment is limited to B. indicus vs. Bos taurus. Other measurements include chronological age, to replace ossification score, and biochemical measurements for intramuscular fat and collagen.
Genetic information has the potential to increase the
detail and accuracy of MSA. For example, gene variants within the calpain-system have been reported to influence the post-mortem of meat from B. indicus animals (Robinson et al. 2012) explaining in part the B. indicus effect noted by MSA. In contrast, the presence of favourable alleles within the calpain-system increased the tenderness of the striploin by 3 to 6 palatability units. The inclusion of such genetic information in the MSA system in the future will encourage producers to include these alleles in their breeding strategies thereby further improving the accuracy of the MSA grading system. The inclusion of this information in the MSA system may be facilitated by the development of certified lines of cattle, which possess the favourable alleles, and/or testing at slaughter as the cost of these tests decrease.
It was recently shown that there are only small relationships between biochemically measured intramuscular fat and collagen with untrained consumer scores for beef quality within particular muscles, despite strong relationships when a range of different muscles are tested (Chriki et al. 2013; Bonny et al. 2015). This indicates that the biochemical profiling of muscles is unlikely to provide extra predictive power for predicting eating quality where muscle type is already known.
As animals mature, the tenderness of meat decreases, particularly due to collagen cross-linking changing the thermal stability of the collagen and its persistence during cooking (Bailey 1985). To estimate this effect, the MSA system uses an ossification score, which is a measure of bone maturity and a proxy for animal maturity (Watson et al. 2008b). As an alternative, Bonny et al. (2016c) explored the relationship between chronological age and eating quality. They demonstrated that animal age has no relationship with eating quality for carcasses from animals less than 3 years old, therefore it would not add value to the current MSA system in Australia. However, where animals were older, and more skeletally mature, ossification score is much less useful in the quantification of eating quality and animal age would increase the precision of a quality-based grading system.
Sex is a factor known to influence the eating quality of meat (Boccard et al. 1979; Seideman et al. 1989; Chriki et al. 2013). However, currently only steers and female cattle are eligible for grading in the MSA system. Bonny et al. (2016a) demonstrated that the eating quality of beef from bull carcasses was accurately predicted by the current factors in the MSA system. However the quality was slightly overpredicted when compared to female or steer carcasses. This work implies that a “bull factor” would be required if bulls were to become eligible for grading in MSA, or a similar-type system. Breed is also known to affect eating quality, but at present the only breed adjustment defined in the MSA system is for B. indicus vs. B. taurus.

1646 Sarah P. F. Bonny et al. Journal of Integrative Agriculture 2018, 17(7): 1641–1654
Differences between dairy and beef breeds (Lizaso et al. 2011) and across beef breeds (Cuvelier et al. 2006) have been well documented, although it was expected that the majority of differences between breeds could be accounted for with standard carcass measurements, such as carcass weight and marbling. However, the results from Bonny et al. (2016a) demonstrated that even after correcting for these standard carcase measurements, a number of cuts from dairy breeds still had better eating quality scores than those predicted by the MSA model. This indicates that a positive adjustment for dairy breed type would improve the accuracy of the MSA system for these cattle.
The type of packaging used to store and display meat can also have significant effects on eating quality. One system known to reduce the eating quality of lamb and beef steaks is high oxygen (80%) modified atmosphere packing. Published data in lamb (Frank et al. 2017) shows a decline of 5–10 palatability units of a total of 100 after extended display time, assessed using MSA sensory protocols.
3. Added value to the industry and the carcass at retail
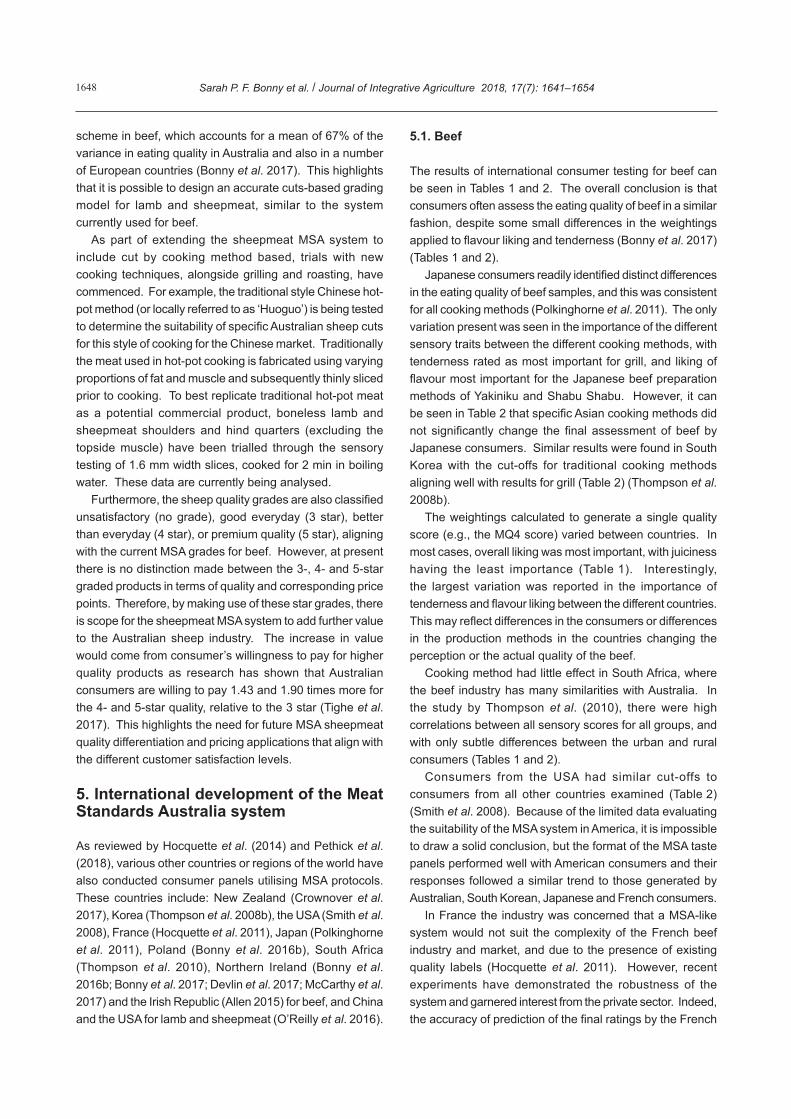
The success of the MSA system has been driven by the added value to the beef industry achieved by supplying better quality beef, and appropriately labelled beef to consumers (Polkinghorne et al. 2008a; Griffith and Thompson 2012). In 2016, there was an average price premium for MSA compliant carcasses of AUD$0.24 kg–1 (Meat and Livestock Australia 2016b). It is notable that the highest price premiums were observed among the cuts with the highest eating quality (Fig. 2 showing a retail premium of AUD$4.33 kg–1 for tenderloin), suggesting that eating quality is a main driver of variation in the price differentials. An average of 40% of these retail premiums are delivered back to beef producers, adding value throughout the supply chain (Polkinghorne et al. 2008a). Through this mechanism, there was an estimated AUD$153 million returned to producers from retail premiums for 3.1 million MSA graded carcasses in the 2015/2016 financial year. This added value can be further broken down to an average of AUD$66 per head for grass fed and AUD$45/head for grain fed cattle. The last extensive review of the MSA system was performed in 2016 where the industry impact and benefit:cost ratio was calculated as AUD$679 million and 12.5:1 in a 5-year performance review between 2010 and 2015 (Meat and Livestock Australia 2016a).
Of most interest to livestock producers is the pricing of the carcass based on the summation of the weight of individual cuts by price according to their eating quality (Meat and Livestock Australia 2011). To determine this, the economic weights for the various quality traits were calculated from a
dataset of 423 carcasses (Doljanin 2013). Given differences in quality and yield, the value of the carcasses at retail when expressed in AUD$ kg–1 hot carcass weight, ranged from AUD$2.15 to 3.16 kg–1. From this data set, it was calculated that tenderstretch resulted in an increase of AUD$0.27 kg–1, and as expected, this could be completely attributed to improvements in eating quality, with no impact of carcass yield. Additionally, the economic weight of the traits that the producer can either influence by management decisions or breed were calculated. For this data set, an increase in 100 units of ossification score resulted in AUD$0.15 kg–1 decrease in value, and again, this effect was independent of carcass yield. For marbling, a 100 unit increase in marbling score resulted in a AUD$0.07 kg–1 increase in carcass value and this increased to AUD$0.09 kg–1 when variation in carcass yield was taken into account. This was because, although an increase in marbling was associated with increased quality, it was also associated with decreased yield. At the same carcass yield, the effect of marbling on value was greater. Fat depth at the 12/13th rib had a negative effect on carcass value with a 1 mm increase in fat depth associated with AUD$0.018 kg–1 decrease in carcass value. As expected the negative effect of fat depth was largely associated with decreased carcass yield.
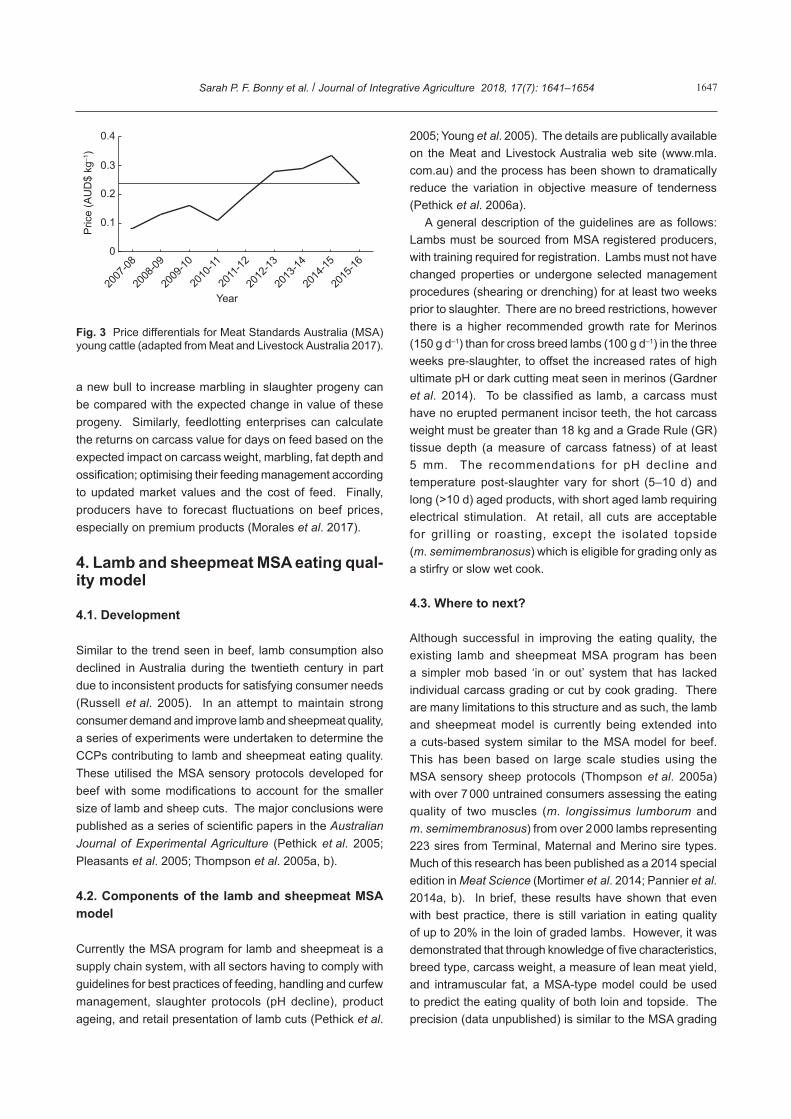
On average, the average price differential for MSA young non-feedlot cattle across all weight ranges was AUD$0.24 kg–1 (Fig. 3). Consequently, MSA beef producers potentially received an additional AUD$66 per head for young non-feedlot cattle. The added value was AUD$45 per head for cattle that meet the grainfed specifications, totalling an estimated AUD$153 million delivered back to the farm gate (Meat and Livestock Australia 2017). This analysis provides clear market signals for the producer to implement either genetic or management programs to change carcass traits. Importantly it also represents the first time that producers have received price differentials for the eating quality of their cattle. With this information, the price of
0.68
2.83
0.18
1.11 1.74
4.33
1.27
0.00
1.25
2.50
3.75
5.00
Blade
Cube r
oll
Knuck
leRum
p
Striploi
n
Tend
erloin
T-bon
e
Pric
e (A
UD
$ kg
–1)
Fig. 2 Average price differentials for Meat Standards Australia (MSA) graded beef by cut in the 2015/2016 financial year in Australia (adapted from Meat and Livestock Australia 2016b).
1647Sarah P. F. Bonny et al. Journal of Integrative Agriculture 2018, 17(7): 1641–1654
a new bull to increase marbling in slaughter progeny can be compared with the expected change in value of these progeny. Similarly, feedlotting enterprises can calculate the returns on carcass value for days on feed based on the expected impact on carcass weight, marbling, fat depth and ossification; optimising their feeding management according to updated market values and the cost of feed. Finally, producers have to forecast fluctuations on beef prices, especially on premium products (Morales et al. 2017).
4. Lamb and sheepmeat MSA eating qual-ity model
4.1. Development
Similar to the trend seen in beef, lamb consumption also declined in Australia during the twentieth century in part due to inconsistent products for satisfying consumer needs (Russell et al. 2005). In an attempt to maintain strong consumer demand and improve lamb and sheepmeat quality, a series of experiments were undertaken to determine the CCPs contributing to lamb and sheepmeat eating quality. These utilised the MSA sensory protocols developed for beef with some modifications to account for the smaller size of lamb and sheep cuts. The major conclusions were published as a series of scientific papers in the Australian Journal of Experimental Agriculture (Pethick et al. 2005; Pleasants et al. 2005; Thompson et al. 2005a, b).
4.2. Components of the lamb and sheepmeat MSA model
Currently the MSA program for lamb and sheepmeat is a supply chain system, with all sectors having to comply with guidelines for best practices of feeding, handling and curfew management, slaughter protocols (pH decline), product ageing, and retail presentation of lamb cuts (Pethick et al.
2005; Young et al. 2005). The details are publically available on the Meat and Livestock Australia web site (www.mla.com.au) and the process has been shown to dramatically reduce the variation in objective measure of tenderness (Pethick et al. 2006a).
A general description of the guidelines are as follows: Lambs must be sourced from MSA registered producers, with training required for registration. Lambs must not have changed properties or undergone selected management procedures (shearing or drenching) for at least two weeks prior to slaughter. There are no breed restrictions, however there is a higher recommended growth rate for Merinos (150 g d–1) than for cross breed lambs (100 g d–1) in the three weeks pre-slaughter, to offset the increased rates of high ultimate pH or dark cutting meat seen in merinos (Gardner et al. 2014). To be classified as lamb, a carcass must have no erupted permanent incisor teeth, the hot carcass weight must be greater than 18 kg and a Grade Rule (GR) tissue depth (a measure of carcass fatness) of at least 5 mm. The recommendations for pH decline and temperature post-slaughter vary for short (5–10 d) and long (>10 d) aged products, with short aged lamb requiring electrical stimulation. At retail, all cuts are acceptable for grilling or roasting, except the isolated topside (m. semimembranosus) which is eligible for grading only as a stirfry or slow wet cook.
4.3. Where to next?
Although successful in improving the eating quality, the existing lamb and sheepmeat MSA program has been a simpler mob based ‘in or out’ system that has lacked individual carcass grading or cut by cook grading. There are many limitations to this structure and as such, the lamb and sheepmeat model is currently being extended into a cuts-based system similar to the MSA model for beef. This has been based on large scale studies using the MSA sensory sheep protocols (Thompson et al. 2005a) with over 7 000 untrained consumers assessing the eating quality of two muscles (m. longissimus lumborum and m. semimembranosus) from over 2 000 lambs representing 223 sires from Terminal, Maternal and Merino sire types. Much of this research has been published as a 2014 special edition in Meat Science (Mortimer et al. 2014; Pannier et al. 2014a, b). In brief, these results have shown that even with best practice, there is still variation in eating quality of up to 20% in the loin of graded lambs. However, it was demonstrated that through knowledge of five characteristics, breed type, carcass weight, a measure of lean meat yield, and intramuscular fat, a MSA-type model could be used to predict the eating quality of both loin and topside. The precision (data unpublished) is similar to the MSA grading
0.4
0.3
0.2
0.1
0
2007
-08
2009
-10
2010
-11
2011
-12
2012
-13
2013
-14
2014
-15
2015
-16
2008
-09
Pric
e (A
UD
$ kg
–1)
Year
Fig. 3 Price differentials for Meat Standards Australia (MSA) young cattle (adapted from Meat and Livestock Australia 2017).
1648 Sarah P. F. Bonny et al. Journal of Integrative Agriculture 2018, 17(7): 1641–1654
scheme in beef, which accounts for a mean of 67% of the variance in eating quality in Australia and also in a number of European countries (Bonny et al. 2017). This highlights that it is possible to design an accurate cuts-based grading model for lamb and sheepmeat, similar to the system currently used for beef.
As part of extending the sheepmeat MSA system to include cut by cooking method based, trials with new cooking techniques, alongside grilling and roasting, have commenced. For example, the traditional style Chinese hot-pot method (or locally referred to as ‘Huoguo’) is being tested to determine the suitability of specific Australian sheep cuts for this style of cooking for the Chinese market. Traditionally the meat used in hot-pot cooking is fabricated using varying proportions of fat and muscle and subsequently thinly sliced prior to cooking. To best replicate traditional hot-pot meat as a potential commercial product, boneless lamb and sheepmeat shoulders and hind quarters (excluding the topside muscle) have been trialled through the sensory testing of 1.6 mm width slices, cooked for 2 min in boiling water. These data are currently being analysed.
Furthermore, the sheep quality grades are also classified unsatisfactory (no grade), good everyday (3 star), better than everyday (4 star), or premium quality (5 star), aligning with the current MSA grades for beef. However, at present there is no distinction made between the 3-, 4- and 5-star graded products in terms of quality and corresponding price points. Therefore, by making use of these star grades, there is scope for the sheepmeat MSA system to add further value to the Australian sheep industry. The increase in value would come from consumer’s willingness to pay for higher quality products as research has shown that Australian consumers are willing to pay 1.43 and 1.90 times more for the 4- and 5-star quality, relative to the 3 star (Tighe et al. 2017). This highlights the need for future MSA sheepmeat quality differentiation and pricing applications that align with the different customer satisfaction levels.
5. International development of the Meat Standards Australia system
As reviewed by Hocquette et al. (2014) and Pethick et al. (2018), various other countries or regions of the world have also conducted consumer panels utilising MSA protocols. These countries include: New Zealand (Crownover et al. 2017), Korea (Thompson et al. 2008b), the USA (Smith et al. 2008), France (Hocquette et al. 2011), Japan (Polkinghorne et al. 2011), Poland (Bonny et al. 2016b), South Africa (Thompson et al. 2010), Northern Ireland (Bonny et al. 2016b; Bonny et al. 2017; Devlin et al. 2017; McCarthy et al. 2017) and the Irish Republic (Allen 2015) for beef, and China and the USA for lamb and sheepmeat (O’Reilly et al. 2016).
5.1. Beef
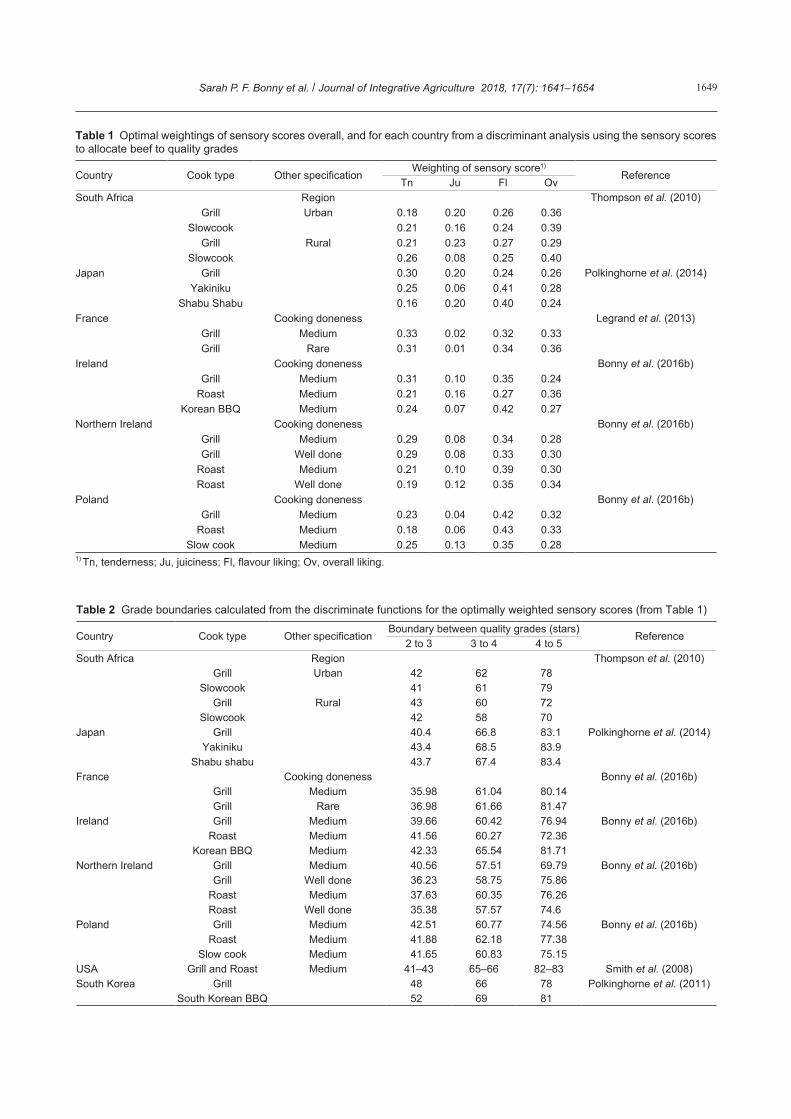
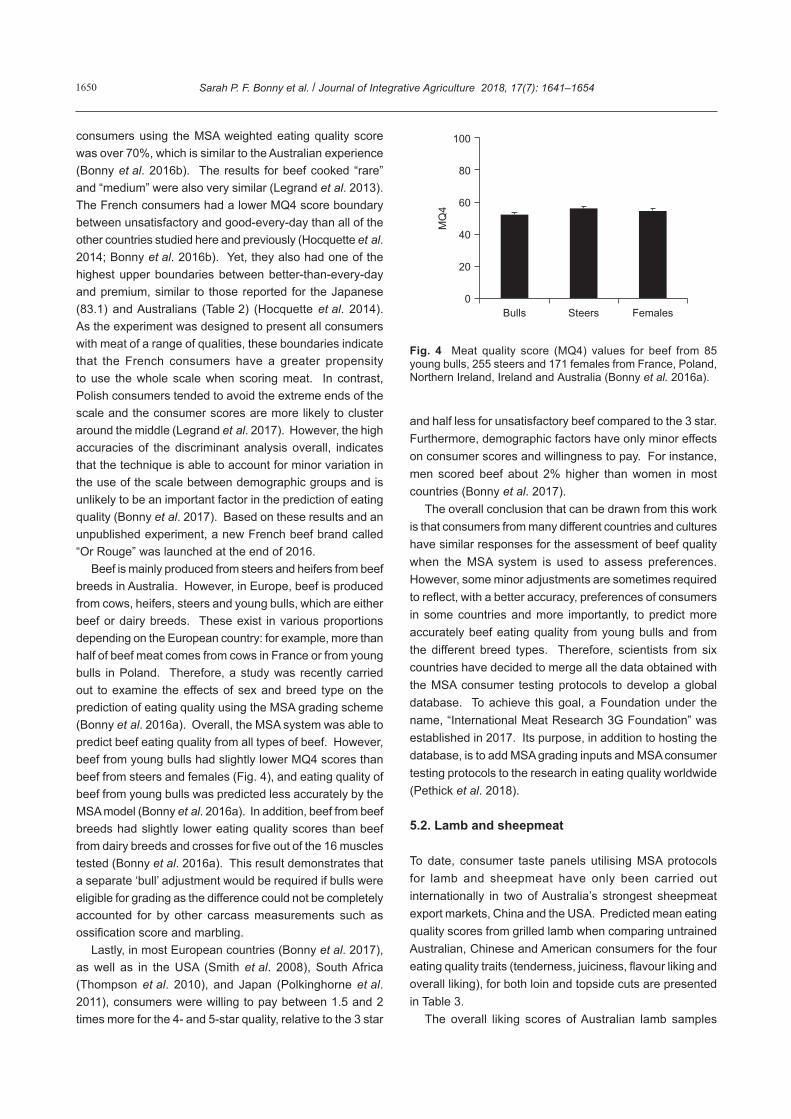
The results of international consumer testing for beef can be seen in Tables 1 and 2. The overall conclusion is that consumers often assess the eating quality of beef in a similar fashion, despite some small differences in the weightings applied to flavour liking and tenderness (Bonny et al. 2017) (Tables 1 and 2).
Japanese consumers readily identified distinct differences in the eating quality of beef samples, and this was consistent for all cooking methods (Polkinghorne et al. 2011). The only variation present was seen in the importance of the different sensory traits between the different cooking methods, with tenderness rated as most important for grill, and liking of flavour most important for the Japanese beef preparation methods of Yakiniku and Shabu Shabu. However, it can be seen in Table 2 that specific Asian cooking methods did not significantly change the final assessment of beef by Japanese consumers. Similar results were found in South Korea with the cut-offs for traditional cooking methods aligning well with results for grill (Table 2) (Thompson et al. 2008b).
The weightings calculated to generate a single quality score (e.g., the MQ4 score) varied between countries. In most cases, overall liking was most important, with juiciness having the least importance (Table 1). Interestingly, the largest variation was reported in the importance of tenderness and flavour liking between the different countries. This may reflect differences in the consumers or differences in the production methods in the countries changing the perception or the actual quality of the beef.
Cooking method had little effect in South Africa, where the beef industry has many similarities with Australia. In the study by Thompson et al. (2010), there were high correlations between all sensory scores for all groups, and with only subtle differences between the urban and rural consumers (Tables 1 and 2).
Consumers from the USA had similar cut-offs to consumers from all other countries examined (Table 2) (Smith et al. 2008). Because of the limited data evaluating the suitability of the MSA system in America, it is impossible to draw a solid conclusion, but the format of the MSA taste panels performed well with American consumers and their responses followed a similar trend to those generated by Australian, South Korean, Japanese and French consumers.
In France the industry was concerned that a MSA-like system would not suit the complexity of the French beef industry and market, and due to the presence of existing quality labels (Hocquette et al. 2011). However, recent experiments have demonstrated the robustness of the system and garnered interest from the private sector. Indeed, the accuracy of prediction of the final ratings by the French
1649Sarah P. F. Bonny et al. Journal of Integrative Agriculture 2018, 17(7): 1641–1654
Table 2 Grade boundaries calculated from the discriminate functions for the optimally weighted sensory scores (from Table 1)
Country Cook type Other specificationBoundary between quality grades (stars)
Reference2 to 3 3 to 4 4 to 5
South Africa Region Thompson et al. (2010)Grill Urban 42 62 78
Slowcook 41 61 79Grill Rural 43 60 72
Slowcook 42 58 70Japan Grill 40.4 66.8 83.1 Polkinghorne et al. (2014)
Yakiniku 43.4 68.5 83.9Shabu shabu 43.7 67.4 83.4
France Cooking doneness Bonny et al. (2016b)Grill Medium 35.98 61.04 80.14Grill Rare 36.98 61.66 81.47
Ireland Grill Medium 39.66 60.42 76.94 Bonny et al. (2016b)Roast Medium 41.56 60.27 72.36
Korean BBQ Medium 42.33 65.54 81.71Northern Ireland Grill Medium 40.56 57.51 69.79 Bonny et al. (2016b)
Grill Well done 36.23 58.75 75.86Roast Medium 37.63 60.35 76.26Roast Well done 35.38 57.57 74.6
Poland Grill Medium 42.51 60.77 74.56 Bonny et al. (2016b)Roast Medium 41.88 62.18 77.38
Slow cook Medium 41.65 60.83 75.15USA Grill and Roast Medium 41–43 65–66 82–83 Smith et al. (2008)South Korea Grill 48 66 78 Polkinghorne et al. (2011)
South Korean BBQ 52 69 81
Table 1 Optimal weightings of sensory scores overall, and for each country from a discriminant analysis using the sensory scores to allocate beef to quality grades
Country Cook type Other specificationWeighting of sensory score1)
ReferenceTn Ju Fl Ov
South Africa Region Thompson et al. (2010)Grill Urban 0.18 0.20 0.26 0.36
Slowcook 0.21 0.16 0.24 0.39Grill Rural 0.21 0.23 0.27 0.29
Slowcook 0.26 0.08 0.25 0.40Japan Grill 0.30 0.20 0.24 0.26 Polkinghorne et al. (2014)
Yakiniku 0.25 0.06 0.41 0.28Shabu Shabu 0.16 0.20 0.40 0.24
France Cooking doneness Legrand et al. (2013)Grill Medium 0.33 0.02 0.32 0.33Grill Rare 0.31 0.01 0.34 0.36
Ireland Cooking doneness Bonny et al. (2016b)Grill Medium 0.31 0.10 0.35 0.24
Roast Medium 0.21 0.16 0.27 0.36Korean BBQ Medium 0.24 0.07 0.42 0.27
Northern Ireland Cooking doneness Bonny et al. (2016b)Grill Medium 0.29 0.08 0.34 0.28Grill Well done 0.29 0.08 0.33 0.30
Roast Medium 0.21 0.10 0.39 0.30Roast Well done 0.19 0.12 0.35 0.34
Poland Cooking doneness Bonny et al. (2016b)Grill Medium 0.23 0.04 0.42 0.32
Roast Medium 0.18 0.06 0.43 0.33Slow cook Medium 0.25 0.13 0.35 0.28
1) Tn, tenderness; Ju, juiciness; Fl, flavour liking; Ov, overall liking.
1650 Sarah P. F. Bonny et al. Journal of Integrative Agriculture 2018, 17(7): 1641–1654
consumers using the MSA weighted eating quality score was over 70%, which is similar to the Australian experience (Bonny et al. 2016b). The results for beef cooked “rare” and “medium” were also very similar (Legrand et al. 2013). The French consumers had a lower MQ4 score boundary between unsatisfactory and good-every-day than all of the other countries studied here and previously (Hocquette et al. 2014; Bonny et al. 2016b). Yet, they also had one of the highest upper boundaries between better-than-every-day and premium, similar to those reported for the Japanese (83.1) and Australians (Table 2) (Hocquette et al. 2014). As the experiment was designed to present all consumers with meat of a range of qualities, these boundaries indicate that the French consumers have a greater propensity to use the whole scale when scoring meat. In contrast, Polish consumers tended to avoid the extreme ends of the scale and the consumer scores are more likely to cluster around the middle (Legrand et al. 2017). However, the high accuracies of the discriminant analysis overall, indicates that the technique is able to account for minor variation in the use of the scale between demographic groups and is unlikely to be an important factor in the prediction of eating quality (Bonny et al. 2017). Based on these results and an unpublished experiment, a new French beef brand called “Or Rouge” was launched at the end of 2016.
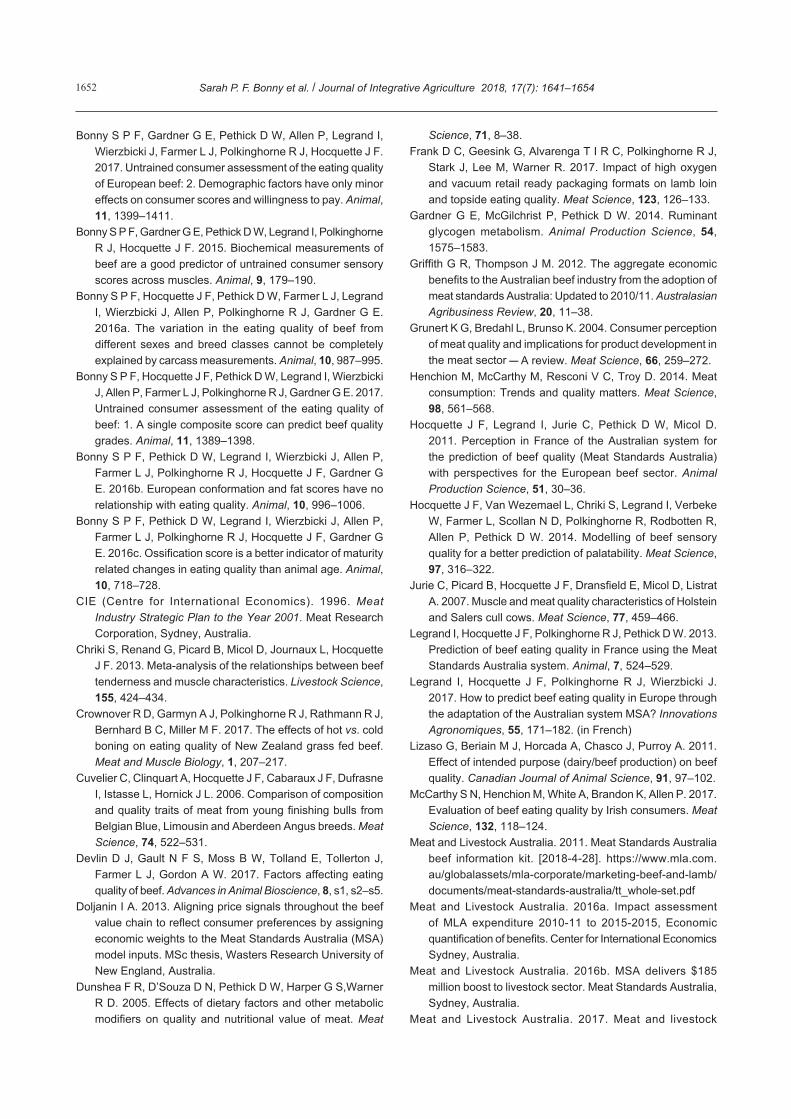
Beef is mainly produced from steers and heifers from beef breeds in Australia. However, in Europe, beef is produced from cows, heifers, steers and young bulls, which are either beef or dairy breeds. These exist in various proportions depending on the European country: for example, more than half of beef meat comes from cows in France or from young bulls in Poland. Therefore, a study was recently carried out to examine the effects of sex and breed type on the prediction of eating quality using the MSA grading scheme (Bonny et al. 2016a). Overall, the MSA system was able to predict beef eating quality from all types of beef. However, beef from young bulls had slightly lower MQ4 scores than beef from steers and females (Fig. 4), and eating quality of beef from young bulls was predicted less accurately by the MSA model (Bonny et al. 2016a). In addition, beef from beef breeds had slightly lower eating quality scores than beef from dairy breeds and crosses for five out of the 16 muscles tested (Bonny et al. 2016a). This result demonstrates that a separate ‘bull’ adjustment would be required if bulls were eligible for grading as the difference could not be completely accounted for by other carcass measurements such as ossification score and marbling.
Lastly, in most European countries (Bonny et al. 2017), as well as in the USA (Smith et al. 2008), South Africa (Thompson et al. 2010), and Japan (Polkinghorne et al. 2011), consumers were willing to pay between 1.5 and 2 times more for the 4- and 5-star quality, relative to the 3 star
and half less for unsatisfactory beef compared to the 3 star. Furthermore, demographic factors have only minor effects on consumer scores and willingness to pay. For instance, men scored beef about 2% higher than women in most countries (Bonny et al. 2017).
The overall conclusion that can be drawn from this work is that consumers from many different countries and cultures have similar responses for the assessment of beef quality when the MSA system is used to assess preferences. However, some minor adjustments are sometimes required to reflect, with a better accuracy, preferences of consumers in some countries and more importantly, to predict more accurately beef eating quality from young bulls and from the different breed types. Therefore, scientists from six countries have decided to merge all the data obtained with the MSA consumer testing protocols to develop a global database. To achieve this goal, a Foundation under the name, “International Meat Research 3G Foundation” was established in 2017. Its purpose, in addition to hosting the database, is to add MSA grading inputs and MSA consumer testing protocols to the research in eating quality worldwide (Pethick et al. 2018).
5.2. Lamb and sheepmeat
To date, consumer taste panels utilising MSA protocols for lamb and sheepmeat have only been carried out internationally in two of Australia’s strongest sheepmeat export markets, China and the USA. Predicted mean eating quality scores from grilled lamb when comparing untrained Australian, Chinese and American consumers for the four eating quality traits (tenderness, juiciness, flavour liking and overall liking), for both loin and topside cuts are presented in Table 3.
The overall liking scores of Australian lamb samples
0
20
40
60
80
100
Bulls Steers Females
MQ
4
Fig. 4 Meat quality score (MQ4) values for beef from 85 young bulls, 255 steers and 171 females from France, Poland, Northern Ireland, Ireland and Australia (Bonny et al. 2016a).

1651Sarah P. F. Bonny et al. Journal of Integrative Agriculture 2018, 17(7): 1641–1654
were consistent for Australian, Chinese, and American consumers (P>0.05) (O’Reilly et al. 2016). Similarly, the perceived juiciness of Australian loin and topside samples was similar for all consumer groups. As for tenderness, Chinese consumers scored tenderness up to 5 units lower out of a total of 100 than Amercian consumers. These lower eating quality estimates likely reflect inexperience with the “Western” style of cooking compared to traditional style Chinese meals which mainly consist of finely sliced or very small portions of proteins. With China’s increasing interest in western culture and access to disposable incomes, exposure to, and ultimately acceptability of a “thicker”, “Western” style steak is likely to ensue.
Further detailed analysis of the combined eating quality scores, the accuracy of their prediction within each country, and the impact of culinary preferences will yield more conclusive results on the success of the lamb and sheepmeat MSA grading system in China and the USA in the future.
6. Conclusion
As demonstrated in this review, the MSA grading system is a quality assurance system capable of managing and predicting beef and sheepmeat palatability, not only in Australia but also in many other countries from different parts of the world particular for beef. One of the keystones of the system is the use of CCPs which impact on palatability. Importantly, these CCPs have been defined and quantified using large scale consumer taste panels. There are CCPs in every stage of the chain, from production, transport, and slaughter to post-processing. Together, these CCPs are used as input factors into the MSA grading system to generate a palatability score. The model provides a multitude of pathways to achieve a defined quality outcome, allowing producers to make decisions that best suit their production strategies. This is effective as the important aspect for consumers is that the expected quality matches their eating experience, as long as handling of the animal/carcass along the red meat supply chain meets welfare and
food safety standards. This also gives scope for branded products to use the grading system, while still retaining the ability to differentiate themselves in the market place with particular methodologies, for example “Certified Angus Beef” or “Prime Dorper Lamb”. There are now plans in place to create an international database combining national MSA beef datasets from all of the different countries where it has been tested.
The key to the financial success of the MSA system will be to use it to underpin value based trading for beef. Research is in progress to recalculate carcass value by summing value of all cuts in the carcass. This may provide a new transparent pricing system, which sends clear economic signals to the producer as to the relative merit of various carcass traits. Experience has demonstrated that producers are very responsive to change when appropriate economic signals are received.
Acknowledgements
Meat and Livestock Australia supported all the consumer evaluations and much of the recent research which underpinned the MSA model development. The authors would also like to thank the Sheep Cooperative Research Centre (CRC) for Sheep Industry Innovation, and associated organisations for funding and data collection support.
References
Allen P. 2015. Testing the MSA palatability grading scheme on Irish beef. Viandes et Produits Carnés, VPC-2015-31-1-5. [2018-4-28]. https://www.viandesetproduitscarnes.fr/index.php/fr/processtechnologies/624-test-du-systeme-msa-pour-predire-la-qualite-de-la-viande-bovine-irlandaise
Bailey A J. 1985. The role of collagen in the development of muscle and its relationship to eating quality. Journal of Animal Science, 60, 1580–1587.
Boccard R L, Naudé R T, Cronje D E, Smit M C, Venter H J, Rossouw E J. 1979. The influence of age, sex and breed of cattle on their muscle characteristics. Meat Science, 3, 261–280.
Table 3 Predicted lamb eating quality for sensory traits for loin and topside for Australian, Chinese and American consumers
Sensory trait Cut Australia China USATenderness Loin 71.2±1.7 69.4±1.7 76.1±1.6
Topside 56.9±1.7 52.4±1.6 58.1±1.6Juiciness Loin 67.2±1.2 68.7±1.2 68.8±1.2
Topside 57.3±1.2 57.0±1.2 57.9±1.2Flavour liking Loin 68.9±0.9 67.9±0.9 68.3±0.9
Topside 58.6±0.9 57.5±0.9 61.0±0.9Overall Liking Loin 71.5±1.2 71.2±1.2 70.6±1.2
Topside 58.6±1.2 58.3±1.2 60.2±1.2Data expressed as eating quality scores (0–100) (mean±SE) were from O’Reilly et al. (2016).
1652 Sarah P. F. Bonny et al. Journal of Integrative Agriculture 2018, 17(7): 1641–1654
Bonny S P F, Gardner G E, Pethick D W, Allen P, Legrand I, Wierzbicki J, Farmer L J, Polkinghorne R J, Hocquette J F. 2017. Untrained consumer assessment of the eating quality of European beef: 2. Demographic factors have only minor effects on consumer scores and willingness to pay. Animal, 11, 1399–1411.
Bonny S P F, Gardner G E, Pethick D W, Legrand I, Polkinghorne R J, Hocquette J F. 2015. Biochemical measurements of beef are a good predictor of untrained consumer sensory scores across muscles. Animal, 9, 179–190.
Bonny S P F, Hocquette J F, Pethick D W, Farmer L J, Legrand I, Wierzbicki J, Allen P, Polkinghorne R J, Gardner G E. 2016a. The variation in the eating quality of beef from different sexes and breed classes cannot be completely explained by carcass measurements. Animal, 10, 987–995.
Bonny S P F, Hocquette J F, Pethick D W, Legrand I, Wierzbicki J, Allen P, Farmer L J, Polkinghorne R J, Gardner G E. 2017. Untrained consumer assessment of the eating quality of beef: 1. A single composite score can predict beef quality grades. Animal, 11, 1389–1398.
Bonny S P F, Pethick D W, Legrand I, Wierzbicki J, Allen P, Farmer L J, Polkinghorne R J, Hocquette J F, Gardner G E. 2016b. European conformation and fat scores have no relationship with eating quality. Animal, 10, 996–1006.
Bonny S P F, Pethick D W, Legrand I, Wierzbicki J, Allen P, Farmer L J, Polkinghorne R J, Hocquette J F, Gardner G E. 2016c. Ossification score is a better indicator of maturity related changes in eating quality than animal age. Animal, 10, 718–728.
CIE (Centre for International Economics). 1996. Meat Industry Strategic Plan to the Year 2001. Meat Research Corporation, Sydney, Australia.
Chriki S, Renand G, Picard B, Micol D, Journaux L, Hocquette J F. 2013. Meta-analysis of the relationships between beef tenderness and muscle characteristics. Livestock Science, 155, 424–434.
Crownover R D, Garmyn A J, Polkinghorne R J, Rathmann R J, Bernhard B C, Miller M F. 2017. The effects of hot vs. cold boning on eating quality of New Zealand grass fed beef. Meat and Muscle Biology, 1, 207–217.
Cuvelier C, Clinquart A, Hocquette J F, Cabaraux J F, Dufrasne I, Istasse L, Hornick J L. 2006. Comparison of composition and quality traits of meat from young finishing bulls from Belgian Blue, Limousin and Aberdeen Angus breeds. Meat Science, 74, 522–531.
Devlin D J, Gault N F S, Moss B W, Tolland E, Tollerton J, Farmer L J, Gordon A W. 2017. Factors affecting eating quality of beef. Advances in Animal Bioscience, 8, s1, s2–s5.
Doljanin I A. 2013. Aligning price signals throughout the beef value chain to reflect consumer preferences by assigning economic weights to the Meat Standards Australia (MSA) model inputs. MSc thesis, Wasters Research University of New England, Australia.
Dunshea F R, D’Souza D N, Pethick D W, Harper G S,Warner R D. 2005. Effects of dietary factors and other metabolic modifiers on quality and nutritional value of meat. Meat
Science, 71, 8–38.Frank D C, Geesink G, Alvarenga T I R C, Polkinghorne R J,
Stark J, Lee M, Warner R. 2017. Impact of high oxygen and vacuum retail ready packaging formats on lamb loin and topside eating quality. Meat Science, 123, 126–133.
Gardner G E, McGilchrist P, Pethick D W. 2014. Ruminant glycogen metabolism. Animal Production Science, 54, 1575–1583.
Griffith G R, Thompson J M. 2012. The aggregate economic benefits to the Australian beef industry from the adoption of meat standards Australia: Updated to 2010/11. Australasian Agribusiness Review, 20, 11–38.
Grunert K G, Bredahl L, Brunso K. 2004. Consumer perception of meat quality and implications for product development in the meat sector - A review. Meat Science, 66, 259–272.
Henchion M, McCarthy M, Resconi V C, Troy D. 2014. Meat consumption: Trends and quality matters. Meat Science, 98, 561–568.
Hocquette J F, Legrand I, Jurie C, Pethick D W, Micol D. 2011. Perception in France of the Australian system for the prediction of beef quality (Meat Standards Australia) with perspectives for the European beef sector. Animal Production Science, 51, 30–36.
Hocquette J F, Van Wezemael L, Chriki S, Legrand I, Verbeke W, Farmer L, Scollan N D, Polkinghorne R, Rodbotten R, Allen P, Pethick D W. 2014. Modelling of beef sensory quality for a better prediction of palatability. Meat Science, 97, 316–322.
Jurie C, Picard B, Hocquette J F, Dransfield E, Micol D, Listrat A. 2007. Muscle and meat quality characteristics of Holstein and Salers cull cows. Meat Science, 77, 459–466.
Legrand I, Hocquette J F, Polkinghorne R J, Pethick D W. 2013. Prediction of beef eating quality in France using the Meat Standards Australia system. Animal, 7, 524–529.
Legrand I, Hocquette J F, Polkinghorne R J, Wierzbicki J. 2017. How to predict beef eating quality in Europe through the adaptation of the Australian system MSA? Innovations Agronomiques, 55, 171–182. (in French)
Lizaso G, Beriain M J, Horcada A, Chasco J, Purroy A. 2011. Effect of intended purpose (dairy/beef production) on beef quality. Canadian Journal of Animal Science, 91, 97–102.
McCarthy S N, Henchion M, White A, Brandon K, Allen P. 2017. Evaluation of beef eating quality by Irish consumers. Meat Science, 132, 118–124.
Meat and Livestock Australia. 2011. Meat Standards Australia beef information kit. [2018-4-28]. https://www.mla.com.au/globalassets/mla-corporate/marketing-beef-and-lamb/documents/meat-standards-australia/tt_whole-set.pdf
Meat and Livestock Australia. 2016a. Impact assessment of MLA expenditure 2010-11 to 2015-2015, Economic quantification of benefits. Center for International Economics Sydney, Australia.
Meat and Livestock Australia. 2016b. MSA delivers $185 million boost to livestock sector. Meat Standards Australia, Sydney, Australia.
Meat and Livestock Australia. 2017. Meat and livestock

1653Sarah P. F. Bonny et al. Journal of Integrative Agriculture 2018, 17(7): 1641–1654
Australia. Meat Standards Australia. [2017-11-02]. https://www.mla.com.au/marketing-beef-and-lamb/meat-standards-australia/
Morales L E, Hoang N, Stuen E. 2017. Spatial price premium transmission for Meat Standards Australia-graded cattle: The vulnerability of price premiums to outside shocks. Australian Journal of Agricultural and Resource Economics, 61, 590–609.
Morgan J B, Savell J W, Hale D S, Miller R K, Griffin D B, Cross H R, Shackelford S D. 1991. National beef tenderness survey. Journal of Animal Science, 69, 3274–3283.
Mortimer S I, van der Werf J H J, Jacob R H, Hopkins D L, Pannier L, Pearce K L, Gardner G E, Warner R D, Geesink G H, Edwards J E H, Ponnampalam E N, Ball A J, Gilmour A R, Pethick D W. 2014. Genetic parameters for meat quality traits of Australian lamb meat. Meat Science, 96, 1016–1024.
O’Reilly R A, Pannier L, Gardner G E, Pethick D W. 2016. Sensory evaluation of Australian lamb and yearling, a comparison of Australian, American and Chinese consumers. In: Proceedings of the 7th European Conference on Sensory and Consumer Research. Dijon, France.
Pannier L, Gardner G E, Pearce K L, McDonagh M, Ball A J, Jacob R H,Pethick D W. 2014a. Associations of sire estimated breeding values and objective meat quality measurements with sensory scores in Australian lamb. Meat Science, 96, 1076–1087.
Pannier L, Pethick D W, Geesink G H, Ball A J, Jacob R H, Gardner G E. 2014b. Intramuscular fat in the longissimus muscle is reduced in lambs from sires selected for leanness. Meat Science, 96, 1068–1075.
Pethick D W, Ball A J, Banks R G, Hocquette J F. 2011. Current and future issues facing red meat quality in a competitive market and how to manage continuous improvement. Animal Production Science, 51, 13–18.
Pethick D W, Banks R G, Hales J, Ross I R. 2006. Australian prime lamb - A vision for 2020. International Journal of Sheep and Wool Science, 54, 66–73.
Pethick D W, Hopkins D L, D’Souza D N, Thompson J M, Walker P J. 2005. Effects of animal age on the eating quality of sheep meat. Australian Journal of Experimental Agriculture, 45, 491–498.
Pethick D W, McGilchrist P, Polkinghorne R J, Warner R, Tarr G, Garmyn A, Thompson J, Hocquette J F. 2018. International research on beef and lamb eating quality. Viandes et Produits Carnés, VPC-2018-34-1-2. [2018-4-28]. https://www.viandesetproduitscarnes.fr/index.php/fr/894-travaux-de-recherche-internationaux-sur-la-qualite-sensorielle-de-la-viande-ovine-et-bovine
Pleasants A B, Thompson J M,Pethick D W. 2005. A model relating a function of tenderness, juiciness, flavour and overall liking to the eating quality of sheep meat. Australian Journal of Experimental Agriculture, 45, 483–489.
Polkinghorne R, Philpott J, Gee A, Doljanin A, Innes J. 2008a. Development of a commercial system to apply the Meat Standards Australia grading model to optimise the return
on eating quality in a beef supply chain. Australian Journal of Experimental Agriculture, 48, 1451–1458.
Polkinghorne R, Thompson J M, Watson R, Gee A, Porter M. 2008b. Evolution of the Meat Standards Australia (MSA) beef grading system. Australian Journal of Experimental Agriculture, 48, 1351–1359.
Polkinghorne R, Thompson J M, Hocquette J F, Pethick D W. 2015. Overview of Meat Standards Australia and cuts based grading. Meat Research, 29, 43–48.
Polkinghorne R J, Nishimura T, Neath K E, Watson R. 2011. Japanese consumer categorisation of beef into quality grades, based on Meat Standards Australia methodology. Animal Science Journal, 82, 325–333.
Polkinghorne R J, Nishimura T, Neath K E, Watson R. 2014. A comparison of Japanese and Australian consumers’ sensory perceptions of beef. Animal Science Journal, 85, 69–74.
Polkinghorne R J, Thompson J M. 2010. Meat standards and grading. Meat Science, 86, 227–235.
Robinson D L, Cafe L M, McIntyre B L, Geesink G H, Barendse W, Pethick D W, Thompson J M, Polkinghorne R, Greenwood P L. 2012. Production and processing studies on calpain-system gene markers for beef tenderness: Consumer assessments of eating quality. Journal of Animal Science, 90, 2850–2860.
Russell B C, McAlister G, Ross I S, Pethick D W. 2005. Lamb and sheep meat eating quality - industry and scientific issues and the need for integrated research. Australian Journal of Experimental Agriculture, 45, 465–467.
Seideman S C, Cross H R, Crouse J D. 1989. Carcass characteristics, sensory properties and mineral content of meat from bulls and steers. Journal of Food Quality, 11, 497–507.
Smith G C, Tatum J D, Belk K E. 2008. International perspective: Characterisation of United States Department of Agriculture and Meat Standards Australia systems for assessing beef quality. Australian Journal of Experimental Agriculture, 48, 1465–1480.
Thompson J, Polkinghorne R, Gee A, Motiang D, Strydom P, Mashau M, Ng’ambi J, deKock R, Burrow H. 2010. Beef Palatability in the Republic of South Africa: Implications for Niche-Marketing Strategies. ACIAR Technical Reports. Australian Centre for International Agricultural Research ACIAR, Canberra, ACT, Australia. 72, pp. 1–56.
Thompson J M. 2002. Managing meat tenderness. Meat Science, 62, 295–308.
Thompson J M, Gee A, Hopkins D L, Pethick D W, Baud S R, O’Halloran W J. 2005a. Development of a sensory protocol for testing palatability of sheep meats. Australian Journal of Experimental Agriculture, 45, 469–476.
Thompson J M, McIntyre BM, Tudor G D, Pethick D W, Polkinghorne R, Watson R. 2008a. Effects of hormonal growth promotants (HGP) on growth, carcass characteristics, the palatability of different muscles in the beef carcass and their interaction with aging. Australian Journal of Experimental Agriculture, 48, 1405–1414.
1654 Sarah P. F. Bonny et al. Journal of Integrative Agriculture 2018, 17(7): 1641–1654
Thompson J M, Pleasants A B, Pethick D W. 2005b. The effect of design and demographic factors on consumer sensory scores. Australian Journal of Experimental Agriculture, 45, 477–482.
Thompson J M, Polkinghorne R, Hwang I H, Gee A M, Cho S H, Park B Y, Lee J M. 2008b. Beef quality grades as determined by Korean and Australian consumers. Australian Journal of Experimental Agriculture, 48, 1380–1386.
Tighe K, Cacho O, Mounter S, Villano R, Ball A, Pethick D, Fleming E. 2017. Determinants of consumer willingness to pay for quality-graded Australian sheep meat. Animal Production Science, http://dx.doi.org/10.1071/AN15873
Watson R, Gee A, Polkinghorne R, Porter M. 2008a. Consumer assessment of eating quality - development of protocols for Meat Standards Australia (MSA) testing. Australian Journal of Experimental Agriculture, 48, 1360–1367.
Watson R, Polkinghorne R, Thompson J M. 2008b. Development of the Meat Standards Australia (MSA) prediction model for beef palatability. Australian Journal of Experimental Agriculture, 48, 1368–1379.
Young O A, Hopkins D L, Pethick D W. 2005. Critical control points for meat quality in the Australian sheep meat supply chain. Australian Journal of Experimental Agriculture, 45, 593–601.
Section editor LUO Xu-gangManaging editor ZHANG Juan