Embed Size (px)
Citation preview
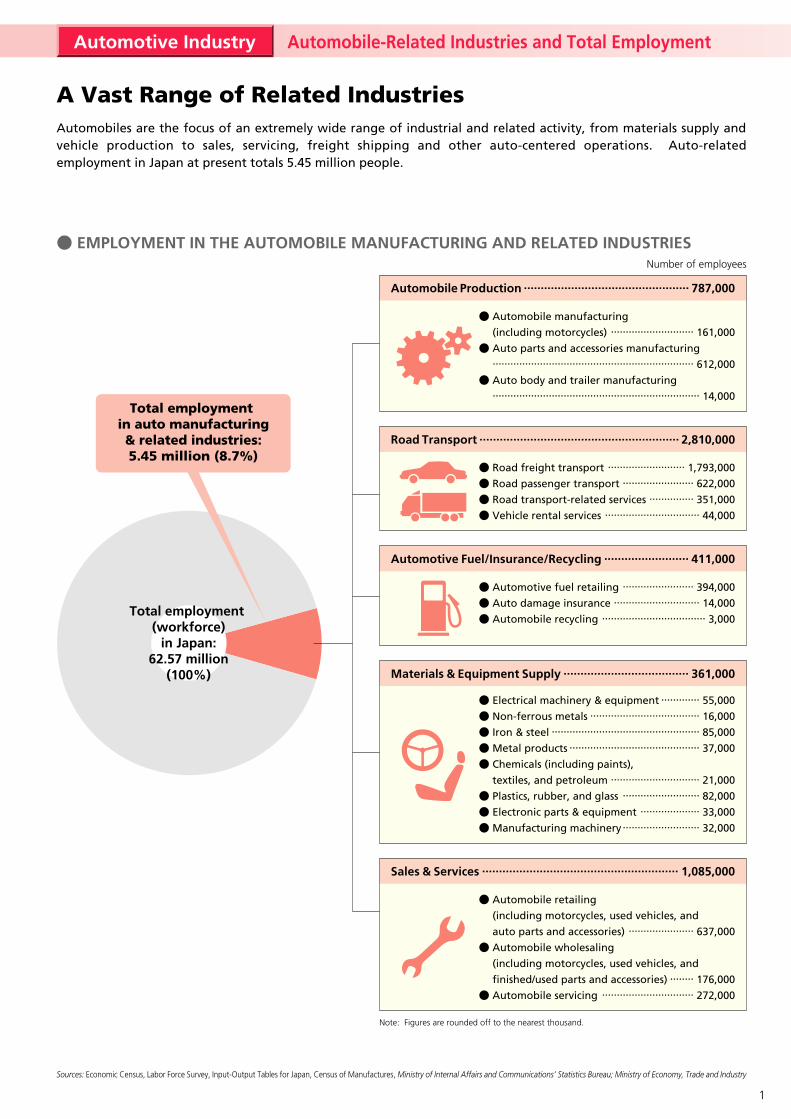
Sources: Economic Census, Labor Force Survey, Input-Output Tables for Japan, Census of Manufactures, Ministry of Internal Affairs and Communications’ Statistics Bureau; Ministry of Economy, Trade and Industry
Note: Figures are rounded off to the nearest thousand.
● EMPLOYMENT IN THE AUTOMOBILE MANUFACTURING AND RELATED INDUSTRIES
Total employment in auto manufacturing& related industries:5.45 million (8.7%)
Total employment (workforce)
in Japan:62.57 million
(100%)
........................ 394,000............................. 14,000
................................... 3,000
............................ 161,000
.................................................................... 612,000
...................................................................... 14,000
● Automobile manufacturing (including motorcycles) ● Auto parts and accessories manufacturing
● Auto body and trailer manufacturing
Automobile Production ................................................. 787,000
● Automotive fuel retailing ● Auto damage insurance ● Automobile recycling
Automotive Fuel/Insurance/Recycling ......................... 411,000
Road Transport ........................................................... 2,810,000
Materials & Equipment Supply ..................................... 361,000
Sales & Services .......................................................... 1,085,000
.......................... 1,793,000........................ 622,000
............... 351,000................................ 44,000
...................... 637,000
........ 176,000............................... 272,000
● Automobile retailing (including motorcycles, used vehicles, and auto parts and accessories) ● Automobile wholesaling (including motorcycles, used vehicles, and finished/used parts and accessories)● Automobile servicing
● Road freight transport ● Road passenger transport ● Road transport-related services ● Vehicle rental services
● Electrical machinery & equipment ● Non-ferrous metals ● Iron & steel ● Metal products● Chemicals (including paints), textiles, and petroleum ● Plastics, rubber, and glass ● Electronic parts & equipment● Manufacturing machinery
............. 55,000..................................... 16,000
.................................................. 85,000............................................ 37,000
.............................. 21,000.......................... 82,000
.................... 33,000.......................... 32,000
Number of employees
A Vast Range of Related IndustriesAutomobiles are the focus of an extremely wide range of industrial and related activity, from materials supply and vehicle production to sales, servicing, freight shipping and other auto-centered operations. Auto-related employment in Japan at present totals 5.45 million people.
Automobile-Related Industries and Total EmploymentAutomotive Industry
1

Automobile Manufacturing Is an Integrated IndustryAn automobile typically is composed of 20,000 to 30,000 parts, all of which even the largest manufacturers cannot produce themselves. Automakers therefore either outsource production or purchase finished products (such as tires, batteries, air conditioners and audio systems), including products manufactured abroad. The volume of imported components increases yearly. Automobile manufacturing is thus an integrated industry because it relies on many supporting industries to produce the great diversity of materials and components it uses. Trends in the automobile industry, which makes huge investments in equipment and research-and-development activities, are considered a barometer of the economy.
● PRINCIPAL MATERIALS AND COMPONENTS USED IN AUTOMOBILE MANUFACTURING
● INVESTMENTS IN EQUIPMENT OF MAJOR MANUFACTURING SECTORS (PROJECTED, FY 2011)
● INVESTMENTS IN R&D OF MAJOR MANUFACTURING SECTORS (FY 2010)
Cast iron
Common steel
Special steel
Copper
Lead, tin, zinc
Aluminum
Noble metals
Other non-ferrous metals
Synthetic resin
Glass
Rubber
Ceramics
Textiles
Leather
Paper
Wood
Paints
Chemicals
Animal and vegetable oils
Fats and oils
Other5,223
(13.2%)
Non-FerrousMetals
2,614 (6.6%)Automotive
5,051(12.8%)
ElectronicEquipment
6,474(16.4%)
Electronic Circuits,Parts & Equipment
5,191 (4.9%)
Petroleum789 (2.0%)
Pharmaceuticals12,760 (12.2%)
Chemicals5,672
(14.3%)
Pulp & Paper1,235 (3.1%)
General Machinery3,895 (9.8%)
AllManufacturing
Sectors39,587(100%)
Other10,556(10.1%)
TransportEquipment
21,213 (20.3%)
IT & TelecommunicationsEquipment
17,293 (16.5%)
Chemicals7,439(7.1%)
Iron & Steel1,511 (1.4%)
Electrical Machinery& Equipment9,922 (9.5%) All
ManufacturingSectors104,657(100%)
Source: Survey on Corporate Finance, Ministry of Economy, Trade and Industry Source: Survey on Research Activities in Science and Technology, Ministry of Internal Affairs and Communications
x 100 million yen x 100 million yen
Engine parts, e.g. cylinder blocks
Chassis, frames, wheel parts
Gears, axle shafts, crankshafts, fuel injection equipment
Electricals, radiators, cables
Engine metals, solder, body varnish, batteries
Engine parts (e.g. pistons, cylinder heads), wheels, chassis
Emissions after-treatment parts
Magnets, plating
Steering wheels, bumpers, radiator grilles, body components
Window glass, mirrors, headlamps
Tires, sealing parts, vibration control parts
Plugs, electronic parts, sensors, emissions after-treatment parts
Seats, linings, seatbelts
Seats, packing
Filters
Load-carrying platforms, interior equipment
Ornamental and rustproof paints
Antifreeze, engine oil, transmission oil, brake oil
For casting
For lubrication, heat treatment, etc.
Sensors, ECUs, actuators
For casting
Fuel, heat treatment, paint drying, power generation
Investment in Materials and EquipmentAutomotive Industry
Springs, dampers
Turbochargers
Bearings
Machined parts, e.g. pumps
Tires and tubes
Batteries
Window glass
Onboard tools, e.g. jacks
Supplies, e.g. extinguishers, tire chains
Electronic parts
Lights, cables, optical fibers
Air conditioners, air cleaners
Starters, alternators, generators, inverters, meters
Audio systems, phones, navigation systems
Safety equipment, e.g. anti-lock brakes, airbags, traction control
Coke
Petroleum, electricity, natural gas
General Machinery& Equipment
16,397 (15.7%)
Iron & Steel5,597
(14.1%)
Automotive20,613(19.7%)
ElectricalMachinery
& Equipment3,037(7.7%)
Foods2,375 (2.3%)
2
Machinery Industries
Chemicals Iron &Steel
Non-FerrousMetals
MetalProducts
GeneralMachinery
ElectricalMachinery
&Equipment
Transport Equipment
Automotive
Subtotal Other Total
Automotive Shipments
Year
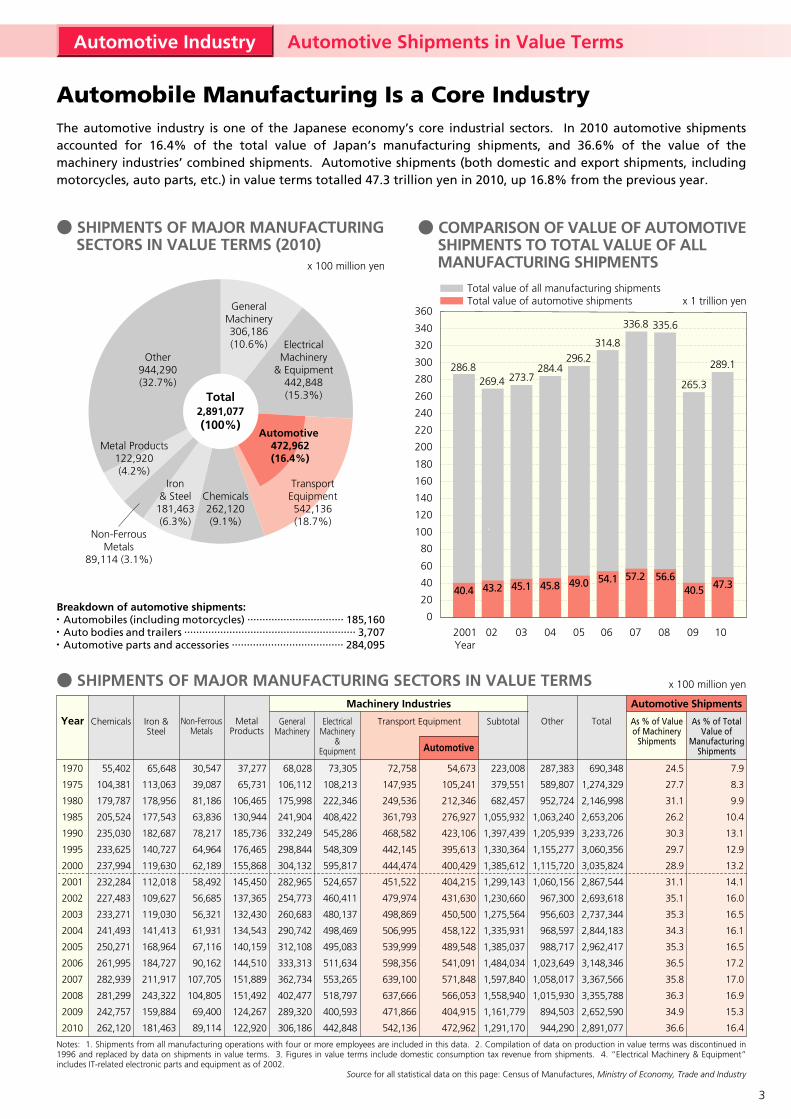
● COMPARISON OF VALUE OF AUTOMOTIVE SHIPMENTS TO TOTAL VALUE OF ALL MANUFACTURING SHIPMENTS
Notes: 1. Shipments from all manufacturing operations with four or more employees are included in this data. 2. Compilation of data on production in value terms was discontinued in 1996 and replaced by data on shipments in value terms. 3. Figures in value terms include domestic consumption tax revenue from shipments. 4. “Electrical Machinery & Equipment” includes IT-related electronic parts and equipment as of 2002.
Source for all statistical data on this page: Census of Manufactures, Ministry of Economy, Trade and Industry
TransportEquipment542,136(18.7%)
Chemicals262,120(9.1%)
Iron& Steel
181,463(6.3%)
ElectricalMachinery
& Equipment442,848(15.3%)
GeneralMachinery306,186(10.6%)
Metal Products122,920(4.2%)
Other944,290(32.7%)
● SHIPMENTS OF MAJOR MANUFACTURING SECTORS IN VALUE TERMS (2010)
Total2,891,077(100%)
Automotive 472,962(16.4%)
Breakdown of automotive shipments: Automobiles (including motorcycles) ................................ 185,160 Auto bodies and trailers ......................................................... 3,707 Automotive parts and accessories ..................................... 284,095
x 100 million yen
As % of Value of Machinery
Shipments
As % of Total Value of
Manufacturing Shipments
x 100 million yen
06 07 08 09 1004 0502 032001Year
286.8
40.4 43.2 45.1
0
20
40
60
80
100
120
140
160
180
200
220
240
260
280
300
320
340
360
Total value of all manufacturing shipmentsTotal value of automotive shipments x 1 trillion yen
269.4
● SHIPMENTS OF MAJOR MANUFACTURING SECTORS IN VALUE TERMS
1970
1975
1980
1985
1990
1995
2000
2001
2002
2003
2004
2005
2006
2007
2008
2009
2010
55,402
104,381
179,787
205,524
235,030
233,625
237,994
232,284
227,483
233,271
241,493
250,271
261,995
282,939
281,299
242,757
262,120
65,648
113,063
178,956
177,543
182,687
140,727
119,630
112,018
109,627
119,030
141,413
168,964
184,727
211,917
243,322
159,884
181,463
30,547
39,087
81,186
63,836
78,217
64,964
62,189
58,492
56,685
56,321
61,931
67,116
90,162
107,705
104,805
69,400
89,114
37,277
65,731
106,465
130,944
185,736
176,465
155,868
145,450
137,365
132,430
134,543
140,159
144,510
151,889
151,492
124,267
122,920
68,028
106,112
175,998
241,904
332,249
298,844
304,132
282,965
254,773
260,683
290,742
312,108
333,313
362,734
402,477
289,320
306,186
73,305
108,213
222,346
408,422
545,286
548,309
595,817
524,657
460,411
480,137
498,469
495,083
511,634
553,265
518,797
400,593
442,848
72,758
147,935
249,536
361,793
468,582
442,145
444,474
451,522
479,974
498,869
506,995
539,999
598,356
639,100
637,666
471,866
542,136
54,673
105,241
212,346
276,927
423,106
395,613
400,429
404,215
431,630
450,500
458,122
489,548
541,091
571,848
566,053
404,915
472,962
223,008
379,551
682,457
1,055,932
1,397,439
1,330,364
1,385,612
1,299,143
1,230,660
1,275,564
1,335,931
1,385,037
1,484,034
1,597,840
1,558,940
1,161,779
1,291,170
287,383
589,807
952,724
1,063,240
1,205,939
1,155,277
1,115,720
1,060,156
967,300
956,603
968,597
988,717
1,023,649
1,058,017
1,015,930
894,503
944,290
690,348
1,274,329
2,146,998
2,653,206
3,233,726
3,060,356
3,035,824
2,867,544
2,693,618
2,737,344
2,844,183
2,962,417
3,148,346
3,367,566
3,355,788
2,652,590
2,891,077
24.5
27.7
31.1
26.2
30.3
29.7
28.9
31.1
35.1
35.3
34.3
35.3
36.5
35.8
36.3
34.9
36.6
7.9
8.3
9.9
10.4
13.1
12.9
13.2
14.1
16.0
16.5
16.1
16.5
17.2
17.0
16.9
15.3
16.4
273.7284.4
296.2
45.8 49.0
314.8
336.8
54.1
335.6
56.6
265.3
40.5
289.1
47.357.2
Automobile Manufacturing Is a Core IndustryThe automotive industry is one of the Japanese economy’s core industrial sectors. In 2010 automotive shipments accounted for 16.4% of the total value of Japan’s manufacturing shipments, and 36.6% of the value of the machinery industries’ combined shipments. Automotive shipments (both domestic and export shipments, including motorcycles, auto parts, etc.) in value terms totalled 47.3 trillion yen in 2010, up 16.8% from the previous year.
Automotive Shipments in Value TermsAutomotive Industry
Non-FerrousMetals
89,114 (3.1%)
3

2002200320042005200620072008200920102011
Passenger Cars, Trucks, Buses Auto Parts Motorcycles &
Motorcycle PartsChg. (%)
115,675118,363124,773135,132161,795185,267175,12693,679
125,956115,417
118.3102.3105.4108.3119.7114.594.553.5
134.591.6
87,74688,95092,14299,288
122,995143,170137,36166,93391,74182,042
21,17222,99825,61728,00630,22733,55530,65523,08930,83329,972
6,7576,4157,0147,8398,5738,5437,1103,6573,3823,403
521,090545,484611,700656,565752,462839,314810,181541,706673,996655,465
Exports TotalMotor Vehicles
106.4104.7112.1107.3114.6111.596.566.9
124.497.3
Chg. (%)Year
Notes: 1. Motor vehicles include passenger cars, trucks, buses, and chassis. 2. “FOB” = free on board; “CIF” = cost, insurance, and freight. 3. “Chg. (%)” means change from the previous year (with the previous year’s result indexed at 100).
● AUTOMOTIVE EXPORTS IN VALUE TERMS (FOB)
2002200320042005200620072008200920102011
Passenger Cars,Trucks, Buses Auto PartsChg. (%)
11,23411,79912,84213,35314,41215,58614,1608,245
10,83612,069
108.1105.0108.8104.0107.9108.190.958.2
131.4111.4
8,0388,2799,0559,1499,1639,2947,4994,5495,9577,352
3,1963,5203,7874,2045,2496,2916,6623,6964,8794,717
422,275443,620492,166569,494673,443731,359789,548514,994607,650681,112
Imports TotalMotor Vehicles
99.6105.1110.9115.7118.3108.6108.065.2
118.0112.1
Chg. (%)Year
● AUTOMOTIVE IMPORTS IN VALUE TERMS (CIF)
Source for all statistical data on this page: The Summary Report on Trade of Japan, Ministry of Finance
Note: “Chg. (%)” means change from the previous year (with the previous year’s result indexed at 100).
x 100 million yen
x 100 million yen
Motor Vehicles (excluding motorcycles and parts)
121 (1.8%)
● IMPORTS BY PRINCIPAL COMMODITY (CIF) IN 2011
Mineral Fuels2,182 (32.0%)
Transport Equipment174 (2.6%)
Chemicals610
(9.0%)
RawMaterials
527 (7.7%)
Petroleum& Petroleum
Products1,364 (20.0%)
Other1,174 (17.2%)
Total6,811
(100%)General
Machinery497 (7.3%)
ElectricalMachinery
& Equipment799 (11.7%)
Foodstuffs585 (8.6%)
Non-FerrousMetals &
Metal Products263 (3.9%)
x 10 billion yen
Motor Vehicle Exports Show a DecreaseJapan’s gross exports in 2011 decreased by 2.7% from the previous year, while gross imports rose by 12.1%. In value terms, automotive exports dropped 8.4% from 2010 to 11.5 trillion yen, with motorcycle exports rising but motor vehicle and parts exports falling. On the other hand, automotive imports increased, by 11.4% year-on-year to 1.2 trillion yen, with motor vehicle imports showing growth but auto parts imports showing a slight decline.
Automotive TradeAutomotive Industry
GeneralMachinery
1,380 (21.0%)
Transport Equipment1,403 (21.4%)
Motor Vehicles(including motorcycles
and parts)1,154 (17.6%)
Scientific &Optical Equipment
211 (3.2%)
Chemicals680 (10.4%)
Non-FerrousMetals &
Metal Products229 (3.5%)
Iron & SteelProducts
371 (5.7%)
ElectricalMachinery
& Equipment1,160 (17.7%)
Ships205 (3.1%)
Textile Yarn & Textiles63 (1.0%)
Other853
(13.0%)
● EXPORTS BY PRINCIPAL COMMODITY (FOB) IN 2011
Total6,555
(100%)
x 10 billion yen
4

● MOTOR VEHICLE PRODUCTION
Passenger Cars7,158,525(85.2%)
Buses104,109(1.3%)
Standard512,335(6.1%)
Small234,586(2.8%)
Small1,861,279(22.1%)
Standard4,180,361(49.8%)
● MOTOR VEHICLE PRODUCTION BY TYPE IN 2011
● TRENDS IN MOTOR VEHICLE PRODUCTION
Mini1,116,885(13.3%)
Mini389,150(4.6%)
Total8,398,705
(100%)
19701975198019851990199520002002200320042005200620072008200920102011
Passenger Cars TrucksSmallStandard
Standard Small
749,450160,272195,923160,592835,965916,201
1,283,0941,309,8301,290,2201,366,6751,408,7531,537,2101,441,4411,427,3971,257,2931,304,8321,116,885
Mini
3,178,7084,567,8547,038,1087,646,8169,947,9727,610,5338,359,4348,618,3548,478,3288,720,3859,016,7359,754,9039,944,6379,928,1436,862,1618,310,3627,158,525
Total
121.7116.2114.0108.1109.997.5
103.2106.2 98.4102.9103.4108.2101.999.869.1
121.186.1
Chg. (%)52,04784,304
457,208842,792635,255232,514153,280157,225157,420127,529106,53096,083
125,262121,44383,44275,01658,951
Gasoline206,053203,866427,990435,420614,270591,626495,900522,739
615,307642,424617,133603,327593,639613,480288,244445,656453,384
Diesel258,100288,170885,198
1,278,2121,249,525
824,140649,180679,964772,727769,953723,663699,410718,901734,923371,686520,672512,335
Subtotal1,156,7291,441,7591,663,8341,218,423
517,972304,495204,253198,002250,019261,902233,694213,687177,425163,237127,004133,043135,335
Gasoline97,132
168,716449,477659,470744,971604,826279,029182,301 199,443184,634203,069205,717188,107166,52188,135
105,73399,251
DieselYear
In vehicle units x 1 million units
2002Year
03 04 05 06 07 08 09 10 11
0
2
4
6
8
10
12
14
Passenger Cars
Total
Trucks & Buses
Trucks1,136,071(13.5%)
Notes: 1. Passenger cars are classified under Japan’s Road Vehicles Act in three categories, based primarily on engine capacity: “standard” (over 2,000cc), “small” (661cc-2,000cc), and been treated as components since 1988. 3. “Chg. (%)” means change from the previous year (with the previous year’s result indexed at 100).
Motor Vehicles Production
Motor Vehicle Production Declines for First Time in 2 YearsIn 2011 motor vehicle production in Japan decreased for the first time in two years, totalling 8.40 million units, down 12.8% from the previous year. Passenger car production fell 13.9% to a total of 7.16 million units. Within that category, standard car production dropped 13.7% to 4.18 million units, small car production slipped 13.8% to 1.86 million units, and minicar production dipped 14.4% to 1.12 million units. Truck and bus production also showed a decline from 2011, shrinking 6.0% to 1.14 million units and 4.8% to 104,000 units, respectively.
51,619209,032403,338494,792
1,750,7832,553,7033,376,4473,671,0233,753,4464,044,5634,191,3604,915,4285,864,3545,786,3333,459,5894,846,4114,180,361
2,377,6394,198,5506,438,8476,991,4327,361,2244,140,6293,699,8933,637,501 3,434,6623,309,1473,416,6223,302,2652,638,8422,714,4132,145,2792,159,1191,861,279
5
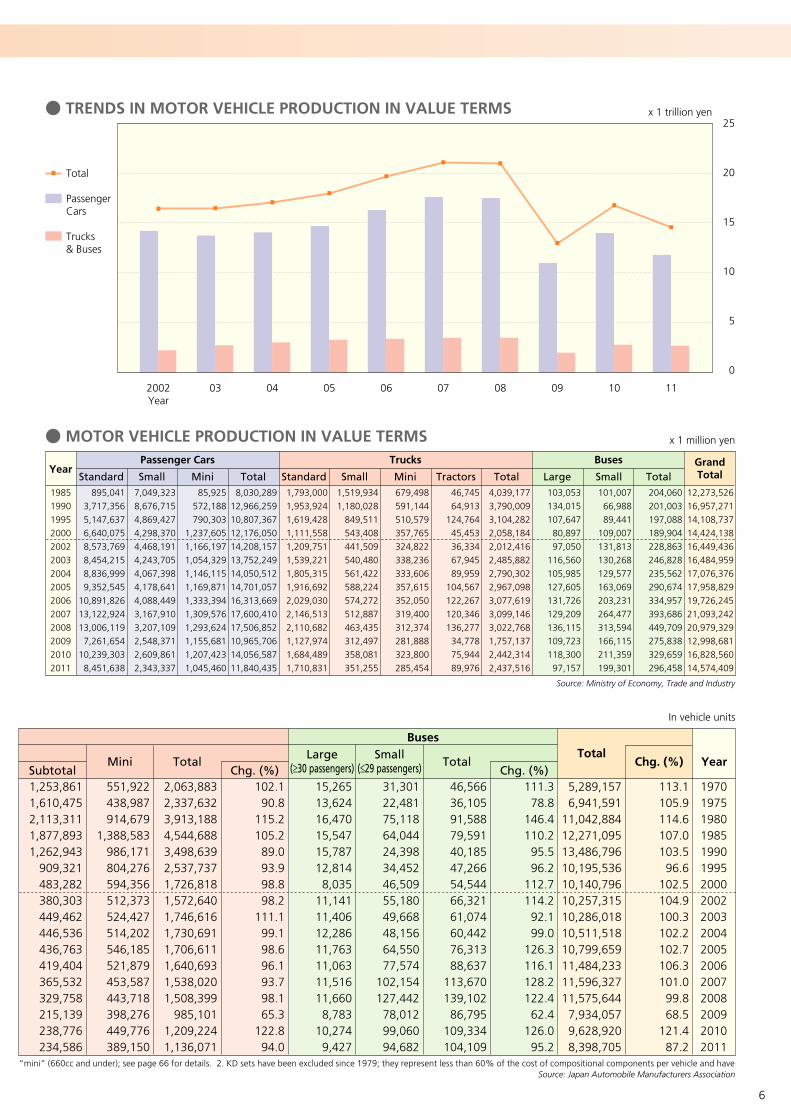
● TRENDS IN MOTOR VEHICLE PRODUCTION IN VALUE TERMS
In vehicle units
Source: Japan Automobile Manufacturers Association
Source: Ministry of Economy, Trade and Industry
19851990199520002002200320042005200620072008200920102011
Standard Small Mini Total Standard Small Mini Tractors Total Large Small TotalGrand Total
Trucks BusesPassenger CarsYear
2002Year
03 04 05 06 07 08 09 10 11
25
20
15
10
5
0
x 1 million yen
x 1 trillion yen
Subtotal1,253,8611,610,4752,113,3111,877,8931,262,943
909,321483,282380,303449,462446,536436,763419,404365,532329,758215,139238,776234,586
551,922438,987914,679
1,388,583986,171804,276594,356512,373524,427514,202546,185521,879453,587443,718398,276449,776389,150
Mini
2,063,8832,337,6323,913,1884,544,6883,498,6392,537,7371,726,8181,572,6401,746,6161,730,6911,706,6111,640,6931,538,0201,508,399
985,1011,209,2241,136,071
Total
102.190.8
115.2105.289.093.998.898.2
111.199.198.696.193.798.165.3
122.894.0
15,26513,62416,47015,54715,78712,8148,035
11,14111,40612,28611,76311,06311,51611,6608,783
10,2749,427
Large(≥30 passengers)
Small(≤29 passengers)
31,30122,48175,11864,04424,39834,45246,50955,180
49,66848,15664,55077,574
102,154127,44278,01299,06094,682
46,56636,10591,58879,59140,18547,26654,54466,321
61,07460,44276,31388,637
113,670139,10286,795
109,334104,109
Total
111.378.8
146.4110.295.596.2
112.7114.2 92.199.0
126.3116.1128.2122.462.4
126.095.2
5,289,1576,941,591
11,042,88412,271,09513,486,79610,195,53610,140,79610,257,31510,286,01810,511,51810,799,65911,484,23311,596,32711,575,6447,934,0579,628,9208,398,705
Total
113.1105.9114.6107.0103.596.6
102.5104.9100.3102.2102.7106.3101.099.868.5
121.487.2
Chg. (%)
Buses
Year
19701975198019851990199520002002200320042005200620072008200920102011
● MOTOR VEHICLE PRODUCTION IN VALUE TERMS
Total
Passenger Cars
Trucks & Buses
Chg. (%) Chg. (%)
“mini” (660cc and under); see page 66 for details. 2. KD sets have been excluded since 1979; they represent less than 60% of the cost of compositional components per vehicle and have
895,0413,717,3565,147,6376,640,0758,573,7698,454,2158,836,9999,352,545
10,891,82613,122,92413,006,119
7,261,65410,239,303
8,451,638
7,049,3238,676,7154,869,4274,298,3704,468,1914,243,7054,067,3984,178,6414,088,4493,167,9103,207,1092,548,3712,609,8612,343,337
85,925572,188790,303
1,237,6051,166,1971,054,3291,146,1151,169,8711,333,3941,309,5761,293,6241,155,6811,207,4231,045,460
8,030,28912,966,25910,807,36712,176,05014,208,15713,752,24914,050,51214,701,05716,313,66917,600,41017,506,85210,965,70614,056,58711,840,435
1,793,0001,953,9241,619,4281,111,5581,209,7511,539,2211,805,3151,916,6922,029,0302,146,5132,110,6821,127,9741,684,4891,710,831
1,519,9341,180,028
849,511543,408441,509540,480561,422588,224574,272512,887463,435312,497358,081351,255
679,498591,144510,579357,765324,822338,236333,606357,615352,050319,400312,374281,888323,800285,454
46,74564,913
124,76445,45336,33467,94589,959
104,567122,267120,346136,27734,77875,94489,976
4,039,1773,790,0093,104,2822,058,1842,012,4162,485,8822,790,3022,967,0983,077,6193,099,1463,022,7681,757,1372,442,3142,437,516
103,053134,015107,647
80,89797,050
116,560105,985127,605131,726129,209136,115109,723118,300
97,157
101,00766,98889,441
109,007131,813130,268129,577163,069203,231264,477313,594166,115211,359199,301
204,060201,003197,088189,904228,863246,828235,562290,674334,957393,686449,709275,838329,659296,458
12,273,52616,957,27114,108,73714,424,13816,449,43616,484,95917,076,37617,958,82919,726,24521,093,24220,979,32912,998,68116,828,56014,574,409
6
168,086121,118154,472118,009193,775177,26484,62676,035
208,752186,588197,548209,283171,998146,69087,692
101,697107,290
986,673999,155
1,144,167945,484
1,449,6781,411,2961,015,313
739,502373,259361,449351,708354,870293,021249,655180,509187,642185,097
538,743431,181839,308
1,367,6851,006,456
815,265586,660518,843509,044519,067536,648516,021472,713442,914404,742441,755382,393
1,693,5021,551,4542,137,9472,431,1782,649,9092,403,8251,686,5991,334,3801,091,0551,067,1041,085,9041,080,174
937,732839,259672,943731,094674,780
95.6100.7102.2104.7
93.7104.6
99.683.4
—97.8
101.899.586.889.580.2
108.692.3
Motor Vehicles New Registrations
19701975198019851990199520002002200320042005200620072008200920102011
9,06849,12571,93173,539
467,490889,260770,220674,094
1,229,9071,358,2811,271,3491,225,8671,299,1681,250,9871,160,1751,419,9091,139,910
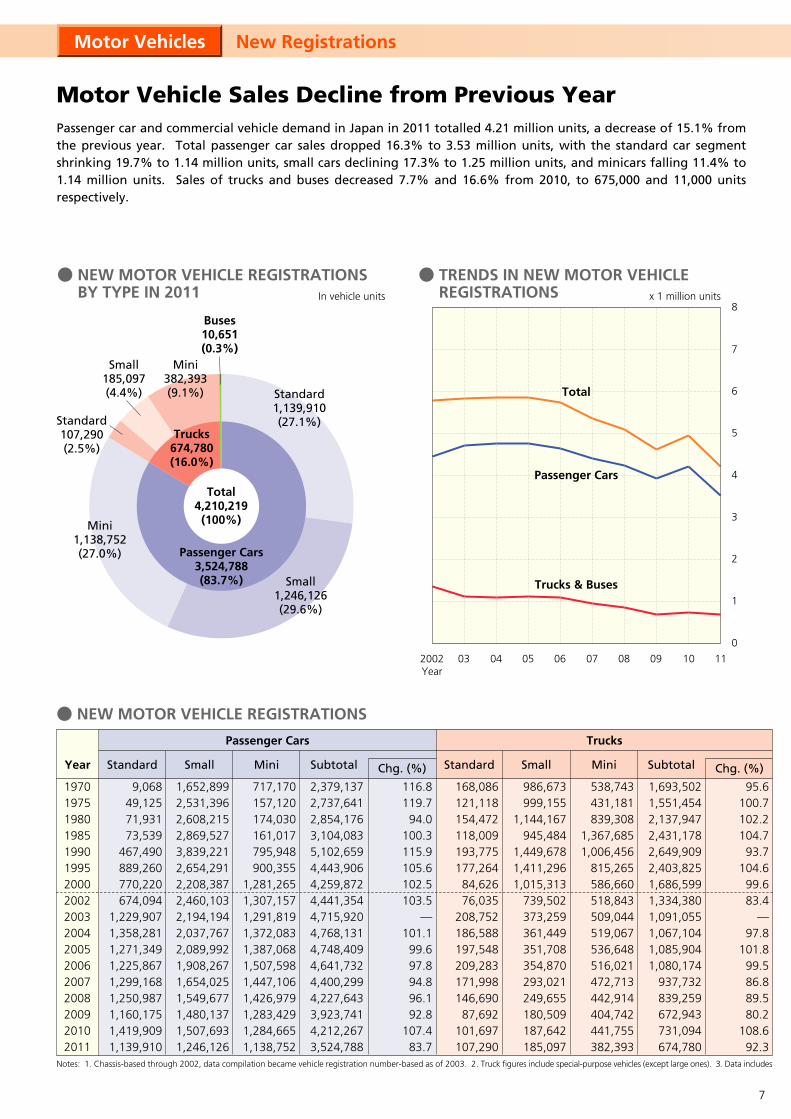
● NEW MOTOR VEHICLE REGISTRATIONS
Passenger Cars Trucks
Standard Small Mini Subtotal SubtotalMiniSmallStandardYear
Motor Vehicle Sales Decline from Previous YearPassenger car and commercial vehicle demand in Japan in 2011 totalled 4.21 million units, a decrease of 15.1% from the previous year. Total passenger car sales dropped 16.3% to 3.53 million units, with the standard car segment shrinking 19.7% to 1.14 million units, small cars declining 17.3% to 1.25 million units, and minicars falling 11.4% to 1.14 million units. Sales of trucks and buses decreased 7.7% and 16.6% from 2010, to 675,000 and 11,000 units respectively.
● TRENDS IN NEW MOTOR VEHICLE REGISTRATIONS x 1 million units
Chg. (%) Chg. (%)
2002Year
03 04 05 06 07 08 09 10 11
0
1
2
3
4
5
6
7
8
Passenger Cars
Total
Trucks & Buses
● NEW MOTOR VEHICLE REGISTRATIONS BY TYPE IN 2011
Passenger Cars3,524,788(83.7%)
Trucks674,780(16.0%)
Standard107,290(2.5%)
Small185,097(4.4%) Standard
1,139,910(27.1%)
Small1,246,126(29.6%)
Mini1,138,752(27.0%)
Mini382,393(9.1%)
Total4,210,219
(100%)
In vehicle units
Buses10,651(0.3%)
1,652,8992,531,3962,608,2152,869,5273,839,2212,654,2912,208,3872,460,1032,194,1942,037,7672,089,9921,908,2671,654,0251,549,6771,480,1371,507,6931,246,126
717,170157,120174,030161,017795,948900,355
1,281,2651,307,1571,291,8191,372,0831,387,0681,507,5981,447,1061,426,9791,283,4291,284,6651,138,752
2,379,1372,737,6412,854,1763,104,0835,102,6594,443,9064,259,8724,441,3544,715,9204,768,1314,748,4094,641,7324,400,2994,227,6433,923,7414,212,2673,524,788
116.8119.794.0
100.3115.9105.6102.5103.5
—101.199.697.894.896.192.8
107.483.7
Notes: 1. Chassis-based through 2002, data compilation became vehicle registration number-based as of 2003. 2. Truck figures include special-purpose vehicles (except large ones). 3. Data includes
7

In vehicle units
Buses
SubtotalTotal
SmallLarge Chg. (%)Total Vehicle RegistrationsChg. (%) YearChg. (%)
Total Mini- Vehicles Chg. (%)
10,2568,8189,4148,7989,1626,4754,3334,7295,8625,0985,8566,0645,1535,3574,2344,7773,136
17,57211,01813,97312,77515,76310,82812,23811,63015,34113,04911,89811,53610,4649,9768,3387,9987,515
27,82819,83623,38721,57324,92517,30316,57116,35921,20318,14717,75417,60015,61715,33312,57212,77510,651
104.287.497.5
106.4105.9
97.0114.5102.7
—85.697.899.188.798.282.0
101.683.4
106.9111.997.3
102.2107.2105.2101.798.1
100.6100.4100.098.193.394.990.7
107.584.9
104.9118.893.1
101.3107.4104.8102.797.7
101.598.499.194.692.493.590.9
110.683.3
111.782.1
118.3104.8106.3106.299.798.898.6
105.0101.7105.294.997.490.3
102.388.1
4,100,4674,308,9315,015,5105,556,8347,777,4936,865,0345,963,0425,792,0935,828,1785,853,3825,852,0675,739,5065,353,6485,082,2354,609,2564,956,1364,210,219
2,844,5543,720,6304,002,1724,028,1325,975,0895,149,4144,095,1173,966,0934,027,3153,962,2323,928,3513,715,8873,433,8293,212,3422,921,0853,229,7162,689,074
1,255,913588,301
1,013,3381,528,7021,802,4041,715,6201,867,9251,826,0001,800,8631,891,1501,923,7162,023,6191,919,8191,869,8931,688,1711,726,4201,521,145
19701975198019851990199520002002200320042005200620072008200920102011
imported cars. 4. “Chg. (%)” means change from the previous year (with the previous year’s result indexed at 100).
Source: Japan Mini Vehicles Association
● NEW MINI-VEHICLE SALES BY TYPE In vehicle units
● RECREATIONAL VEHICLE (RV) SALES In vehicle units
2002200320042005200620072008200920102011
850,219771,384669,501612,667509,936460,950454,164339,827365,565378,041
Station Wagons Vans Off-Road4WD Vehicles Minivans Total
Chg. (%)Year
10,1876,9277,3479,3639,4068,7529,3967,4338,7628,482
198,291183,435170,447179,776211,135226,159213,209157,284195,783170,304
1,123,7971,201,2701,230,7881,169,0061,126,216
980,181938,694890,265946,473748,133
2,182,4942,163,0162,078,0831,970,8121,856,6931,676,0421,615,4631,394,8091,516,5831,304,960
103.899.196.194.894.290.396.486.3
108.786.0
2002200320042005200620072008200920102011
1,307,2961,291,8891,372,0831,387,0681,507,5981,447,1061,426,9791,283,4291,284,6651,138,752
Passenger Cars (Minicars)
CommercialVehicles
(“Bonnet”minivans)
CommercialVehicles
(Cab-over-engine minivans)
CommercialVehicles
(Mini-trucks)Total
Chg. (%)Year
101,78989,53277,29777,54768,71457,50951,62242,93241,63033,023
163,412172,644183,995197,141204,838196,040185,806167,358180,505168,705
258,203250,690257,775261,960242,469219,164205,486194,452219,620180,665
1,830,7001,804,7551,891,1501,923,7162,023,6191,919,8191,869,8931,688,1711,726,4201,521,145
98.898.6
104.8101.7105.2
94.997.490.3
102.388.1
Sources: Japan Automobile Dealers Association; Japan Mini Vehicles Association
Note: “Chg. (%)” means change from the previous year (with the previous year’s result indexed at 100).
Notes: 1. Figures here through 2003 include other types of mini-vehicles not counted in the data in the bottom chart. 2. “Chg. (%)” means change from the previous year (with the previous year’s result indexed at 100).
Source: Japan Automobile Dealers Association
8
Chg. (%) Chg. (%)
198019851990199520002002200320042005200620072008200920102011
Vehicles produced by non-Japanese manufacturers
Vehicles produced by Japanesemanufacturers abroad
Passenger Cars TotalCommercial Vehicles TotalGrand TotalsChg. (%)
Vehicles produced by non-Japanese manufacturers
Passenger CarsCommercial Vehicles
Vehicles produced by Japanese manufacturers abroad
Passenger CarsCommercial Vehicles
● TRENDS IN IMPORTED MOTOR VEHICLE SALES
Source: Japan Automobile Importers Association
Passenger CarsCommercial VehiclesTotalPassenger CarsCommercial VehiclesTotal
0
100,000
200,000
300,000
400,000
Year 2002 2003 2004 2005 2006 2007 2008 2009 2010
● IMPORTED MOTOR VEHICLES (ON CUSTOMS CLEARANCE BASIS)
Note: “Chg. (%)” means change from the previous year (with the previous year’s result indexed at 100).
In vehicle units
● USED IMPORTED VEHICLE SALES In vehicle units
In vehicle units
Motor Vehicles Imported Vehicle Sales
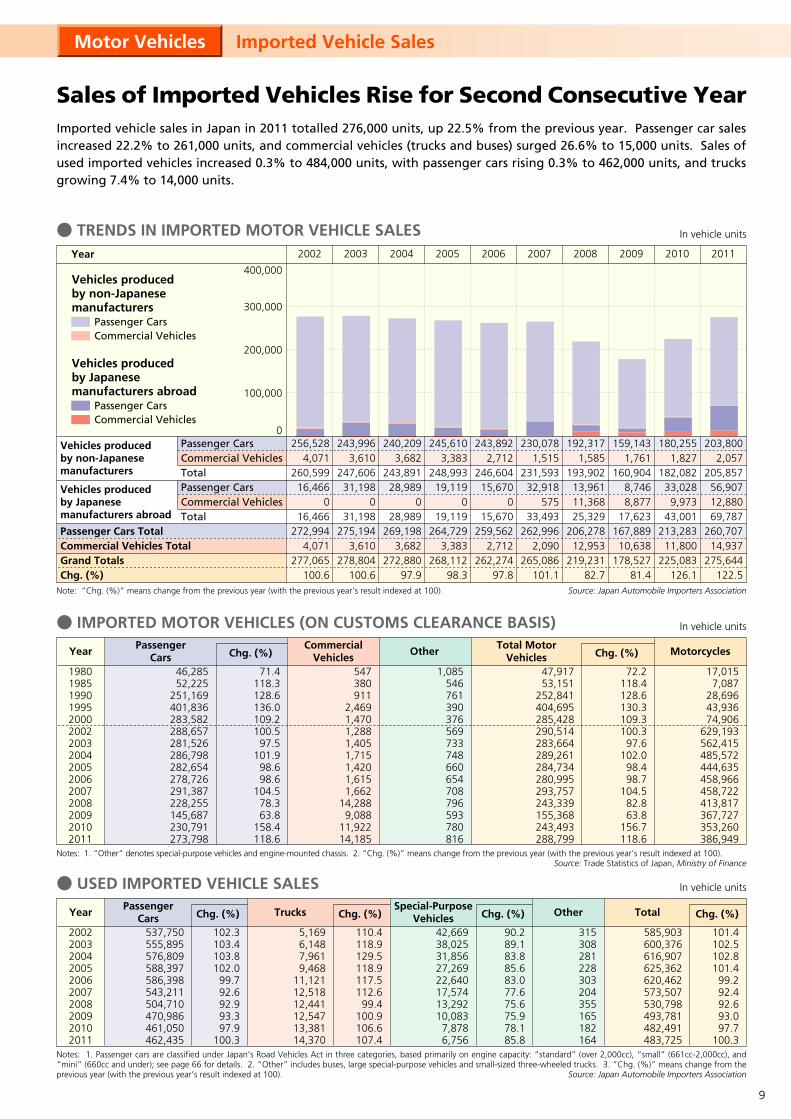
Sales of Imported Vehicles Rise for Second Consecutive YearImported vehicle sales in Japan in 2011 totalled 276,000 units, up 22.5% from the previous year. Passenger car sales increased 22.2% to 261,000 units, and commercial vehicles (trucks and buses) surged 26.6% to 15,000 units. Sales of used imported vehicles increased 0.3% to 484,000 units, with passenger cars rising 0.3% to 462,000 units, and trucks growing 7.4% to 14,000 units.
CommercialVehicles
PassengerCars
Total MotorVehicles MotorcyclesOtherYear
Chg. (%) Passenger
Cars Chg. (%) Trucks OtherChg. (%) Special-Purpose
Vehicles Chg. (%) TotalYear
42,66938,02531,85627,26922,64017,57413,29210,0837,8786,756
537,750555,895576,809588,397586,398543,211504,710470,986461,050462,435
5,1696,1487,9619,468
11,12112,51812,44112,54713,38114,370
110.4118.9129.5118.9117.5112.6
99.4100.9106.6107.4
315308281228303204355165182164
585,903600,376616,907625,362620,462573,507530,798493,781482,491483,725
102.3103.4103.8102.099.792.692.993.397.9
100.3
90.289.183.885.683.077.675.675.978.185.8
101.4102.5102.8101.499.292.492.693.097.7
100.3
2002200320042005200620072008200920102011
Notes: 1. Passenger cars are classified under Japan’s Road Vehicles Act in three categories, based primarily on engine capacity: “standard” (over 2,000cc), “small” (661cc-2,000cc), and “mini” (660cc and under); see page 66 for details. 2. “Other” includes buses, large special-purpose vehicles and small-sized three-wheeled trucks. 3. “Chg. (%)” means change from the previous year (with the previous year’s result indexed at 100).
Notes: 1. “Other” denotes special-purpose vehicles and engine-mounted chassis. 2. “Chg. (%)” means change from the previous year (with the previous year’s result indexed at 100).Source: Trade Statistics of Japan, Ministry of Finance
Source: Japan Automobile Importers Association
159,1431,761
160,9048,7468,877
17,623167,88910,638
178,52781.4
180,2551,827
182,08233,0289,973
43,001213,28311,800
225,083126.1
2011
203,8002,057
205,85756,90712,88069,787
260,70714,937
275,644122.5
256,5284,071
260,59916,466
016,466
272,9944,071
277,065100.6
243,9963,610
247,60631,198
031,198
275,1943,610
278,804100.6
240,2093,682
243,89128,989
028,989
269,1983,682
272,88097.9
245,6103,383
248,99319,119
019,119
264,7293,383
268,11298.3
243,8922,712
246,60415,670
015,670
259,5622,712
262,27497.8
230,0781,515
231,59332,918
57533,493
262,9962,090
265,086101.1
192,3171,585
193,90213,96111,36825,329
206,27812,953
219,23182.7
47,91753,151
252,841404,695285,428290,514283,664289,261284,734280,995293,757243,339155,368243,493288,799
46,28552,225
251,169401,836283,582288,657281,526286,798282,654278,726291,387228,255145,687230,791273,798
547380911
2,4691,4701,2881,4051,7151,4201,6151,662
14,2889,088
11,92214,185
1,085546761390376569733748660654708796593780816
17,0157,087
28,69643,93674,906
629,193562,415485,572444,635458,966458,722413,817367,727353,260386,949
71.4118.3128.6136.0109.2100.5
97.5101.9
98.698.6
104.578.363.8
158.4118.6
72.2118.4128.6130.3109.3100.397.6
102.098.498.7
104.582.863.8
156.7118.6
9
In vehicle units
1985
1990
1995
2000
2002
2003
2004
2005
2006
2007
2008
2009
2010
2011
160,150
304,193
994,311
1,742,786
1,861,694
1,910,017
1,984,562
2,002,563
1,959,739
1,810,596
1,728,090
1,619,370
1,592,110
1,542,614
3,295,092
3,945,086
3,845,076
3,050,087
2,744,604
2,640,456
2,524,764
2,460,410
2,304,226
2,105,122
1,944,766
1,855,071
1,816,696
1,733,519
356,726
304,782
727,259
1,448,546
1,714,827
1,809,840
1,777,866
1,890,154
2,033,569
2,022,866
1,995,333
1,864,874
1,873,466
1,906,523
3,811,968
4,554,061
5,566,646
6,241,419
6,321,125
6,360,313
6,287,192
6,353,127
6,297,534
5,938,584
5,668,189
5,339,315
5,282,272
5,182,656
100.9
106.2
106.6
104.8
100.4
100.6
98.9
101.0
99.1
94.3
95.4
94.2
98.9
98.1
139,459
185,851
221,523
201,714
206,088
220,470
225,715
240,060
244,770
220,989
225,848
194,180
177,327
168,470
589,321
555,634
521,244
412,511
374,111
379,461
363,523
368,778
365,180
302,043
278,673
266,395
245,642
233,556
1,125,545
1,746,495
1,538,718
1,169,626
1,089,079
1,062,660
972,000
980,714
1,003,607
935,745
884,836
787,957
732,854
769,613
1,854,325
2,487,980
2,281,485
1,783,851
1,669,278
1,662,591
1,561,238
1,589,552
1,613,557
1,458,777
1,389,357
1,248,532
1,155,823
1,171,639
108.3
102.1
102.2
99.1
97.5
99.6
93.9
101.8
101.5
90.4
95.2
89.9
92.6
101.4
11,655
13,377
13,327
15,173
17,064
17,392
17,240
18,871
20,643
16,418
16,193
15,293
14,163
13,849
103.1
98.3
105.4
102.7
103.6
101.9
99.1
109.5
109.4
79.5
98.6
94.4
92.6
97.8
44,620
54,118
84,409
173,475
159,825
154,971
136,242
144,910
135,130
116,317
104,516
95,452
87,238
82,007
116.7
107.3
119.1
105.2
93.9
97.0
87.9
106.4
93.3
86.1
89.9
91.3
91.4
94.0
Year
Passenger Cars Trucks
Chg. (%)
Chg. (%)
Standard Small Mini Subtotal
OtherBuses
Chg. (%)
Chg. (%)
5,722,568
7,109,536
7,945,867
8,213,918
8,167,292
8,195,267
8,001,912
8,106,460
8,066,864
7,530,096
7,178,255
6,698,592
6,539,496
6,450,151
103.3
104.7
105.4
103.5
99.7
100.3
97.6
101.3
99.5
93.3
95.3
93.3
97.6
98.6
Total Chg. (%)
SubtotalMiniSmallStandard
● USED MOTOR VEHICLE SALES
07 08 09 10 11060504032002Year
Passenger Cars5,182,656(80.4%)
Trucks1,171,639(18.1%)
Standard168,470(2.6%)
Small233,556(3.6%) Standard
1,542,614(23.9%)
Small1,733,519(26.9%)
Mini1,906,523(29.6%)
Mini769,613(11.9%)
Total6,450,151
(100%)
Other82,007(1.3%)
x 1 million unitsBuses13,849(0.2%)
1
2
0
3
4
5
6
7
8
9
10Used vehicles New vehicles
Motor Vehicles Used Vehicle Sales
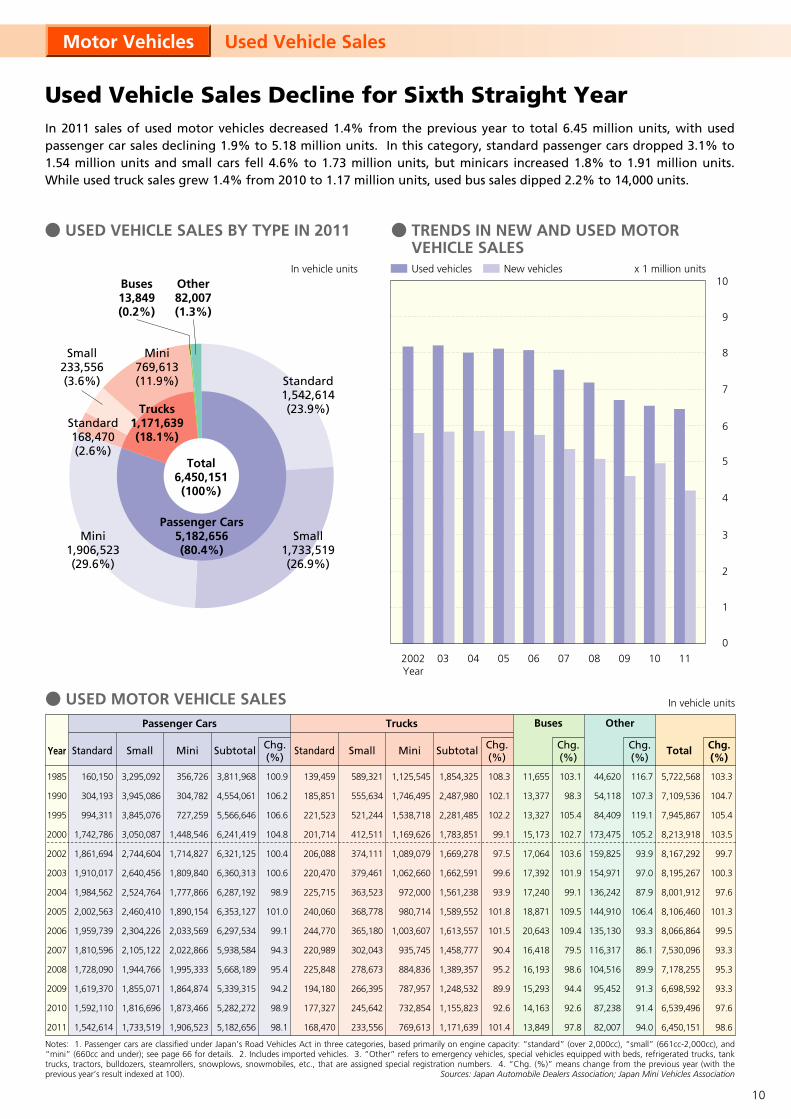
Used Vehicle Sales Decline for Sixth Straight YearIn 2011 sales of used motor vehicles decreased 1.4% from the previous year to total 6.45 million units, with used passenger car sales declining 1.9% to 5.18 million units. In this category, standard passenger cars dropped 3.1% to 1.54 million units and small cars fell 4.6% to 1.73 million units, but minicars increased 1.8% to 1.91 million units. While used truck sales grew 1.4% from 2010 to 1.17 million units, used bus sales dipped 2.2% to 14,000 units.
Notes: 1. Passenger cars are classified under Japan’s Road Vehicles Act in three categories, based primarily on engine capacity: “standard” (over 2,000cc), “small” (661cc-2,000cc), and “mini” (660cc and under); see page 66 for details. 2. Includes imported vehicles. 3. “Other” refers to emergency vehicles, special vehicles equipped with beds, refrigerated trucks, tank trucks, tractors, bulldozers, steamrollers, snowplows, snowmobiles, etc., that are assigned special registration numbers. 4. “Chg. (%)” means change from the previous year (with the previous year’s result indexed at 100). Sources: Japan Automobile Dealers Association; Japan Mini Vehicles Association
● USED VEHICLE SALES BY TYPE IN 2011
In vehicle units
● TRENDS IN NEW AND USED MOTOR VEHICLE SALES
10
19701975198019851990199520002002200320042005200620072008200920102011
77,374207,511472,314711,914
1,784,5947,874,189
13,942,62615,375,46515,836,59316,295,52016,634,52916,714,52316,771,50216,748,37316,688,64516,890,40217,039,684
6,457,18114,417,68021,011,09625,116,17930,554,65231,030,46228,593,49127,493,64426,885,06926,401,16726,254,54625,698,30324,921,22624,356,11323,919,01923,470,00323,143,892
2,244,4172,611,1302,176,1102,016,4872,584,9265,775,3869,901,258
11,670,73012,490,92813,297,36314,201,71415,108,21715,931,02516,760,48617,412,18917,986,98218,486,738
8,778,97217,236,32123,659,52027,844,58034,924,17244,680,03752,437,37554,539,83955,212,59055,994,05057,090,78957,521,04357,623,75357,864,97258,019,85358,347,38758,670,314
798,2561,158,4651,494,4641,668,8522,176,4882,574,4332,596,4212,531,2932,476,5882,464,8732,474,3782,465,8232,455,2682,386,2552,319,6122,281,7112,266,420
8,281,75910,043,85313,177,47917,139,80621,321,43920,430,14918,225,50817,480,42417,080,37416,780,84816,733,87116,499,41016,274,26715,896,50215,560,82515,284,62514,970,422
Passenger Cars Trucks
Standard Small Mini Subtotal Standard
4,478,4866,100,2067,155,2216,679,6656,609,5366,213,4055,474,6605,111,0244,870,9334,694,9224,594,3634,431,1034,323,5794,102,5533,952,5343,825,6323,740,361
Small
3,005,0172,785,1824,527,7948,791,289
12,535,41511,642,31110,154,4279,838,1079,732,8539,621,0539,665,1309,602,4849,495,4209,407,6949,288,6799,177,2828,963,641
Mini Subtotal
● MOTOR VEHICLES IN USE (at end of every calendar year)
● MOTOR VEHICLES IN USE BY TYPE AT END OF 2011
● TRENDS IN MOTOR VEHICLES IN USE
107.198.9
104.8105.5101.1
98.997.897.897.798.299.798.698.697.797.998.297.9
Chg. (%) Chg. (%) 126.6108.7104.4102.6107.1104.7102.5101.9101.2101.4102.0100.8100.2100.4100.3100.6100.6
2002Year
03 04 05 06 07 08 09 10 110
10
20
30
40
50
60
70
80
Passenger Cars
Passenger Cars58,670,314
(77.7%)
Special-Purpose Vehicles
1,646,203 (2.2%)
Buses225,948(0.3%)
Total75,512,887
(100%)Trucks, Buses &
Special-Purpose Vehicles
(Minicars)
(Mini-trucks)
Total
Notes: 1. “Special-purpose vehicles” refers to emergency vehicles, special vehicles equipped with beds, refrigerated trucks, tank trucks, tractors, bulldozers, steamrollers, snowplows,100). 3. “Three-wheeled vehicles” includes three-wheeled passenger cars, trucks, and special-purpose vehicles.
Motor Vehicles Motor Vehicles in Use and Motor Vehicle Density
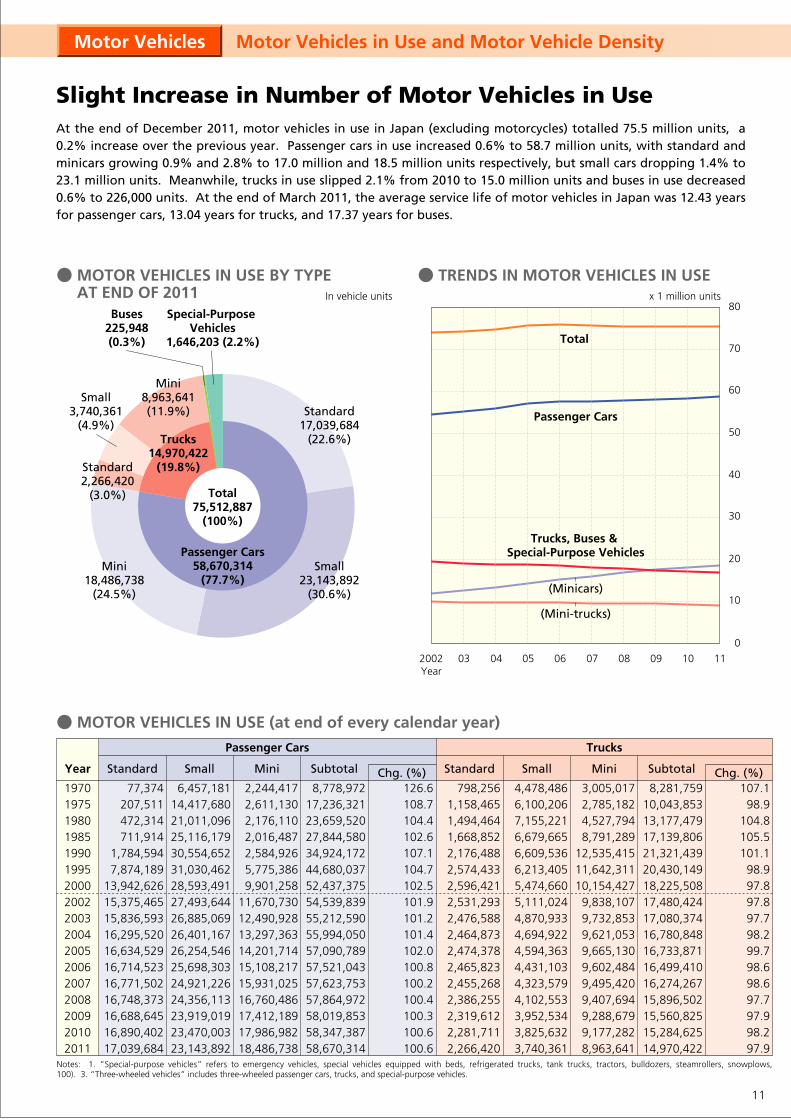
Slight Increase in Number of Motor Vehicles in UseAt the end of December 2011, motor vehicles in use in Japan (excluding motorcycles) totalled 75.5 million units, a 0.2% increase over the previous year. Passenger cars in use increased 0.6% to 58.7 million units, with standard and minicars growing 0.9% and 2.8% to 17.0 million and 18.5 million units respectively, but small cars dropping 1.4% to 23.1 million units. Meanwhile, trucks in use slipped 2.1% from 2010 to 15.0 million units and buses in use decreased 0.6% to 226,000 units. At the end of March 2011, the average service life of motor vehicles in Japan was 12.43 years for passenger cars, 13.04 years for trucks, and 17.37 years for buses.
x 1 million unitsIn vehicle units
Year
Trucks14,970,422
(19.8%)Standard2,266,420
(3.0%)
Standard17,039,684
(22.6%)
Small23,143,892
(30.6%)
Mini18,486,738
(24.5%)
Mini8,963,641(11.9%)
Small3,740,361
(4.9%)
11

Buses
104,895102,186106,633108,967114,819114,478110,046110,058109,909109,703109,917109,763109,621109,808108,760108,136107,435
Large
83,085124,098123,387122,261130,849128,617125,437123,347121,909121,231121,816121,918121,307120,873119,637119,135118,513
Small
187,980226,284230,020231,228245,668243,095235,483233,405231,818230,934231,733231,681
230,928230,681228,397227,271225,948
SubtotalTrailers
333,132584,100789,155941,647
1,206,3901,500,2191,750,7331,735,6821,689,6291,649,6861,630,0621,606,9341,585,8731,536,1601,515,4111,502,5931,646,203
17,581,84328,090,55837,856,17446,157,26157,697,66966,853,50072,649,09973,989,35074,214,41174,655,51875,686,45575,859,06875,714,82175,528,31575,324,48675,361,87675,512,887
TotalChg. (%)
116.2104.9104.5103.7104.7102.8101.3100.8100.3100.6101.4100.299.899.899.7
100.0100.2
110.5101.7100.4100.5101.699.199.999.499.399.6
100.3100.099.799.999.099.599.4
Chg. (%) 110.5101.7100.4100.5101.699.199.999.499.399.698.898.698.796.998.699.2
109.6
Chg. (%) 19701975198019851990199520002002200320042005200620072008200920102011
243,93447,99817,7246,1234,0563,6213,8273,6033,4783,4713,2803,2383,2013,1193,1273,1203,089
Three-Wheeled Vehicles
Special-Purpose Vehicles
23,07939,80856,80465,48587,359
120,171133,676136,172137,510142,032147,626151,441154,798157,951152,381152,834154,100
*Figures for Iwate, Fukushima and Miyagi are estimates because households in 22 municipalities there affected by the March 11, 2011 earthquake and tsunami are not included in the count.
Source: Automobile Inspection & Registration Information Association
● PRIVATE PASSENGER CARS IN USE PER 100 HOUSEHOLDS BY PREFECTURE (at March 31, 2011)
0 50 100 150 200
1. Fukui 2. Toyama 3. Gunma 4. Yamagata 5. Gifu 6. Tochigi 7. Iwate* 8. Fukushima* 9. Ibaraki 10. Nagano11. Niigata 12. Yamanashi 13. Ishikawa 14. Miyagi*15. Saga16. Mie 17. Shizuoka 18. Shiga19. Tottori20. Shimane 21. Okayama22. Akita23. Tokushima 24. Aichi25. Kagawa 26. Kumamoto 27. Oita 28. Okinawa29. Miyazaki 30. Yamaguchi 31. Aomori32. Wakayama 33. Nara 34. Kagoshima35. Ehime36. Hiroshima 37. Fukuoka38. Kochi39. Nagasaki 40. Saitama41. Chiba42. Hokkaido43. Hyogo 44. Kyoto 45. Kanagawa 46. Osaka 47. Tokyo
National Average 108.1
● PASSENGER CARS IN USE BY YEAR OF FIRST REGISTRATION
6.617.136.086.947.057.527.517.127.146.296.094.964.513.66
11.39100.00
2,652,9632,860,0582,438,2172,786,7712,829,4983,018,9473,014,3962,858,3982,867,0902,525,7502,443,5511,990,9541,808,9851,468,4224,571,132
40,135,132
April 2010-March 2011April 2009-March 2010April 2008-March 2009April 2007-March 2008April 2006-March 2007April 2005-March 2006April 2004-March 2005April 2003-March 2004April 2002-March 2003April 2001-March 2002April 2000-March 2001April 1999-March 2000April 1998-March 1999April 1997-March 1998
-March 1997Total Vehicles in Use
% of Total Vehiclesin Use
Vehicles in UseYear of First Registration
2002200320042005200620072008200920102011
10.5510.7710.9710.9311.1011.6611.6711.6812.7012.43
10.9211.2311.8411.7211.4711.9211.7213.5012.7213.04
13.9814.4114.4815.3415.0214.8315.6215.0016.5917.37
● AVERAGE SERVICE LIFE BY TYPEYear Passenger Cars Trucks Buses
In years
2002200320042005200620072008200920102011
6.236.396.586.776.907.097.237.487.567.74
7.778.108.178.368.508.688.989.169.62
10.04
8.979.249.339.539.619.80
10.0210.2610.5010.78
Year Passenger Cars Trucks Buses
● AVERAGE AGE BY TYPE In years
snowmobiles, etc., that are identified as special-purpose vehicles by special registration numbers. 2. “Chg. (%)” means change from the previous year (with the previous year’s result indexed at Source: Ministry of Land, Infrastructure, Transport and Tourism
Notes: 1. “Average age” means the average number of years elapsed since first registration. 2. “Average service life” means average vehicle lifespan. The method of calculating average service life changed in 2001 for passenger cars and trucks and in 2002 for buses. 3. “Average age” and “average service life” figures are as at the end of every fiscal year. 4. The above three tables exclude mini-vehicles.
Source: Automobile Inspection & Registration Information Association
In vehicle units
At March 31, 2011
In vehicle units
Year
174.8171.5
166.7165.3164.7163.5163.2161.9160.9
157.9153.9153.3
149.5148.8148.4
146.3143.9142.4141.9
137.8137.1136.6
133.6132.8132.4
128.5126.5
124.3123.9
121.1120.3118.6
112.2111.5110.0109.3108.3106.3105.7
102.5101.4100.3
93.486.0
75.467.7
48.4
12
19701975198019851990199520002002200320042005200620072008200920102011
3,580,6233,932,4143,138,1471,732,0501,462,0691,228,5251,222,4331,217,0131,198,2731,449,6081,359,4141,534,975
804,980818,660743,509
10,1365,451
21,1241,301
168,044
520443
1,7531,755
292808
1,611885300
2,75510,200
725,5861,827,2863,947,1604,426,7624,482,1302,896,2163,795,8524,012,373 4,080,4984,214,0274,363,1685,295,4975,811,9595,915,4293,208,6394,275,3663,929,904
129.5105.8127.2111.2101.886.2
101.0112.4 101.7103.3103.5121.4109.8101.854.2
133.291.9
13,89222,07173,17711,374
8276718
62 6110916214131241008
Passenger Cars Trucks
Standard Small Mini Subtotal
65,170168,370332,257
1,196,973944,737612,654530,823567,313553,406591,233521,848488,632527,010567,596267,060397,404369,973
Standard
272,549643,232
1,548,2511,029,757
364,376236,92986,32970,218
76,78796,45389,94689,20189,12890,58148,44752,90853,786
Small Mini
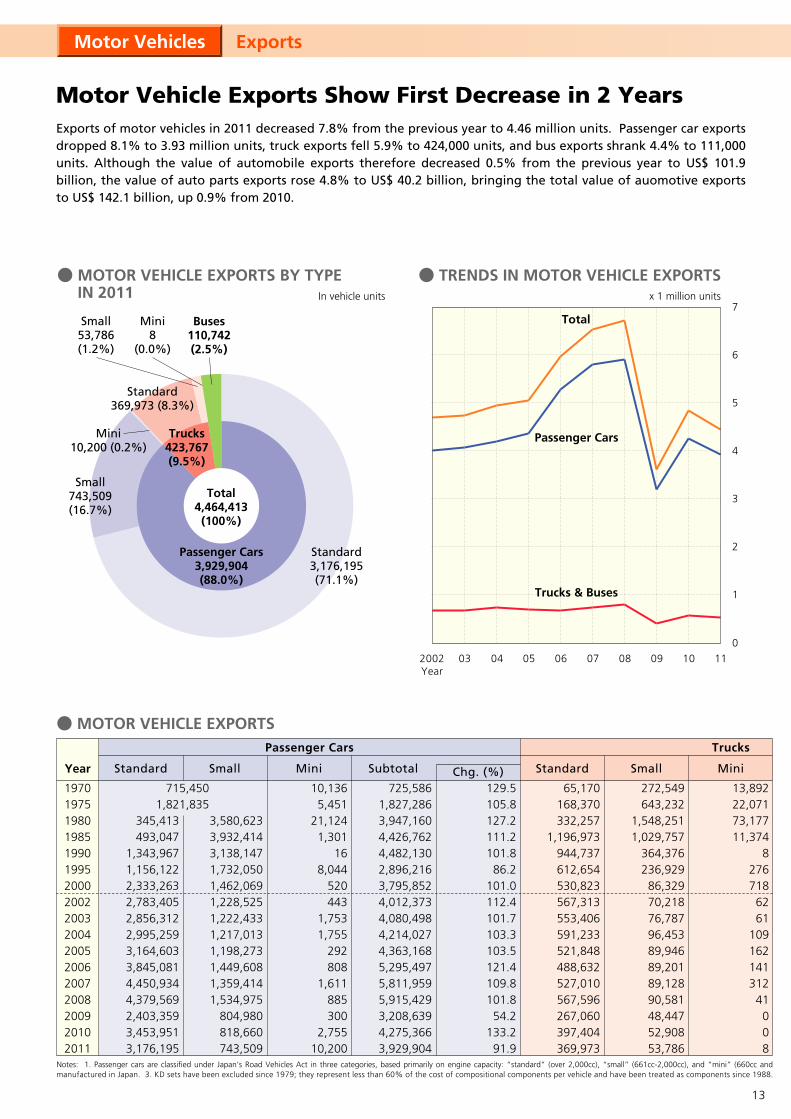
● MOTOR VEHICLE EXPORTS
Notes: 1. Passenger cars are classified under Japan’s Road Vehicles Act in three categories, based primarily on engine capacity: “standard” (over 2,000cc), “small” (661cc-2,000cc), and “mini” (660cc and manufactured in Japan. 3. KD sets have been excluded since 1979; they represent less than 60% of the cost of compositional components per vehicle and have been treated as components since 1988.
Passenger Cars3,929,904(88.0%)
Trucks423,767(9.5%)
Buses110,742(2.5%)
Mini8
(0.0%)
Standard369,973 (8.3%)
Small53,786(1.2%)
Standard3,176,195(71.1%)
Small743,509(16.7%)
Mini10,200 (0.2%)
Total4,464,413
(100%)
2002Year
03 04 05 06 07 08 09 10 11
Passenger Cars
Total
Trucks & Buses
715,4501,821,835
345,413493,047
1,343,9671,156,1222,333,2632,783,4052,856,3122,995,2593,164,6033,845,0814,450,9344,379,5692,403,3593,453,9513,176,195
Chg. (%)
Motor Vehicles Exports
Motor Vehicle Exports Show First Decrease in 2 YearsExports of motor vehicles in 2011 decreased 7.8% from the previous year to 4.46 million units. Passenger car exports dropped 8.1% to 3.93 million units, truck exports fell 5.9% to 424,000 units, and bus exports shrank 4.4% to 111,000 units. Although the value of automobile exports therefore decreased 0.5% from the previous year to US$ 101.9 billion, the value of auto parts exports rose 4.8% to US$ 40.2 billion, bringing the total value of auomotive exports to US$ 142.1 billion, up 0.9% from 2010.
● MOTOR VEHICLE EXPORTS BY TYPE IN 2011
● TRENDS IN MOTOR VEHICLE EXPORTSIn vehicle units x 1 million units
0
7
6
5
4
3
2
1
Year
13
0
1,000,000
2,000,000
3,000,000
4,000,000
5,000,000
6,000,000
7,000,000
under); see page 66 for details. Vehicle type classification in this table differs somewhat from that used in Ministry of Finance export data. 2. Figures represent ex-factory export shipments of motor vehicles4. “Chg. (%)” means change from the previous year (with the previous year’s result indexed at 100).
In vehicle units
Buses
351,611833,673
1,953,6852,238,1041,309,121
849,859617,870637,593630,254687,795611,956577,974616,450658,218315,507450,312423,767
Subtotal
120.995.3
137.2108.090.682.8
100.8115.3 98.8109.189.094.4
106.7106.847.9
142.794.1
4,5206,4067,6166,2496,0668,0287,1319,3468,300
11,6929,957
11,56713,88717,57411,10613,96914,495
Large Small
5,05910,24758,50059,35733,89536,70634,03239,41637,29144,14967,98081,634
107,644135,87080,916
101,81396,247
Subtotal
9,57916,65366,11665,60639,96144,73441,16348,762 45,59155,84177,93793,201
121,531153,44492,022
115,782110,742
141.6104.3179.4116.7113.760.8
107.3109.693.5
122.5139.6119.6130.4126.360.0
125.895.6
1,086,7762,677,6125,966,9616,730,4725,831,2123,790,8094,454,8854,698,7284,756,3434,957,6635,053,0615,966,6726,549,9406,727,0913,616,1684,841,4604,464,413
Total
126.7102.3130.8110.299.185.0
101.0112.8101.2104.2101.9118.1109.8102.753.8
133.992.2
19701975198019851990199520002002200320042005200620072008200920102011
Chg. (%) Chg. (%) Chg. (%)
426,692
419,274
949,699
864,794
2,076,298
1,841,637
287,165
144,979
385,455
9,166
4,698,728
112.8
524,093
439,587
1,159,706
1,019,058
1,786,387
1,594,157
272,297
146,269
418,202
9,802
4,756,343
101.2
510,939
457,406
1,275,229
1,036,127
1,726,465
1,559,607
344,844
182,451
448,671
11,658
4,957,663
104.2
420,067
519,594
1,178,197
895,728
1,854,438
1,662,939
413,259
209,548
447,922
10,036
5,053,061
101.9
381,561
590,341
1,305,861
921,837
2,488,373
2,261,552
479,324
269,956
441,912
9,344
5,966,672
118.1
Year 2002 2003 2004 2005 2006 2007 2008 2009
Note: “Chg. (%)” means change from the previous year (with the previous year’s result indexed at 100).
In vehicle units
Source: Japan Automobile Manufacturers Association
440,920
811,887
1,497,800
919,421
2,455,099
2,215,452
569,945
330,744
434,268
9,277
6,549,940
109.8
525,081
952,749
1,589,054
812,163
2,318,254
2,068,062
517,900
351,762
460,561
11,730
6,727,091
102.7
378,840
428,042
685,026
542,215
1,379,150
1,202,732
244,196
145,131
347,394
8,389
3,616,168
53.8
2010 2011
576,440
583,684
936,496
568,508
1,727,305
1,531,026
396,499
188,644
425,206
7,186
4,841,460
133.9
572,417
419,715
995,313
521,804
1,585,327
1,426,833
358,375
148,599
379,747
4,920
4,464,413
92.2
AsiaMiddle East Europe
(EU)North America
(U.S.A.)Latin America AfricaOceaniaOtherTotalChg. (%)
Year
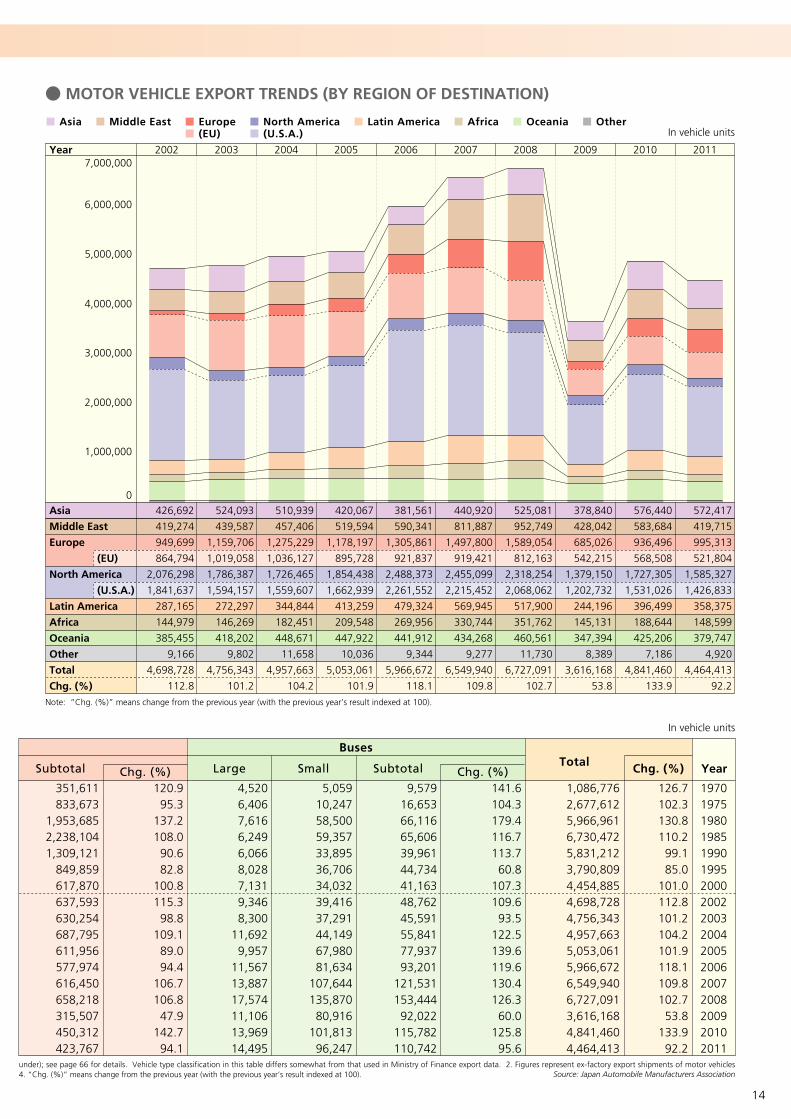
● MOTOR VEHICLE EXPORT TRENDS (BY REGION OF DESTINATION)
■ Asia ■ Middle East ■ Europe ■ North America ■ Latin America ■ Africa ■ Oceania ■ Other ■ (EU) ■ (U.S.A.)
14
19.322.9
● MOTOR VEHICLE EXPORT TRENDS (BY REGION OF DESTINATION)
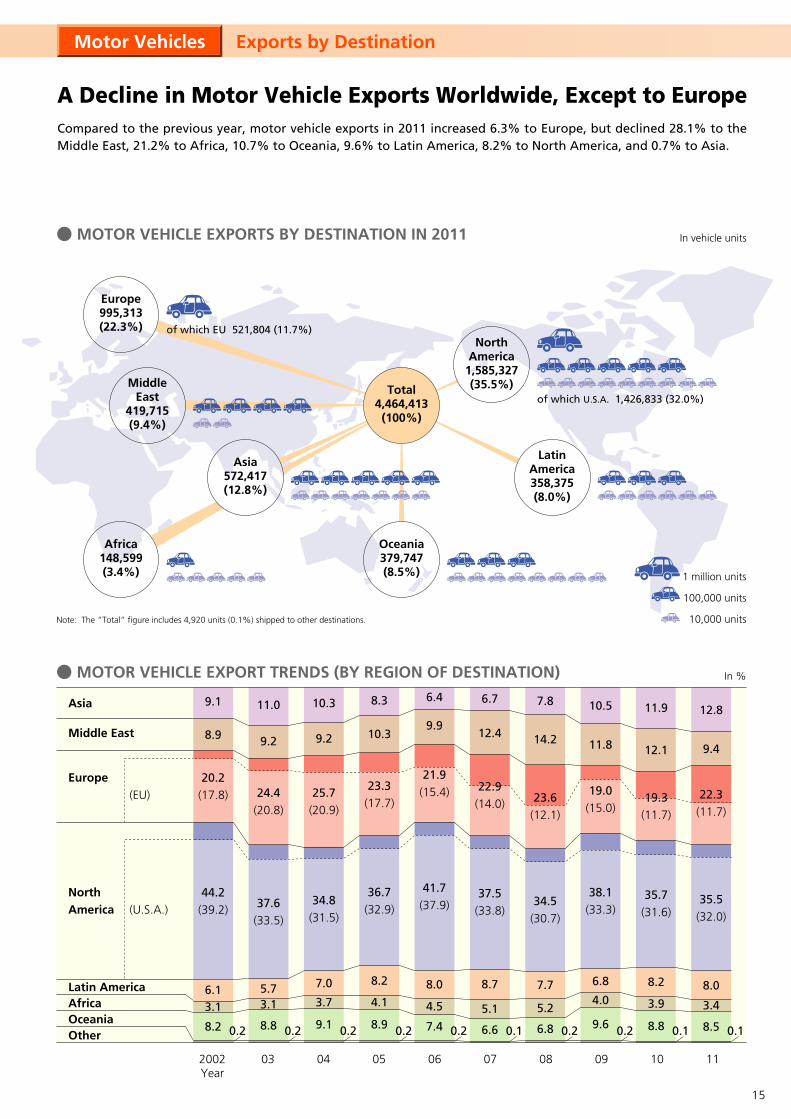
● MOTOR VEHICLE EXPORTS BY DESTINATION IN 2011
In %
Note: The “Total” figure includes 4,920 units (0.1%) shipped to other destinations.
NorthAmerica (U.S.A.)
Europe(EU)
Asia
Middle East
Latin America AfricaOceaniaOther
0605 07 08 0904032002Year
8.9 9.2 9.2
In vehicle units
9.1 11.0 10.3 8.3
6.1 5.7 7.0 8.2
3.1 3.1 3.7 4.1
44.237.6 34.8
36.7
0.2 0.2 0.2 0.28.2 8.8 9.1 8.9
(39.2) (33.5) (31.5)
(32.9)
20.224.4 25.7 23.3
(17.8) (20.8) (20.9) (17.7)
10.3
6.4
8.0
4.5
41.7
0.27.4
(37.9)
21.9(15.4)
9.9
7.8
7.7
5.2
34.5
0.26.8
(30.7)
23.6(12.1)
14.2
10.5
6.8
4.0
38.1
0.29.6
(33.3)
19.0(15.0)
11.8
10 11
11.9
8.2
3.9
35.7
0.18.8
(31.6)
19.3(11.7)
12.1
12.8
8.0
3.4
35.5
0.18.5
(32.0)
22.3(11.7)
9.4
6.7
8.7
5.1
37.5
0.16.6
(33.8)
22.9(14.0)
12.4
Motor Vehicles Exports by Destination
A Decline in Motor Vehicle Exports Worldwide, Except to EuropeCompared to the previous year, motor vehicle exports in 2011 increased 6.3% to Europe, but declined 28.1% to the Middle East, 21.2% to Africa, 10.7% to Oceania, 9.6% to Latin America, 8.2% to North America, and 0.7% to Asia.
3.1 3.1 3.7 4.1
Europe995,313(22.3%)
Oceania379,747(8.5%)
Asia572,417(12.8%)
Total4,464,413
(100%)
Africa148,599(3.4%)
MiddleEast
419,715(9.4%)
LatinAmerica358,375(8.0%)
NorthAmerica
1,585,327(35.5%)
of which U.S.A. 1,426,833 (32.0%)
1 million units
100,000 units
10,000 units
of which EU 521,804 (11.7%)
15
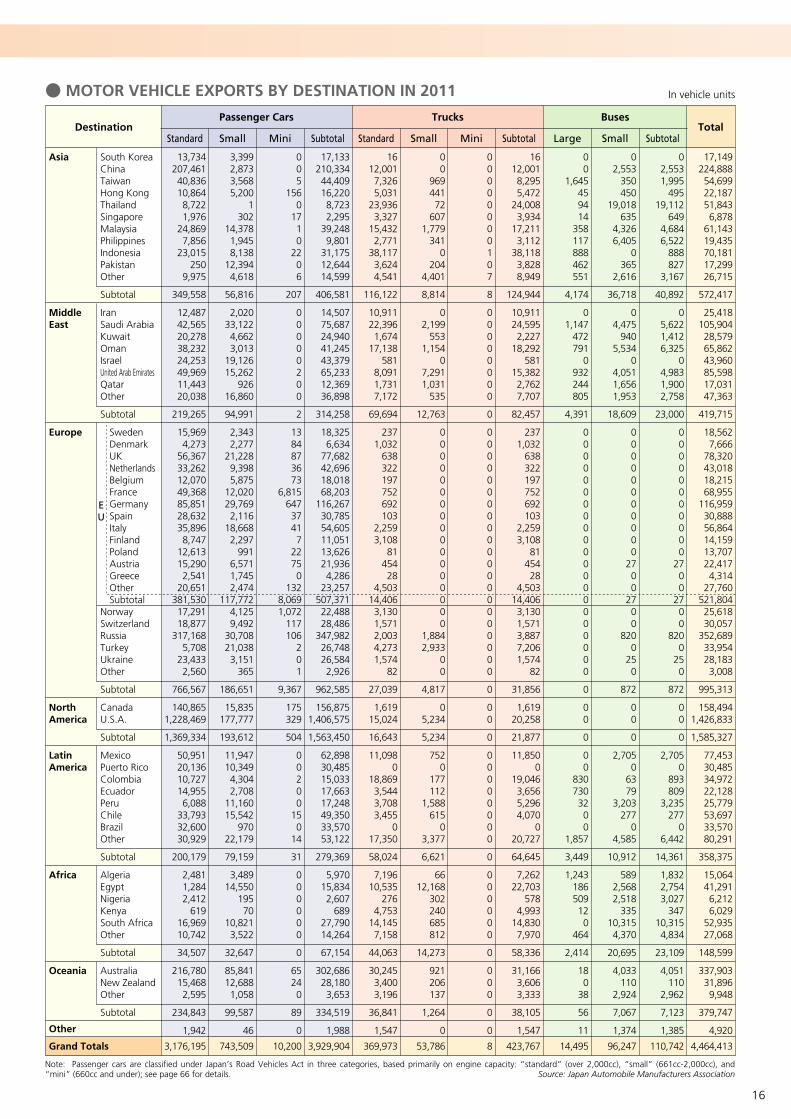
● MOTOR VEHICLE EXPORTS BY DESTINATION IN 2011
Standard Small Mini Subtotal
Passenger Cars
Standard Small Mini Subtotal
Trucks
Large Small SubtotalTotal
Buses
In vehicle units
Note: Passenger cars are classified under Japan’s Road Vehicles Act in three categories, based primarily on engine capacity: “standard” (over 2,000cc), “small” (661cc-2,000cc), and “mini” (660cc and under); see page 66 for details.
Asia
Middle East
Europe
North America
Latin America
Africa
Oceania
Other
Grand Totals
South KoreaChinaTaiwanHong KongThailandSingaporeMalaysiaPhilippinesIndonesiaPakistanOther
Subtotal
IranSaudi ArabiaKuwaitOmanIsraelUnited Arab EmiratesQatarOther
Subtotal
SwedenDenmarkUKNetherlandsBelgiumFranceGermanySpainItalyFinlandPolandAustriaGreeceOtherSubtotal
NorwaySwitzerlandRussiaTurkeyUkraineOther
Subtotal
CanadaU.S.A.
Subtotal
MexicoPuerto RicoColombiaEcuadorPeruChileBrazilOther
Subtotal
AlgeriaEgyptNigeriaKenyaSouth AfricaOther
Subtotal
AustraliaNew ZealandOther
Subtotal
Destination
EU
Source: Japan Automobile Manufacturers Association
13,734207,46140,83610,8648,7221,976
24,8697,856
23,015250
9,975
349,558
12,48742,56520,27838,23224,25349,96911,44320,038
219,265
15,9694,273
56,36733,26212,07049,36885,85128,63235,8968,747
12,61315,2902,541
20,651381,53017,29118,877
317,1685,708
23,4332,560
766,567
140,8651,228,469
1,369,334
50,95120,13610,72714,9556,088
33,79332,60030,929
200,179
2,4811,2842,412
61916,96910,742
34,507
216,78015,4682,595
234,843
1,942
3,176,195
3,3992,8733,5685,200
1302
14,3781,9458,138
12,3944,618
56,816
2,02033,1224,6623,013
19,12615,262
92616,860
94,991
2,3432,277
21,2289,3985,875
12,02029,7692,116
18,6682,297
9916,5711,7452,474
117,7724,1259,492
30,70821,0383,151
365
186,651
15,835177,777
193,612
11,94710,3494,3042,708
11,16015,542
97022,179
79,159
3,48914,550
19570
10,8213,522
32,647
85,84112,6881,058
99,587
46
743,509
005
1560
1710
2206
207
00000200
2
1384873673
6,81564737417
22750
1328,0691,072
117106
201
9,367
175329
504
00200
150
14
31
000000
0
65240
89
0
10,200
17,133210,33444,40916,2208,7232,295
39,2489,801
31,17512,64414,599
406,581
14,50775,68724,94041,24543,37965,23312,36936,898
314,258
18,3256,634
77,68242,69618,01868,203
116,26730,78554,60511,05113,62621,9364,286
23,257507,37122,48828,486
347,98226,74826,5842,926
962,585
156,8751,406,575
1,563,450
62,89830,48515,03317,66317,24849,35033,57053,122
279,369
5,97015,8342,607
68927,79014,264
67,154
302,68628,1803,653
334,519
1,988
3,929,904
1612,0017,3265,031
23,9363,327
15,4322,771
38,1173,6244,541
116,122
10,91122,3961,674
17,138581
8,0911,7317,172
69,694
2371,032
638322197752692103
2,2593,108
8145428
4,50314,4063,1301,5712,0034,2731,574
82
27,039
1,61915,024
16,643
11,0980
18,8693,5443,7083,455
017,350
58,024
7,19610,535
2764,753
14,1457,158
44,063
30,2453,4003,196
36,841
1,547
369,973
00
96944172
6071,779
3410
2044,401
8,814
02,199
5531,154
07,2911,031
535
12,763
00000000000000000
1,8842,933
00
4,817
05,234
5,234
7520
177112
1,588615
03,377
6,621
6612,168
302240685812
14,273
921206137
1,264
0
53,786
00000000107
8
00000000
0
000000000000000000000
0
00
0
00000000
0
000000
0
000
0
0
8
1612,0018,2955,472
24,0083,934
17,2113,112
38,1183,8288,949
124,944
10,91124,5952,227
18,292581
15,3822,7627,707
82,457
2371,032
638322197752692103
2,2593,108
8145428
4,50314,4063,1301,5713,8877,2061,574
82
31,856
1,61920,258
21,877
11,8500
19,0463,6565,2964,070
020,727
64,645
7,26222,703
5784,993
14,8307,970
58,336
31,1663,6063,333
38,105
1,547
423,767
00
1,645459414
358117888462551
4,174
01,147
472791
0932244805
4,391
000000000000000000000
0
00
0
00
8307303200
1,857
3,449
1,243186509120
464
2,414
180
38
56
11
14,495
02,553
350450
19,018635
4,3266,405
0365
2,616
36,718
04,475
9405,534
04,0511,6561,953
18,609
00000000000
2700
2700
8200
250
872
00
0
2,7050
6379
3,203277
04,585
10,912
5892,5682,518
33510,3154,370
20,695
4,033110
2,924
7,067
1,374
96,247
02,5531,995
49519,112
6494,6846,522
888827
3,167
40,892
05,6221,4126,325
04,9831,9002,758
23,000
00000000000
2700
2700
8200
250
872
00
0
2,7050
893809
3,235277
06,442
14,361
1,8322,7543,027
34710,3154,834
23,109
4,051110
2,962
7,123
1,385
110,742
17,149224,88854,69922,18751,8436,878
61,14319,43570,18117,29926,715
572,417
25,418105,90428,57965,86243,96085,59817,03147,363
419,715
18,5627,666
78,32043,01818,21568,955
116,95930,88856,86414,15913,70722,4174,314
27,760521,80425,61830,057
352,68933,95428,1833,008
995,313
158,4941,426,833
1,585,327
77,45330,48534,97222,12825,77953,69733,57080,291
358,375
15,06441,2916,2126,029
52,93527,068
148,599
337,90331,8969,948
379,747
4,920
4,464,413
16
Notes: 1. KD sets have been excluded since 1979; they represent less than 60% of the cost of compositional components per vehicle and have been treated as components since 1988. 2. “Chg. (%)” means change from the previous year (with the previous year’s result indexed at 100).
In vehicle units
2,947,6723,802,5476,434,5244,536,3472,806,8952,753,2392,415,3912,115,488 1,830,9051,739,5841,791,5851,771,3861,676,0971,226,839
644,901664,175638,987
Total Chg. (%)
114.484.3
143.8112.7100.4101.0107.3
90.986.595.0
103.098.994.673.252.6
103.096.2
19701975198019851990199520002002200320042005200620072008200920102011
895,5991,030,8222,493,9102,014,8501,343,220
951,803636,546588,956458,072331,449298,549306,246264,336162,928108,41787,513
104,936
1,407,2051,887,7012,181,2061,373,423
686,7341,038,938
630,221543,294 376,800304,622260,343149,868178,827128,38157,42480,63064,507
259,145331,733660,831469,728270,304217,738297,433241,356
235,499271,126279,274276,043269,689192,863125,384108,950104,436
385,723552,291
1,098,577678,346506,637544,760851,191741,882
760,534832,387953,419
1,039,229963,245742,667353,676387,082365,108
2,052,0732,771,7253,940,6142,521,4971,463,6751,801,4361,778,8451,526,532
1,372,8331,408,1351,493,0361,465,1401,411,7611,063,911
536,484576,662534,051
Over 50cc
Motor-Driven Cycles Class 1(50cc & Under)
YearMotor-Driven Cycles Class 2 (51cc-125cc)
Mini-Sized Motorcycles(126cc-250cc)
Small-Sized Motorcycles(Over 250cc)
Subtotal
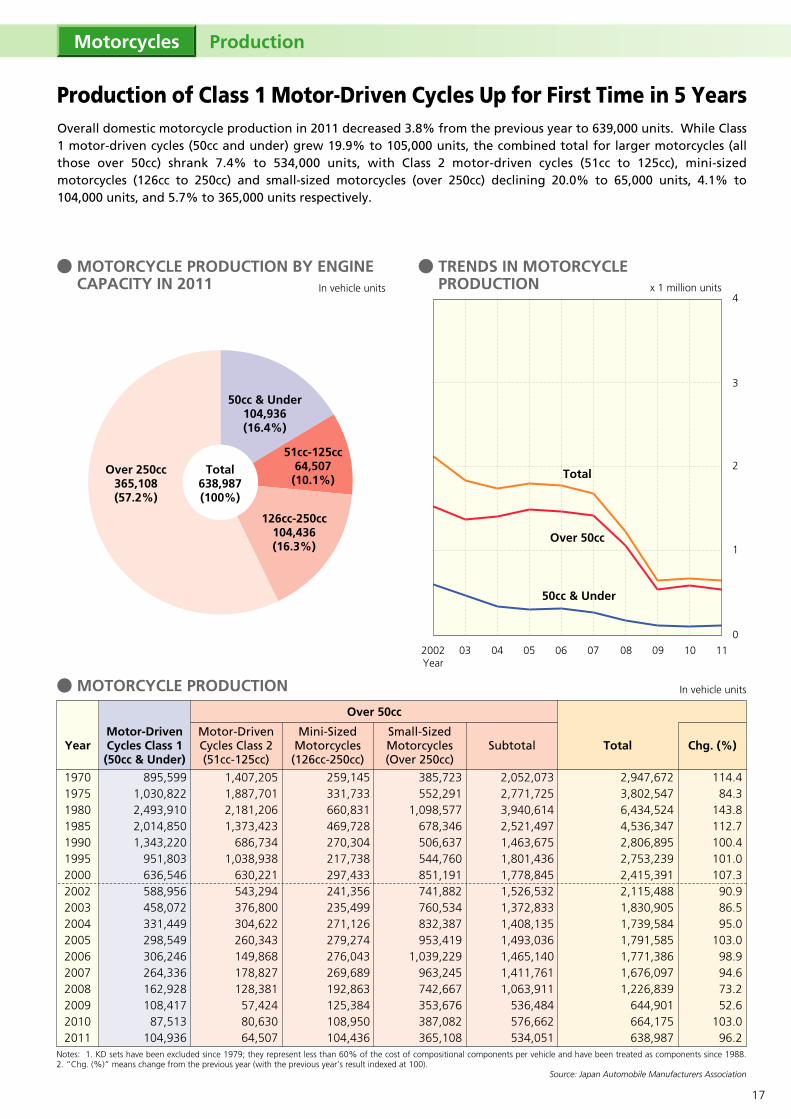
● MOTORCYCLE PRODUCTION
50cc & Under104,936(16.4%)
51cc-125cc64,507(10.1%)
126cc-250cc104,436(16.3%)
● MOTORCYCLE PRODUCTION BY ENGINE CAPACITY IN 2011
● TRENDS IN MOTORCYCLE PRODUCTION
Total638,987(100%)
Over 250cc365,108(57.2%)
Over 50cc
Total
50cc & Under
Source: Japan Automobile Manufacturers Association
2002Year
03 04 05 06 07 08 09 10 110
1
2
3
4In vehicle units x 1 million units
Motorcycles Production
Production of Class 1 Motor-Driven Cycles Up for First Time in 5 YearsOverall domestic motorcycle production in 2011 decreased 3.8% from the previous year to 639,000 units. While Class 1 motor-driven cycles (50cc and under) grew 19.9% to 105,000 units, the combined total for larger motorcycles (all those over 50cc) shrank 7.4% to 534,000 units, with Class 2 motor-driven cycles (51cc to 125cc), mini-sized motorcycles (126cc to 250cc) and small-sized motorcycles (over 250cc) declining 20.0% to 65,000 units, 4.1% to 104,000 units, and 5.7% to 365,000 units respectively.
17
Note: “Chg. (%)” means change from the previous year (with the previous year’s result indexed at 100).
2,370,0362,096,2501,618,9331,212,852
779,877771,082 760,121700,021706,513700,366684,944522,315380,777380,242405,533
Total Chg. (%)
122.7102.697.6
101.693.2
102.798.692.1
100.999.197.876.372.999.9
106.7
Source: Japan Automobile Manufacturers Association
198019851990199520002002200320042005200620072008200920102011
1,978,4261,646,1151,213,512
884,718558,459535,327539,610500,388470,922478,196458,023295,908255,561231,247257,045
200,238130,574169,618138,115102,11694,468 89,90662,78088,74782,211
100,720120,99065,88896,36895,702
88,188173,887158,88298,83372,88694,414
87,88197,13599,65891,39586,08155,67437,18027,27531,767
103,184145,67476,92191,18646,41646,873 42,72439,71847,18648,56440,12049,74322,14825,35221,019
391,610450,135405,421328,134221,418235,755220,511199,633235,591222,170226,921226,407125,216148,995148,488
Over 50cc
Motor-Driven Cycles Class 1 (50cc & Under)
YearMotor-Driven Cycles Class 2 (51cc-125cc)
Mini-Sized Motorcycles(126cc-250cc)
Small-Sized Motorcycles(Over 250cc)
Subtotal
● MOTORCYCLE SALES (SHIPMENTS TO DOMESTIC DEALERS)
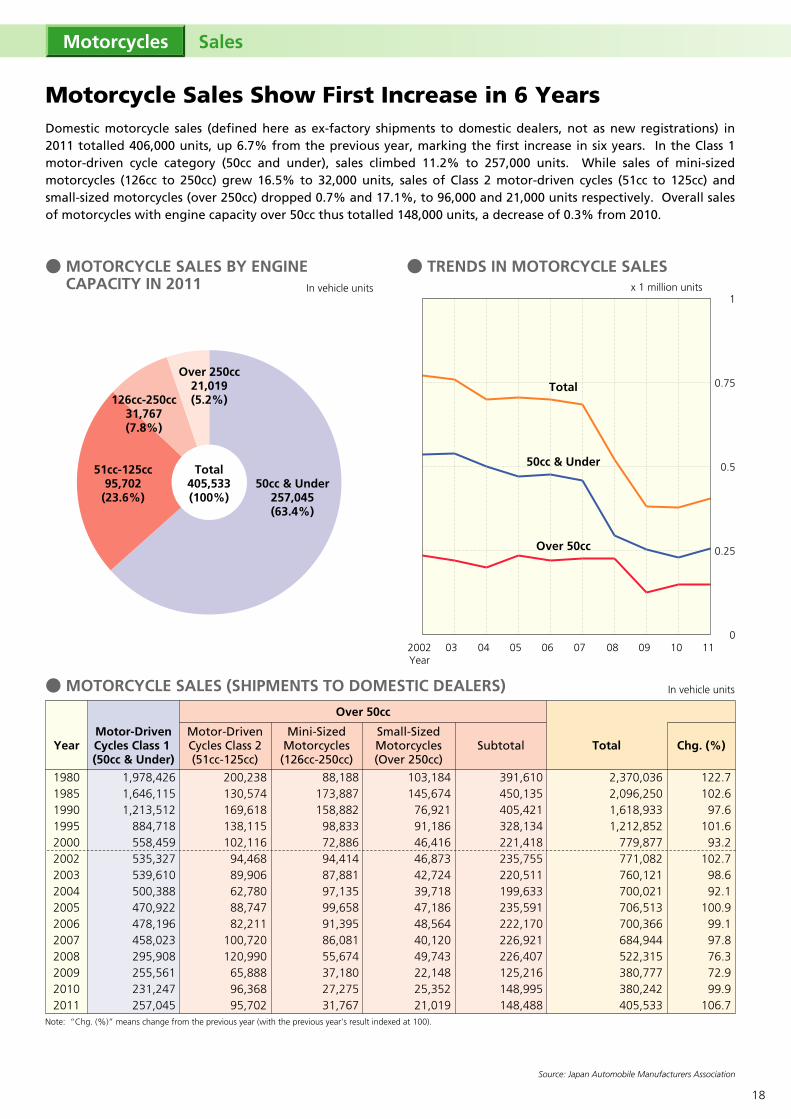
● MOTORCYCLE SALES BY ENGINE CAPACITY IN 2011 In vehicle units
50cc & Under257,045(63.4%)
51cc-125cc95,702(23.6%)
Over 250cc21,019(5.2%)
Total405,533(100%)
In vehicle units
Motorcycles Sales
Motorcycle Sales Show First Increase in 6 YearsDomestic motorcycle sales (defined here as ex-factory shipments to domestic dealers, not as new registrations) in 2011 totalled 406,000 units, up 6.7% from the previous year, marking the first increase in six years. In the Class 1 motor-driven cycle category (50cc and under), sales climbed 11.2% to 257,000 units. While sales of mini-sized motorcycles (126cc to 250cc) grew 16.5% to 32,000 units, sales of Class 2 motor-driven cycles (51cc to 125cc) and small-sized motorcycles (over 250cc) dropped 0.7% and 17.1%, to 96,000 and 21,000 units respectively. Overall sales of motorcycles with engine capacity over 50cc thus totalled 148,000 units, a decrease of 0.3% from 2010.
126cc-250cc31,767(7.8%)
● TRENDS IN MOTORCYCLE SALES
Over 50cc
Total
50cc & Under
x 1 million units
2002Year
03 04 05 06 07 08 09 10 110
0.25
0.5
0.75
1
18
In vehicle units
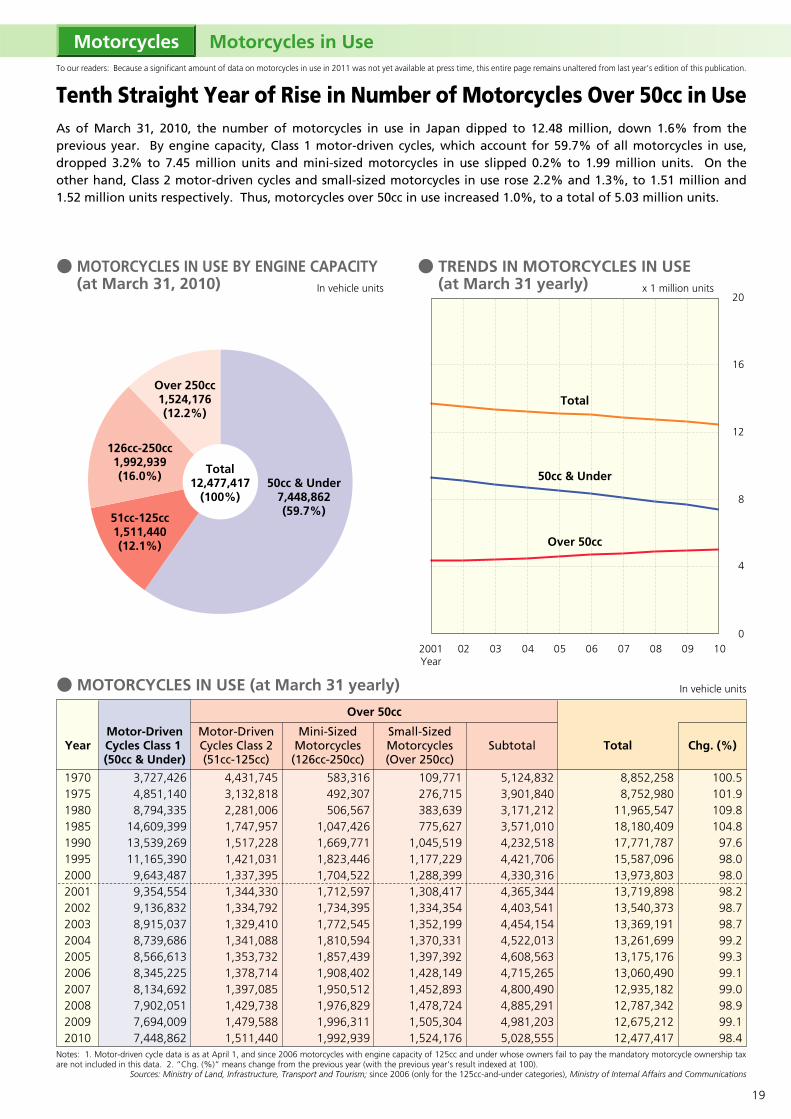
50cc & Under7,448,862(59.7%)51cc-125cc
1,511,440(12.1%)
126cc-250cc1,992,939(16.0%)
● TRENDS IN MOTORCYCLES IN USE (at March 31 yearly)
Total12,477,417
(100%)
x 1 million units
Over 250cc1,524,176(12.2%)
● MOTORCYCLES IN USE BY ENGINE CAPACITY (at March 31, 2010)
Total Chg. (%)
Over 50cc
Motor-Driven Cycles Class 1 (50cc & Under)
YearMotor-Driven Cycles Class 2 (51cc-125cc)
Mini-Sized Motorcycles(126cc-250cc)
Small-Sized Motorcycles(Over 250cc)
Subtotal
In vehicle units
8,852,2588,752,980
11,965,54718,180,40917,771,78715,587,09613,973,80313,719,89813,540,37313,369,19113,261,69913,175,17613,060,49012,935,18212,787,34212,675,21212,477,417
100.5101.9109.8104.8
97.698.098.098.298.798.799.299.399.199.098.999.198.4
19701975198019851990199520002001200220032004200520062007200820092010
3,727,4264,851,1408,794,335
14,609,39913,539,26911,165,390
9,643,4879,354,5549,136,8328,915,0378,739,6868,566,6138,345,2258,134,6927,902,0517,694,0097,448,862
4,431,7453,132,8182,281,0061,747,9571,517,2281,421,0311,337,3951,344,3301,334,7921,329,4101,341,0881,353,7321,378,7141,397,0851,429,7381,479,5881,511,440
583,316492,307506,567
1,047,4261,669,7711,823,4461,704,5221,712,5971,734,3951,772,5451,810,5941,857,4391,908,4021,950,5121,976,8291,996,3111,992,939
109,771276,715383,639775,627
1,045,5191,177,2291,288,3991,308,4171,334,3541,352,1991,370,3311,397,3921,428,1491,452,8931,478,7241,505,3041,524,176
5,124,8323,901,8403,171,2123,571,0104,232,5184,421,7064,330,3164,365,3444,403,5414,454,1544,522,0134,608,5634,715,2654,800,4904,885,2914,981,2035,028,555
● MOTORCYCLES IN USE (at March 31 yearly)
Notes: 1. Motor-driven cycle data is as at April 1, and since 2006 motorcycles with engine capacity of 125cc and under whose owners fail to pay the mandatory motorcycle ownership tax are not included in this data. 2. “Chg. (%)” means change from the previous year (with the previous year’s result indexed at 100).
Motorcycles Motorcycles in Use
Tenth Straight Year of Rise in Number of Motorcycles Over 50cc in UseAs of March 31, 2010, the number of motorcycles in use in Japan dipped to 12.48 million, down 1.6% from the previous year. By engine capacity, Class 1 motor-driven cycles, which account for 59.7% of all motorcycles in use, dropped 3.2% to 7.45 million units and mini-sized motorcycles in use slipped 0.2% to 1.99 million units. On the other hand, Class 2 motor-driven cycles and small-sized motorcycles in use rose 2.2% and 1.3%, to 1.51 million and 1.52 million units respectively. Thus, motorcycles over 50cc in use increased 1.0%, to a total of 5.03 million units.
To our readers: Because a significant amount of data on motorcycles in use in 2011 was not yet available at press time, this entire page remains unaltered from last year’s edition of this publication.
2001Year
02 03 04 05 06 07 08 09 100
4
8
12
16
20
Over 50cc
Total
50cc & Under
Sources: Ministry of Land, Infrastructure, Transport and Tourism; since 2006 (only for the 125cc-and-under categories), Ministry of Internal Affairs and Communications
19
Total Chg. (%)
Over 50cc
Motor-Driven Cycles Class 1 (50cc & Under)
YearMotor-Driven Cycles Class 2 (51cc-125cc)
Mini-Sized Motorcycles(126cc-250cc)
Small-Sized Motorcycles(Over 250cc)
Subtotal
Over 50cc
Total
50cc & Under
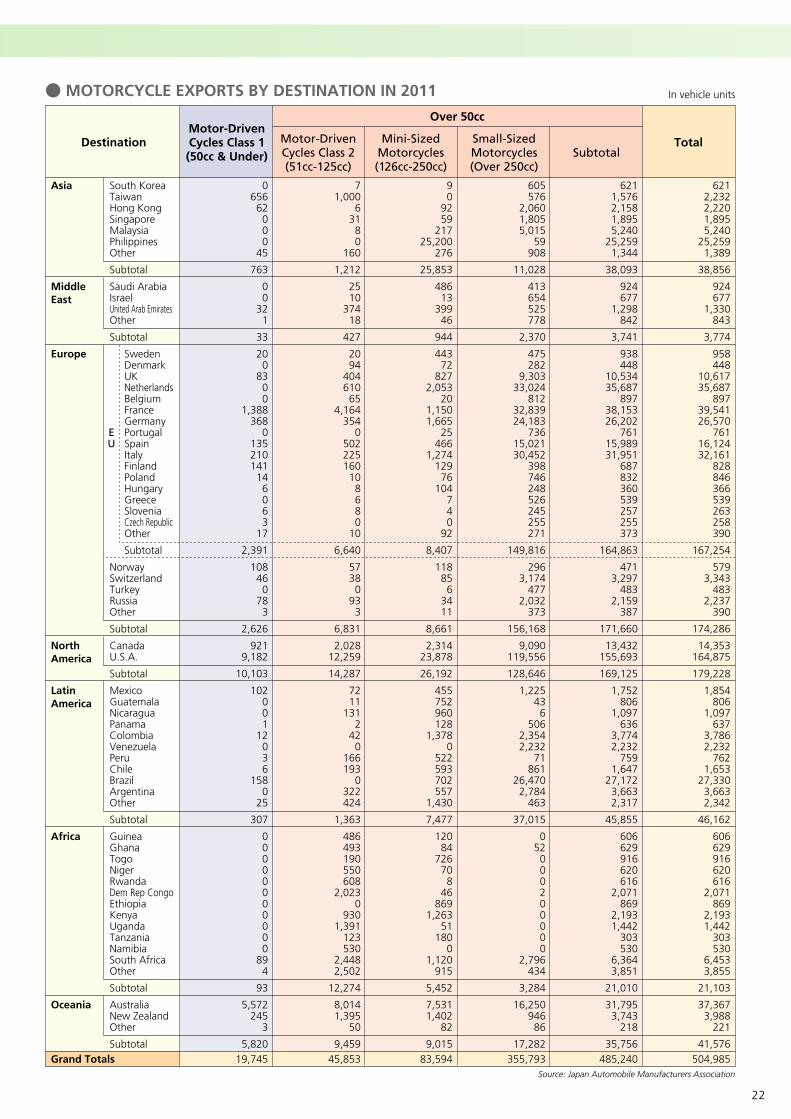
In vehicle units● MOTORCYCLE EXPORTS
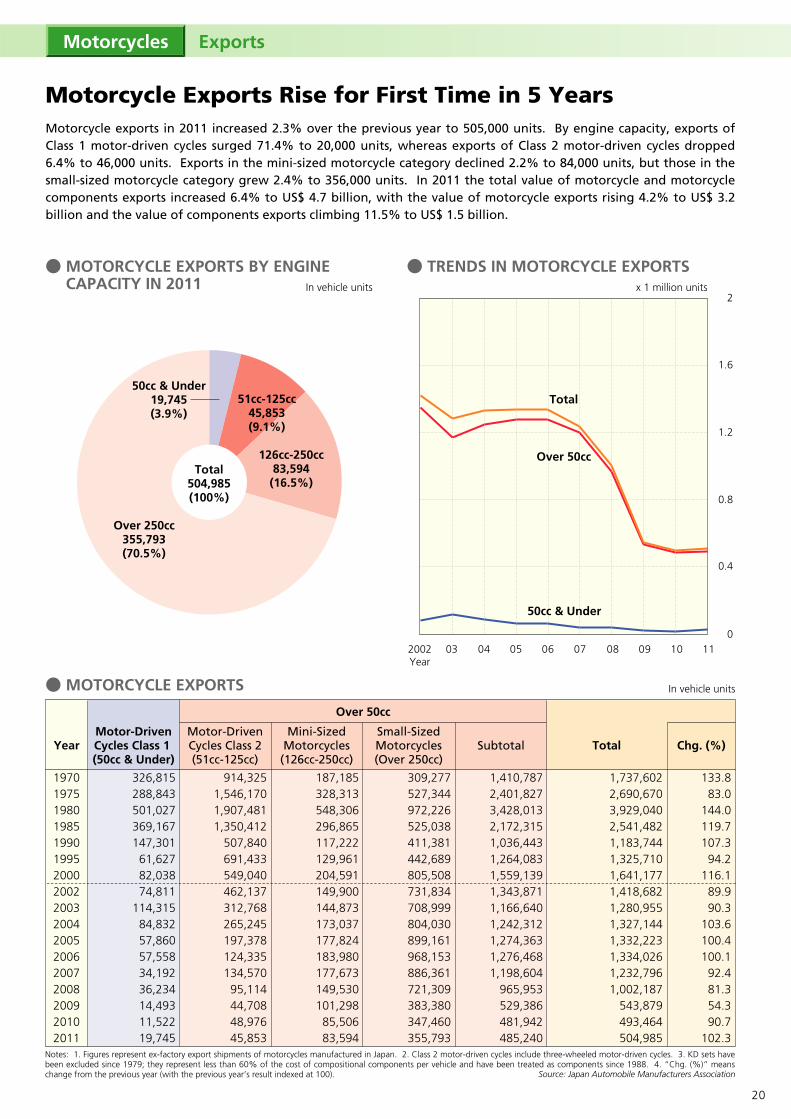
50cc & Under19,745(3.9%)
51cc-125cc45,853(9.1%)
126cc-250cc83,594(16.5%)
Over 250cc355,793(70.5%)
● MOTORCYCLE EXPORTS BY ENGINE CAPACITY IN 2011
● TRENDS IN MOTORCYCLE EXPORTS
Total504,985(100%)
Notes: 1. Figures represent ex-factory export shipments of motorcycles manufactured in Japan. 2. Class 2 motor-driven cycles include three-wheeled motor-driven cycles. 3. KD sets have been excluded since 1979; they represent less than 60% of the cost of compositional components per vehicle and have been treated as components since 1988. 4. “Chg. (%)” means change from the previous year (with the previous year’s result indexed at 100).
2002Year
03 04 05 06 07 08 09 10 110
0.4
0.8
1.2
1.6
2
Source: Japan Automobile Manufacturers Association
In vehicle units x 1 million units
Motorcycles Exports
Motorcycle Exports Rise for First Time in 5 YearsMotorcycle exports in 2011 increased 2.3% over the previous year to 505,000 units. By engine capacity, exports of Class 1 motor-driven cycles surged 71.4% to 20,000 units, whereas exports of Class 2 motor-driven cycles dropped 6.4% to 46,000 units. Exports in the mini-sized motorcycle category declined 2.2% to 84,000 units, but those in the small-sized motorcycle category grew 2.4% to 356,000 units. In 2011 the total value of motorcycle and motorcycle components exports increased 6.4% to US$ 4.7 billion, with the value of motorcycle exports rising 4.2% to US$ 3.2 billion and the value of components exports climbing 11.5% to US$ 1.5 billion.
1,737,6022,690,6703,929,0402,541,4821,183,7441,325,7101,641,1771,418,682 1,280,9551,327,1441,332,2231,334,0261,232,7961,002,187
543,879493,464504,985
133.883.0
144.0119.7107.3
94.2116.1
89.990.3
103.6100.4100.192.481.354.390.7
102.3
19701975198019851990199520002002200320042005200620072008200920102011
326,815288,843501,027369,167147,30161,62782,03874,811
114,31584,83257,86057,55834,19236,23414,49311,52219,745
914,3251,546,1701,907,4811,350,412
507,840691,433549,040462,137 312,768265,245197,378124,335134,57095,11444,70848,97645,853
187,185328,313548,306296,865117,222129,961204,591149,900 144,873173,037177,824183,980177,673149,530101,29885,50683,594
309,277527,344972,226525,038411,381442,689805,508731,834 708,999804,030899,161968,153886,361721,309383,380347,460355,793
1,410,7872,401,8273,428,0132,172,3151,036,4431,264,0831,559,1391,343,871 1,166,6401,242,3121,274,3631,276,4681,198,604
965,953529,386481,942485,240
20
2.3 2.5 2.4 2.6 2.9
2.0
0.7 0.4 0.6 0.50.6
In %● MOTORCYCLE EXPORT TRENDS (BY REGION OF DESTINATION)
NorthAmerica (U.S.A.)
Europe(EU)
Asia
AfricaLatin America
Oceania
060504032002Year
30.7
34.3 36.3
(29.1)
(32.5) (35.1)
43.3 47.6 43.3
(39.9) (43.4) (39.6)
6.2
35.0(33.8)
47.0(42.6)
07 08 09 1110
4.9
34.9(33.7)
48.1(44.7)
7.4
4.3 4.16.5 4.0 3.7
5.0
2.0
0.7 0.4 0.6 0.50.6
37.7(36.5)
40.4
3.6 3.8 3.9 4.6 5.0 5.82.3 2.5 2.4 2.6 2.9 3.1
(36.9)
● MOTORCYCLE EXPORTS BY DESTINATION IN 2011 In vehicle units
Motorcycles Exports by Destination
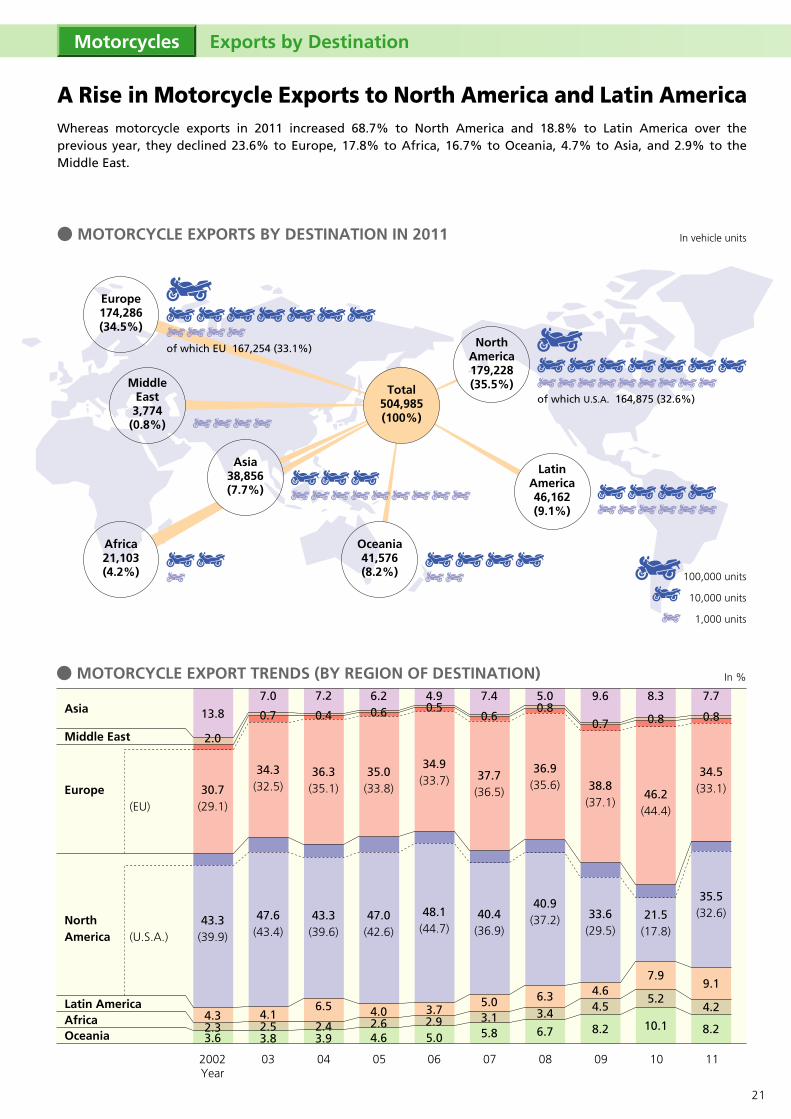
A Rise in Motorcycle Exports to North America and Latin AmericaWhereas motorcycle exports in 2011 increased 68.7% to North America and 18.8% to Latin America over the previous year, they declined 23.6% to Europe, 17.8% to Africa, 16.7% to Oceania, 4.7% to Asia, and 2.9% to the Middle East.
Europe174,286(34.5%)
Oceania41,576(8.2%)
Asia38,856(7.7%)
Total504,985(100%)
Africa21,103(4.2%)
MiddleEast
3,774(0.8%)
LatinAmerica46,162(9.1%)
13.87.0 7.2
0.85.0
6.3
0.8
36.9(35.6)
40.9
6.73.4
(37.2)
0.7
9.6
4.6
0.7
38.8(37.1)
33.6
8.2 8.2
4.5
(29.5)
0.8
8.3
7.9
0.8
46.2(44.4)
21.5
10.1
5.2
(17.8)
0.8
7.7
9.1
0.8
34.5(33.1)
35.5
4.2
(32.6)
100,000 units
10,000 units
1,000 units
NorthAmerica179,228(35.5%)
of which U.S.A. 164,875 (32.6%)
of which EU 167,254 (33.1%)
Middle East
21
● MOTORCYCLE EXPORTS BY DESTINATION IN 2011
Asia
Middle East
Europe
North America
Latin America
Africa
Oceania
Grand Totals
South KoreaTaiwanHong KongSingaporeMalaysiaPhilippinesOther
Subtotal
Saudi ArabiaIsraelUnited Arab EmiratesOther
Subtotal
SwedenDenmarkUKNetherlandsBelgiumFranceGermanyPortugalSpainItalyFinlandPolandHungaryGreeceSloveniaCzech RepublicOther
Subtotal
NorwaySwitzerlandTurkeyRussiaOther
Subtotal
CanadaU.S.A.
Subtotal
MexicoGuatemalaNicaraguaPanamaColombiaVenezuelaPeruChileBrazilArgentinaOther
Subtotal
GuineaGhanaTogoNigerRwandaDem Rep CongoEthiopiaKenyaUgandaTanzaniaNamibiaSouth AfricaOther
Subtotal
AustraliaNew ZealandOther
Subtotal
065662000
45
763
00
321
33
200
8300
1,388368
0135210141146063
17
2,391
10846
078
3
2,626
9219,182
10,103
102001
12036
1580
25
307
00000000000
894
93
5,572245
3
5,82019,745
71,000
63180
160
1,212
2510
37418
427
2094
40461065
4,164354
050222516010
8680
10
6,640
5738
093
3
6,831
2,02812,259
14,287
7211
1312
420
166193
0322424
1,363
486493190550608
2,0230
9301,391
123530
2,4482,502
12,274
8,0141,395
50
9,45945,853
90
9259
21725,200
276
25,853
48613
39946
944
44372
8272,053
201,1501,665
25466
1,27412976
104740
92
8,407
118856
3411
8,661
2,31423,878
26,192
455752960128
1,3780
522593702557
1,430
7,477
12084
726708
46869
1,26351
1800
1,120915
5,452
7,5311,402
82
9,01583,594
605576
2,0601,8055,015
59908
11,028
413654525778
2,370
475282
9,30333,024
81232,83924,183
73615,02130,452
398746248526245255271
149,816
2963,174
4772,032
373
156,168
9,090119,556
128,646
1,225436
5062,3542,232
71861
26,4702,784
463
37,015
052000200000
2,796434
3,284
16,25094686
17,282355,793
6211,5762,1581,8955,240
25,2591,344
38,093
924677
1,298842
3,741
938448
10,53435,687
89738,15326,202
76115,98931,951
687832360539257255373
164,863
4713,297
4832,159
387
171,660
13,432155,693
169,125
1,752806
1,097636
3,7742,232
7591,647
27,1723,6632,317
45,855
606629916620616
2,071869
2,1931,442
303530
6,3643,851
21,010
31,7953,743
218
35,756485,240
6212,2322,2201,8955,240
25,2591,389
38,856
924677
1,330843
3,774
958448
10,61735,687
89739,54126,570
76116,12432,161
828846366539263258390
167,254
5793,343
4832,237
390
174,286
14,353164,875
179,228
1,854806
1,097637
3,7862,232
7621,653
27,3303,6632,342
46,162
606629916620616
2,071869
2,1931,442
303530
6,4533,855
21,103
37,3673,988
221
41,576504,985
Motor-Driven Cycles Class 2 (51cc-125cc)
Mini-Sized Motorcycles (126cc-250cc)
Small-Sized Motorcycles (Over 250cc)
Subtotal
Over 50cc
TotalDestination
In vehicle units
Motor-Driven Cycles Class 1(50cc & Under)
EU
Source: Japan Automobile Manufacturers Association
22

● JAPAN’S GHG EMISSION VOLUMES: ACTUAL & TARGETED under the Kyoto ProtocolJapan’s GHG emissions in 1990 totalled 1,261 million tons (in equivalent tons of CO2). In order for Japan to meet its target under the Kyoto Protocol, it was determined that its average GHG emissions volume would have to be reduced to 1,186 million tons by the end of the first commitment period in 2012. Total GHG emissions in 2010 rose 3.9% from 2009 as a result of an increase in CO2 emissions from all sectors, and particularly the industrial sector, with the recovery of activity following the economic recession triggered by the global financial crisis in 2008. In addition, electric power demand increased owing to the relatively high number of days on which exceptionally hot or cold temperatures were recorded. GHG emissions in 2010 totalled 1,256 million tons, 0.4% below the 1990 level or 5.6% higher than the target volume. In order to achieve the “6% below 1990” target, therefore, further reduction efforts are urgently required.
Of Japan’s total CO2 emissions, the transportation sector accounts for roughly 20%, of which 90% are auto-emitted—making CO2 reduction in road transport a priority concern. With steadily declining CO2 emissions since 2001, the transport sector’s original target of an annual total of 250 million tons of CO2 emissions by 2010 was revised in 2008, to a more challenging 240-243 million tons. In fact, by means of increased vehicle fuel efficiency, road congestion mitigation, the wider practice of ecodriving and other measures, the transport sector’s CO2 emissions in 2010 totalled 232 million tons, considerably surpassing the target.
1,400
1,300
1,100
1,200
1,000
0
1,261
1,351
1,2091,186
(-6.0%)
x 1 million tons
1990(Baseline)Fiscal Year
Forest sink(3.8%)Kyotomechanisms (1.6%)
2005
1,3331,365
1,281
2006 2007 2008 2009
1,256(-0.4%)
2010(Preliminary
figure)
Targeted under the KyotoProtocol (2008-2012)
● ACTUAL & TARGETED CO2 EMISSION VOLUMES IN JAPAN’S TRANSPORT SECTOR
x 1 million tons
Sources: Kyoto Protocol Target Achievement Plan, etc.
Attention to the Environment Climate Change
Climate Change and CO2 Emissions Reduction: The Response of the Transport SectorUnder the Kyoto Protocol, adopted in 1997 by most industrialized countries to reduce CO2 and other greenhouse gas emissions and enforced in February 2005, Japan pledged to reduce its average GHG emissions volume in the first commitment period (2008-2012) to 6% below the 1990 level. In April 2005, the Japanese government formulated a target achievement plan (revised in March 2008) and then promoted diverse CO2 reduction measures in all major sectors including the industrial, consumer, and transport sectors. In line with the national initiative, the automobile industry has been making vigorous efforts with respect to increasing vehicle fuel efficiency, developing and promoting alternative-energy and next-generation vehicles, raising public awareness of eco-friendly driving practices, and supporting the government’s efforts to improve traffic flow. After peaking in 2001, CO2 emissions in Japan’s transport sector have been on a steady decline, owing largely to increased fuel efficiency in passenger cars and greater efficiency in goods distribution.
Automobiles and Society
1990Fiscal Year
91 92 93 94 95 96 97 99 2000 01 02 03 04 05 06 07 08 09 10(Preliminary
figure)
2010Targeted
200
210
220
230
240
250
260
270
280
290
300
310
320
Compliance with vehicle fuel efficiency targets, etc.
If no CO2 countermeasures taken
Source: Ministry of the Environment
Through increased vehicle fuel efficiency: Down 24.70-25.50 million tons
Through improved traffic flow: Down 32.31 million tons
Through other measures: Down 1.86-2.35 million tons
Total reduction:Down 58.87-60.16
million tons
217
229233
238
250258
263 265 264 266 265 267262 260 259
254 251245
235240-243
230 232
98
23
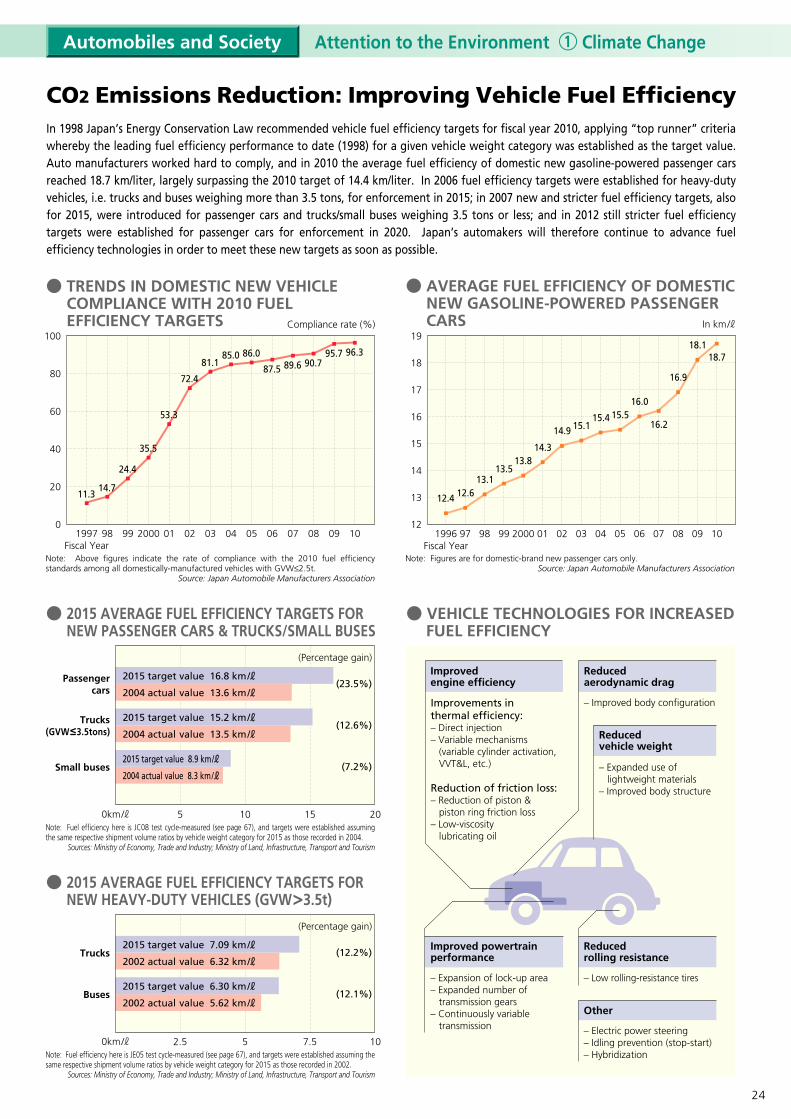
● VEHICLE TECHNOLOGIES FOR INCREASED FUEL EFFICIENCY
1996Fiscal Year
97 98 99 2000 01 02 03 04 05 06 07 08 09 10
Note: Figures are for domestic-brand new passenger cars only.Source: Japan Automobile Manufacturers Association
● AVERAGE FUEL EFFICIENCY OF DOMESTIC NEW GASOLINE-POWERED PASSENGER CARS
12.4 12.613.1
13.513.8
14.3
14.9 15.115.4
In km/
15.5
Reduced aerodynamic drag
Improved engine efficiency
– Improved body configuration
Reduced vehicle weight
– Expanded use of lightweight materials– Improved body structure
Reduced rolling resistance
Improved powertrain performance
– Expansion of lock-up area– Expanded number of transmission gears– Continuously variable transmission
Improvements in thermal efficiency: – Direct injection – Variable mechanisms (variable cylinder activation, VVT&L, etc.)
Reduction of friction loss: – Reduction of piston & piston ring friction loss– Low-viscosity lubricating oil
Other
– Electric power steering– Idling prevention (stop-start)– Hybridization
16.0
16.9
18.1
16.2
CO2 Emissions Reduction: Improving Vehicle Fuel EfficiencyIn 1998 Japan’s Energy Conservation Law recommended vehicle fuel efficiency targets for fiscal year 2010, applying “top runner” criteria whereby the leading fuel efficiency performance to date (1998) for a given vehicle weight category was established as the target value. Auto manufacturers worked hard to comply, and in 2010 the average fuel efficiency of domestic new gasoline-powered passenger cars reached 18.7 km/liter, largely surpassing the 2010 target of 14.4 km/liter. In 2006 fuel efficiency targets were established for heavy-duty vehicles, i.e. trucks and buses weighing more than 3.5 tons, for enforcement in 2015; in 2007 new and stricter fuel efficiency targets, also for 2015, were introduced for passenger cars and trucks/small buses weighing 3.5 tons or less; and in 2012 still stricter fuel efficiency targets were established for passenger cars for enforcement in 2020. Japan’s automakers will therefore continue to advance fuel efficiency technologies in order to meet these new targets as soon as possible.
Attention to the Environment Climate ChangeAutomobiles and Society
0
20
40
60
80
100
1997Fiscal Year
98 99 2000 01 02 03 04 05 06 07 08 09 10
Note: Above figures indicate the rate of compliance with the 2010 fuel efficiency standards among all domestically-manufactured vehicles with GVW≤2.5t.
Source: Japan Automobile Manufacturers Association
● TRENDS IN DOMESTIC NEW VEHICLE COMPLIANCE WITH 2010 FUEL EFFICIENCY TARGETS Compliance rate (%)
11.314.7
24.4
35.5
53.3
72.4
81.185.0 86.0
87.5 89.6 90.795.7 96.3
Note: Fuel efficiency here is JC08 test cycle-measured (see page 67), and targets were established assuming the same respective shipment volume ratios by vehicle weight category for 2015 as those recorded in 2004.
Sources: Ministry of Economy, Trade and Industry; Ministry of Land, Infrastructure, Transport and Tourism
50km/ 10 15 20
Passenger cars
(23.5%)2015 target value 16.8 km/
2004 actual value 13.6 km/
Trucks(GVW 3.5tons)
(12.6%)2015 target value 15.2 km/
2004 actual value 13.5 km/
Small buses (7.2%)2015 target value 8.9 km/
2004 actual value 8.3 km/
(Percentage gain)
● 2015 AVERAGE FUEL EFFICIENCY TARGETS FOR NEW PASSENGER CARS & TRUCKS/SMALL BUSES
Note: Fuel efficiency here is JE05 test cycle-measured (see page 67), and targets were established assuming the same respective shipment volume ratios by vehicle weight category for 2015 as those recorded in 2002.
Sources: Ministry of Economy, Trade and Industry; Ministry of Land, Infrastructure, Transport and Tourism
2.50km/ 5 7.5 10
Trucks (12.2%)2015 target value 7.09 km/
2002 actual value 6.32 km/
Buses (12.1%)2015 target value 6.30 km/
2002 actual value 5.62 km/
(Percentage gain)
● 2015 AVERAGE FUEL EFFICIENCY TARGETS FOR NEW HEAVY-DUTY VEHICLES (GVW 3.5t)
18.7
12
13
14
15
16
17
18
19
– Low rolling-resistance tires
24
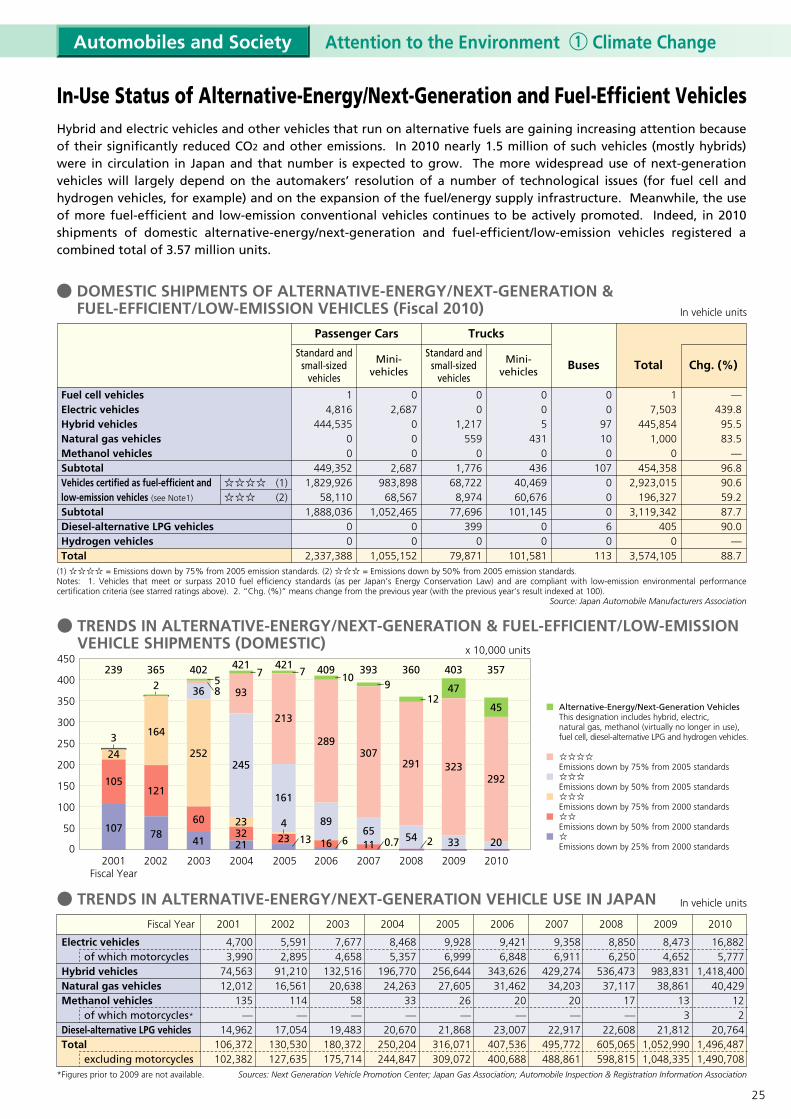
In vehicle units
● DOMESTIC SHIPMENTS OF ALTERNATIVE-ENERGY/NEXT-GENERATION & FUEL-EFFICIENT/LOW-EMISSION VEHICLES (Fiscal 2010)
14,816
444,53500
449,3521,829,926
58,1101,888,036
00
2,337,388
02,687
000
2,687983,89868,567
1,052,46500
1,055,152
00
1,217559
01,776
68,7228,974
77,696399
079,871
005
4310
43640,46960,676
101,14500
101,581
00
97100
10700060
113
17,503
445,8541,000
0454,358
2,923,015196,327
3,119,342405
03,574,105
—439.895.583.5
—96.890.659.287.790.0
—88.7
Standard and small-sized
vehicles
Passenger Cars Trucks
Mini-vehicles
Standard and small-sized
vehicles
Mini-vehicles Buses Total Chg. (%)
Fuel cell vehiclesElectric vehiclesHybrid vehiclesNatural gas vehiclesMethanol vehiclesSubtotalVehicles certified as fuel-efficient andlow-emission vehicles (see Note1)
SubtotalDiesel-alternative LPG vehiclesHydrogen vehiclesTotal
☆☆☆☆☆☆☆
(1)(2)
(1) ☆☆☆☆ = Emissions down by 75% from 2005 emission standards. (2) ☆☆☆ = Emissions down by 50% from 2005 emission standards.Notes: 1. Vehicles that meet or surpass 2010 fuel efficiency standards (as per Japan’s Energy Conservation Law) and are compliant with low-emission environmental performance certification criteria (see starred ratings above). 2. “Chg. (%)” means change from the previous year (with the previous year’s result indexed at 100).
Source: Japan Automobile Manufacturers Association
4,7003,990
74,56312,012
135—
14,962106,372102,382
5,5912,895
91,21016,561
114—
17,054130,530127,635
7,6774,658
132,51620,638
58—
19,483180,372175,714
Fiscal Year 2001 2002
8,4685,357
196,77024,263
33—
20,670250,204244,847
2003
9,9286,999
256,64427,605
26—
21,868316,071309,072
2004
9,4216,848
343,62631,462
20—
23,007407,536400,688
2005
9,3586,911
429,27434,203
20—
22,917495,772488,861
2006
8,8506,250
536,47337,117
17—
22,608605,065598,815
2007
8,4734,652
983,83138,861
133
21,8121,052,9901,048,335
2008 2009
16,8825,777
1,418,40040,429
122
20,7641,496,4871,490,708
2010
Electric vehiclesof which motorcycles
Hybrid vehiclesNatural gas vehiclesMethanol vehicles
of which motorcycles*
Diesel-alternative LPG vehiclesTotal
excluding motorcycles
● TRENDS IN ALTERNATIVE-ENERGY/NEXT-GENERATION VEHICLE USE IN JAPAN In vehicle units
107 7841 21
105121
6032
3
2 36
24524
164
252
23
239 365 402 421
● TRENDS IN ALTERNATIVE-ENERGY/NEXT-GENERATION & FUEL-EFFICIENT/LOW-EMISSION VEHICLE SHIPMENTS (DOMESTIC)
2001Fiscal Year
2002 2003 2004 2005
450
400
350
300
250
200
150
100
50
0
x 10,000 units
758
13 6 0.7 2
93
421
213
161
423
409
289
89
16
2006
393
307
6511
2007
360
291
54
2008
403
47
323
33
2009
357
45
292
20
2010
Attention to the Environment Climate ChangeAutomobiles and Society
■ Alternative-Energy/Next-Generation Vehicles■ This designation includes hybrid, electric, ■ natural gas, methanol (virtually no longer in use), ■ fuel cell, diesel-alternative LPG and hydrogen vehicles.
■ ☆☆☆☆■ Emissions down by 75% from 2005 standards ■ ☆☆☆■ Emissions down by 50% from 2005 standards ■ ☆☆☆■ Emissions down by 75% from 2000 standards ■ ☆☆■ Emissions down by 50% from 2000 standards ■ ☆■ Emissions down by 25% from 2000 standards
In-Use Status of Alternative-Energy/Next-Generation and Fuel-Efficient VehiclesHybrid and electric vehicles and other vehicles that run on alternative fuels are gaining increasing attention because of their significantly reduced CO2 and other emissions. In 2010 nearly 1.5 million of such vehicles (mostly hybrids) were in circulation in Japan and that number is expected to grow. The more widespread use of next-generation vehicles will largely depend on the automakers’ resolution of a number of technological issues (for fuel cell and hydrogen vehicles, for example) and on the expansion of the fuel/energy supply infrastructure. Meanwhile, the use of more fuel-efficient and low-emission conventional vehicles continues to be actively promoted. Indeed, in 2010 shipments of domestic alternative-energy/next-generation and fuel-efficient/low-emission vehicles registered a combined total of 3.57 million units.
7 109
12
Sources: Next Generation Vehicle Promotion Center; Japan Gas Association; Automobile Inspection & Registration Information Association*Figures prior to 2009 are not available.
25
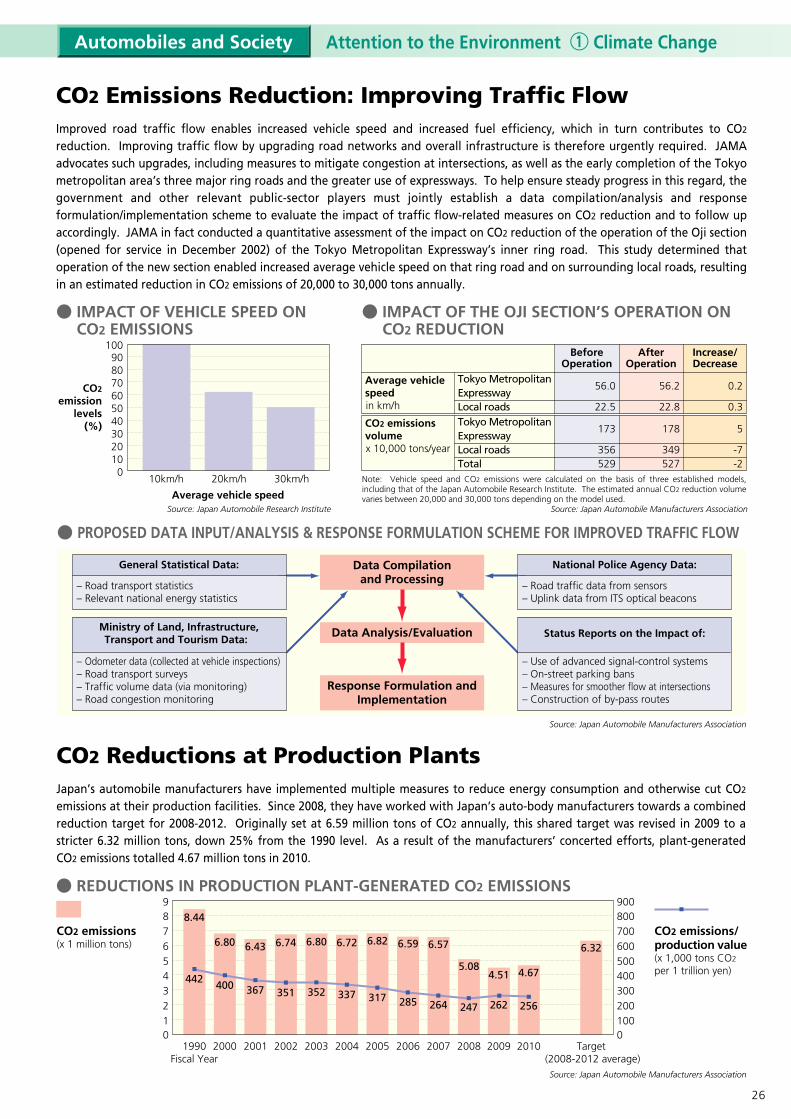
0102030405060708090
100
Automobiles and Society
● PROPOSED DATA INPUT/ANALYSIS & RESPONSE FORMULATION SCHEME FOR IMPROVED TRAFFIC FLOW
● IMPACT OF THE OJI SECTION’S OPERATION ON CO2 REDUCTION
Source: Japan Automobile Manufacturers Association
Response Formulation and Implementation
Data Analysis/Evaluation
Data Compilationand Processing– Road transport statistics �
– Relevant national energy statistics
General Statistical Data:
– Odometer data (collected at vehicle inspections) – Road transport surveys �– Traffic volume data (via monitoring) �– Road congestion monitoring
Ministry of Land, Infrastructure, Transport and Tourism Data:
– Road traffic data from sensors�– Uplink data from ITS optical beacons
National Police Agency Data:
– Use of advanced signal-control systems�– On-street parking bans�– Measures for smoother flow at intersections �– Construction of by-pass routes
Status Reports on the Impact of:
Note: Vehicle speed and CO2 emissions were calculated on the basis of three established models, including that of the Japan Automobile Research Institute. The estimated annual CO2 reduction volume varies between 20,000 and 30,000 tons depending on the model used.
Tokyo Metropolitan ExpresswayLocal roadsTokyo Metropolitan ExpresswayLocal roadsTotal
Average vehicle speedin km/h
CO2 emissions volumex 10,000 tons/year
BeforeOperation
56.0
22.5
173
356529
AfterOperation
56.2
22.8
178
349527
Increase/Decrease
0.2
0.3
5
-7-2
CO2 Emissions Reduction: Improving Traffic FlowImproved road traffic flow enables increased vehicle speed and increased fuel efficiency, which in turn contributes to CO2 reduction. Improving traffic flow by upgrading road networks and overall infrastructure is therefore urgently required. JAMA advocates such upgrades, including measures to mitigate congestion at intersections, as well as the early completion of the Tokyo metropolitan area’s three major ring roads and the greater use of expressways. To help ensure steady progress in this regard, the government and other relevant public-sector players must jointly establish a data compilation/analysis and response formulation/implementation scheme to evaluate the impact of traffic flow-related measures on CO2 reduction and to follow up accordingly. JAMA in fact conducted a quantitative assessment of the impact on CO2 reduction of the operation of the Oji section (opened for service in December 2002) of the Tokyo Metropolitan Expressway’s inner ring road. This study determined that operation of the new section enabled increased average vehicle speed on that ring road and on surrounding local roads, resulting in an estimated reduction in CO2 emissions of 20,000 to 30,000 tons annually.
Source: Japan Automobile Manufacturers AssociationSource: Japan Automobile Research Institute
● IMPACT OF VEHICLE SPEED ON CO2 EMISSIONS
Average vehicle speed
10090
CO2
emissionlevels
(%)
80706050403020100
10km/h 20km/h 30km/h
CO2 Reductions at Production PlantsJapan’s automobile manufacturers have implemented multiple measures to reduce energy consumption and otherwise cut CO2 emissions at their production facilities. Since 2008, they have worked with Japan’s auto-body manufacturers towards a combined reduction target for 2008-2012. Originally set at 6.59 million tons of CO2 annually, this shared target was revised in 2009 to a stricter 6.32 million tons, down 25% from the 1990 level. As a result of the manufacturers’ concerted efforts, plant-generated CO2 emissions totalled 4.67 million tons in 2010.
● REDUCTIONS IN PRODUCTION PLANT-GENERATED CO2 EMISSIONS
1990Fiscal Year
2000 2001 2002 2003 2004 2005 2007 20082006 Target (2008-2012 average)
9876543210
9008007006005004003002001000
Source: Japan Automobile Manufacturers Association
CO2 emissions/production value(x 1,000 tons CO2 per 1 trillion yen)
CO2 emissions(x 1 million tons)
8.44
6.80 6.43 6.74 6.80 6.72 6.82 6.59 6.57
5.08
6.32
442 400 367 351 352 337 317 285 264 247
2009
4.51
262
2010
4.67
256
Attention to the Environment Climate Change
26

Promoting Vehicles with Greater Fuel Efficiency and Lower EmissionsVehicles with greater fuel efficiency help counter global warming through their reduced emission of CO2, while vehicles with reduced tailpipe emissions help improve air quality. For gasoline, diesel, and LPG vehicles, the Japanese government has established environmental performance certification criteria keyed to Japan’s latest fuel efficiency and emission standards. Trucks and buses that comply with NOx (nitrogen oxides) and PM (particulate matter) emissions requirements are also certified, separately. To boost widespread public awareness of vehicles with advanced fuel efficiency and/or low emissions, such vehicles are identified with appropriately coded stickers.
Environmental Performance Vehicle CertificationAutomobiles and Society
● CERTIFICATION FOR VEHICLES WITH ADVANCED FUEL EFFICIENCY
Compliant +20% compared to standards
Compliant +10% compared to standards
Compliant with standards
Performing 20% better or more compared to 2015 fuel efficiency standards
Performing 10% better or more compared to 2015 fuel efficiency standards
Compliant with 2015 fuel efficiency standards
Rating/Performance Level Vehicle Sticker
For Gasoline and Diesel Vehicles Including Trucks and Buses with GVW 2.5t
Emissions down by 75% from 2005 standards
Emissions down by 50% from 2005 standards
Emissions down by 10% from 2009 standards
Rating/Performance Level Vehicle Sticker
Compliant +50% compared to standards
Compliant +38% compared to standards
Compliant +25% compared to standards
Performing 50% better or more compared to 2010 fuel efficiency standards
Performing 38% better or more compared to 2010 fuel efficiency standards
Performing 25% better or more compared to 2010 fuel efficiency standards
Rating/Performance Level Vehicle Sticker
For Gasoline and LPG Vehicles Including Trucks and Buses with GVW 2.5t
Compliant +10% compared to standards
Compliant +5% compared to standards
Compliant with standards
Performing 10% better or more compared to 2015 fuel efficiency standards
Performing 5% better or more compared to 2015 fuel efficiency standards
Compliant with 2015 fuel efficiency standards
Rating/Performance Level Vehicle Sticker
For Trucks and Buses with GVW 2.5t
● CERTIFICATION FOR TRUCKS AND BUSES WITH LOW NOx & PM EMISSIONS
Compliant with 2009 emission standards
Compliant with 2005 emission standards
Compliant with other certification criteria(see above)
Rating/Performance Level Vehicle Sticker
● CERTIFICATION FOR VEHICLES WITH LOW EMISSIONS
Note: Fuel efficiency is JC08 test cycle-measured.
Note: Fuel efficiency is JC08 or JE05 test cycle-measured.
Note: Fuel efficiency is 10 15-mode test cycle-measured.
27

Long-term regulations (1997, 1998, 1999)New short-term regulations (2003, 2004)New long-term regulations (2005) (2)
Post-new long-term regulations (2009, 2010)Future regulations (2016, 2017, 2018)
1998 standard2004 standard
2007 standard (3)
2010 standard
EURO (1995)EURO (2000) (4)
EURO (2005)
EURO (2008)
EURO (2013)
EEV (5)
NOxNitrogen
oxides
HCHydrocarbons
--
0.17 0.17 0.17
-
0.1880.188
-0.78 -
0.55 -
0.55 ---
0.40 -
NMHCNon-methanehydrocarbons
7.402.222.222.222.22
20.7820.78
20.7820.78
4.0 5.45
(2.1) 4.0
(1.5) 4.0
(1.5) 4.0
(1.5) 3.0
(1.5)
COCarbon
monoxide
0.25 0.18 0.0270.01 0.01
0.1340.134
0.0130.013
0.15 0.16 (0.10) 0.03 (0.02) 0.03 (0.02) 0.01 (0.01) 0.02 (0.02)
PMParticulate
matter
(1) GVW (gross vehicle weight) (Japan) = Vehicle weight + Maximum load + Maximum occupants x 55 kg. Weight per occupant and other details slightly differ from those of U.S. and European regulations. (2) Japan’s 1997-2004 regulations applied to the over 2.5t GVW vehicle category; regulations as of 2005 apply to the over 3.5t GVW vehicle category. (3) The U.S.’s 2007 standard permits an NOx compliance level of around 1.6g until 2010 depending on engine family type. (4) EURO (Europe): All vehicle categories were regulated in the steady state (ESC) mode only, except DPF- and NOx reduction catalyst-equipped vehicles, which were regulated in both the steady state (ESC) and transient (ETC) modes. Beginning with EURO , all vehicle categories, whether DPF- and NOx reduction catalyst-equipped or not, are regulated in both modes. (5) EEV (Europe): Enhanced Environmentally Friendly Vehicles. EEV regulations constitute a special category and are applied by EU member countries only in specific instances when urban air quality is particularly poor (for example, when temporary restrictions on vehicle circulation in cities are enforced). Emission values indicated are provisional.
● COMPARISON OF HEAVY-DUTY DIESEL TRUCK EMISSIONS REGULATIONS
4.503.382.0 0.7 0.4
5.36Automobile manufacturers must comply with one of the following:1) NOx + NMHC 3.222) NOx + NMHC 3.35 with mandatory NMHC value of 0.67
0.27 (1.6) 0.27
7.0 5.0 (5.0) 3.5 (3.5) 2.0 (2.0) 0.46(0.4) 2.0 (2.0)
2.90 0.87 ---
1.74
--
1.1 -
(0.66)-
(0.46)-
(0.46)0.16 (0.13)-
(0.25)
Transient modeSteady state modeTransient modeSteady state modeTransient modeSteady state modeTransient modeSteady state modeTransient modeSteady state mode
All regulatory values below apply to the heaviest truck categories. In g/kWh
U.S.A.(2007-)
U.S.A.(2010-)
Europe(2008-)
PM(Particulate matter)
0.70.27 0.460.4 1.6 2.00
0.010
0
0.013
0.030More stringent
In g/kWh
Note: Countries apply different test cycles based on different running patterns.
● COMPARISON OF HEAVY-DUTY DIESEL TRUCK EMISSIONS REGULATIONS (PM and NOx)
NOx (Nitrogen oxides) More stringent
Attention to the Environment EmissionsAutomobiles and Society
Japan (GVW=Over 3.5 tons) (1)
U.S.A. (GVW=Over 3.85 tons)
Europe (GVW=Over 3.5 tons)
Japan (from 2016)
Japan(2009-)
Europe (from 2013)
Vehicle Exhaust Emissions: New Regulations Enforced in 2009Japan’s vehicle exhaust emissions regulations have always been among the strictest in the world, and its automakers have worked very hard to develop the advanced technologies required to comply with them. As a result, NOx and other atmospheric pollutant levels have been on a steady decline even in large urban areas. Based on the Ministry of the Environment-affiliated Central Environment Council’s policy recommendations for future reductions in motor vehicle exhaust emissions (released in April 2005), comprehensive new regulations were implemented by the Japanese government in 2009, of which the regulations for trucks and buses were, at the time of their enforcement, the most stringent in the world. Starting in 2016, the NOx regulation for heavy-duty diesel vehicles will be even stricter.
28
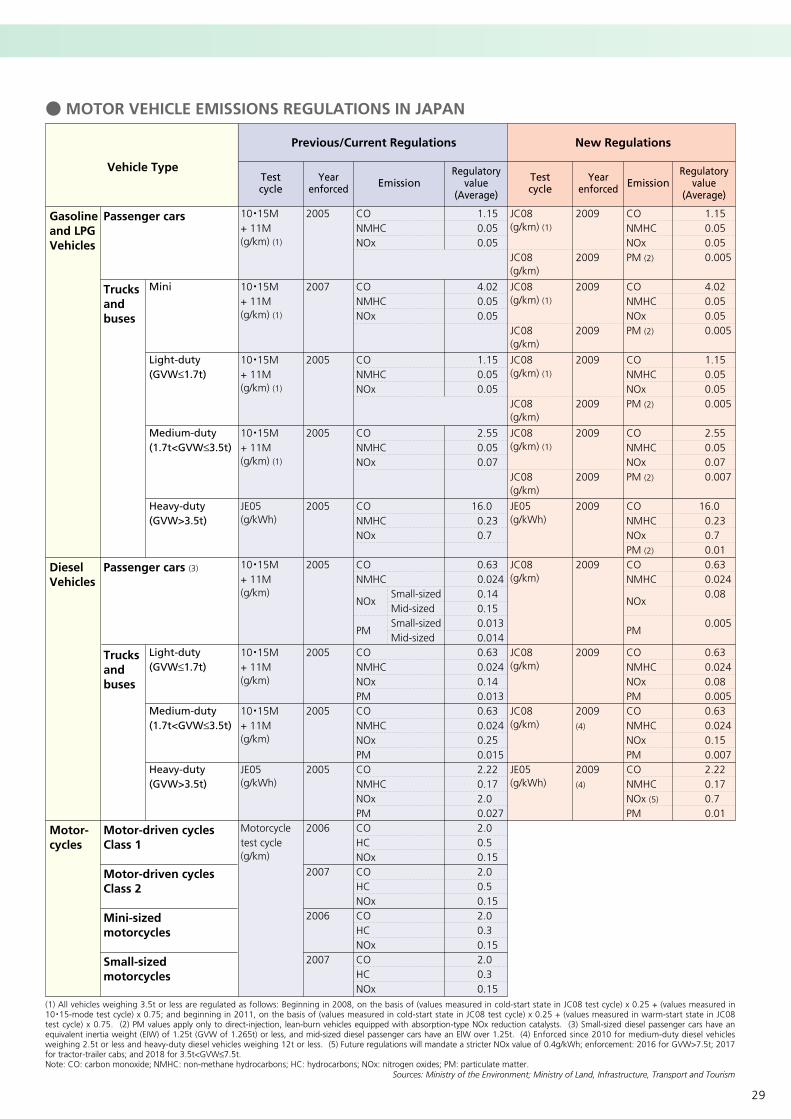
Gasoline and LPG Vehicles
Diesel Vehicles
Testcycle
Year enforced
Regulatoryvalue
(Average)
10 15M+ 11M(g/km) (1)
10 15M+ 11M(g/km) (1)
10 15M+ 11M(g/km) (1)
10 15M+ 11M(g/km) (1)
JE05(g/kWh)
10 15M+ 11M(g/km)
10 15M+ 11M(g/km)
10 15M+ 11M(g/km)
JE05(g/kWh)
Motorcycletest cycle (g/km)
2005
2007
2005
2005
2005
2005
2005
2005
2005
2006
2007
2006
2007
1.15 0.05 0.05
4.02 0.05 0.05
1.15 0.05 0.05
2.55 0.05 0.07
16.0 0.23 0.7
0.63 0.0240.14 0.15 0.0130.0140.63 0.0240.14 0.0130.63 0.0240.25 0.0152.22 0.17 2.0 0.027 2.0 0.5 0.15 2.0 0.5 0.15 2.0 0.3 0.15 2.0 0.3 0.15
CONMHCNOx
CONMHCNOx
CONMHCNOx
CONMHCNOx
CONMHCNOx
CONMHC
NOx
PM
CONMHCNOxPMCONMHCNOxPMCONMHCNOxPMCOHCNOxCOHCNOxCOHCNOxCOHCNOx
Small-sizedMid-sizedSmall-sizedMid-sized
Emission Testcycle
Yearenforced
Regulatoryvalue
(Average)Emission
Previous/Current Regulations New Regulations
Vehicle Type
Mini
Light-duty(GVW≤1.7t)
Medium-duty (1.7t<GVW≤3.5t)
Heavy-duty(GVW>3.5t)
Light-duty(GVW≤1.7t)
Medium-duty (1.7t<GVW≤3.5t)
Heavy-duty(GVW>3.5t)
(1) All vehicles weighing 3.5t or less are regulated as follows: Beginning in 2008, on the basis of (values measured in cold-start state in JC08 test cycle) x 0.25 + (values measured in 10 15-mode test cycle) x 0.75; and beginning in 2011, on the basis of (values measured in cold-start state in JC08 test cycle) x 0.25 + (values measured in warm-start state in JC08 test cycle) x 0.75. (2) PM values apply only to direct-injection, lean-burn vehicles equipped with absorption-type NOx reduction catalysts. (3) Small-sized diesel passenger cars have an equivalent inertia weight (EIW) of 1.25t (GVW of 1.265t) or less, and mid-sized diesel passenger cars have an E|W over 1.25t. (4) Enforced since 2010 for medium-duty diesel vehicles weighing 2.5t or less and heavy-duty diesel vehicles weighing 12t or less. (5) Future regulations will mandate a stricter NOx value of 0.4g/kWh; enforcement: 2016 for GVW>7.5t; 2017 for tractor-trailer cabs; and 2018 for 3.5t<GVW≤7.5t.Note: CO: carbon monoxide; NMHC: non-methane hydrocarbons; HC: hydrocarbons; NOx: nitrogen oxides; PM: particulate matter.
● MOTOR VEHICLE EMISSIONS REGULATIONS IN JAPAN
Sources: Ministry of the Environment; Ministry of Land, Infrastructure, Transport and Tourism
Passenger cars
Trucks and buses
Passenger cars (3)
Trucks andbuses
JC08(g/km) (1)
JC08(g/km)
JC08(g/km) (1)
JC08(g/km)
JC08(g/km) (1)
JC08(g/km)
JC08(g/km) (1)
JC08(g/km)
JE05 (g/kWh)
JC08 (g/km)
JC08 (g/km)
JC08 (g/km)
JE05 (g/kWh)
2009
2009
2009
2009
2009
2009
2009
2009
2009
2009
2009
2009(4)
2009(4)
1.15 0.05 0.05 0.005
4.02 0.05 0.05 0.005
1.15 0.05 0.05 0.005
2.55 0.05 0.07 0.007
16.0 0.23 0.7 0.01 0.63 0.0240.08
0.005
0.63 0.0240.08 0.0050.63 0.0240.15 0.0072.22 0.17 0.7 0.01
CONMHCNOxPM (2)
CONMHCNOxPM (2)
CONMHCNOxPM (2)
CONMHCNOxPM (2)
CONMHCNOxPM (2)
CONMHC
NOx
PM
CONMHCNOxPMCONMHCNOxPMCONMHCNOx (5)
PM
Motor-cycles
Motor-driven cyclesClass 1
Motor-driven cyclesClass 2
Mini-sized motorcycles
Small-sized motorcycles
29

............................................ 8 years etc............................... 9 years etc.
....................................... 9 years etc.............................................. 10 years etc............................................ 12 years etc.
Tokyo, Osaka, and Aichi, Chiba, Hyogo, Kanagawa, Mie, and Saitama prefectures (designated areas)
Diesel, gasoline, and LPG trucks and busesDiesel passenger cars
NOx and PM
Trucks and Buses GVW = Gross vehicle weight GVW=1.7 tons & under:
NOx Same as 1988 regulatory values for new gasoline vehicles PM Half the 2002 regulatory values for new diesel vehicles
GVW=Over 1.7 tons to 2.5 tons:NOx Same as 1994 regulatory values for new gasoline vehiclesPM Half the 2002 regulatory values for new diesel vehicles
GVW=Over 2.5 tons to 3.5 tons:NOx Same as 1995 regulatory values for new gasoline vehiclesPM Half the 2003 regulatory values for new diesel vehicles
GVW=Over 3.5 tons:NOx Same as 1998-1999 regulatory values for new diesel vehiclesPM Same as 1998-1999 regulatory values for new diesel vehicles
Passenger CarsNOx Same as 1978 regulatory values for new diesel vehiclesPM Half the 2002 regulatory values for new diesel vehicles
New VehiclesIn regulated areas, new vehicles not meeting the standards cannot be registered.
Vehicles in UseRegulated vehicles whose principal places of use (as declared in their inspection certificates) fall in regulated areas and that do not meet the standards will not be granted inspection certification after grace periods have expired.
Note: Vehicles whose principal places of use (as declared in their inspection certificates) do not fall in regulated areas can travel through regulated areas even if they do not meet the standards.
From first registration:●Small trucks●Diesel passenger cars●Standard trucks●Minibuses●Large buses
Areas Regulated
Vehicle Types
Regulated
Substances Regulated
Regulatory Valuesin Force
Specific Provisions
Grace Periods
Provisions of the National Motor Vehicle NOx& PM Emissions Act (Major Metropolitan Areas)
Provisions of PM Emission Regulationsfor Diesel Vehicles (Greater Tokyo Area Only)
● PROVISIONS OF THE NATIONAL MOTOR VEHICLE NOx & PM EMISSIONS ACT/ DIESEL-VEHICLE PM EMISSION REGULATIONS FOR THE GREATER TOKYO AREA
Tokyo (except for islands) and Chiba, Kanagawa, and Saitama prefectures (all areas)
Diesel trucks and buses
Note: Not applicable to diesel passenger vehicles with up to 10-passenger occupancy
PM only
In Chiba and Kanagawa, same as 1997, 1998, and 1999 regulatory values for new diesel vehicles
In Tokyo and Saitama, same as 2002, 2003, and 2004 regulatory values for new trucks and buses
New VehiclesNo restriction.
Vehicles in UseVehicles not meeting the standards will be prohibited from travelling through regulated areas after grace periods have expired. Vehicles equipped with local government-specified PM reduction systems are deemed to be in compliance with the standards.
Note: Applicable to diesel trucks and buses registered anywhere in Japan and travelling through regulated areas.
Seven years from first registration, regardless of vehicle type (truck or bus)
Note: Except in Chiba Prefecture, where vehicles neither registered in nor travelling through areas designated under the national Motor Vehicle NOx and PM Emissions Act will be exempted for a period of 12 years, provided vehicle owners apply for such an exemption.
Attention to the Environment Emissions
Improving Air QualityJapan’s central government as well as local governments in the greater Tokyo area have implemented measures to address air-quality problems caused by motor vehicles. In accordance with national legislation aimed at curbing nitrogen oxide (NOx) and particulate matter (PM) emissions in major metropolitan areas, the issuance of inspection-compliance certification is prohibited for vehicles that fail to meet the legal standards at inspection time. Moreover, the Tokyo metropolitan and surrounding prefectural governments have introduced additional regulations for diesel vehicles for the specific purpose of reducing PM emissions. Enforcement of these regulations means that restrictions are imposed on diesel vehicle circulation in the areas concerned.
Automobiles and Society
30
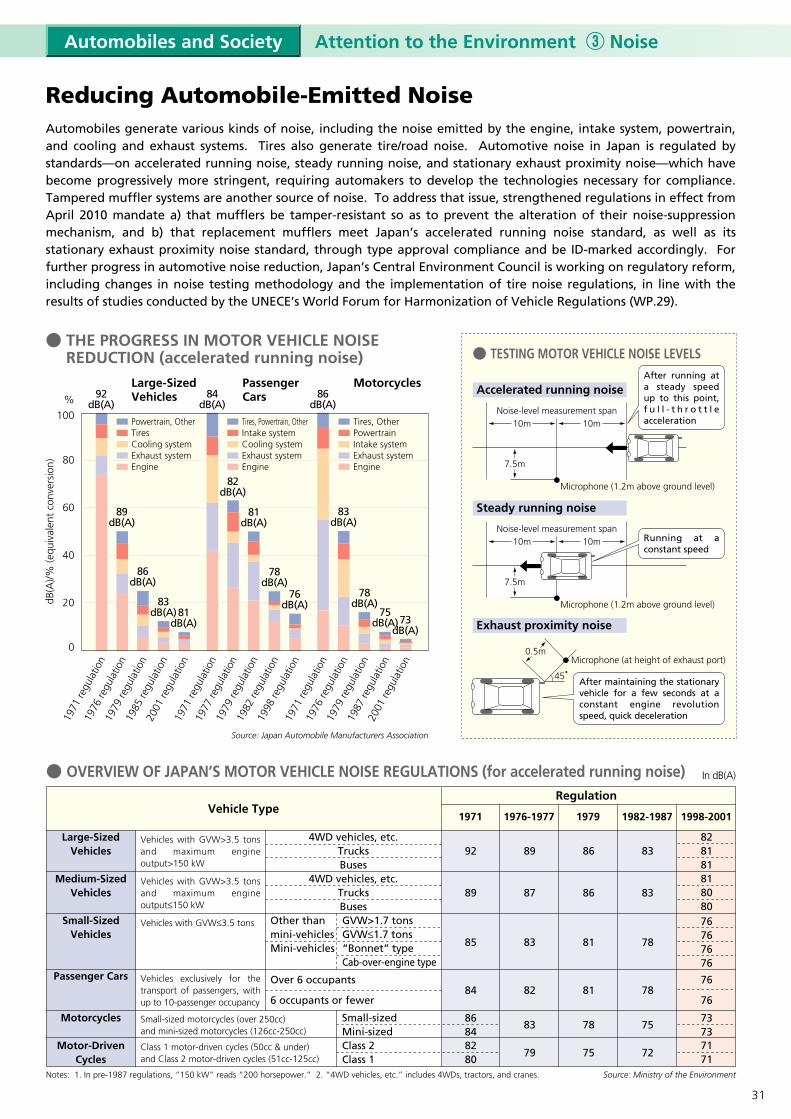
Vehicle Type1982-198719791976-19771971 1998-2001
● THE PROGRESS IN MOTOR VEHICLE NOISE REDUCTION (accelerated running noise)
Notes: 1. In pre-1987 regulations, “150 kW” reads “200 horsepower.” 2. “4WD vehicles, etc.” includes 4WDs, tractors, and cranes.
Source: Japan Automobile Manufacturers Association
Large-Sized Vehicles
Medium-Sized Vehicles
Small-Sized Vehicles
Passenger Cars
Motorcycles
Motor-Driven Cycles
Vehicles with GVW>3.5 tons and maximum engine output>150 kW
Vehicles with GVW>3.5 tons and maximum engine output≤150 kW
Vehicles with GVW≤3.5 tons
Vehicles exclusively for the transport of passengers, with up to 10-passenger occupancy
Small-sized motorcycles (over 250cc) and mini-sized motorcycles (126cc-250cc)
Class 1 motor-driven cycles (50cc & under) and Class 2 motor-driven cycles (51cc-125cc)
92 89 86 83828181
89 87 86 83818080
85 83 81 78
76767676
84 82 81 7876
76
8684
83 78 757373
8280
79 75 727171
Regulation
dB(A
)/% (e
quiv
alen
t co
nver
sion
)
● OVERVIEW OF JAPAN’S MOTOR VEHICLE NOISE REGULATIONS (for accelerated running noise)
Large-SizedVehicles
PassengerCars
Motorcycles
Powertrain, OtherTiresCooling systemExhaust systemEngine
Tires, Powertrain, OtherIntake systemCooling systemExhaust systemEngine
Tires, OtherPowertrainIntake systemExhaust systemEngine
4WD vehicles, etc.TrucksBuses
4WD vehicles, etc.TrucksBuses
Other than mini-vehiclesMini-vehicles
Over 6 occupants
6 occupants or fewer
Small-sized Mini-sized Class 2Class 1
1971
regu
latio
n19
76 re
gula
tion
1979
regu
latio
n19
85 re
gula
tion
2001
regu
latio
n19
71 re
gula
tion
1977
regu
latio
n19
79 re
gula
tion
1982
regu
latio
n19
98 re
gula
tion
0
20
40
60
80
100% 92
dB(A)
89dB(A)
86dB(A)
83dB(A)81
dB(A)
84dB(A)
82dB(A)
81dB(A)
78dB(A)
76dB(A)
1971
regu
latio
n19
76 re
gula
tion
1979
regu
latio
n19
87 re
gula
tion
2001
regu
latio
n86
dB(A)
83dB(A)
78dB(A)
75dB(A)73
dB(A)
Reducing Automobile-Emitted NoiseAutomobiles generate various kinds of noise, including the noise emitted by the engine, intake system, powertrain, and cooling and exhaust systems. Tires also generate tire/road noise. Automotive noise in Japan is regulated by standards—on accelerated running noise, steady running noise, and stationary exhaust proximity noise—which have become progressively more stringent, requiring automakers to develop the technologies necessary for compliance. Tampered muffler systems are another source of noise. To address that issue, strengthened regulations in effect from April 2010 mandate a) that mufflers be tamper-resistant so as to prevent the alteration of their noise-suppression mechanism, and b) that replacement mufflers meet Japan’s accelerated running noise standard, as well as its stationary exhaust proximity noise standard, through type approval compliance and be ID-marked accordingly. For further progress in automotive noise reduction, Japan’s Central Environment Council is working on regulatory reform, including changes in noise testing methodology and the implementation of tire noise regulations, in line with the results of studies conducted by the UNECE’s World Forum for Harmonization of Vehicle Regulations (WP.29).
Attention to the Environment NoiseAutomobiles and Society
● TESTING MOTOR VEHICLE NOISE LEVELS
Accelerated running noise
Steady running noise
Exhaust proximity noise
10m
Microphone (1.2m above ground level)
Noise-level measurement span
Noise-level measurement span
7.5m
10m
10m10m
7.5m
Microphone (1.2m above ground level)
Microphone (at height of exhaust port)0.5m
45
After running at a steady speed up to this point, f u l l - t h r o t t l e acceleration
After maintaining the stationary vehicle for a few seconds at a constant engine revolution speed, quick deceleration
Running at a constant speed
Source: Ministry of the Environment
GVW>1.7 tonsGVW≤1.7 tons“Bonnet” typeCab-over-engine type
In dB(A)
31
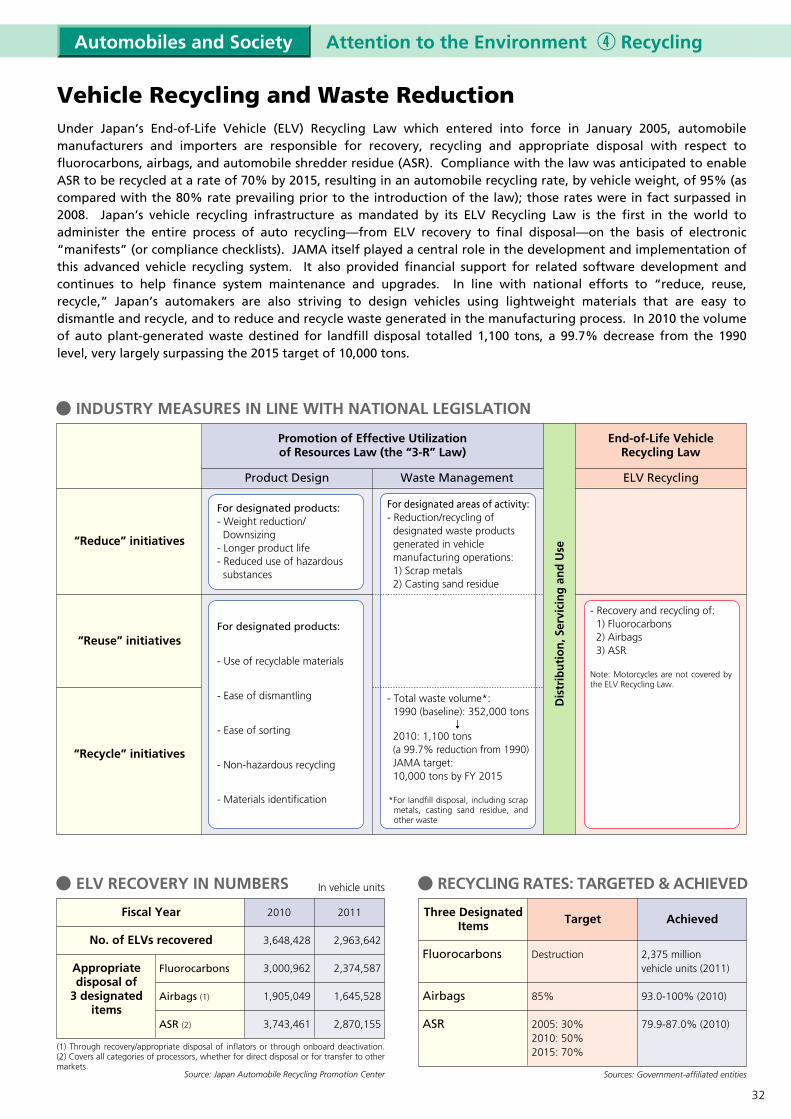
Fiscal Year
No. of ELVs recovered
Appropriate disposal of
3 designated items
2011
2,963,642
2,374,587
1,645,528
2,870,155
2010
3,648,428
3,000,962
1,905,049
3,743,461
Fluorocarbons
Airbags (1)
ASR (2)
(1) Through recovery/appropriate disposal of inflators or through onboard deactivation. (2) Covers all categories of processors, whether for direct disposal or for transfer to other markets.
Source: Japan Automobile Recycling Promotion Center
In vehicle units
● INDUSTRY MEASURES IN LINE WITH NATIONAL LEGISLATION
“Reduce” initiatives
“Reuse” initiatives
“Recycle” initiatives
For designated products:�- Weight reduction/ Downsizing- Longer product life- Reduced use of hazardous substances
For designated products:�
- Use of recyclable materials
- Ease of dismantling�
- Ease of sorting�
- Non-hazardous recycling�
- Materials identification
- Recovery and recycling of: 1) Fluorocarbons 2) Airbags� 3) ASR��Note: Motorcycles are not covered by the ELV Recycling Law.�
● RECYCLING RATES: TARGETED & ACHIEVED
Three DesignatedItems
Fluorocarbons
Airbags
ASR
Target
Destruction
85%
2005: 30%2010: 50%2015: 70%
Achieved
2,375 million vehicle units (2011)
93.0-100% (2010)
79.9-87.0% (2010)
Sources: Government-affiliated entities
Attention to the Environment Recycling
Vehicle Recycling and Waste ReductionUnder Japan’s End-of-Life Vehicle (ELV) Recycling Law which entered into force in January 2005, automobile manufacturers and importers are responsible for recovery, recycling and appropriate disposal with respect to fluorocarbons, airbags, and automobile shredder residue (ASR). Compliance with the law was anticipated to enable ASR to be recycled at a rate of 70% by 2015, resulting in an automobile recycling rate, by vehicle weight, of 95% (as compared with the 80% rate prevailing prior to the introduction of the law); those rates were in fact surpassed in 2008. Japan’s vehicle recycling infrastructure as mandated by its ELV Recycling Law is the first in the world to administer the entire process of auto recycling—from ELV recovery to final disposal—on the basis of electronic “manifests” (or compliance checklists). JAMA itself played a central role in the development and implementation of this advanced vehicle recycling system. It also provided financial support for related software development and continues to help finance system maintenance and upgrades. In line with national efforts to “reduce, reuse, recycle,” Japan’s automakers are also striving to design vehicles using lightweight materials that are easy to dismantle and recycle, and to reduce and recycle waste generated in the manufacturing process. In 2010 the volume of auto plant-generated waste destined for landfill disposal totalled 1,100 tons, a 99.7% decrease from the 1990 level, very largely surpassing the 2015 target of 10,000 tons.
Automobiles and Society
Promotion of Effective Utilizationof Resources Law (the “3-R” Law)
End-of-Life VehicleRecycling Law
Product Design Waste Management ELV Recycling
Dis
trib
utio
n, S
ervi
cing
and
Use
For designated areas of activity:- Reduction/recycling of designated waste products generated in vehicle manufacturing operations:� 1) Scrap metals� 2) Casting sand residue
- Total waste volume*:� 1990 (baseline): 352,000 tons� 2010: 1,100 tons (a 99.7% reduction from 1990) JAMA target: 10,000 tons by FY 2015�*For landfill disposal, including scrap
metals, casting sand residue, and other waste
● ELV RECOVERY IN NUMBERS
32

● THE ELV RECYCLING FLOW (as per the provisions of the End-of-Life Vehicle Recycling Law)
Delegated Funds Management Entity(Japan Automobile Recycling Promotion Center)
Delegated Information Management Entity(Japan Automobile Recycling Promotion Center)
Automobile Manufacturers/Importers/Delegated Organization(Japan Automobile Recycling Promotion Center)
Shredder ResidueRecycling Facilities
Shredder ResidueRecycling Facilities
Designated Handling Agent
Purchasers of New Vehicles
Purchasers ofUsed Vehicles
Final Owners
Dismantlers
Fluorocarbon Recovery Operators
ELVCollectors
Inspection & registration verification (MOTAS) Mini-vehicle inspection
Designated Handling Agent
Deliverymanifests
Recoverymanifests
Deliverymanifests
Recoverymanifests
Deliverymanifests
Recoverymanifests
Deliverymanifests
Recoverymanifests
AirbagDisposal Facilities
FluorocarbonDisposal* Facilities
*Fluorocarbons are destroyed.
ELVsELVs
Payment of recycling fee
ELVs
AirbagsPaymentfor recovery
Shredder residue
Fluorocarbons Payment
for recovery
Vehiclecarcasses
Remittance of recycling-fee funds
Press & Shear
Operators
To markets for recyclable parts,
metals, etc.
Shredding & Sorting Operators
Shredder Residue
Processors
Fluorocarbon & airbag disposal managed byJapan Auto Recycling Partnership (JARP)
MOTAS: Japanese-derived acronym for “motor vehicle inspection & registration system.”
Note: The Japan Automobile Recycling Promotion Center assumes the same responsibilities as automobile manufacturers and importers when an ELV has no manufacturer representation under the provisions of this law. It also assumes transport-to-mainland costs for ELVs turned in on Japan’s smallest islands. In addition, this organization provides financial assistance in the disposal of illegally abandoned vehicles.
Waste for landfill disposal(x 1,000 tons)
Total value of vehicle production including motorcycles(x 1 billion yen)
Source: Japan Automobile Manufacturers Association
1990Fiscal Year
91 92 93 94 95 96 97 98 99 2000 01 02 03 04 05 06 07 2015Target
20
15
10
5
0
25
400
300
200
100
0
500
352
302266
199171
143 131 11485 68
51 33 20 18 12 8 6 10
24.3
2
18.6 19.0 18.616.5 16.4 15.9
17.3 17.516.1 15.8
16.6 17.218.8 18.8 19.5
21.0
22.7
As a result of the efforts made by Japan’s automobile manufacturers, the total volume of auto plant-generated waste destined for landfill has decreased dramatically. Having shrunk in 2005 to 8,000 tons, down more than 97% from the 1990 baseline level and for the first time surpassing the 2015 target of 10,000 tons, plant-generated waste totalled 1,100 tons in 2010, a 99.7% decrease from the 1990 level.
● REDUCTIONS IN PRODUCTION PLANT-GENERATED WASTE
08
19.7
1.4
09
16.9
1
10
17.7
1.1
ELV flow
Information flow
Payment/fundsremittance flow
33
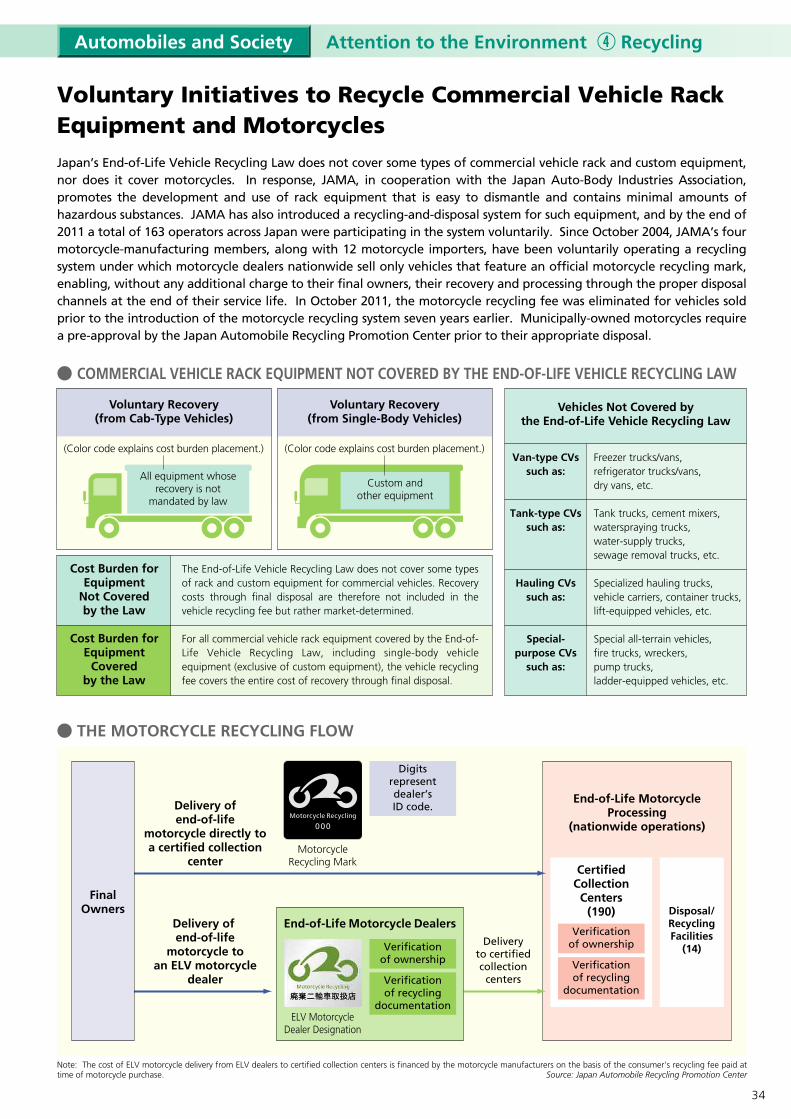
● THE MOTORCYCLE RECYCLING FLOW
● COMMERCIAL VEHICLE RACK EQUIPMENT NOT COVERED BY THE END-OF-LIFE VEHICLE RECYCLING LAW
Freezer trucks/vans,refrigerator trucks/vans, dry vans, etc.
Tank trucks, cement mixers, waterspraying trucks, water-supply trucks, sewage removal trucks, etc.
Specialized hauling trucks,vehicle carriers, container trucks, lift-equipped vehicles, etc.�
Special all-terrain vehicles,fire trucks, wreckers,pump trucks, ladder-equipped vehicles, etc.
Van-type CVssuch as:
Tank-type CVssuch as:
Hauling CVssuch as:
Special-purpose CVs
such as:
The End-of-Life Vehicle Recycling Law does not cover some types of rack and custom equipment for commercial vehicles. Recovery costs through final disposal are therefore not included in the vehicle recycling fee but rather market-determined.
For all commercial vehicle rack equipment covered by the End-of-Life Vehicle Recycling Law, including single-body vehicle equipment (exclusive of custom equipment), the vehicle recycling fee covers the entire cost of recovery through final disposal.
Cost Burden forEquipment
Not Coveredby the Law
Cost Burden forEquipment
Coveredby the Law
(Color code explains cost burden placement.)
Voluntary Recovery(from Cab-Type Vehicles)
Voluntary Recovery(from Single-Body Vehicles)
Vehicles Not Covered bythe End-of-Life Vehicle Recycling Law
Custom andother equipment
All equipment whoserecovery is not
mandated by law
(Color code explains cost burden placement.)
Attention to the Environment Recycling
Voluntary Initiatives to Recycle Commercial Vehicle Rack Equipment and MotorcyclesJapan’s End-of-Life Vehicle Recycling Law does not cover some types of commercial vehicle rack and custom equipment, nor does it cover motorcycles. In response, JAMA, in cooperation with the Japan Auto-Body Industries Association, promotes the development and use of rack equipment that is easy to dismantle and contains minimal amounts of hazardous substances. JAMA has also introduced a recycling-and-disposal system for such equipment, and by the end of 2011 a total of 163 operators across Japan were participating in the system voluntarily. Since October 2004, JAMA’s four motorcycle-manufacturing members, along with 12 motorcycle importers, have been voluntarily operating a recycling system under which motorcycle dealers nationwide sell only vehicles that feature an official motorcycle recycling mark, enabling, without any additional charge to their final owners, their recovery and processing through the proper disposal channels at the end of their service life. In October 2011, the motorcycle recycling fee was eliminated for vehicles sold prior to the introduction of the motorcycle recycling system seven years earlier. Municipally-owned motorcycles require a pre-approval by the Japan Automobile Recycling Promotion Center prior to their appropriate disposal.
Automobiles and Society
Note: The cost of ELV motorcycle delivery from ELV dealers to certified collection centers is financed by the motorcycle manufacturers on the basis of the consumer’s recycling fee paid at time of motorcycle purchase.
FinalOwners
End-of-Life MotorcycleProcessing
(nationwide operations)
End-of-Life Motorcycle DealersDelivery of end-of-life
motorcycle toan ELV motorcycle
dealer
Delivery ofend-of-life
motorcycle directly toa certified collection
center
ELV Motorcycle Dealer Designation
Source: Japan Automobile Recycling Promotion Center
CertifiedCollection
Centers(190)
Verificationof ownership
Verificationof recycling
documentation
Verificationof ownership
Digitsrepresentdealer’sID code.
Verificationof recycling
documentation
Disposal/RecyclingFacilities
(14)Delivery
to certifiedcollection
centers
Motorcycle Recycling Mark
34
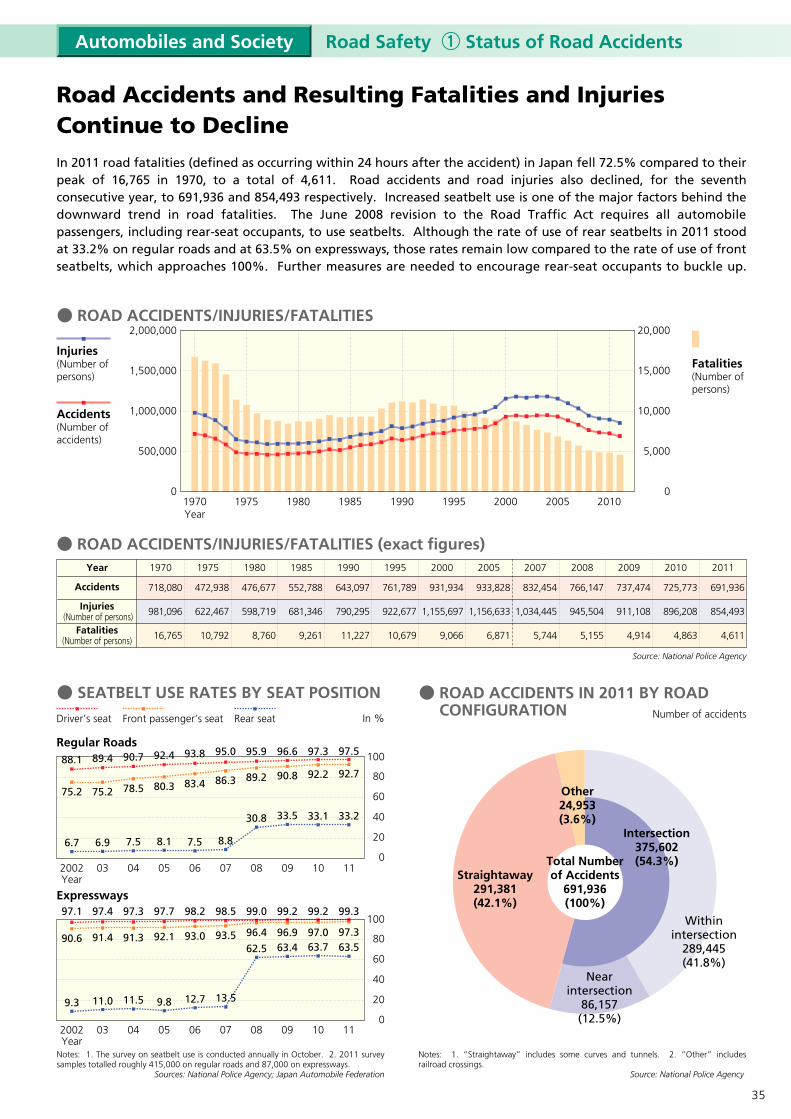
13.5
Number of accidents
Intersection375,602(54.3%)
Straightaway291,381(42.1%)
Withinintersection
289,445(41.8%)
Other24,953(3.6%)
Nearintersection
86,157(12.5%)
Notes: 1. The survey on seatbelt use is conducted annually in October. 2. 2011 survey samples totalled roughly 415,000 on regular roads and 87,000 on expressways.
Notes: 1. “Straightaway” includes some curves and tunnels. 2. “Other” includes railroad crossings.
Source: National Police Agency
● ROAD ACCIDENTS/INJURIES/FATALITIES
1970Year
20,000
15,000
10,000
5,000
0
2,000,000
1,500,000
1,000,000
500,000
0
Injuries(Number of persons)
Accidents(Number of accidents)
Fatalities(Number of persons)
1975 1980 1985 1990 1995 2000 2005
● ROAD ACCIDENTS/INJURIES/FATALITIES (exact figures)
Accidents
Injuries (Number of persons)
Fatalities(Number of persons)
931,934
1,155,697
9,066
761,789
922,677
10,679
643,097
790,295
11,227
552,788
681,346
9,261
476,677
598,719
8,760
472,938
622,467
10,792
718,080
981,096
16,765
1970 1975 1980 1985 1990 1995 2000 2005Year
● ROAD ACCIDENTS IN 2011 BY ROAD CONFIGURATION
● SEATBELT USE RATES BY SEAT POSITION
2007 2008
933,828
1,156,633
6,871
832,454
1,034,445
5,744
766,147
945,504
5,155
Source: National Police Agency
Road Accidents and Resulting Fatalities and Injuries Continue to DeclineIn 2011 road fatalities (defined as occurring within 24 hours after the accident) in Japan fell 72.5% compared to their peak of 16,765 in 1970, to a total of 4,611. Road accidents and road injuries also declined, for the seventh consecutive year, to 691,936 and 854,493 respectively. Increased seatbelt use is one of the major factors behind the downward trend in road fatalities. The June 2008 revision to the Road Traffic Act requires all automobile passengers, including rear-seat occupants, to use seatbelts. Although the rate of use of rear seatbelts in 2011 stood at 33.2% on regular roads and at 63.5% on expressways, those rates remain low compared to the rate of use of front seatbelts, which approaches 100%. Further measures are needed to encourage rear-seat occupants to buckle up.
Road Safety Status of Road AccidentsAutomobiles and Society
Total Numberof Accidents
691,936(100%)
Sources: National Police Agency; Japan Automobile Federation
In %
2002Year
0403 05 06 07
2002Year
0403 05 06 07
100
80
60
40
20
0
Regular Roads
100
80
60
40
20
0
Expressways
Driver’s seat Front passenger’s seat Rear seat
88.1 89.4 90.7 92.4 93.888.1 89.4 90.7 92.4 93.8 95.0
6.7 6.9 7.5 8.1 7.5 8.8
75.2 75.2 78.5 80.3 83.4 86.3
97.1 97.4 97.3 97.7 98.2 98.5
90.6 91.4 91.3 92.1 93.0 93.5
9.3 11.0 11.5 9.8 12.7 13.5
08
95.9
30.8
89.2
09
96.6
33.5
90.8
10 11
97.3 97.5
33.1 33.2
92.2 92.7
99.0
62.596.4
99.2
63.496.9
08 09
99.2 99.3
63.7 63.597.0 97.3
10 11
2009
737,474
911,108
4,914
2010
725,773
896,208
4,863
2011
691,936
854,493
4,611
2010
35

Anti-lock braking system (ABS) Brake assist Unfastened seatbelt warning (driver’s seat) Unfastened seatbelt warning (front passenger’s seat)Power-window jamming prevention (with auto-up function)Power-window jamming prevention (without auto-up function)High-intensity discharge headlamps Adaptive front-lighting system (AFS) Back-up monitoring (rear obstacle detection) Vehicle perimeter monitoring Vehicle perimeter obstacle warning Blind-corner monitoring Night vision monitoring Night vision “pedestrian ahead” warningCurve detection Tire pressure monitoring Driver inattention warning Inter-vehicle distance warningLane deviation warning Rear collision warning-equipped headrest control Collision-mitigation braking system (pre-crash safety)Adaptive cruise control Adaptive cruise control with low-speed following modeFull-range adaptive cruise control Lane-keeping assist Back-up monitoring (parking assistance) Navigator-based gearshift control Pre-crash seatbelts Electronic stability control Traction control with ABSNavigator-based stop sign alert with brake assistRearward-approaching-vehicle warning Emergency braking warningApproaching-vehicle warningSide airbags Curtain airbags Active head restraints ISOFIX anchorages (for child safety seats) Three-point seatbelt for rear center seat*
Total
19117019164
1837
15044
109373318
44
247
264321
84745
69
17182939
11711211
318
613013111714481
98.587.698.533.094.35.2
77.322.756.219.117.09.32.12.1
12.43.6
13.422.210.84.1
24.223.23.14.68.89.3
14.920.160.357.75.71.59.38.0
67.067.560.374.250.9
3,851,7863,716,2844,049,4101,420,6254,000,257
39,5921,764,517
223,932521,283122,156186,14181,424
1,2791,279
174,73683,881
185,59341,72723,882
3,59947,88238,84312,87717,66510,04039,16479,03728,623
1,010,588985,581119,844
1,377472,447
2,8931,086,455
988,6762,502,8173,255,0951,091,546
95.191.899.935.198.81.5
43.65.5
12.93.04.62.00.10.14.32.14.61.00.60.11.21.00.30.40.21.02.00.7
25.024.33.00.1
11.70.5
26.824.461.880.436.7
(167)(158)(191)
(64)(180)
(3)(58)(18)(21)(6)(4)(2)(0)(0)(1)(5)(1)(1)(0)(0)(2)(2)(0)(0)(0)(0)(8)(5)
(55)(54)(6)(1)
(18)(4)
(52)(49)
(112)(126)
(71)
ActiveSafety
PassiveSafety
Safety FeatureInstallation Status
In no. of models(see Note 1)
In %(see Note 2)
In vehicle units In %(see Note 2)
● SAFETY FEATURE ONBOARD INSTALLATION STATUS (for passenger cars produced in 2010 for home market)
ActiveSafety
PassiveSafety
1998Year 1999 2000 2001 2002 2003 2004 2005 2006 2007 2008 2009 2010 2011-
● VEHICLE SAFETY FEATURES & YEAR OF INTRODUCTION
Equipping More Vehicles with Advanced Safety FeaturesRoad accidents, injuries and fatalities in Japan continued to decline in 2011 (see page 38). Nevertheless, road accidents still claim thousands of lives every year in Japan and in 2011, they injured 854,493 people. Further efforts are therefore required to make the nation’s roads safer for all their users. Road safety involves three factors—vehicles, road users, and road infrastructure—and greater road safety requires that progress be made in all three areas. The automotive industry continuously strives for greater active safety by enhancing and expanding the installation rates of onboard vehicle safety equipment to help prevent accident occurrence. At the same time, it seeks to increase passive safety through enhanced structural safety and vehicle features designed to mitigate injury when accidents do occur.
Road Safety Vehicle SafetyAutomobiles and Society
194 4,049,894
Source: Japan Automobile Manufacturers Association
Source: Japan Automobile Manufacturers Association
Notes: 1. “In no. of models” indicates the number of models in which the safety feature is installed as standard or optional equipment. Figures in parentheses indicate the number of models in which the safety feature is standard equipment. 2. “In %” means as a percentage of the total number of models/units produced. 3. Passenger cars here include minicars.*In 2010 a total of 159 passenger car models (2,970,375 vehicle units) featured a rear center seat. Minicars do not feature a rear center seat.
● Inter-vehicle distance warning ● Adaptive cruise control
● Lane-keeping assist ● Blind-corner monitoring
● Night vision monitoring● Navigator-based gearshift control (ATs only) ● Adaptive front-lighting system (AFS) ● Park assist● Collision-mitigation braking system (pre-crash safety)
● Approaching-vehicle warning
● Active head restraints ● Curtain airbags ● Pedestrian protection vehicle design
● ISOFIX anchorages (for child safety seats) ● Advanced compatibility vehicle structure
● Rollover curtain airbags ● Knee airbags
● Pre-crash seatbelts● Automatic pop-up hood● Motorcycle airbags
(● With low-speed following mode) (● Full-range)
36

JAMA Initiatives in Promoting Greater Road SafetyIn April 2004, JAMA pledged its support of the Japanese government’s goal to reduce road fatalities by 50% over a period of ten years. JAMA’s own initiatives towards that goal are outlined below.
Accidents involving pedestrians or cyclists
Special measures for the elderly Greater use of seatbelts Delays in driver recognition and incorrect vehicle control
Accidents occurring at twilight/night Accidents occurring at intersections
Collisions with stationary objects Compatibility
Road Users: Public Awareness CampaignsPriority Area
For infrastructural improvements, based on the results of accident causation studies.
For more widespread roadway/sidewalk demarcation and greater barrier-free mobility.
For improved nighttime road illumination.
For road infrastructure regulations for effective utilization of ITS technologies.
For expanded provision of underground power lines and impact-absorbing road installations.
Continued implementation of road safety public awareness campaigns, based on the results of accident causation studies.
Development of road safety educational programs specifically for the elderly.
Public awareness campaigns to promote the use of seatbelts.
Campaigns aimed at preventing faulty driver recognition and incorrect vehicle control.
Campaigns to promote the early lighting of automobile headlamps.
Public awareness campaigns to encourage drivers to exercise greater caution at intersections, where the majority of fatal road accidents occur.
Vehicles: Safety Measures Road Infrastructure: Proposals to Government
● JAMA’S ROAD SAFETY INITIATIVES IN EIGHT PRIORITY AREAS
(1) Adaptive front-lighting systems. (2) Anti-lock braking systems. (3) Brake-assist systems.
Road Safety JAMA InitiativesAutomobiles and Society
Road Safety National InitiativesAutomobiles and Society
Japan’s 9th Basic Plan for Road Safety Japan’s road safety measures are promoted in line with the nation’s consecutive “basic plans” for road safety, the first of which was implemented in 1970. Under the slogan “Towards a ‘Zero Road Accidents’ Society,” the ninth road safety plan (2011-2015) aims to create a highly road safety-conscious society that places maximum priority on human life and, in particular, the safety of those of its members who are most vulnerable to road accidents—namely, pedestrians, senior citizens, and persons who are disabled. The plan emphasizes the need to pursue aggressive measures targeting further reductions in the occurrence of road accidents and fatalities.�
● JAPAN’S ROAD SAFETY TARGETS
– To reduce the annual number of road fatalities (occurring within 24 hours post-accident) to below 3,000* by 2015, and thus to make Japan’s roads the safest in the world.*Or about 3,500 when fatalities occurring within 30 days post-accident are included (based on the actual ratio in 2010)
– To reduce the total annual number of road fatalities (occurring within 24 hours post-accident) and injuries to below 700,000 by 2015.
Road Infrastructure Improvements�- Sidewalk construction/upgrades, especially in school zones - More pedestrian routes suitable for the elderly and disabled- Increased use of ITS
Promotion of Safe Driving�- Implementation of special driver-education programs for the elderly�- Vehicle fleet operation-related road accident analysis
Enforcement of Road Traffic Laws��- Strict enforcement of traffic regulations �- Stronger crackdowns on “hot-rodding” motorcyclists
Provision of Fair Compensation for Road Accident Victims�- Enhanced support for the provision of fair “damages” compensation
Road Safety Public Awareness Campaigns� �- Promotion of safe cycling - Promotion of road safety education for the elderly- Promotion of seatbelt use by all vehicle occupants - Promotion of road safety activities in local communities with the participation of residents
Enhancement of Vehicle Safety�- Expanded development and onboard application of Advanced Safety Vehicle technologies- Implementation of improvements to the national vehicle recall system- Promotion of regular vehicle checks and maintenance
Reinforcement of Emergency Rescue Operations Infrastructure�- Improved training and deployment of emergency rescue personnel�- Upgrading of emergency dispatch support systems - Promotion of doctor-staffed helicopters
Promotion of Road Safety Research and Analysis�- Promotion of further safe-driving research�- Promotion of comprehensive analysis of road accident causation
Source: Japan’s 9th Basic Plan for Road Safety
● EIGHT MAJOR AREAS OF ROAD SAFETY PROMOTIONAL ACTIVITY
More widespread application of AFS (1), ABS (2), BA (3), and stability control.
Development of technologies specifically geared to aging-related physical changes.
Research into the mechanisms of accident causation and human-machine interface conditions using data recorders, etc.
More widespread application of AFS.
More widespread application of ABS, BA, and stability control.Improvement of side-impact protection performance.
Improvement of side-impact and vehicle occupant protection performance and of side and curtain airbags.
R&D on crash-compatible vehicle bodies and compatibility evaluation methods to improve vehicle performance.
37
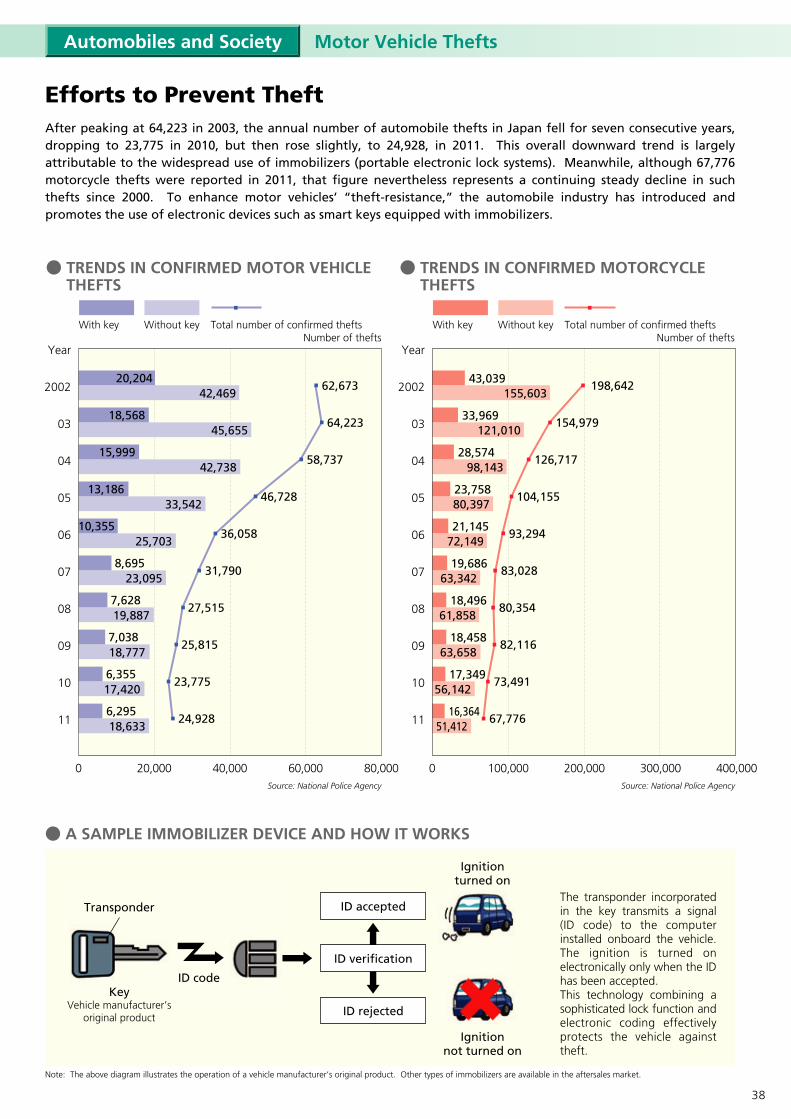
● TRENDS IN CONFIRMED MOTOR VEHICLE THEFTS
● TRENDS IN CONFIRMED MOTORCYCLE THEFTS
Year
2002
03
04
05
06
07
08
09
10
11
Year
2002
03
04
05
06
07
08
09
10
11
62,673
64,223
58,737
46,728
36,058
31,790
27,515
25,815
23,775
24,928
Total number of confirmed theftsWith key Without key Total number of confirmed theftsWith key Without key
● A SAMPLE IMMOBILIZER DEVICE AND HOW IT WORKS
The transponder incorporated in the key transmits a signal (ID code) to the computer installed onboard the vehicle. The ignition is turned on electronically only when the ID has been accepted. This technology combining a sophisticated lock function and electronic coding effectively protects the vehicle against theft.
Note: The above diagram illustrates the operation of a vehicle manufacturer’s original product. Other types of immobilizers are available in the aftersales market.
Transponder
ID verification
ID rejected
ID accepted
Ignitionturned on
Ignitionnot turned on
KeyVehicle manufacturer’s
original product
ID code
Efforts to Prevent TheftAfter peaking at 64,223 in 2003, the annual number of automobile thefts in Japan fell for seven consecutive years, dropping to 23,775 in 2010, but then rose slightly, to 24,928, in 2011. This overall downward trend is largely attributable to the widespread use of immobilizers (portable electronic lock systems). Meanwhile, although 67,776 motorcycle thefts were reported in 2011, that figure nevertheless represents a continuing steady decline in such thefts since 2000. To enhance motor vehicles’ “theft-resistance,” the automobile industry has introduced and promotes the use of electronic devices such as smart keys equipped with immobilizers.
Motor Vehicle TheftsAutomobiles and Society
Number of thefts Number of thefts
Source: National Police Agency Source: National Police Agency
0 0 100,000 200,000 300,000 400,00020,000 40,000 60,000 80,000
20,204
18,568
15,999
13,186
10,355
8,695
7,628
7,038
6,355
6,295
198,642
154,979
126,717
104,155
93,294
83,028
80,354
82,116
73,491
67,776
155,603
121,010
98,143
80,397
72,149
63,342
61,858
63,658
56,142
51,412
43,039
33,969
28,574
23,758
21,145
19,686
18,496
18,458
17,349
16,364
42,469
45,655
42,738
33,542
25,703
23,095
19,887
18,777
17,420
18,633
38

Sources: Customs tariff schedules of countries/region concerned
Buses
Trucks
Japan U.S.A. EUPassenger Cars
Bodies, parts and accessories
25%Vehicles for the transport of 10 or more persons, incl. the driver
None
Gasoline trucks, over 2800ccDiesel trucks, over 2500cc Gasoline trucks, 2800cc or under Diesel trucks, 2500cc or under
25%Cab chassis, 5t or greater in GVW
None
10%2.5%None
Components, etc.
Major components: None
Bodies, parts and accessories
China
Trucks, under 5t in GVW Gasoline trucks, 5t or greater in GVWDiesel trucks, from 5t up to 14t in GVW
25%
Major components
● AUTOMOBILE CUSTOMS TARIFFS, JAPAN/U.S.A./EU/CHINA
Automobile Customs TariffsAfter repeated reductions in tariff rates, import tariffs in Japan on finished motor vehicles and major auto components were completely abolished in 1978. Meanwhile, some countries still impose high tariffs on imported vehicles. The United States imposes a 25% tariff on imported trucks, and EU import tariffs range from 10% (on finished passenger cars) to 22% (on larger-sized trucks). China’s auto tariffs remain high despite having been progressively lowered after the country’s accession to the World Trade Organization.
Automobile Customs TariffsAutomobiles and Society
Vehicles for the transport of 10 or more persons, incl. the driverGasoline buses, over 2800ccDiesel buses, over 2500cc Gasoline buses, 2800cc or underDiesel buses, 2500cc or under
.... 2.5%
......... 2%
................... 22%
............ 10%........................ 4%
.......... 3-4.5%
.......................... 25%
.... 20%
................................ 3-10%
.................... 16%
............. 10%
● TRENDS IN DOMESTIC FREIGHT TRANSPORT VOLUMES, BY MODE
1965Fiscal Year
1975 1985 1995 2000 2001 2002 2003 2004 2005 2006
1,000
2,000
3,000
4,000
5,000
6,000
0
x 100 million tons/km
Notes: 1. As of 1987, “Road” includes transport by mini-vehicles. 2. Survey and calculation methods for “Road” data changed in 2010. 3. “Road” figures for fiscal 2010 (ending March 31, 2011) do not include data from the Tohoku region and Hokkaido as a consequence of the March 11, 2011 earthquake.
1,857
3,606
4,341
5,5895,763 5,791 5,691 5,623 5,684 5,688■ Air
■ Maritime■ Rail■ Road
5,770
2007 2008 2009 2010
5,8065,561
Motor Vehicles are Vital to Goods DistributionAccounting for 56% of Japan’s total freight transport, road transportation plays an essential role in goods distribution. With ever-expanding goods distribution, the role of motor vehicles in freight transport will become even more significant in the years ahead.
Automotive Freight TransportAutomobiles and Society
As of February 2012
484
1,297
2,059
2,946 3,116 3,116 3,106 3,205 3,2623,335 3,450 3,533 3,449
567
471
219
251221 222 221 228 225 228 232 233 223
806
1,836
2,058
2,383 2,417 2,445 2,356 2,182 2,188 2,116 2,078 2,0301,879
0.21
1.52
4.82
9.29.1 8.2 8.2 8.5 8.7 8.8 9.2 9.5
10.1 5,220
3,332
206
1,673
9.8
4,554
2,541
204
1,799
9.7
Sources: Ministry of Land, Infrastructure,Transport and Tourism, etc.
39
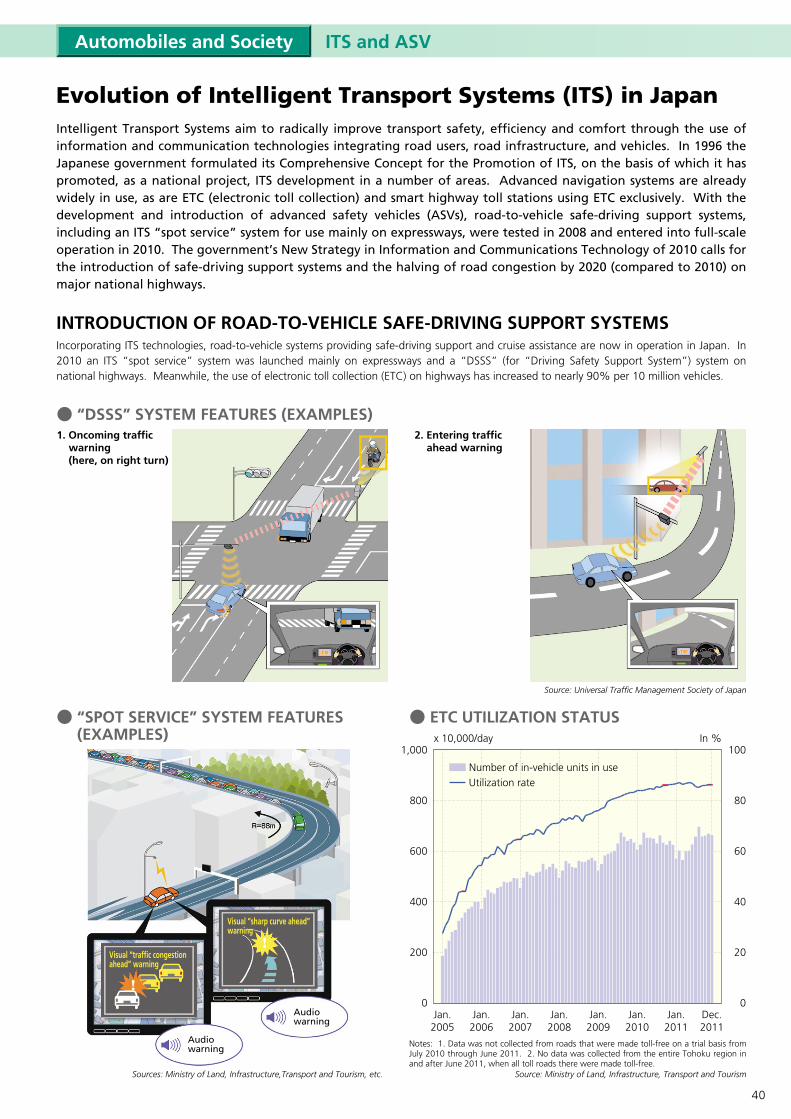
ITS and ASVAutomobiles and Society
Evolution of Intelligent Transport Systems (ITS) in JapanIntelligent Transport Systems aim to radically improve transport safety, efficiency and comfort through the use of information and communication technologies integrating road users, road infrastructure, and vehicles. In 1996 the Japanese government formulated its Comprehensive Concept for the Promotion of ITS, on the basis of which it has promoted, as a national project, ITS development in a number of areas. Advanced navigation systems are already widely in use, as are ETC (electronic toll collection) and smart highway toll stations using ETC exclusively. With the development and introduction of advanced safety vehicles (ASVs), road-to-vehicle safe-driving support systems, including an ITS “spot service” system for use mainly on expressways, were tested in 2008 and entered into full-scale operation in 2010. The government’s New Strategy in Information and Communications Technology of 2010 calls for the introduction of safe-driving support systems and the halving of road congestion by 2020 (compared to 2010) on major national highways.
INTRODUCTION OF ROAD-TO-VEHICLE SAFE-DRIVING SUPPORT SYSTEMSIncorporating ITS technologies, road-to-vehicle systems providing safe-driving support and cruise assistance are now in operation in Japan. In 2010 an ITS “spot service” system was launched mainly on expressways and a “DSSS” (for “Driving Safety Support System”) system on national highways. Meanwhile, the use of electronic toll collection (ETC) on highways has increased to nearly 90% per 10 million vehicles.
Source: Ministry of Land, Infrastructure, Transport and Tourism
Source: Universal Traffic Management Society of Japan
x 10,000/day In %
Jan.2005
Jan.2006
Jan.2007
Jan.2008
Jan.2009
Jan.2010
Jan.2011
Dec.2011
● ETC UTILIZATION STATUS
Sources: Ministry of Land, Infrastructure,Transport and Tourism, etc.
● “SPOT SERVICE” SYSTEM FEATURES (EXAMPLES)
● “DSSS” SYSTEM FEATURES (EXAMPLES)
200
1,000
600
800
400
20
100
60
80
40
0 0
Number of in-vehicle units in useUtilization rate
Notes: 1. Data was not collected from roads that were made toll-free on a trial basis from July 2010 through June 2011. 2. No data was collected from the entire Tohoku region in and after June 2011, when all toll roads there were made toll-free.
Visual “traffic congestion ahead” warning
Visual “sharp curve ahead” warning
1. Oncoming trafficwarning (here, on right turn)
2. Entering traffic ahead warning
Audio warning
Audio warning
40
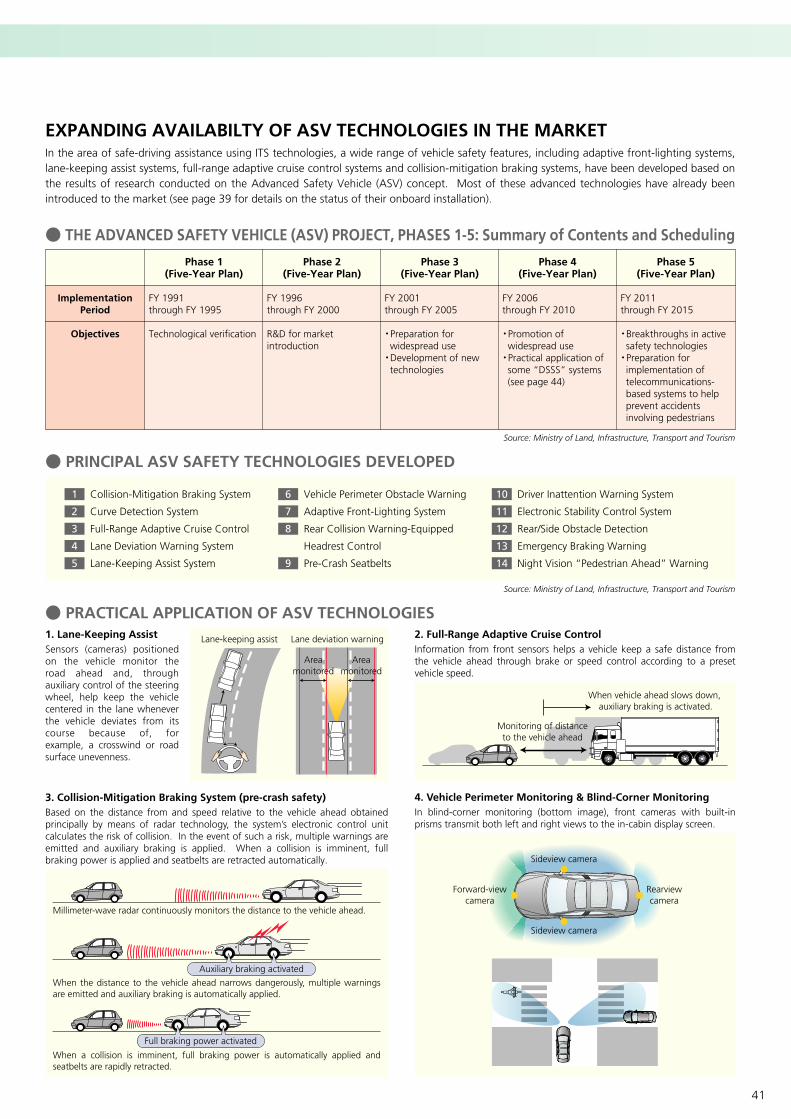
EXPANDING AVAILABILTY OF ASV TECHNOLOGIES IN THE MARKETIn the area of safe-driving assistance using ITS technologies, a wide range of vehicle safety features, including adaptive front-lighting systems, lane-keeping assist systems, full-range adaptive cruise control systems and collision-mitigation braking systems, have been developed based on the results of research conducted on the Advanced Safety Vehicle (ASV) concept. Most of these advanced technologies have already been introduced to the market (see page 39 for details on the status of their onboard installation).
● THE ADVANCED SAFETY VEHICLE (ASV) PROJECT, PHASES 1-5: Summary of Contents and Scheduling
Source: Ministry of Land, Infrastructure, Transport and Tourism
FY 1991 through FY 1995
Technological verification
Phase 1(Five-Year Plan)
FY 1996 through FY 2000
R&D for market introduction
Phase 2(Five-Year Plan)
FY 2001 through FY 2005
Preparation for widespread use
Development of new technologies
Phase 3(Five-Year Plan)
FY 2006 through FY 2010
Promotion of widespread use
Practical application of some “DSSS” systems (see page 44)
Phase 4(Five-Year Plan)
FY 2011 through FY 2015
Breakthroughs in active safety technologies
Preparation for implementation of telecommunications-based systems to help prevent accidents involving pedestrians
Phase 5(Five-Year Plan)
Implementation Period
Objectives
● PRINCIPAL ASV SAFETY TECHNOLOGIES DEVELOPED
Source: Ministry of Land, Infrastructure, Transport and Tourism
6
7
8
9
Vehicle Perimeter Obstacle Warning
Adaptive Front-Lighting System
Rear Collision Warning-Equipped
Headrest Control
Pre-Crash Seatbelts
1
2
3
4
5
Collision-Mitigation Braking System
Curve Detection System
Full-Range Adaptive Cruise Control
Lane Deviation Warning System
Lane-Keeping Assist System
10
11
12
13
14
Driver Inattention Warning System
Electronic Stability Control System
Rear/Side Obstacle Detection
Emergency Braking Warning
Night Vision “Pedestrian Ahead” Warning
● PRACTICAL APPLICATION OF ASV TECHNOLOGIES
Monitoring of distanceto the vehicle ahead
When vehicle ahead slows down, auxiliary braking is activated.
Areamonitored
Areamonitored
Lane-keeping assist Lane deviation warning1. Lane-Keeping AssistSensors (cameras) positioned on the vehicle monitor the road ahead and, through auxiliary control of the steering wheel, help keep the vehicle centered in the lane whenever the vehicle deviates from its course because of, for example, a crosswind or road surface unevenness.
2. Full-Range Adaptive Cruise ControlInformation from front sensors helps a vehicle keep a safe distance from the vehicle ahead through brake or speed control according to a preset vehicle speed.
4. Vehicle Perimeter Monitoring & Blind-Corner MonitoringIn blind-corner monitoring (bottom image), front cameras with built-in prisms transmit both left and right views to the in-cabin display screen.
3. Collision-Mitigation Braking System (pre-crash safety)Based on the distance from and speed relative to the vehicle ahead obtained principally by means of radar technology, the system’s electronic control unit calculates the risk of collision. In the event of such a risk, multiple warnings are emitted and auxiliary braking is applied. When a collision is imminent, full braking power is applied and seatbelts are retracted automatically.
Millimeter-wave radar continuously monitors the distance to the vehicle ahead.
When a collision is imminent, full braking power is automatically applied and seatbelts are rapidly retracted.
When the distance to the vehicle ahead narrows dangerously, multiple warnings are emitted and auxiliary braking is automatically applied.
Auxiliary braking activated
Full braking power activated
Sideview camera
Sideview camera
Rearviewcamera
Forward-viewcamera
41

Breakdown of Automobile-Related
Tax Revenue (estimated)77,539 (9.8%)
Business tax24,527(3.1%)
Liquor tax13,390(1.7%)
Stamp tax10,320(1.3%)
Consumption tax117,769(14.9%)
Fixed asset tax85,574(10.8%)
Tonnagetax
7,032
Automobiletax
15,677
Mini-vehicletax
1,810
Gasolinetax
26,110
Dieselhandling tax
8,902
LPG tax220
Regionalgasoline
excise tax2,793
Consumption tax (on fuels)
5,923
Corporate tax88,080(11.2%)
Other237,290(30.1%)
Income tax134,910(17.1%)
● TAX REVENUE (Estimated) BY SOURCE IN FISCAL 2012 (as per Japan’s fiscal 2012 budget)
Notes: 1. Automobile-related consumption tax revenue is not included in the “Consumption tax” segment in the chart on the left, but is included in the breakdown of automobile-related tax revenue appearing in the chart on the right. 2. Automobile-related consumption tax revenue values have been calculated by JAMA. 3. The consumption tax is a national sales tax, of which 1% of the revenue is redistributed to local government coffers. Sources: Ministry of Finance; Ministry of Internal Affairs and Communications
x 100 million yen
Taxes on Automobiles Total33,591
Taxes onFuelsTotal
43,948
Total Tax Revenue
(national andlocal taxes)
789,399(100%)
Duringownership
Whilein use
Onacquisition
Acquisitiontax
2,068Consumption tax(on automobiles)
7,004
HowAssessed
National/Local Tax
Tax Rate/Amount
Assessed on the purchase price of the automobile
National and local tax
5% (of which 1% is a local tax)
On Acquisition During OwnershipTax Category
● AUTOMOBILE-RELATED TAXES IN JAPAN (as of May 1, 2012)
Consumption Tax
Assessed on the acquisition of an automobile, whether new or used, based on the purchase price
Prefectural tax
(Private use)- 5% of purchase price
(3% for commercial and mini-vehicles)
- Exempted for vehicles purchased for 500,000 yen or less
Acquisition Tax
Assessed according to vehicle weight at each vehicle inspection
National tax
1) Vehicles complying with 2015 fuel efficiency standards: Original rates apply (¥2,500/0.5t per year for private passenger cars)
2) Vehicles on the road 18 years or longer since first registration: Previous rates apply (¥6,300/0.5t per year for private passenger cars)
3) Vehicles on the road 13 years or longer since first registration: Temporary rates apply (¥5,000/0.5t per year for private passenger cars)
4) Other vehicles for private use: - Passenger cars: ¥4,100/0.5t per year- Trucks (GVW>2.5t): ¥4,100/t per year - Trucks (GVW≤2.5t): ¥3,300/t per year- Buses: ¥4,100/t per year - Mini-vehicles: ¥3,300 per year- Motorcycles (251cc and over): ¥1,900 per year- Motorcycles (126 to 250cc): ¥4,900 upon registration
Tonnage Tax
Taxes Taxes on AutomobilesAutomobiles and Society
Note: Acquisition tax reductions/exemptions are in effect from April 1, 2012 through March 31, 2015 for eco-friendly vehicles (see pages 48-50).
Note: Additionally, tonnage tax reductions/exemptions are in effect from May 1, 2012 through April 30, 2015 for eco-friendly vehicles (see pages 48-50).
Eight Trillion Yen in Annual Automobile-Related Tax RevenueSince the initial earmarking of funds for road construction and road maintenance programs in line with Japan’s first five-year road improvement plan in 1954, there has been a steady increase both in the number of automobile-related taxes assessed on users and in their respective rates. Currently, the automobile tax structure consists of nine different taxes, creating a very heavy tax burden for Japanese motor vehicle owners. Under the government’s budget for fiscal 2012, the total value of tax revenue from these automobile-related taxes was estimated at 7.8 trillion yen, or 9.8% of Japan’s projected total tax revenue of 79 trillion yen in fiscal 2012.
42
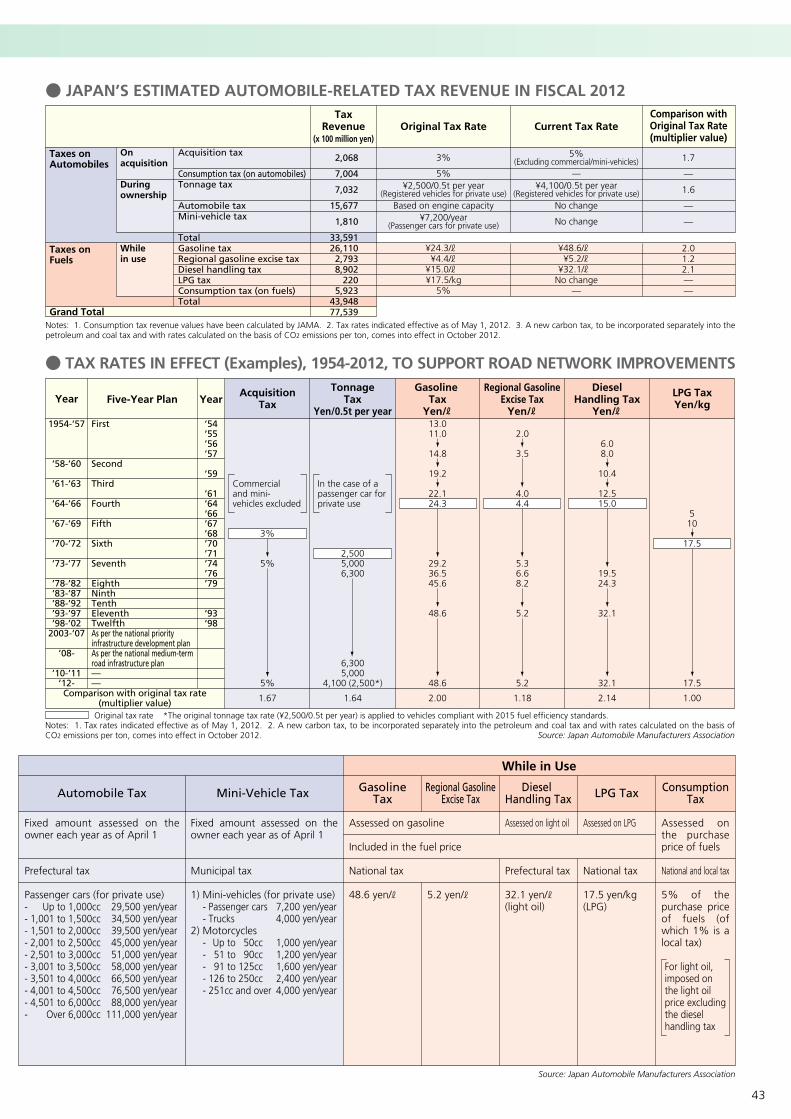
Assessed on the purchase price of fuels
National and local tax
5% of the purchase price of fuels (of which 1% is a local tax)
For light oil, imposed on the light oil price excluding the diesel handling tax
Fixed amount assessed on the owner each year as of April 1
Prefectural tax
Passenger cars (for private use)- Up to 1,000cc 29,500 yen/year- 1,001 to 1,500cc 34,500 yen/year- 1,501 to 2,000cc 39,500 yen/year- 2,001 to 2,500cc 45,000 yen/year- 2,501 to 3,000cc 51,000 yen/year- 3,001 to 3,500cc 58,000 yen/year- 3,501 to 4,000cc 66,500 yen/year- 4,001 to 4,500cc 76,500 yen/year- 4,501 to 6,000cc 88,000 yen/year- Over 6,000cc 111,000 yen/year
Automobile Tax
Fixed amount assessed on the owner each year as of April 1
Municipal tax
1) Mini-vehicles (for private use)- Passenger cars 7,200 yen/year- Trucks 4,000 yen/year
2) Motorcycles- Up to 050cc 1,000 yen/year- 051 to 090cc 1,200 yen/year- 091 to 125cc 1,600 yen/year- 126 to 250cc 2,400 yen/year- 251cc and over 4,000 yen/year
Mini-Vehicle Tax
Source: Japan Automobile Manufacturers Association
Notes: 1. Consumption tax revenue values have been calculated by JAMA. 2. Tax rates indicated effective as of May 1, 2012. 3. A new carbon tax, to be incorporated separately into the petroleum and coal tax and with rates calculated on the basis of CO2 emissions per ton, comes into effect in October 2012.
Notes: 1. Tax rates indicated effective as of May 1, 2012. 2. A new carbon tax, to be incorporated separately into the petroleum and coal tax and with rates calculated on the basis of CO2 emissions per ton, comes into effect in October 2012.
While in Use
GasolineTax
5.2 yen/
Regional GasolineExcise Tax
Assessed on light oil
Prefectural tax
32.1 yen/ (light oil)
Diesel Handling Tax
Assessed on LPG
National tax
17.5 yen/kg (LPG)
LPG Tax ConsumptionTax
● JAPAN’S ESTIMATED AUTOMOBILE-RELATED TAX REVENUE IN FISCAL 2012
● TAX RATES IN EFFECT (Examples), 1954-2012, TO SUPPORT ROAD NETWORK IMPROVEMENTS
Source: Japan Automobile Manufacturers Association
Commercial and mini- vehicles excluded
3%
5%
5%
1.67
AcquisitionTaxYearFive-Year PlanYear
In the case of a passenger car for private use
2,5005,0006,300
6,3005,000
4,100 (2,500*)
1.64
Tonnage Tax
Yen/0.5t per year13.011.0
14.8
19.2
22.124.3
29.236.545.6
48.6
48.6
2.00
Gasoline Tax
Yen/
2.0
3.5
4.04.4
5.36.68.2
5.2
5.2
1.18
Regional GasolineExcise Tax
Yen/
6.08.0
10.4
12.515.0
19.524.3
32.1
32.1
2.14
DieselHandling Tax
Yen/
510
17.5
17.5
1.00
LPG TaxYen/kg
’54’55’56’57
’59
’61’64‘66’67’68’70’71’74’76’79
’93’98
1954-’57
’58-’60
’61-’63
’64-’66
’67-’69
’70-’72
’73-’77
’78-’82’83-’87’88-’92’93-’97’98-’02
2003-’07
’08-
’10-’11’12-Comparison with original tax rate
(multiplier value)
Acquisition tax
Consumption tax (on automobiles)Tonnage tax
Automobile taxMini-vehicle tax
Total Gasoline taxRegional gasoline excise taxDiesel handling taxLPG taxConsumption tax (on fuels)Total
2,068
7,004
7,032
15,677
1,810
33,59126,1102,7938,902
2205,923
43,94877,539
3%
5%¥2,500/0.5t per year
(Registered vehicles for private use)Based on engine capacity
¥7,200/year(Passenger cars for private use)
¥24.3/ ¥4.4/ ¥15.0/ ¥17.5/kg
5%
5%(Excluding commercial/mini-vehicles)
—¥4,100/0.5t per year
(Registered vehicles for private use)No change
No change
¥48.6/ ¥5.2/
¥32.1/ No change
—
Current Tax Rate
1.7
—
1.6
—
—
2.01.22.1——
Comparison withOriginal Tax Rate(multiplier value)
On acquisition
During ownership
While in use
Taxes on Automobiles
Taxes on Fuels
Grand Total
Tax Revenue
(x 100 million yen)Original Tax Rate
Original tax rate *The original tonnage tax rate (¥2,500/0.5t per year) is applied to vehicles compliant with 2015 fuel efficiency standards.
First
Second
Third
Fourth
Fifth
Sixth
Seventh
Eighth NinthTenthEleventhTwelfthAs per the national priority infrastructure development planAs per the national medium-term road infrastructure plan——
Assessed on gasoline
Included in the fuel price National tax
48.6 yen/
43
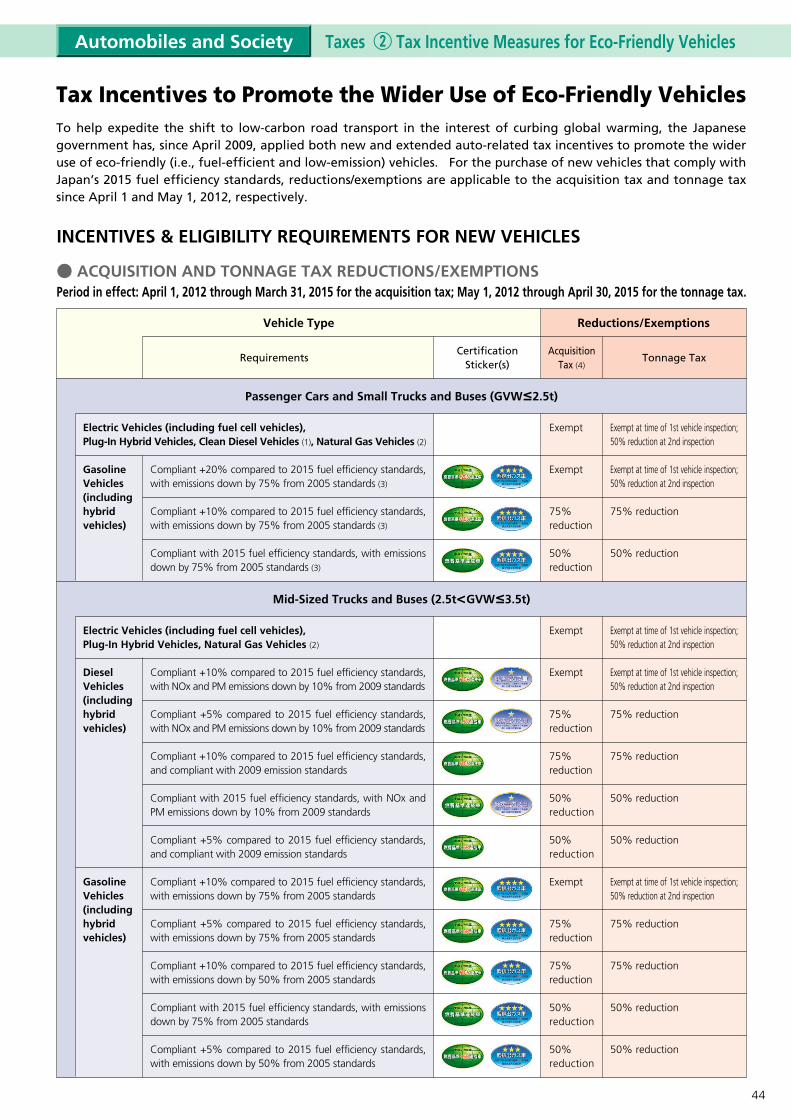
Tax Incentives to Promote the Wider Use of Eco-Friendly VehiclesTo help expedite the shift to low-carbon road transport in the interest of curbing global warming, the Japanese government has, since April 2009, applied both new and extended auto-related tax incentives to promote the wider use of eco-friendly (i.e., fuel-efficient and low-emission) vehicles. For the purchase of new vehicles that comply with Japan’s 2015 fuel efficiency standards, reductions/exemptions are applicable to the acquisition tax and tonnage tax since April 1 and May 1, 2012, respectively.
Taxes Tax Incentive Measures for Eco-Friendly VehiclesAutomobiles and Society
INCENTIVES & ELIGIBILITY REQUIREMENTS FOR NEW VEHICLES
● ACQUISITION AND TONNAGE TAX REDUCTIONS/EXEMPTIONSPeriod in effect: April 1, 2012 through March 31, 2015 for the acquisition tax; May 1, 2012 through April 30, 2015 for the tonnage tax.
Vehicle Type
Passenger Cars and Small Trucks and Buses (GVW 2.5t)
Compliant +20% compared to 2015 fuel efficiency standards, with emissions down by 75% from 2005 standards (3)
Compliant +10% compared to 2015 fuel efficiency standards, with emissions down by 75% from 2005 standards (3)
Compliant with 2015 fuel efficiency standards, with emissions down by 75% from 2005 standards (3)
CertificationSticker(s)
RequirementsAcquisition
Tax (4)
Reductions/Exemptions
Exempt
Exempt
75% reduction
50% reduction
Tonnage Tax
Exempt at time of 1st vehicle inspection; 50% reduction at 2nd inspection
Exempt at time of 1st vehicle inspection; 50% reduction at 2nd inspection
75% reduction
50% reduction
Mid-Sized Trucks and Buses (2.5t GVW 3.5t)
Compliant +10% compared to 2015 fuel efficiency standards, with NOx and PM emissions down by 10% from 2009 standards
Compliant +5% compared to 2015 fuel efficiency standards, with NOx and PM emissions down by 10% from 2009 standards
Compliant +10% compared to 2015 fuel efficiency standards, and compliant with 2009 emission standards
Compliant with 2015 fuel efficiency standards, with NOx and PM emissions down by 10% from 2009 standards
Compliant +5% compared to 2015 fuel efficiency standards, and compliant with 2009 emission standards
Compliant +10% compared to 2015 fuel efficiency standards, with emissions down by 75% from 2005 standards
Compliant +5% compared to 2015 fuel efficiency standards, with emissions down by 75% from 2005 standards
Compliant +10% compared to 2015 fuel efficiency standards, with emissions down by 50% from 2005 standards
Compliant with 2015 fuel efficiency standards, with emissions down by 75% from 2005 standards
Compliant +5% compared to 2015 fuel efficiency standards, with emissions down by 50% from 2005 standards
Exempt
Exempt
75% reduction
75% reduction
50% reduction
50% reduction
Exempt
75% reduction
75% reduction
50% reduction
50% reduction
Exempt at time of 1st vehicle inspection; 50% reduction at 2nd inspection
Exempt at time of 1st vehicle inspection; 50% reduction at 2nd inspection
75% reduction
75% reduction
50% reduction
50% reduction
Exempt at time of 1st vehicle inspection; 50% reduction at 2nd inspection
75% reduction
75% reduction
50% reduction
50% reduction
Electric Vehicles (including fuel cell vehicles), Plug-In Hybrid Vehicles, Clean Diesel Vehicles (1), Natural Gas Vehicles (2)
GasolineVehicles(includinghybridvehicles)
Electric Vehicles (including fuel cell vehicles), Plug-In Hybrid Vehicles, Natural Gas Vehicles (2)
DieselVehicles(includinghybridvehicles)
GasolineVehicles(includinghybridvehicles)
44
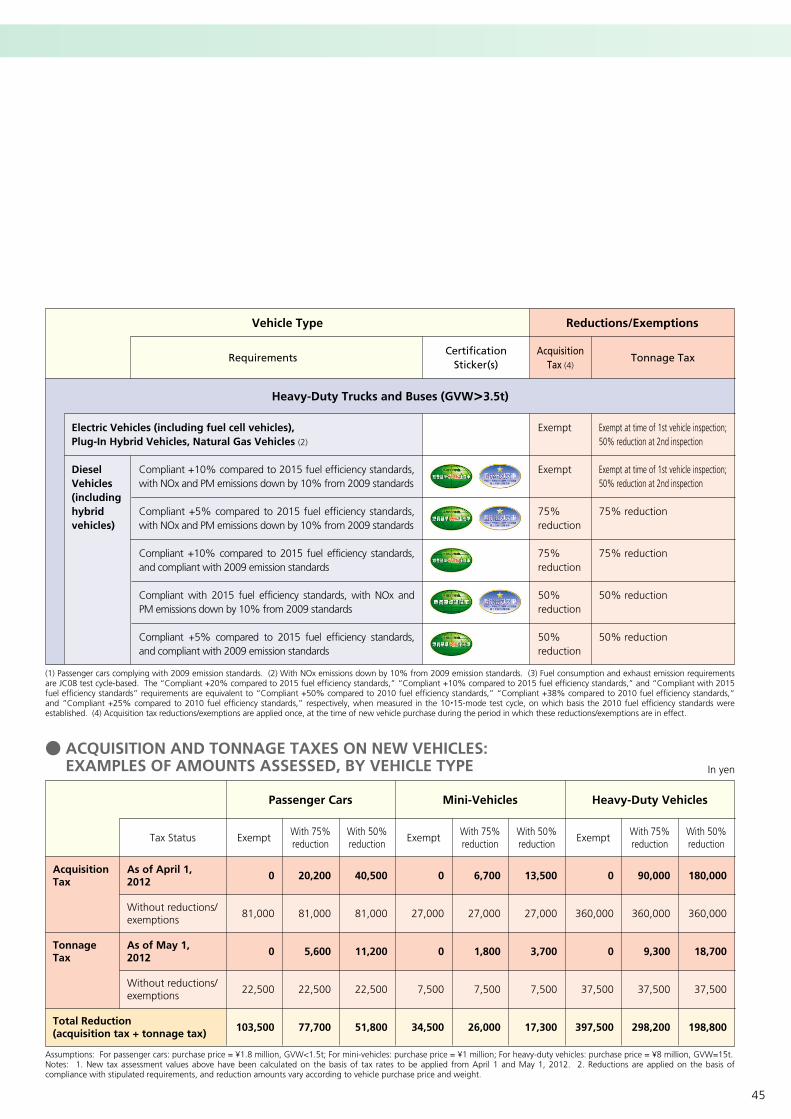
As of April 1,2012
Without reductions/exemptions
As of May 1,2012
Without reductions/exemptions
Heavy-Duty Vehicles
With 50%reduction
180,000
360,000
18,700
37,500
198,800
With 75%reduction
90,000
360,000
9,300
37,500
298,200
Exempt
0
360,000
0
37,500
397,500
Mini-Vehicles
With 50%reduction
13,500
27,000
3,700
7,500
17,300
With 75%reduction
6,700
27,000
1,800
7,500
26,000
Exempt
0
27,000
0
7,500
34,500
Passenger Cars
With 50%reduction
40,500
81,000
11,200
22,500
51,800
With 75%reduction
20,200
81,000
5,600
22,500
77,700
Exempt
0
81,000
0
22,500
103,500
Tax Status
Vehicle Type
CertificationSticker(s)
RequirementsAcquisition
Tax (4)
Reductions/Exemptions
Tonnage Tax
Heavy-Duty Trucks and Buses (GVW 3.5t)
Compliant +10% compared to 2015 fuel efficiency standards, with NOx and PM emissions down by 10% from 2009 standards
Compliant +5% compared to 2015 fuel efficiency standards, with NOx and PM emissions down by 10% from 2009 standards
Compliant +10% compared to 2015 fuel efficiency standards, and compliant with 2009 emission standards
Compliant with 2015 fuel efficiency standards, with NOx and PM emissions down by 10% from 2009 standards
Compliant +5% compared to 2015 fuel efficiency standards, and compliant with 2009 emission standards
Exempt
Exempt
75% reduction
75% reduction
50% reduction
50% reduction
Exempt at time of 1st vehicle inspection; 50% reduction at 2nd inspection
Exempt at time of 1st vehicle inspection; 50% reduction at 2nd inspection
75% reduction
75% reduction
50% reduction
50% reduction
Electric Vehicles (including fuel cell vehicles),Plug-In Hybrid Vehicles, Natural Gas Vehicles (2)
DieselVehicles(includinghybridvehicles)
Assumptions: For passenger cars: purchase price = ¥1.8 million, GVW<1.5t; For mini-vehicles: purchase price = ¥1 million; For heavy-duty vehicles: purchase price = ¥8 million, GVW=15t.Notes: 1. New tax assessment values above have been calculated on the basis of tax rates to be applied from April 1 and May 1, 2012. 2. Reductions are applied on the basis of compliance with stipulated requirements, and reduction amounts vary according to vehicle purchase price and weight.
AcquisitionTax
TonnageTax
Total Reduction(acquisition tax + tonnage tax)
● ACQUISITION AND TONNAGE TAXES ON NEW VEHICLES: EXAMPLES OF AMOUNTS ASSESSED, BY VEHICLE TYPE In yen
(1) Passenger cars complying with 2009 emission standards. (2) With NOx emissions down by 10% from 2009 emission standards. (3) Fuel consumption and exhaust emission requirements are JC08 test cycle-based. The “Compliant +20% compared to 2015 fuel efficiency standards,” “Compliant +10% compared to 2015 fuel efficiency standards,” and “Compliant with 2015 fuel efficiency standards” requirements are equivalent to “Compliant +50% compared to 2010 fuel efficiency standards,” “Compliant +38% compared to 2010 fuel efficiency standards,” and “Compliant +25% compared to 2010 fuel efficiency standards,” respectively, when measured in the 10 15-mode test cycle, on which basis the 2010 fuel efficiency standards were established. (4) Acquisition tax reductions/exemptions are applied once, at the time of new vehicle purchase during the period in which these reductions/exemptions are in effect.
45

● ACQUISITION AND TONNAGE TAX REDUCTIONS/EXEMPTIONS FOR HEAVY-DUTY VEHICLES EQUIPPED WITH ADVANCED SAFETY FEATURES AND PUBLIC-USE ASSISTED-MOBILITY VEHICLESPeriod in effect: April 1, 2012 through March 31, 2015 for the acquisition tax; May 1, 2012 through April 30, 2015 for the tonnage tax.
Low-floor (“non-step”) buses (for use in public transport)
Buses equipped with an electric lift (for use in public transport)
Universal design-based taxis (for use in public transport)
¥3.5 million deduction from purchase price (1), (2)
¥10 million deduction from purchase price (2)
For large buses (occupancy≥30 persons), ¥6.5 million deduction from purchase price (2)For small buses (occupancy<30 persons), ¥2 million deduction from purchase price (2)
¥1.0 million deduction from purchase price (2)
50% reduction (1), (3)
Exempt (3)
Exempt (3)
Exempt (3)
Vehicle Type
Compliant +10% compared to 2015 fuel efficiency standards, with emissions down by 75% from 2005 standards (2)
Compliant with 2015 fuel efficiency standards, with emissions down by 75% from 2005 standards (2)
50% reduction approximately (3)
25% reduction approximately (3)
ReductionCertification Stickers
Acquisition Tax
Reductions/Exemptions
Tonnage Tax
Trucks (GVW>8t) and Tractors (GVW>13t) �equipped with a collision-mitigation braking system
Assisted-MobilityVehicles
Taxes Tax Incentive Measures for Eco-Friendly VehiclesAutomobiles and Society
(1) For large trucks (GVW>22t) and some tractors (GVW>13t), period in effect: April 1, 2012 through October 31, 2014. (2) Deductions are applied once, at the time of first registration. (3) Reductions/exemptions are applied once, at the time of first mandatory vehicle inspection. Notes: 1. Acquisition tax is assessed on the amount remaining after deduction. 2. The above tonnage tax reduction/exemptions do not apply to vehicles targeted by this scheme that are eligible for the tonnage tax reductions/exemptions prescribed for eco-friendly vehicles (see page 48), to which the latter measures only are applied. Regarding the acquisition tax, owners of vehicles covered under this scheme can opt either for the deductions indicated here or for the acquisition tax reductions/exemptions prescribed for eco-friendly vehicles (see page 48).
*Also applies to trucks and buses (2.5t<GVW>3.5t, gasoline vehicles only) certified as fuel-efficient and low-emission vehicles.�(1) Applies additionally to electric (including fuel cell) vehicles, plug-in hybrid vehicles and natural gas vehicles (with NOx emissions down by 10% from 2009 standards). (2) Fuel consumption and exhaust emission requirements are JC08 test cycle-based, with “Compliant +10% compared to 2015 fuel efficiency standards” and “Compliant with 2015 fuel efficiency standards” being equivalent to “Compliant +38% compared to 2010 fuel efficiency standards” and “Compliant +25% compared to 2010 fuel efficiency standards,” respectively, when measured in the 10 15-mode test cycle, on which basis the 2010 fuel efficiency standards were established. (3) For eligible vehicles newly registered in 2012 and 2013, the automobile tax reduction is applied in the year subsequent to the year of registration.Note: This scheme also mandates a yearly 10% surcharge on the automobile tax for diesel vehicles on the road 11 years or longer, and for gasoline and LPG-powered vehicles on the road 13 years or longer, since first registration.
● FISCAL 2012-2013 AUTOMOBILE TAX REDUCTIONS FOR PASSENGER CARS AND SMALL TRUCKS AND BUSES (GVW 2.5t) *
Compliant +20% compared to 2015 fuel efficiency standards, with emissions down by 75% from 2005 standards (2)
Compliant +10% compared to 2015 fuel efficiency standards, with emissions down by 75% from 2005 standards (2)
Compliant with 2015 fuel efficiency standards, with emissions down by 75% from 2005 standards (2)
¥450,000 deduction from purchase price
¥300,000 deduction from purchase price
¥150,000 deduction from purchase price
IncentiveCertificationStickers
*Also applies to trucks and buses (gasoline vehicles only) and heavy-duty trucks and buses (hybrid vehicles only) certified as fuel-efficient and low-emission vehicles. �(1) Applies additionally to electric (including fuel cell) vehicles, plug-in hybrid vehicles, natural gas vehicles (with NOx emissions down by 10% from 2009 standards) and clean diesel passenger cars (compliant with 2009 emission standards). (2) Fuel consumption and exhaust emission requirements are JC08 test cycle-based, with “Compliant +20% compared to 2015 fuel efficiency standards,” “Compliant +10% compared to 2015 fuel efficiency standards,” and “Compliant with 2015 fuel efficiency standards” being equivalent to “Compliant +50% compared to 2010 fuel efficiency standards,” “Compliant +38% compared to 2010 fuel efficiency standards,” and “Compliant +25% compared to 2010 fuel efficiency standards,” respectively, when measured in the 10 15-mode test cycle, on which basis the 2010 fuel efficiency standards were established. Note: Acquisition tax is assessed on the amount remaining after deduction.
● FISCAL 2012-2013 ACQUISITION INCENTIVES FOR PASSENGER CARS AND SMALL TRUCKS AND BUSES (GVW 2.5t) *
INCENTIVES & ELIGIBILITY REQUIREMENTS FOR USED VEHICLES
Requirements (1)
Requirements (1)
46
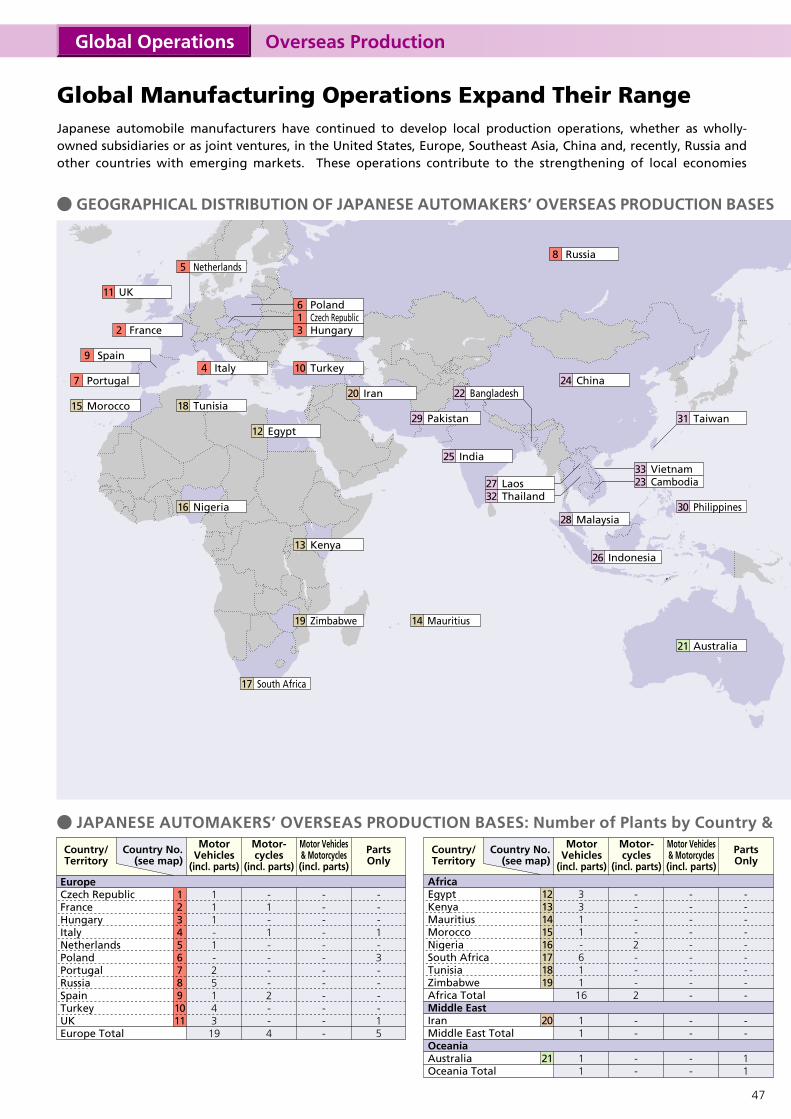
Overseas ProductionGlobal Operations
Global Manufacturing Operations Expand Their RangeJapanese automobile manufacturers have continued to develop local production operations, whether as wholly-owned subsidiaries or as joint ventures, in the United States, Europe, Southeast Asia, China and, recently, Russia and other countries with emerging markets. These operations contribute to the strengthening of local economies
EuropeCzech RepublicFranceHungaryItalyNetherlandsPolandPortugalRussiaSpainTurkeyUKEurope Total
1234567891011
Motor Vehicles& Motorcycles(incl. parts)
PartsOnly
Motor-cycles
(incl. parts)
MotorVehicles
(incl. parts)
Country/Territory
AfricaEgyptKenyaMauritiusMoroccoNigeriaSouth AfricaTunisiaZimbabweAfrica TotalMiddle EastIranMiddle East TotalOceaniaAustraliaOceania Total
1213141516171819
20
21
● GEOGRAPHICAL DISTRIBUTION OF JAPANESE AUTOMAKERS’ OVERSEAS PRODUCTION BASES
● JAPANESE AUTOMAKERS’ OVERSEAS PRODUCTION BASES: Number of Plants by Country &
UK11
Netherlands5
Turkey10
Russia8
Italy4
Egypt12
Nigeria16
Zimbabwe19 Mauritius14
South Africa17
Tunisia18Iran20
Australia21
Indonesia26
Philippines30Malaysia28
Bangladesh22China24
Taiwan31
India25
Pakistan29
Vietnam33Cambodia23
Thailand32Laos27
Kenya13
Morocco15
Spain9
France2
Portugal7
Czech Republic1Poland6
Hungary3
Country No.(see map)
Motor Vehicles& Motorcycles(incl. parts)
PartsOnly
Motor-cycles
(incl. parts)
MotorVehicles
(incl. parts)
Country/Territory
Country No.(see map)
111-1-2514319
-1-1----2--4
------------
---1-3----15
3311-61116
11
11
----2---2
--
--
---------
--
--
---------
--
11
47
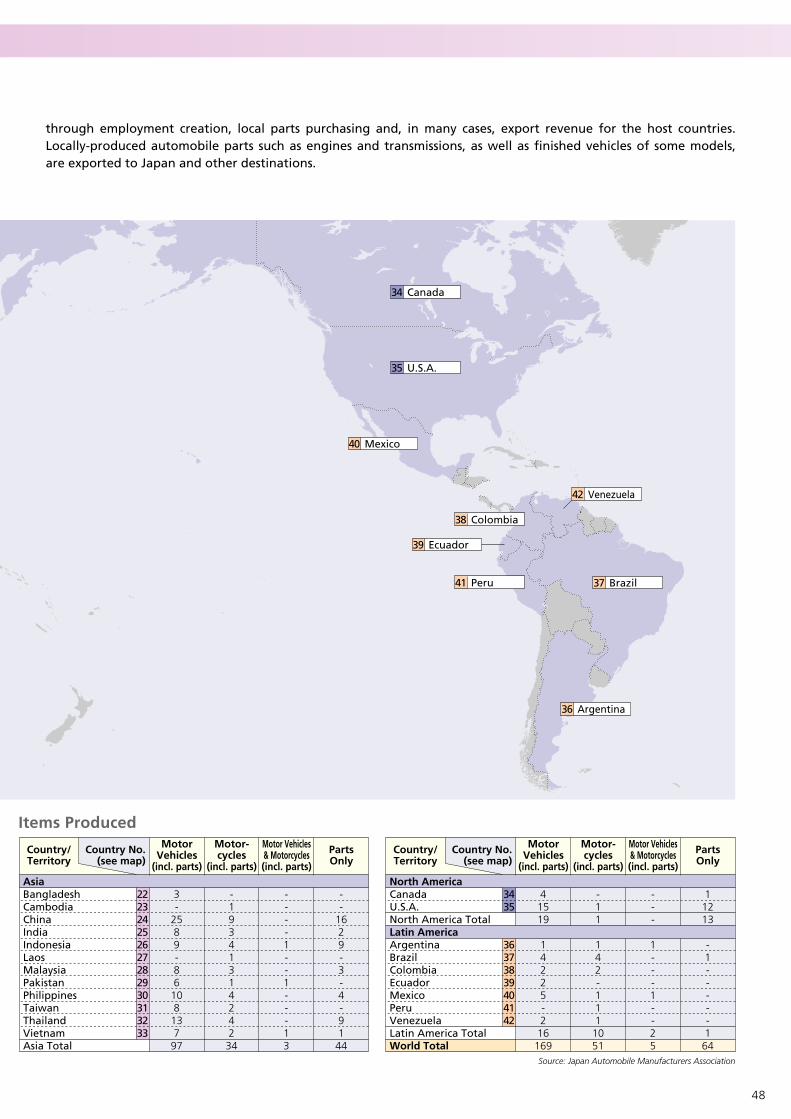
through employment creation, local parts purchasing and, in many cases, export revenue for the host countries. Locally-produced automobile parts such as engines and transmissions, as well as finished vehicles of some models, are exported to Japan and other destinations.
AsiaBangladeshCambodiaChinaIndiaIndonesiaLaosMalaysiaPakistanPhilippinesTaiwanThailandVietnamAsia Total
222324252627282930313233
Items Produced
Canada34
U.S.A.35
Mexico40
Venezuela42
Colombia38
Brazil37
Argentina36
Peru41
Ecuador39
North AmericaCanadaU.S.A.North America TotalLatin AmericaArgentinaBrazilColombiaEcuadorMexicoPeruVenezuelaLatin America TotalWorld Total
3435
36373839404142
Source: Japan Automobile Manufacturers Association
Motor Vehicles& Motorcycles(incl. parts)
PartsOnly
Motor-cycles
(incl. parts)
MotorVehicles
(incl. parts)
Country/Territory
Country No.(see map)
Motor Vehicles& Motorcycles(incl. parts)
PartsOnly
Motor-cycles
(incl. parts)
MotorVehicles
(incl. parts)
Country/Territory
Country No.(see map)
3-
2589-8610813797
-19341314242
34
----1--1---13
--
1629-3-4-9144
41519
14225-216169
-11
142-1111051
---
1---1--25
11213
-1-----164
48
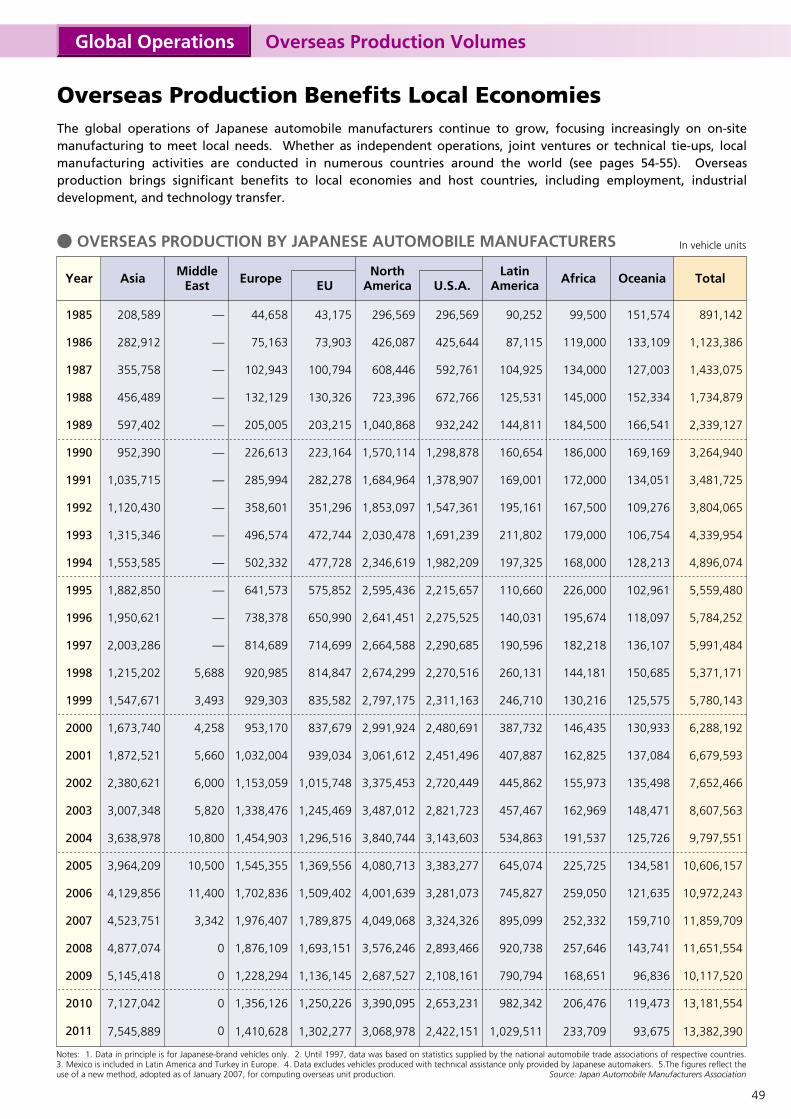
Notes: 1. Data in principle is for Japanese-brand vehicles only. 2. Until 1997, data was based on statistics supplied by the national automobile trade associations of respective countries. 3. Mexico is included in Latin America and Turkey in Europe. 4. Data excludes vehicles produced with technical assistance only provided by Japanese automakers. 5.The figures reflect the use of a new method, adopted as of January 2007, for computing overseas unit production.
● OVERSEAS PRODUCTION BY JAPANESE AUTOMOBILE MANUFACTURERS
Source: Japan Automobile Manufacturers Association
MiddleEast Europe EU
North America U.S.A.
Latin America Africa Oceania TotalAsiaYear
In vehicle units
Overseas Production VolumesGlobal Operations
Overseas Production Benefits Local EconomiesThe global operations of Japanese automobile manufacturers continue to grow, focusing increasingly on on-site manufacturing to meet local needs. Whether as independent operations, joint ventures or technical tie-ups, local manufacturing activities are conducted in numerous countries around the world (see pages 54-55). Overseas production brings significant benefits to local economies and host countries, including employment, industrial development, and technology transfer.
1985
1986
1987
1988
1989
1990
1991
1992
1993
1994
1995
1996
1997
1998
1999
2000
2001
2002
2003
2004
2005
2006
2007
2008
2009
2010
2011
208,589
282,912
355,758
456,489
597,402
952,390
1,035,715
1,120,430
1,315,346
1,553,585
1,882,850
1,950,621
2,003,286
1,215,202
1,547,671
1,673,740
1,872,521
2,380,621
3,007,348
3,638,978
3,964,209
4,129,856
4,523,751
4,877,074
5,145,418
7,127,042
7,545,889
—
—
—
—
—
—
—
—
—
—
—
—
—
5,688
3,493
4,258
5,660
6,000
5,820
10,800
10,500
11,400
3,342
0
0
0
0
44,658
75,163
102,943
132,129
205,005
226,613
285,994
358,601
496,574
502,332
641,573
738,378
814,689
920,985
929,303
953,170
1,032,004
1,153,059
1,338,476
1,454,903
1,545,355
1,702,836
1,976,407
1,876,109
1,228,294
1,356,126
1,410,628
43,175
73,903
100,794
130,326
203,215
223,164
282,278
351,296
472,744
477,728
575,852
650,990
714,699
814,847
835,582
837,679
939,034
1,015,748
1,245,469
1,296,516
1,369,556
1,509,402
1,789,875
1,693,151
1,136,145
1,250,226
1,302,277
296,569
426,087
608,446
723,396
1,040,868
1,570,114
1,684,964
1,853,097
2,030,478
2,346,619
2,595,436
2,641,451
2,664,588
2,674,299
2,797,175
2,991,924
3,061,612
3,375,453
3,487,012
3,840,744
4,080,713
4,001,639
4,049,068
3,576,246
2,687,527
3,390,095
3,068,978
296,569
425,644
592,761
672,766
932,242
1,298,878
1,378,907
1,547,361
1,691,239
1,982,209
2,215,657
2,275,525
2,290,685
2,270,516
2,311,163
2,480,691
2,451,496
2,720,449
2,821,723
3,143,603
3,383,277
3,281,073
3,324,326
2,893,466
2,108,161
2,653,231
2,422,151
90,252
87,115
104,925
125,531
144,811
160,654
169,001
195,161
211,802
197,325
110,660
140,031
190,596
260,131
246,710
387,732
407,887
445,862
457,467
534,863
645,074
745,827
895,099
920,738
790,794
982,342
1,029,511
99,500
119,000
134,000
145,000
184,500
186,000
172,000
167,500
179,000
168,000
226,000
195,674
182,218
144,181
130,216
146,435
162,825
155,973
162,969
191,537
225,725
259,050
252,332
257,646
168,651
206,476
233,709
151,574
133,109
127,003
152,334
166,541
169,169
134,051
109,276
106,754
128,213
102,961
118,097
136,107
150,685
125,575
130,933
137,084
135,498
148,471
125,726
134,581
121,635
159,710
143,741
96,836
119,473
93,675
891,142
1,123,386
1,433,075
1,734,879
2,339,127
3,264,940
3,481,725
3,804,065
4,339,954
4,896,074
5,559,480
5,784,252
5,991,484
5,371,171
5,780,143
6,288,192
6,679,593
7,652,466
8,607,563
9,797,551
10,606,157
10,972,243
11,859,709
11,651,554
10,117,520
13,181,554
13,382,390
49
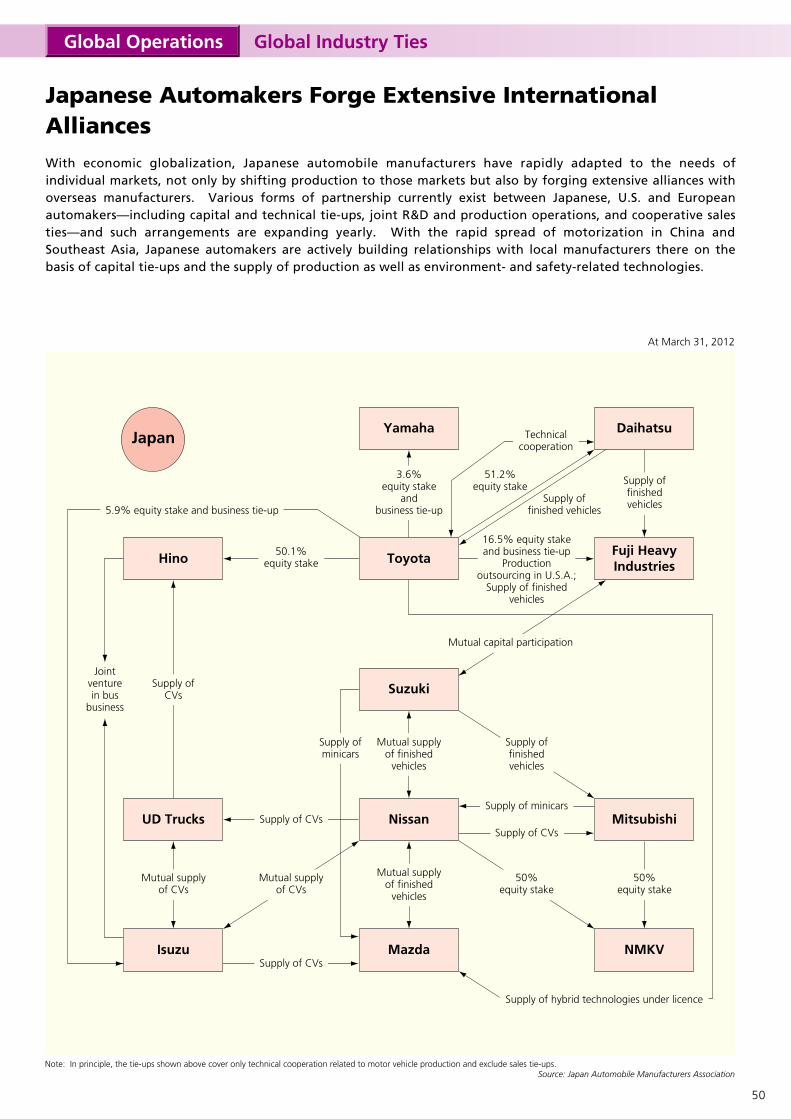
At March 31, 2012
Yamaha
Toyota
Suzuki
Nissan
Mazda NMKV
Daihatsu
Mitsubishi
Hino Fuji HeavyIndustries
UD Trucks
Isuzu
Note: In principle, the tie-ups shown above cover only technical cooperation related to motor vehicle production and exclude sales tie-ups.Source: Japan Automobile Manufacturers Association
50.1%equity stake
16.5% equity stakeand business tie-up
Productionoutsourcing in U.S.A.;
Supply of finishedvehicles
Technicalcooperation
Mutual supplyof CVs
Mutual capital participation
Jointventurein bus
business
Supply offinishedvehicles
Supply ofminicars
Supply offinishedvehicles5.9% equity stake and business tie-up
Mutual supplyof CVs
50%equity stake
50%equity stake
Supply of CVs
Supply of CVsSupply of minicars
Supply of CVs
3.6%equity stake
andbusiness tie-up
Mutual supplyof finished
vehicles
Mutual supplyof finished
vehicles
Supply ofCVs
Japan
Global Industry TiesGlobal Operations
Japanese Automakers Forge Extensive International AlliancesWith economic globalization, Japanese automobile manufacturers have rapidly adapted to the needs of individual markets, not only by shifting production to those markets but also by forging extensive alliances with overseas manufacturers. Various forms of partnership currently exist between Japanese, U.S. and European automakers—including capital and technical tie-ups, joint R&D and production operations, and cooperative sales ties—and such arrangements are expanding yearly. With the rapid spread of motorization in China and Southeast Asia, Japanese automakers are actively building relationships with local manufacturers there on the basis of capital tie-ups and the supply of production as well as environment- and safety-related technologies.
Supply offinished vehicles
51.2%equity stake
Supply of hybrid technologies under licence
50
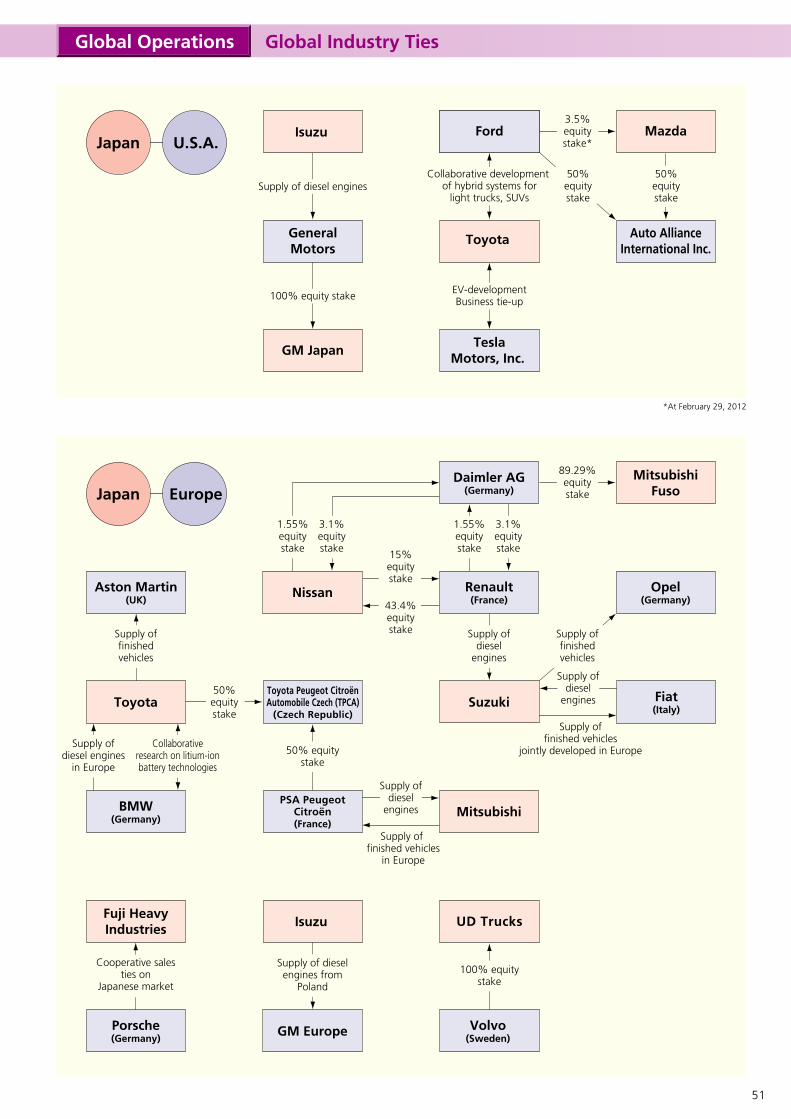
Mazda
Auto AllianceInternational Inc.
Ford
GeneralMotors
Isuzu
GM Japan
3.5%equitystake*
50%equitystake
50%equitystake
Supply of diesel engines
100% equity stake
TeslaMotors, Inc.�
Toyota�
EV-developmentBusiness tie-up
Collaborative development of hybrid systems for
light trucks, SUVs
Japan U.S.A.
Japan EuropeMitsubishi
Fuso
Volvo(Sweden)
100% equity stake
50% equity stake
UD TrucksIsuzu
GM Europe
Suzuki
Nissan Renault(France)
Opel(Germany)
Aston Martin(UK)
�
Daimler AG(Germany)
Supply of diesel engines from
Poland
Supply ofdiesel
engines
Supply offinishedvehicles
Supply offinishedvehicles
3.1%equitystake
1.55%equitystake
Collaborativeresearch on litium-ionbattery technologies
Supply ofdiesel engines
in Europe
3.1%equitystake
1.55%equitystake
Toyota
Supply offinished vehicles
jointly developed in Europe
Supply ofdiesel
engines
Supply of finished vehicles
in Europe
Supply ofdiesel
engines
Fiat(Italy)
Toyota Peugeot CitroënAutomobile Czech (TPCA)
(Czech Republic)
15%equitystake
43.4%equitystake
Global Industry TiesGlobal Operations
MitsubishiPSA Peugeot
Citroën(France)
*At February 29, 2012
Porsche(Germany)
Fuji HeavyIndustries
Cooperative salesties on
Japanese market
BMW(Germany)
50%equitystake
89.29% equitystake
51

At March 31, 2012
GAC ChangfengMotor Co., Ltd.
Sichuan FAW Toyota Motor
Co., Ltd.
Chongqing ChanganAutomobile Co., Ltd.
Toyota
Mitsubishi
Japan China
Tianjin FAWToyota Motor
Co., Ltd.
Mazda
51% equity stake 51% equity stake
25% equity stake30% equity stakeProduction ofVitz (NBC 1)
35% equity stake 50% equity stake
40% equitystake;
Productionof Vios, Corolla,
Crown, Reiz, Corolla EXand RAV4
50% equity stake;Production of
Coaster, Land Cruiser,Prado and Prius
Productionoutsourcingof Atenza
15%equitystake
51%equitystake
25%equitystake
50%equitystake
Changang FordMazda Automobile
Co., Ltd.
Tianjin FAW XialiAutomobile
Co., Ltd.
GACToyota Motor
Co., Ltd.�
FAW GroupCorporation
35% equity stake;Production of Alto,
Cultus,Swift and SX4
46% equity stake; Production of
WagonR Wide, Liana,Landy and Splash
FAW Cars Co., Ltd.
Southeast (Fujian)Motor Co., Ltd.
Changan FordMazda Engine
Co., Ltd.
Ford
GuangzhouAutomobile Group
Co., Ltd.
ShanghaiElectric Group
Corp.
Guangqi HinoMotors Co., Ltd.Hino
ShanghaiHino Engine
Co., Ltd.
Dongfeng HondaAutomobile
Co., Ltd.
HondaAutomobile
(China) Co., Ltd.
Dongfeng MotorCo., Ltd.
Dongfeng NissanDiesel Motor
Co., Ltd.
Dongfeng MotorGroup Co., Ltd.
Zhengzhou NissanAutomobile
Co., Ltd. Nissan
UD Trucks50%equitystake
50%equitystake
20%equitystake
50%equitystake
50% equity stake25% equity stake
30% equity stake 50% equity stake
50%equitystake
50%equitystake
10%equitystake
50%equitystake
50% equity stake; Production of CR-V
and Civic
50%equitystake
Guangqi HondaAutomobile
Co., Ltd.Honda
Qingling MotorsCo., Ltd.
Jiangling MotorsGroup
Co., Ltd.
Qingling MotorsGroup
Co., Ltd.
Jiangling-IsuzuMotorsCo., Ltd.
Changhe GroupChangan
AutomobileLiability Co., Ltd.
Chongqing ChanganSuzuki Automobile
Co., Ltd.
Jiangxi ChangheSuzuki Automobile
Co., Ltd.
Suzuki
51% equity stake 75% equity stake
14.59% equity stake;Production and sales
of Pajero
20% equity stake; Production of
Elf and Forward12.5%
equity stake
Isuzu
25% equity stake;Production and salesof Delica and Lancer
20% equitystake;
Productionof Datsun
and Paladin
65% equitystake;
Productionof Jazz toEurope
50% equitystake;
Productionof Accord,Odyssey,
City and Fit
30.5% equity stake;Production of Camry,Camry Hybrid, Yaris
and Highlander
20%equitystake
52
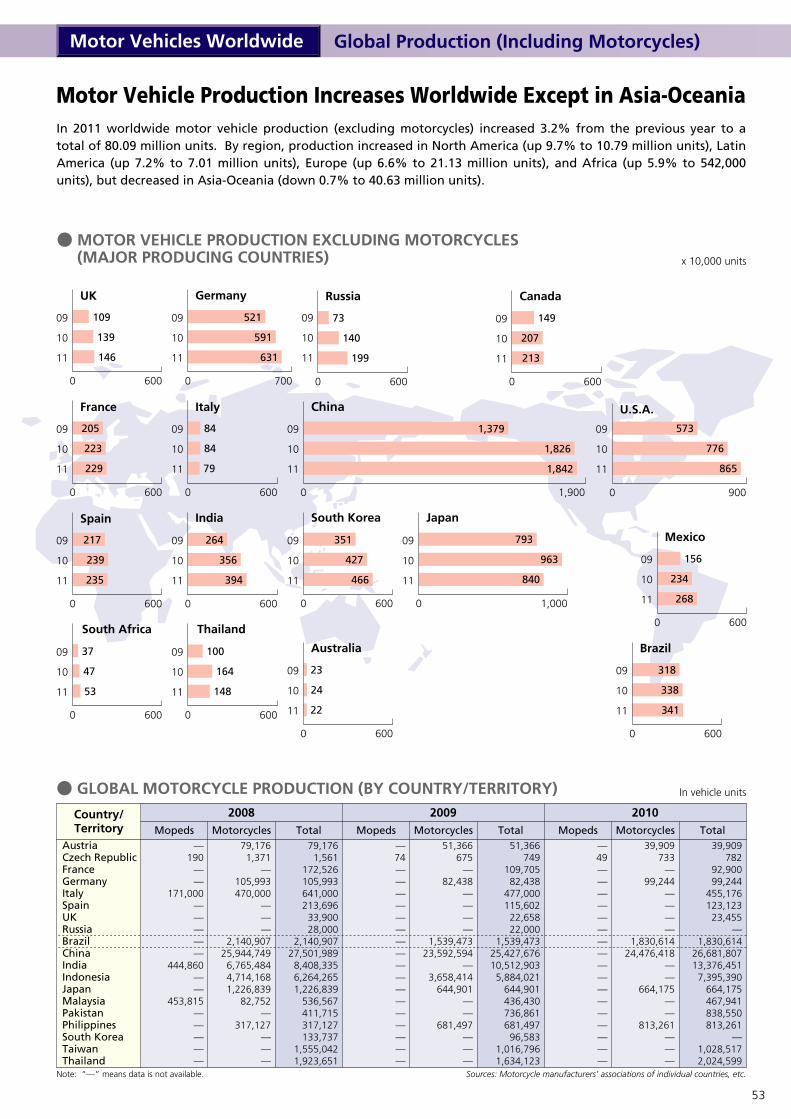
● MOTOR VEHICLE PRODUCTION EXCLUDING MOTORCYCLES (MAJOR PRODUCING COUNTRIES) x 10,000 units
Russia
0 600
73
140
199
Germany
0 700
521
591
631
China
0 1,900
1,379
1,826
1,842
UK
0 600
09
10
11
09
10
11
09
10
11
09
10
11
09
10
11
09
10
11
09
10
11
09
10
11
09
10
11
09
10
11
09
10
11
09
10
11
09
10
11
09
10
11
09
10
11
09
10
11
09
10
11
Canada
0 600
149
207
213
Mexico
0 600
Brazil
0 600
318
338
341
Australia
0 600
23
24
220 600
100
164
148
109
139
146
France
0 600
205
223
229
Spain
0 600
217
239
235
South Africa
0 600
37
47
53
Thailand
India
0 600
South Korea
0 600
351
427
466
Italy
0 600
84
84
79
U.S.A.
0 900
573
776
865
Japan
0 1,000
Motor Vehicle Production Increases Worldwide Except in Asia-OceaniaIn 2011 worldwide motor vehicle production (excluding motorcycles) increased 3.2% from the previous year to a total of 80.09 million units. By region, production increased in North America (up 9.7% to 10.79 million units), Latin America (up 7.2% to 7.01 million units), Europe (up 6.6% to 21.13 million units), and Africa (up 5.9% to 542,000 units), but decreased in Asia-Oceania (down 0.7% to 40.63 million units).
Global Production (Including Motorcycles)Motor Vehicles Worldwide
AustriaCzech RepublicFranceGermanyItalySpainUKRussiaBrazilChinaIndiaIndonesiaJapanMalaysiaPakistanPhilippinesSouth KoreaTaiwanThailand
2008 2009Country/Territory Mopeds Motorcycles Total Mopeds Motorcycles Total
2010Mopeds Motorcycles Total
● GLOBAL MOTORCYCLE PRODUCTION (BY COUNTRY/TERRITORY)
Note: “—” means data is not available.
In vehicle units
Sources: Motorcycle manufacturers’ associations of individual countries, etc.
—74—————————————————
51,366675
—82,438
————
1,539,47323,592,594
—3,658,414
644,901——
681,497———
51,366749
109,70582,438
477,000115,602
22,65822,000
1,539,47325,427,67610,512,9035,884,021
644,901436,430736,861681,497
96,5831,016,7961,634,123
—49—————————————————
39,909733
—99,244
————
1,830,61424,476,418
——
664,175——
813,261———
39,909782
92,90099,244
455,176123,123
23,455—
1,830,61426,681,80713,376,4517,395,390
664,175467,941838,550813,261
—1,028,5172,024,599
—190
——
171,000—————
444,860——
453,815—————
79,1761,371
—105,993470,000
———
2,140,90725,944,7496,765,4844,714,1681,226,839
82,752—
317,127———
79,1761,561
172,526105,993641,000213,69633,90028,000
2,140,90727,501,9898,408,3356,264,2651,226,839
536,567411,715317,127133,737
1,555,0421,923,651
156
234
268
264
356
394
793
963
840
53
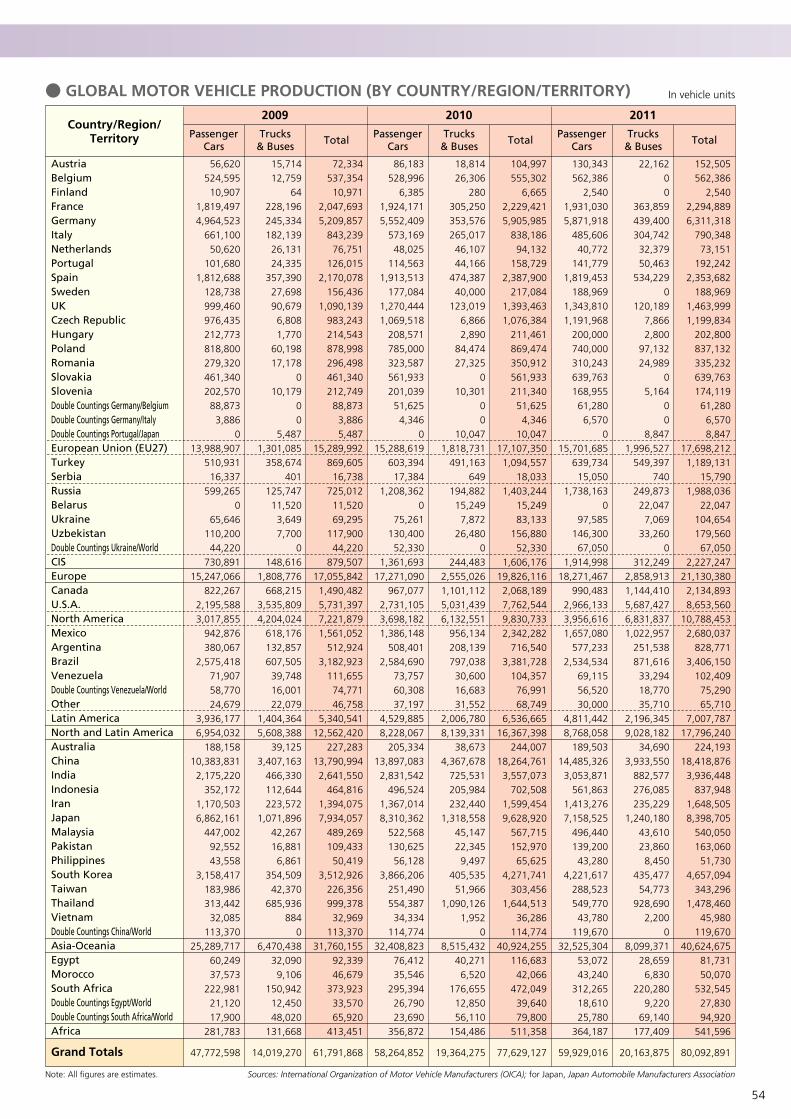
AustriaBelgiumFinlandFranceGermanyItalyNetherlandsPortugalSpainSwedenUKCzech RepublicHungaryPolandRomaniaSlovakiaSloveniaDouble Countings Germany/BelgiumDouble Countings Germany/ItalyDouble Countings Portugal/JapanEuropean Union (EU27)TurkeySerbiaRussiaBelarusUkraineUzbekistanDouble Countings Ukraine/WorldCISEuropeCanadaU.S.A.North AmericaMexicoArgentinaBrazilVenezuelaDouble Countings Venezuela/WorldOtherLatin AmericaNorth and Latin AmericaAustraliaChinaIndiaIndonesiaIranJapanMalaysiaPakistanPhilippinesSouth KoreaTaiwanThailandVietnamDouble Countings China/WorldAsia-OceaniaEgyptMoroccoSouth AfricaDouble Countings Egypt/WorldDouble Countings South Africa/WorldAfrica
Grand Totals
2010Country/Region/
Territory
86,183528,996
6,3851,924,1715,552,409
573,16948,025
114,5631,913,513
177,0841,270,4441,069,518
208,571785,000323,587561,933201,03951,625
4,3460
15,288,619603,39417,384
1,208,3620
75,261130,40052,330
1,361,69317,271,090
967,0772,731,1053,698,1821,386,148
508,4012,584,690
73,75760,30837,197
4,529,8858,228,067
205,33413,897,083
2,831,542496,524
1,367,0148,310,362
522,568130,62556,128
3,866,206251,490554,387
34,334114,774
32,408,82376,41235,546
295,39426,79023,690
356,872
58,264,852
Passenger Cars
18,81426,306
280305,250353,576265,017
46,10744,166
474,38740,000
123,0196,8662,890
84,47427,325
010,301
00
10,0471,818,731
491,163649
194,88215,249
7,87226,480
0244,483
2,555,0261,101,1125,031,4396,132,551
956,134208,139797,038
30,60016,68331,552
2,006,7808,139,331
38,6734,367,678
725,531205,984232,440
1,318,55845,14722,345
9,497405,535
51,9661,090,126
1,9520
8,515,43240,271
6,520176,65512,85056,110
154,486
19,364,275
Trucks& Buses
104,997555,302
6,6652,229,4215,905,985
838,18694,132
158,7292,387,900
217,0841,393,4631,076,384
211,461869,474350,912561,933211,340
51,6254,346
10,04717,107,350
1,094,55718,033
1,403,24415,24983,133
156,88052,330
1,606,17619,826,116
2,068,1897,762,5449,830,7332,342,282
716,5403,381,728
104,35776,99168,749
6,536,66516,367,398
244,00718,264,761
3,557,073702,508
1,599,4549,628,920
567,715152,970
65,6254,271,741
303,4561,644,513
36,286114,774
40,924,255116,683
42,066472,049
39,64079,800
511,358
77,629,127
Total
2011Passenger
CarsTrucks
& Buses Total
2009Passenger
CarsTrucks
& Buses Total
● GLOBAL MOTOR VEHICLE PRODUCTION (BY COUNTRY/REGION/TERRITORY)
56,620524,59510,907
1,819,4974,964,523
661,10050,620
101,6801,812,688
128,738999,460976,435212,773818,800279,320461,340202,57088,8733,886
013,988,907
510,93116,337
599,2650
65,646110,20044,220
730,89115,247,066
822,2672,195,5883,017,855
942,876380,067
2,575,41871,90758,77024,679
3,936,1776,954,032
188,15810,383,831
2,175,220352,172
1,170,5036,862,161
447,00292,55243,558
3,158,417183,986313,44232,085
113,37025,289,717
60,24937,573
222,98121,12017,900
281,783
47,772,598
15,71412,759
64228,196245,334182,13926,13124,335
357,39027,69890,6796,8081,770
60,19817,178
010,179
00
5,4871,301,085
358,674401
125,74711,5203,6497,700
0148,616
1,808,776668,215
3,535,8094,204,024
618,176132,857607,50539,74816,00122,079
1,404,3645,608,388
39,1253,407,163
466,330112,644223,572
1,071,89642,26716,8816,861
354,50942,370
685,936884
06,470,438
32,0909,106
150,94212,45048,020
131,668
14,019,270
72,334537,354
10,9712,047,6935,209,857
843,23976,751
126,0152,170,078
156,4361,090,139
983,243214,543878,998296,498461,340212,749
88,8733,8865,487
15,289,992869,605
16,738725,012
11,52069,295
117,90044,220
879,50717,055,8421,490,4825,731,3977,221,8791,561,052
512,9243,182,923
111,65574,77146,758
5,340,54112,562,420
227,28313,790,9942,641,550
464,8161,394,0757,934,057
489,269109,433
50,4193,512,926
226,356999,378
32,969113,370
31,760,15592,33946,679
373,92333,57065,920
413,451
61,791,868
Sources: International Organization of Motor Vehicle Manufacturers (OICA); for Japan, Japan Automobile Manufacturers AssociationNote: All figures are estimates.
In vehicle units
130,343562,386
2,5401,931,0305,871,918
485,60640,772
141,7791,819,453
188,9691,343,8101,191,968
200,000740,000310,243639,763168,955
61,2806,570
015,701,685
639,73415,050
1,738,1630
97,585146,300
67,0501,914,998
18,271,467990,483
2,966,1333,956,6161,657,080
577,2332,534,534
69,11556,52030,000
4,811,4428,768,058
189,50314,485,3263,053,871
561,8631,413,2767,158,525
496,440139,200
43,2804,221,617
288,523549,770
43,780119,670
32,525,30453,07243,240
312,26518,61025,780
364,187
59,929,016
22,16200
363,859439,400304,742
32,37950,463
534,2290
120,1897,8662,800
97,13224,989
05,164
00
8,8471,996,527
549,397740
249,87322,0477,069
33,2600
312,2492,858,9131,144,4105,687,4276,831,8371,022,957
251,538871,616
33,29418,77035,710
2,196,3459,028,182
34,6903,933,550
882,577276,085235,229
1,240,18043,61023,860
8,450435,47754,773
928,6902,200
08,099,371
28,6596,830
220,2809,220
69,140177,409
20,163,875
152,505562,386
2,5402,294,8896,311,318
790,34873,151
192,2422,353,682
188,9691,463,9991,199,834
202,800837,132335,232639,763174,11961,2806,5708,847
17,698,2121,189,131
15,7901,988,036
22,047104,654179,560
67,0502,227,247
21,130,3802,134,8938,653,560
10,788,4532,680,037
828,7713,406,150
102,40975,29065,710
7,007,78717,796,240
224,19318,418,8763,936,448
837,9481,648,5058,398,705
540,050163,060
51,7304,657,094
343,2961,478,460
45,980119,670
40,624,67581,73150,070
532,54527,83094,920
541,596
80,092,891
54
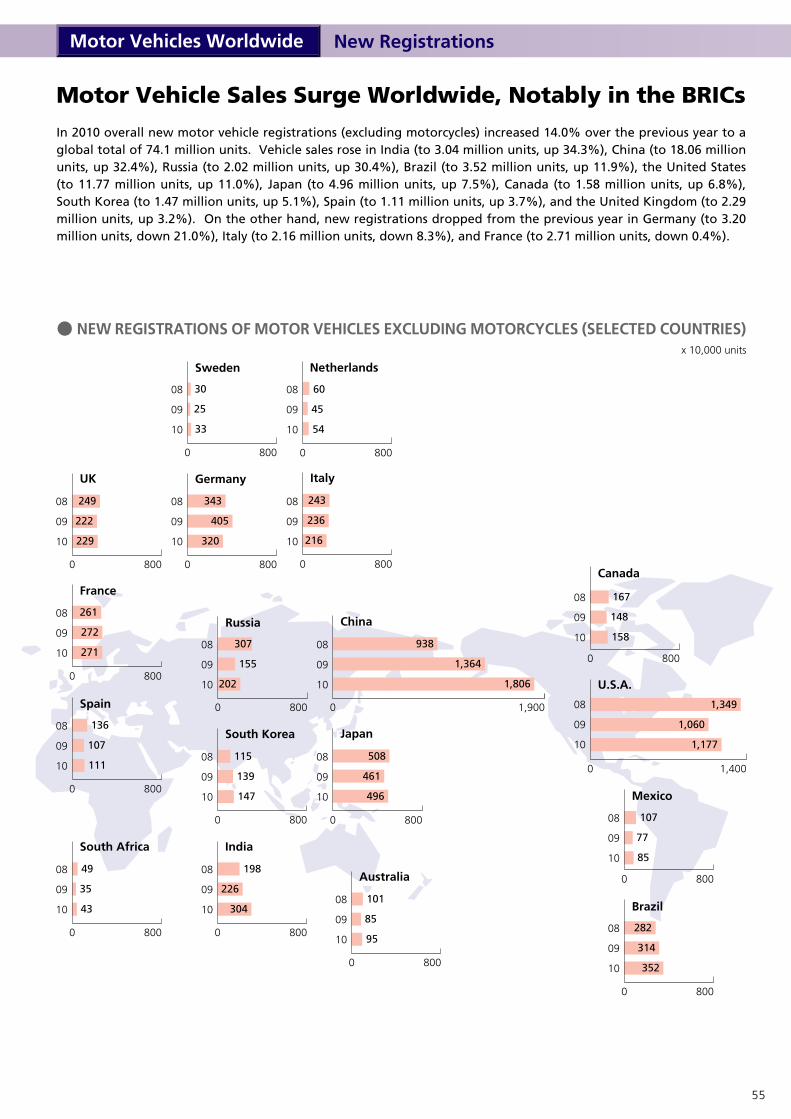
U.S.A.
0 1,400
1,349
1,060
1,177
Canada
0 800
167
148
158
Mexico
0 800
107
77
85
Germany
0 800
343
405
320
Netherlands
UK
0 800
249
222
229
France
0 800
261
272
271
Spain
0 800
136
107
111
Brazil
0 800
0 800
60
45
54
Sweden
0 800
09
10
08
09
10
08
09
10
08
09
10
08
09
10
08
09
10
08
09
10
08
09
10
08
09
10
08
09
10
08
09
10
08
09
10
08
09
10
08
09
10
08
09
10
08
09
10
08
09
10
08
09
10
08
Japan
0 800
508
461
496
30
25
33
South Africa
0 800
49
35
43
Australia
0 800
101
85
95
Italy
0 800
243
236
216
x 10,000 units
● NEW REGISTRATIONS OF MOTOR VEHICLES EXCLUDING MOTORCYCLES (SELECTED COUNTRIES)
Russia
0 800
China
0 1,900
938
1,364
1,806
India
0 800
198
226
304
South Korea
0 800
115
139
147
Motor Vehicle Sales Surge Worldwide, Notably in the BRICsIn 2010 overall new motor vehicle registrations (excluding motorcycles) increased 14.0% over the previous year to a global total of 74.1 million units. Vehicle sales rose in India (to 3.04 million units, up 34.3%), China (to 18.06 million units, up 32.4%), Russia (to 2.02 million units, up 30.4%), Brazil (to 3.52 million units, up 11.9%), the United States (to 11.77 million units, up 11.0%), Japan (to 4.96 million units, up 7.5%), Canada (to 1.58 million units, up 6.8%), South Korea (to 1.47 million units, up 5.1%), Spain (to 1.11 million units, up 3.7%), and the United Kingdom (to 2.29 million units, up 3.2%). On the other hand, new registrations dropped from the previous year in Germany (to 3.20 million units, down 21.0%), Italy (to 2.16 million units, down 8.3%), and France (to 2.71 million units, down 0.4%).
New RegistrationsMotor Vehicles Worldwide
282
314
352
307
155
202
55
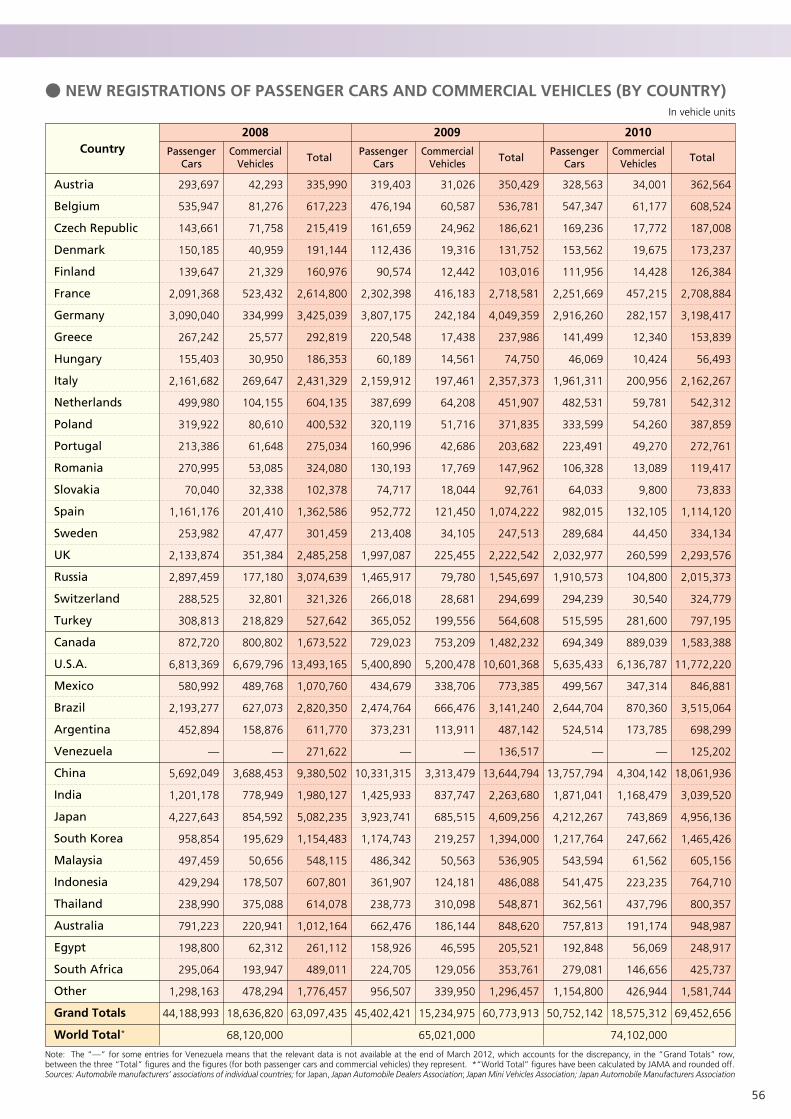
Austria
Belgium
Czech Republic
Denmark
Finland
France
Germany
Greece
Hungary
Italy
Netherlands
Poland
Portugal
Romania
Slovakia
Spain
Sweden
UK
Russia
Switzerland
Turkey
Canada
U.S.A.
Mexico
Brazil
Argentina
Venezuela
China
India
Japan
South Korea
Malaysia
Indonesia
Thailand
Australia
Egypt
South Africa
Other
Grand Totals
World Total*
2008 2009Country Passenger
CarsCommercial
Vehicles Total Passenger Cars
Commercial Vehicles Total
2010
293,697
535,947
143,661
150,185
139,647
2,091,368
3,090,040
267,242
155,403
2,161,682
499,980
319,922
213,386
270,995
70,040
1,161,176
253,982
2,133,874
2,897,459
288,525
308,813
872,720
6,813,369
580,992
2,193,277
452,894
—
5,692,049
1,201,178
4,227,643
958,854
497,459
429,294
238,990
791,223
198,800
295,064
1,298,163
44,188,993
Passenger Cars
42,293
81,276
71,758
40,959
21,329
523,432
334,999
25,577
30,950
269,647
104,155
80,610
61,648
53,085
32,338
201,410
47,477
351,384
177,180
32,801
218,829
800,802
6,679,796
489,768
627,073
158,876
—
3,688,453
778,949
854,592
195,629
50,656
178,507
375,088
220,941
62,312
193,947
478,294
18,636,820
68,120,000
Commercial Vehicles
335,990
617,223
215,419
191,144
160,976
2,614,800
3,425,039
292,819
186,353
2,431,329
604,135
400,532
275,034
324,080
102,378
1,362,586
301,459
2,485,258
3,074,639
321,326
527,642
1,673,522
13,493,165
1,070,760
2,820,350
611,770
271,622
9,380,502
1,980,127
5,082,235
1,154,483
548,115
607,801
614,078
1,012,164
261,112
489,011
1,776,457
63,097,435
319,403
476,194
161,659
112,436
90,574
2,302,398
3,807,175
220,548
60,189
2,159,912
387,699
320,119
160,996
130,193
74,717
952,772
213,408
1,997,087
1,465,917
266,018
365,052
729,023
5,400,890
434,679
2,474,764
373,231
—
10,331,315
1,425,933
3,923,741
1,174,743
486,342
361,907
238,773
662,476
158,926
224,705
956,507
45,402,421
31,026
60,587
24,962
19,316
12,442
416,183
242,184
17,438
14,561
197,461
64,208
51,716
42,686
17,769
18,044
121,450
34,105
225,455
79,780
28,681
199,556
753,209
5,200,478
338,706
666,476
113,911
—
3,313,479
837,747
685,515
219,257
50,563
124,181
310,098
186,144
46,595
129,056
339,950
15,234,975
65,021,000
350,429
536,781
186,621
131,752
103,016
2,718,581
4,049,359
237,986
74,750
2,357,373
451,907
371,835
203,682
147,962
92,761
1,074,222
247,513
2,222,542
1,545,697
294,699
564,608
1,482,232
10,601,368
773,385
3,141,240
487,142
136,517
13,644,794
2,263,680
4,609,256
1,394,000
536,905
486,088
548,871
848,620
205,521
353,761
1,296,457
60,773,913
328,563
547,347
169,236
153,562
111,956
2,251,669
2,916,260
141,499
46,069
1,961,311
482,531
333,599
223,491
106,328
64,033
982,015
289,684
2,032,977
1,910,573
294,239
515,595
694,349
5,635,433
499,567
2,644,704
524,514
—
13,757,794
1,871,041
4,212,267
1,217,764
543,594
541,475
362,561
757,813
192,848
279,081
1,154,800
50,752,142
34,001
61,177
17,772
19,675
14,428
457,215
282,157
12,340
10,424
200,956
59,781
54,260
49,270
13,089
9,800
132,105
44,450
260,599
104,800
30,540
281,600
889,039
6,136,787
347,314
870,360
173,785
—
4,304,142
1,168,479
743,869
247,662
61,562
223,235
437,796
191,174
56,069
146,656
426,944
18,575,312
74,102,000
362,564
608,524
187,008
173,237
126,384
2,708,884
3,198,417
153,839
56,493
2,162,267
542,312
387,859
272,761
119,417
73,833
1,114,120
334,134
2,293,576
2,015,373
324,779
797,195
1,583,388
11,772,220
846,881
3,515,064
698,299
125,202
18,061,936
3,039,520
4,956,136
1,465,426
605,156
764,710
800,357
948,987
248,917
425,737
1,581,744
69,452,656
Total
● NEW REGISTRATIONS OF PASSENGER CARS AND COMMERCIAL VEHICLES (BY COUNTRY)In vehicle units
Sources: Automobile manufacturers’ associations of individual countries; for Japan, Japan Automobile Dealers Association; Japan Mini Vehicles Association; Japan Automobile Manufacturers Association
Note: The “—” for some entries for Venezuela means that the relevant data is not available at the end of March 2012, which accounts for the discrepancy, in the “Grand Totals” row, between the three “Total” figures and the figures (for both passenger cars and commercial vehicles) they represent. *“World Total” figures have been calculated by JAMA and rounded off.
56
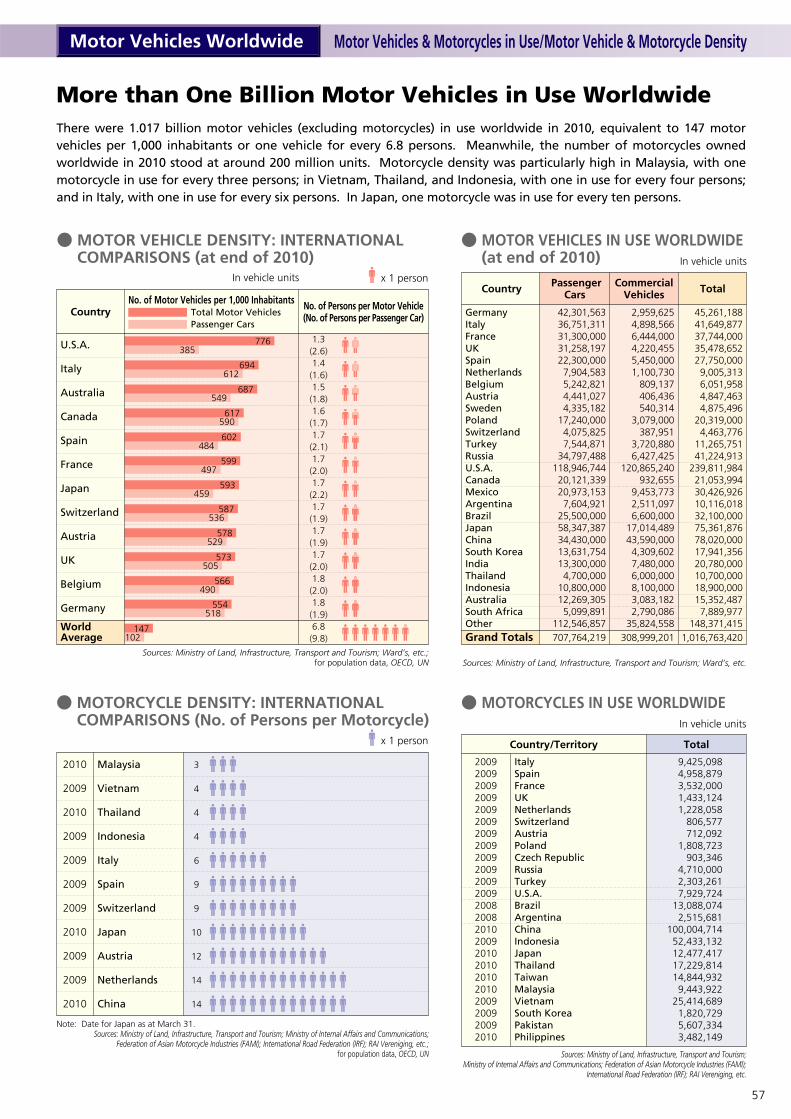
In vehicle units
● MOTOR VEHICLE DENSITY: INTERNATIONAL COMPARISONS (at end of 2010)
● MOTOR VEHICLES IN USE WORLDWIDE (at end of 2010)
Sources: Ministry of Land, Infrastructure, Transport and Tourism; Ward’s, etc.;for population data, OECD, UN
CountryNo. of Motor Vehicles per 1,000 Inhabitants
Total Motor VehiclesPassenger Cars
No. of Persons per Motor Vehicle(No. of Persons per Passenger Car) 42,301,563
36,751,31131,300,00031,258,19722,300,0007,904,5835,242,8214,441,0274,335,182
17,240,0004,075,8257,544,871
34,797,488118,946,74420,121,33920,973,1537,604,921
25,500,00058,347,38734,430,00013,631,75413,300,0004,700,000
10,800,00012,269,3055,099,891
112,546,857707,764,219
Passenger Cars
GermanyItalyFranceUKSpainNetherlandsBelgiumAustriaSwedenPolandSwitzerlandTurkeyRussiaU.S.A.CanadaMexicoArgentinaBrazilJapanChinaSouth KoreaIndiaThailandIndonesiaAustraliaSouth AfricaOtherGrand Totals
Country
45,261,18841,649,87737,744,00035,478,65227,750,0009,005,3136,051,9584,847,4634,875,496
20,319,0004,463,776
11,265,75141,224,913
239,811,98421,053,99430,426,92610,116,01832,100,00075,361,87678,020,00017,941,35620,780,00010,700,00018,900,00015,352,4877,889,977
148,371,4151,016,763,420
2,959,6254,898,5666,444,0004,220,4555,450,0001,100,730
809,137406,436540,314
3,079,000387,951
3,720,8806,427,425
120,865,240932,655
9,453,7732,511,0976,600,000
17,014,48943,590,0004,309,6027,480,0006,000,0008,100,0003,083,1822,790,086
35,824,558308,999,201
TotalCommercial Vehicles
U.S.A.
Italy
Australia
Canada
Spain
France
Japan
Switzerland
Austria
UK
Belgium
Germany
World Average
1.3(2.6)1.4(1.6)1.5(1.8)1.6(1.7)1.7(2.1)1.7(2.0)1.7(2.2)1.7(1.9)1.7(1.9)1.7(2.0)1.8(2.0)1.8(1.9)6.8(9.8)
776
694
687
617
602
599
593
587
578
573
566
554
385
612
549
590
484
497
459
536
529
505
490
518
Sources: Ministry of Land, Infrastructure, Transport and Tourism; Ward’s, etc.
Sources: Ministry of Land, Infrastructure, Transport and Tourism;Ministry of Internal Affairs and Communications; Federation of Asian Motorcycle Industries (FAMI);
International Road Federation (IRF); RAI Vereniging, etc.
Note: Date for Japan as at March 31.Sources: Ministry of Land, Infrastructure, Transport and Tourism; Ministry of Internal Affairs and Communications;
Federation of Asian Motorcycle Industries (FAMI); International Road Federation (IRF); RAI Vereniging, etc.;for population data, OECD, UN
In vehicle units
2010
2009
2010
2009
2009
2009
2009
2010
2009
2009
2010
● MOTORCYCLE DENSITY: INTERNATIONAL COMPARISONS (No. of Persons per Motorcycle)
9,425,0984,958,8793,532,0001,433,1241,228,058
806,577712,092
1,808,723903,346
4,710,0002,303,2617,929,724
13,088,0742,515,681
100,004,71452,433,13212,477,41717,229,81414,844,932
9,443,92225,414,689
1,820,7295,607,3343,482,149
Total
ItalySpainFranceUKNetherlandsSwitzerlandAustriaPolandCzech RepublicRussiaTurkeyU.S.A.BrazilArgentinaChinaIndonesiaJapanThailandTaiwanMalaysiaVietnamSouth KoreaPakistanPhilippines
Country/Territory
3
4
4
4
6
9
9
10
12
14
14
Malaysia
Vietnam
Thailand
Indonesia
Italy
Spain
Switzerland
Japan
Austria
Netherlands
China
200920092009200920092009200920092009200920092009200820082010200920102010201020102009200920092010
x 1 person
x 1 person
More than One Billion Motor Vehicles in Use WorldwideThere were 1.017 billion motor vehicles (excluding motorcycles) in use worldwide in 2010, equivalent to 147 motor vehicles per 1,000 inhabitants or one vehicle for every 6.8 persons. Meanwhile, the number of motorcycles owned worldwide in 2010 stood at around 200 million units. Motorcycle density was particularly high in Malaysia, with one motorcycle in use for every three persons; in Vietnam, Thailand, and Indonesia, with one in use for every four persons; and in Italy, with one in use for every six persons. In Japan, one motorcycle was in use for every ten persons.
Motor Vehicles & Motorcycles in Use/Motor Vehicle & Motorcycle DensityMotor Vehicles Worldwide
147102
In vehicle units
● MOTORCYCLES IN USE WORLDWIDE
57

● MOTOR VEHICLE EXPORTS (MAJOR EXPORTING COUNTRIES)
JapanU.S.A.GermanyUKFranceItalyBelgiumSpainBrazilSouth Korea
2008 Country Passenger
CarsCommercial
Vehicles Total
2009
Passenger Cars
CommercialVehicles Total
2010
Passenger Cars
CommercialVehicles
5,915,4291,588,0764,131,6601,128,5863,736,921
279,670610,784
1,655,154558,207
2,508,911
811,662378,096369,147125,611585,270281,28342,085
525,698176,376175,054
6,727,0911,966,1724,500,8071,254,1974,322,191
560,953652,869
2,180,852734,583
2,683,965
3,208,639755,093
3,425,626762,234
3,542,282251,038493,280
1,555,149373,747
2,007,230
407,529351,885158,094
66,454340,931131,571
11,800328,026101,578141,632
3,616,1681,106,9783,583,720
828,6883,883,213
382,609505,080
1,883,175475,325
2,148,862
4,275,3661,080,9814,238,759
961,4204,306,065
231,557480,684
1,658,341616,125
2,610,949
566,094420,894242,14785,547
480,430208,63024,200
421,441151,307161,158
4,841,4601,501,8754,480,9061,046,9674,786,495
440,187504,884
2,079,782767,432
2,772,107
Total
● MOTOR VEHICLE EXPORTS (MAJOR EXPORTING COUNTRIES)
Sources: Ward’s, etc.; for Japan, Japan Automobile Manufacturers Association
Note: “—” means data is not available at end of March 2012.Sources: International Motorcycle Manufacturers Association (IMMA); German Motorcycle Industry Association (IVM), etc.; for Japan, Japan Automobile Manufacturers Association
JapanGermanyAustriaSouth KoreaChinaTaiwanIndonesiaIndia
2008Country/Territory
Mopeds Motorcycles& Scooters Total
2009
Mopeds Motorcycles& Scooters Total
2010
Mopeds Motorcycles& Scooters
01,619
——————
1,002,18792,62476,474
—9,727,315
461,867——
1,002,18794,24376,47436,090
9,727,315461,867
64,9681,004,174
0864
——————
543,87975,91449,184
—6,234,302
335,330——
543,87976,77849,18425,434
6,234,302335,33029,815
1,140,058
0———————
493,464———
8,291,590302,350
——
493,464———
8,291,590302,35029,395
1,539,590
Total
In vehicle units
Japan
0 700
U.S.A.
0 600
197
111
150
Germany
0 600
450
358
448
UK
0 600
Belgium
0 600
125
83
105
65
51
50
France
0 600
432
388
479
Spain
0 600
218
188
208
Brazil
0 600
73
48
77
South Korea
0 600
268
215
277
Italy
0 600
56
38
44
● MOTORCYCLE EXPORTS (MAJOR EXPORTING COUNTRIES/TERRITORY) In vehicle units
A Global Increase in Motor Vehicle ExportsMotor vehicle exports (excluding motorcycles) in 2010 increased over the previous year in Brazil (to 767,000 units, up 61.5%), the United States (to 1.50 million units, up 35.7%), Japan (to 4.84 million units, up 33.9%), South Korea (to 2.77 million units, up 29.0%), the United Kingdom (to 1.05 million units, up 26.3%), Germany (to 4.48 million units, up 25.0%), France (to 4.79 million units, up 23.3%), and Spain (to 2.08 million units, up 10.4%). Motorcycle exports in 2010 also showed a year-on-year increase in India (to 1.54 million units, up 35.0%) and China (to 8.29 million units, up 33.0%), but declined in Taiwan (to 302,000 units, down 9.8%) and Japan (to 493,000 units, down 9.3%).
Exports (Including Motorcycles)Motor Vehicles Worldwide
x 10,000 units
08
09
10
08
09
10
08
09
10
08
09
10
08
09
10
08
09
10
08
09
10
08
09
10
08
09
10
08
09
10
673
362
484
58
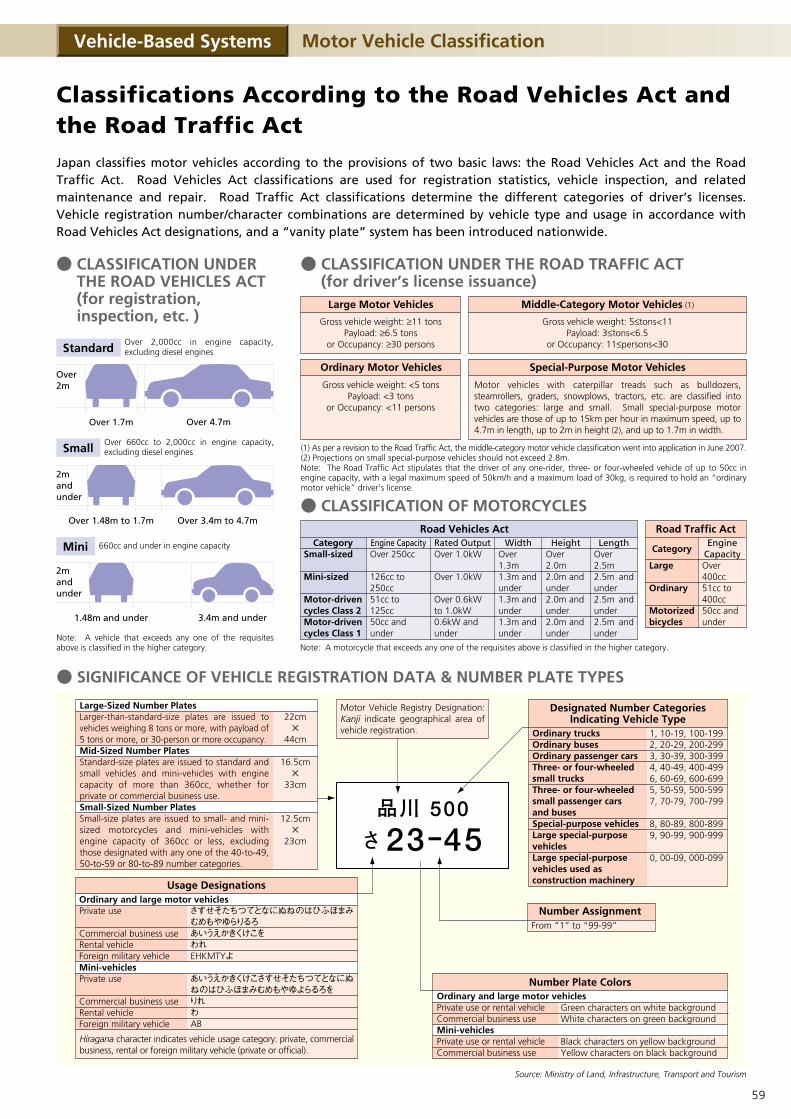
● CLASSIFICATION UNDER THE ROAD TRAFFIC ACT (for driver’s license issuance)
● CLASSIFICATION OF MOTORCYCLES
Note: A motorcycle that exceeds any one of the requisites above is classified in the higher category.Note: A vehicle that exceeds any one of the requisites above is classified in the higher category.
CategorySmall-sized
Mini-sized
Motor-driven cycles Class 2Motor-driven cycles Class 1
Category
Large
Ordinary
Motorized bicycles
Engine CapacityOver400cc51cc to400cc50cc andunder
Engine CapacityOver 250cc
126cc to250cc51cc to125cc50cc andunder
Rated OutputOver 1.0kW
Over 1.0kW
Over 0.6kWto 1.0kW0.6kW andunder
WidthOver 1.3m1.3m and under1.3m and under1.3m and under
HeightOver 2.0m2.0m and under2.0m and under2.0m and under
LengthOver 2.5m2.5m and under2.5m and under2.5m and under
Number Plate Colors
From “1” to “99-99”
Number Assignment Ordinary and large motor vehiclesPrivate use�
Commercial business useRental vehicle�Foreign military vehicle
Private use�
Commercial business use�Rental vehicle�Foreign military vehicle
Usage Designations
Motor Vehicle Registry Designation: Kanji indicate geographical area of vehicle registration.
Road Vehicles Act Road Traffic Act
Standard
Small
Mini
Over 1.48m to 1.7m
Over 1.7m
Over2m
2m andunder
2m andunder
1.48m and under
Over 3.4m to 4.7m
Over 4.7m
3.4m and under
Over 2,000cc in engine capacity, excluding diesel engines
Over 660cc to 2,000cc in engine capacity, excluding diesel engines
660cc and under in engine capacity
(1) As per a revision to the Road Traffic Act, the middle-category motor vehicle classification went into application in June 2007. (2) Projections on small special-purpose vehicles should not exceed 2.8m. Note: The Road Traffic Act stipulates that the driver of any one-rider, three- or four-wheeled vehicle of up to 50cc in engine capacity, with a legal maximum speed of 50km/h and a maximum load of 30kg, is required to hold an “ordinary motor vehicle” driver’s license.
● CLASSIFICATION UNDER THE ROAD VEHICLES ACT (for registration, inspection, etc. )
Large Motor Vehicles
Ordinary Motor Vehicles
Gross vehicle weight: ≥11 tonsPayload: ≥6.5 tons
or Occupancy: ≥30 persons
Gross vehicle weight: <5 tonsPayload: <3 tons
or Occupancy: <11 persons
Special-Purpose Motor Vehicles
Motor vehicles with caterpillar treads such as bulldozers, steamrollers, graders, snowplows, tractors, etc. are classified into two categories: large and small. Small special-purpose motor vehicles are those of up to 15km per hour in maximum speed, up to 4.7m in length, up to 2m in height (2), and up to 1.7m in width.
Middle-Category Motor Vehicles (1)
Gross vehicle weight: 5≤tons<11Payload: 3≤tons<6.5
or Occupancy: 11≤persons<30
Source: Ministry of Land, Infrastructure, Transport and Tourism
Mini-vehicles
Hiragana character indicates vehicle usage category: private, commercial business, rental or foreign military vehicle (private or official).
Ordinary and large motor vehiclesPrivate use or rental vehicleCommercial business useMini-vehiclesPrivate use or rental vehicleCommercial business use
Green characters on white backgroundWhite characters on green background
Black characters on yellow backgroundYellow characters on black background
Designated Number CategoriesIndicating Vehicle Type
Ordinary trucks�Ordinary busesOrdinary passenger carsThree- or four-wheeled small trucksThree- or four-wheeled small passenger cars and buses�Special-purpose vehiclesLarge special-purpose vehiclesLarge special-purpose vehicles used as construction machinery
1, 10-19, 100-1992, 20-29, 200-2993, 30-39, 300-3994, 40-49, 400-499 6, 60-69, 600-6995, 50-59, 500-599 7, 70-79, 700-799
8, 80-89, 800-8999, 90-99, 900-999
0, 00-09, 000-099
● SIGNIFICANCE OF VEHICLE REGISTRATION DATA & NUMBER PLATE TYPES
Classifications According to the Road Vehicles Act and the Road Traffic ActJapan classifies motor vehicles according to the provisions of two basic laws: the Road Vehicles Act and the Road Traffic Act. Road Vehicles Act classifications are used for registration statistics, vehicle inspection, and related maintenance and repair. Road Traffic Act classifications determine the different categories of driver’s licenses. Vehicle registration number/character combinations are determined by vehicle type and usage in accordance with Road Vehicles Act designations, and a “vanity plate” system has been introduced nationwide.
Vehicle-Based Systems Motor Vehicle Classification
Large-Sized Number PlatesLarger-than-standard-size plates are issued to vehicles weighing 8 tons or more, with payload of 5 tons or more, or 30-person or more occupancy.Mid-Sized Number PlatesStandard-size plates are issued to standard and small vehicles and mini-vehicles with engine capacity of more than 360cc, whether for private or commercial business use. Small-Sized Number PlatesSmall-size plates are issued to small- and mini-sized motorcycles and mini-vehicles with engine capacity of 360cc or less, excluding those designated with any one of the 40-to-49, 50-to-59 or 80-to-89 number categories.
22cm×
44cm
16.5cm×
33cm
12.5cm×
23cm
59
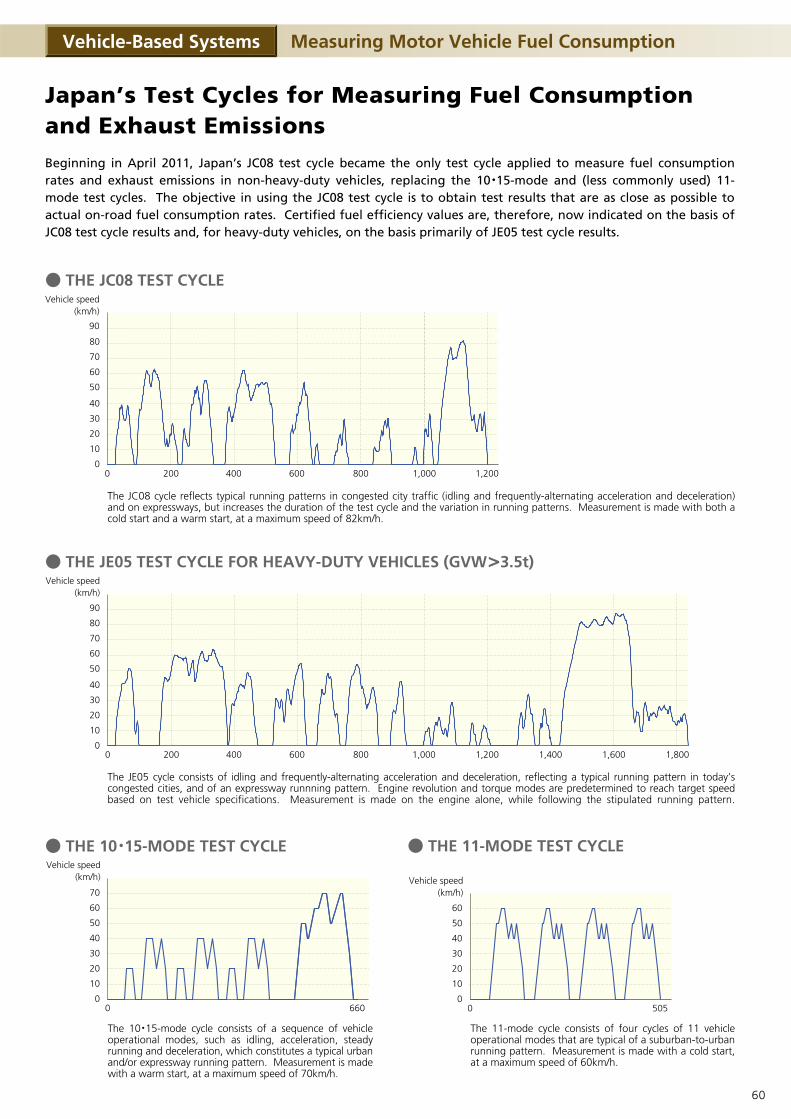
● THE 10 15-MODE TEST CYCLE
70
60
50
40
30
20
10
06600
● THE 11-MODE TEST CYCLE
60
50
40
30
20
10
05050
● THE JE05 TEST CYCLE FOR HEAVY-DUTY VEHICLES (GVW 3.5t)
The 10 15-mode cycle consists of a sequence of vehicle operational modes, such as idling, acceleration, steady running and deceleration, which constitutes a typical urban and/or expressway running pattern. Measurement is made with a warm start, at a maximum speed of 70km/h.
The JE05 cycle consists of idling and frequently-alternating acceleration and deceleration, reflecting a typical running pattern in today’s congested cities, and of an expressway runnning pattern. Engine revolution and torque modes are predetermined to reach target speed based on test vehicle specifications. Measurement is made on the engine alone, while following the stipulated running pattern.
The JC08 cycle reflects typical running patterns in congested city traffic (idling and frequently-alternating acceleration and deceleration) and on expressways, but increases the duration of the test cycle and the variation in running patterns. Measurement is made with both a cold start and a warm start, at a maximum speed of 82km/h.
● THE JC08 TEST CYCLE
The 11-mode cycle consists of four cycles of 11 vehicle operational modes that are typical of a suburban-to-urban running pattern. Measurement is made with a cold start, at a maximum speed of 60km/h.
Vehicle speed(km/h) Vehicle speed
(km/h)
90
80
Vehicle speed(km/h)
70
60
50
40
30
20
10
00 200 400 600 800 1,000 1,200 1,400 1,600
80
70
60
50
40
30
20
10
01,200
1,800
0 200 400 600 800 1,000
90
Vehicle speed(km/h)
Japan’s Test Cycles for Measuring Fuel Consumption and Exhaust EmissionsBeginning in April 2011, Japan’s JC08 test cycle became the only test cycle applied to measure fuel consumption rates and exhaust emissions in non-heavy-duty vehicles, replacing the 10 15-mode and (less commonly used) 11-mode test cycles. The objective in using the JC08 test cycle is to obtain test results that are as close as possible to actual on-road fuel consumption rates. Certified fuel efficiency values are, therefore, now indicated on the basis of JC08 test cycle results and, for heavy-duty vehicles, on the basis primarily of JE05 test cycle results.
Vehicle-Based Systems Measuring Motor Vehicle Fuel Consumption
60
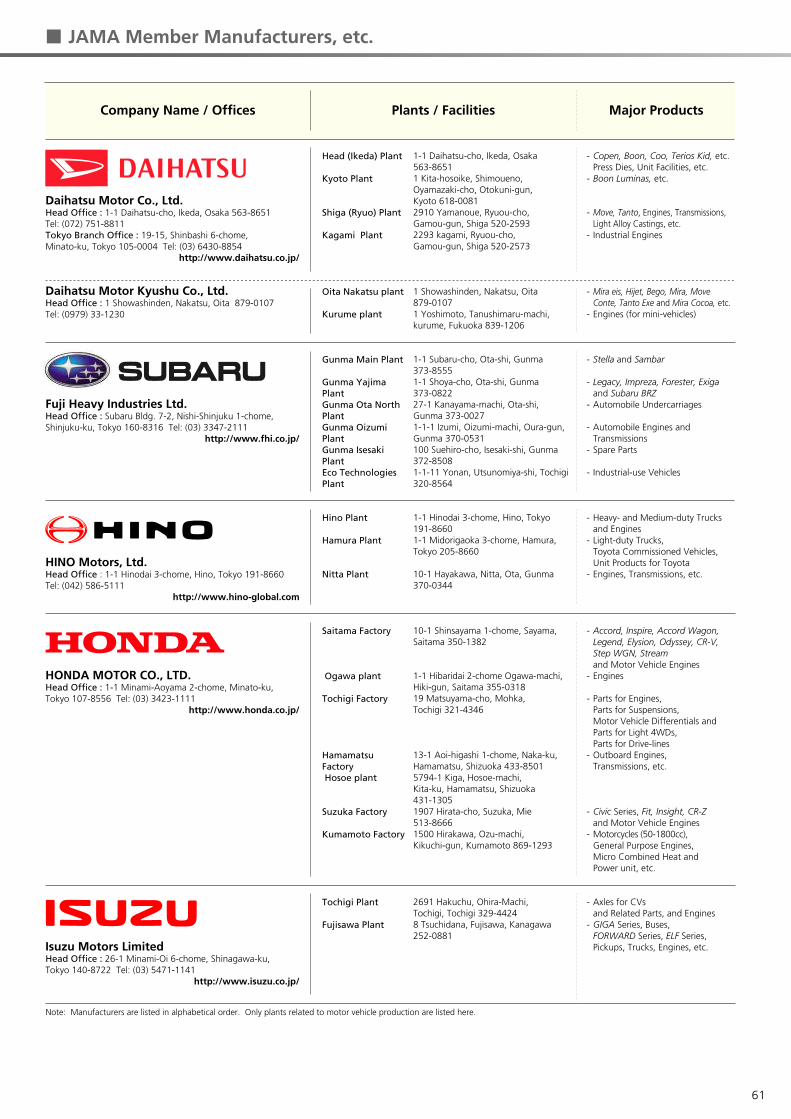
Copen, Boon, Coo, Terios Kid, etc.Press Dies, Unit Facilities, etc.Boon Luminas, etc.
Move, Tanto, Engines, Transmissions, Light Alloy Castings, etc.Industrial Engines
Mira eis, Hijet, Bego, Mira, Move Conte, Tanto Exe and Mira Cocoa, etc.Engines (for mini-vehicles)
Stella and Sambar
Legacy, Impreza, Forester, Exigaand Subaru BRZAutomobile Undercarriages
Automobile Engines and TransmissionsSpare Parts
Industrial-use Vehicles
Heavy- and Medium-duty Trucksand EnginesLight-duty Trucks, Toyota Commissioned Vehicles, Unit Products for ToyotaEngines, Transmissions, etc.
Accord, Inspire, Accord Wagon,Legend, Elysion, Odyssey, CR-V, Step WGN, Stream and Motor Vehicle EnginesEngines
Parts for Engines, Parts for Suspensions, Motor Vehicle Differentials and Parts for Light 4WDs,Parts for Drive-linesOutboard Engines, Transmissions, etc.
Civic Series, Fit, Insight, CR-Zand Motor Vehicle EnginesMotorcycles (50-1800cc), General Purpose Engines, Micro Combined Heat and Power unit, etc.
Axles for CVs and Related Parts, and EnginesGIGA Series, Buses, FORWARD Series, ELF Series, Pickups, Trucks, Engines, etc.
-
-
-
-
-
-
-
-
-
-
-
-
-
-
-
-
-
-
-
-
-
-
-
1-1 Daihatsu-cho, Ikeda, Osaka 563-86511 Kita-hosoike, Shimoueno, Oyamazaki-cho, Otokuni-gun, Kyoto 618-00812910 Yamanoue, Ryuou-cho, Gamou-gun, Shiga 520-25932293 kagami, Ryuou-cho, Gamou-gun, Shiga 520-2573
1 Showashinden, Nakatsu, Oita 879-01071 Yoshimoto, Tanushimaru-machi, kurume, Fukuoka 839-1206
1-1 Subaru-cho, Ota-shi, Gunma 373-85551-1 Shoya-cho, Ota-shi, Gunma 373-082227-1 Kanayama-machi, Ota-shi, Gunma 373-00271-1-1 Izumi, Oizumi-machi, Oura-gun, Gunma 370-0531100 Suehiro-cho, Isesaki-shi, Gunma 372-85081-1-11 Yonan, Utsunomiya-shi, Tochigi 320-8564
1-1 Hinodai 3-chome, Hino, Tokyo 191-86601-1 Midorigaoka 3-chome, Hamura, Tokyo 205-8660
10-1 Hayakawa, Nitta, Ota, Gunma 370-0344
10-1 Shinsayama 1-chome, Sayama, Saitama 350-1382
1-1 Hibaridai 2-chome Ogawa-machi, Hiki-gun, Saitama 355-031819 Matsuyama-cho, Mohka, Tochigi 321-4346
13-1 Aoi-higashi 1-chome, Naka-ku, Hamamatsu, Shizuoka 433-85015794-1 Kiga, Hosoe-machi,Kita-ku, Hamamatsu, Shizuoka 431-13051907 Hirata-cho, Suzuka, Mie 513-86661500 Hirakawa, Ozu-machi, Kikuchi-gun, Kumamoto 869-1293
2691 Hakuchu, Ohira-Machi, Tochigi, Tochigi 329-44248 Tsuchidana, Fujisawa, Kanagawa 252-0881
Head (Ikeda) Plant
Kyoto Plant
Shiga (Ryuo) Plant
Kagami Plant
Oita Nakatsu plant
Kurume plant
Gunma Main Plant
Gunma Yajima PlantGunma Ota North PlantGunma Oizumi PlantGunma Isesaki PlantEco Technologies Plant
Hino Plant
Hamura Plant
Nitta Plant
Saitama Factory
Ogawa plant
Tochigi Factory
Hamamatsu Factory Hosoe plant
Suzuka Factory
Kumamoto Factory
Tochigi Plant
Fujisawa Plant
Daihatsu Motor Co., Ltd.Head Office : 1-1 Daihatsu-cho, Ikeda, Osaka 563-8651 Tel: (072) 751-8811 Tokyo Branch Office : 19-15, Shinbashi 6-chome, Minato-ku, Tokyo 105-0004 Tel: (03) 6430-8854
http://www.daihatsu.co.jp/
Daihatsu Motor Kyushu Co., Ltd.Head Office : 1 Showashinden, Nakatsu, Oita 879-0107 Tel: (0979) 33-1230
Fuji Heavy Industries Ltd.Head Office : Subaru Bldg. 7-2, Nishi-Shinjuku 1-chome, Shinjuku-ku, Tokyo 160-8316 Tel: (03) 3347-2111
� http://www.fhi.co.jp/
HINO Motors, Ltd.Head Office : 1-1 Hinodai 3-chome, Hino, Tokyo 191-8660 Tel: (042) 586-5111
http://www.hino-global.com
HONDA MOTOR CO., LTD.Head Office : 1-1 Minami-Aoyama 2-chome, Minato-ku, Tokyo 107-8556 Tel: (03) 3423-1111
� http://www.honda.co.jp/
Isuzu Motors LimitedHead Office : 26-1 Minami-Oi 6-chome, Shinagawa-ku, Tokyo 140-8722 Tel: (03) 5471-1141
http://www.isuzu.co.jp/
Company Name / Offices Plants / Facilities Major Products
■ JAMA Member Manufacturers, etc.
Note: Manufacturers are listed in alphabetical order. Only plants related to motor vehicle production are listed here.
61
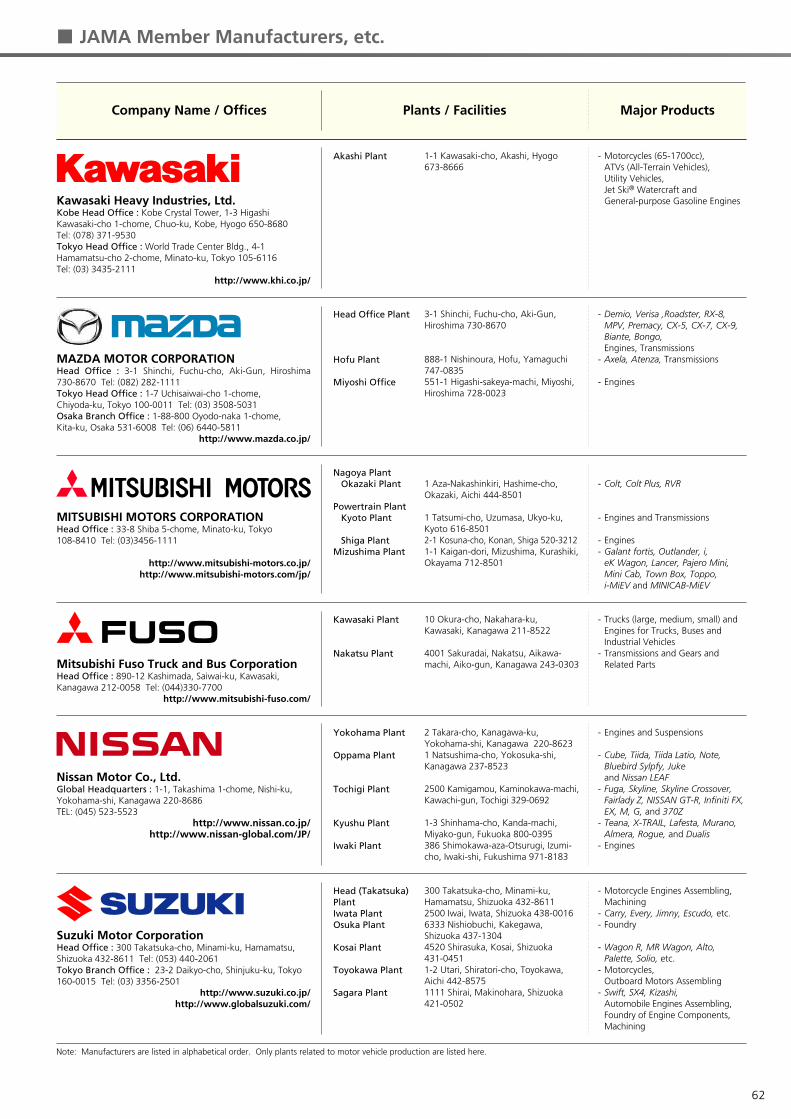
Kawasaki Heavy Industries, Ltd.Kobe Head Office : Kobe Crystal Tower, 1-3 Higashi Kawasaki-cho 1-chome, Chuo-ku, Kobe, Hyogo 650-8680Tel: (078) 371-9530Tokyo Head Office : World Trade Center Bldg., 4-1 Hamamatsu-cho 2-chome, Minato-ku, Tokyo 105-6116 Tel: (03) 3435-2111
http://www.khi.co.jp/
MAZDA MOTOR CORPORATIONHead Office : 3-1 Shinchi, Fuchu-cho, Aki-Gun, Hiroshima 730-8670 Tel: (082) 282-1111Tokyo Head Office : 1-7 Uchisaiwai-cho 1-chome, Chiyoda-ku, Tokyo 100-0011 Tel: (03) 3508-5031Osaka Branch Office : 1-88-800 Oyodo-naka 1-chome, Kita-ku, Osaka 531-6008 Tel: (06) 6440-5811
http://www.mazda.co.jp/
MITSUBISHI MOTORS CORPORATIONHead Office : 33-8 Shiba 5-chome, Minato-ku, Tokyo 108-8410 Tel: (03)3456-1111
http://www.mitsubishi-motors.co.jp/http://www.mitsubishi-motors.com/jp/
Mitsubishi Fuso Truck and Bus CorporationHead Office : 890-12 Kashimada, Saiwai-ku, Kawasaki, Kanagawa 212-0058 Tel: (044)330-7700
http://www.mitsubishi-fuso.com/
Nissan Motor Co., Ltd.Global Headquarters : 1-1, Takashima 1-chome, Nishi-ku, Yokohama-shi, Kanagawa 220-8686TEL: (045) 523-5523
http://www.nissan.co.jp/http://www.nissan-global.com/JP/
Suzuki Motor CorporationHead Office : 300 Takatsuka-cho, Minami-ku, Hamamatsu, Shizuoka 432-8611 Tel: (053) 440-2061Tokyo Branch Office : 23-2 Daikyo-cho, Shinjuku-ku, Tokyo 160-0015 Tel: (03) 3356-2501
http://www.suzuki.co.jp/http://www.globalsuzuki.com/
■ JAMA Member Manufacturers, etc.
Company Name / Offices Plants / Facilities Major Products
Motorcycles (65-1700cc), ATVs (All-Terrain Vehicles), Utility Vehicles, Jet Ski® Watercraft and General-purpose Gasoline Engines
Demio, Verisa ,Roadster, RX-8, MPV, Premacy, CX-5, CX-7, CX-9, Biante, Bongo, Engines, TransmissionsAxela, Atenza, Transmissions
Engines
Colt, Colt Plus, RVR
Engines and Transmissions
Engines Galant fortis, Outlander, i, eK Wagon, Lancer, Pajero Mini, Mini Cab, Town Box, Toppo, i-MiEV and MINICAB-MiEV
Trucks (large, medium, small) and Engines for Trucks, Buses and Industrial VehiclesTransmissions and Gears and Related Parts
Engines and Suspensions
Cube, Tiida, Tiida Latio, Note, Bluebird Sylpfy, Juke and Nissan LEAFFuga, Skyline, Skyline Crossover, Fairlady Z, NISSAN GT-R, Infiniti FX, EX, M, G, and 370ZTeana, X-TRAIL, Lafesta, Murano, Almera, Rogue, and DualisEngines
Motorcycle Engines Assembling, MachiningCarry, Every, Jimny, Escudo, etc.Foundry
Wagon R, MR Wagon, Alto,Palette, Solio, etc.Motorcycles,Outboard Motors AssemblingSwift, SX4, Kizashi, Automobile Engines Assembling, Foundry of Engine Components, Machining
-
-
-
-
-
-
--
-
-
-
-
-
-
-
-
--
-
-
-
1-1 Kawasaki-cho, Akashi, Hyogo 673-8666
3-1 Shinchi, Fuchu-cho, Aki-Gun, Hiroshima 730-8670
888-1 Nishinoura, Hofu, Yamaguchi 747-0835551-1 Higashi-sakeya-machi, Miyoshi, Hiroshima 728-0023
1 Aza-Nakashinkiri, Hashime-cho, Okazaki, Aichi 444-8501
1 Tatsumi-cho, Uzumasa, Ukyo-ku, Kyoto 616-85012-1 Kosuna-cho, Konan, Shiga 520-32121-1 Kaigan-dori, Mizushima, Kurashiki, Okayama 712-8501
10 Okura-cho, Nakahara-ku, Kawasaki, Kanagawa 211-8522
4001 Sakuradai, Nakatsu, Aikawa-machi, Aiko-gun, Kanagawa 243-0303
2 Takara-cho, Kanagawa-ku, Yokohama-shi, Kanagawa 220-8623 1 Natsushima-cho, Yokosuka-shi, Kanagawa 237-8523
2500 Kamigamou, Kaminokawa-machi, Kawachi-gun, Tochigi 329-0692
1-3 Shinhama-cho, Kanda-machi, Miyako-gun, Fukuoka 800-0395 386 Shimokawa-aza-Otsurugi, Izumi-cho, Iwaki-shi, Fukushima 971-8183
300 Takatsuka-cho, Minami-ku, Hamamatsu, Shizuoka 432-86112500 Iwai, Iwata, Shizuoka 438-00166333 Nishiobuchi, Kakegawa, Shizuoka 437-13044520 Shirasuka, Kosai, Shizuoka 431-04511-2 Utari, Shiratori-cho, Toyokawa, Aichi 442-85751111 Shirai, Makinohara, Shizuoka 421-0502
Akashi Plant
Head Office Plant
Hofu Plant
Miyoshi Office
Nagoya Plant Okazaki Plant
Powertrain Plant Kyoto Plant
Shiga PlantMizushima Plant
Kawasaki Plant
Nakatsu Plant
Yokohama Plant
Oppama Plant
Tochigi Plant
Kyushu Plant
Iwaki Plant
Head (Takatsuka) PlantIwata PlantOsuka Plant
Kosai Plant
Toyokawa Plant
Sagara Plant
Note: Manufacturers are listed in alphabetical order. Only plants related to motor vehicle production are listed here.
62

Hybrid System Parts, Forged PartsCrown, Mark , Estima, LFAEnginesCorolla, iQTransmission-related Parts, Cold-forged and Sintered Parts, Engine-related PartsPrius, Premio, Allion, Camry, Scion tCPowertrain-related Suspension Cast Parts, Powertrain-related Suspension Machined PartsEngines, Turbocharges, Catalytic ConvertersTransmission-related PartsLS, RAV4, GS, IS, IS F, Land Cruiser, GX, Vanguard, Wish, 4RUNNER, EnginesMechanical Equipment, Moldings for Resin and Casting and ForgingResearch and Development and Production of Electronic Control Devices, ICs
Harrier, SAI, IS, ES, RX, HS, CT, HighlanderEngines and Hybrid System Parts
Automobile Parts Including Automatic Transmissions, Continuously Variable Transmissions, Transfers, Aluminum Wheels
Electronic Controlled Brakes, Suspensions, Axles, Torque Converters
Large-, Medium- and Small-sized Trucks and EnginesCast PartsTransmissions
Assembly of Motorcycles (50-1900cc), Engines and SnowmobilesManufacturing of Cast Parts and EnginesForging and Steel Processing
Plastic Forming and Painting
Processing of Engine Parts and Packing of Motorcycle Parts for ExportProcessing of Major Body Parts
Frame Welding
-----
-
-
-
--
-
-
--
-
-
-
--
-
-
-
-
-
-
-
1 Toyota-cho, Toyota, Aichi 471-85711 Motomachi, Toyota, Aichi 471-85731 Taisei-cho, Toyota, Aichi 470-12171 Sankou, Honda-cho, Toyota, Aichi 473-09381 Namiki, Uchikoshi-cho, Miyoshi, Aichi 470-02131 Umanokashira, Tsutsumi-cho, Toyota, Aichi 473-09321 Nishiyama, Myochi-cho, Miyoshi, Aichi 470-02141 Shimoyama, Uchikoshi-cho, Miyoshi, Aichi 470-021310-1 Tamatsuura-machi, Hekinan, Aichi 447-08343-1 Midorigahama, Tahara, Aichi 441-34017 Teiho-cho, Toyota, Aichi 471-8574
543 Kirigahora, Nishi-hirose-cho, Toyota, Aichi 470-0309
1 Kamiaruki, Miyawaka, Fukuoka 823-00159-2 Torigoe-cho, Kanda-machi, Miyako-gun, Fukuoka 800-03043914-58 Kusami, Kokura-minami-ku, Kita-Kyushu, Fukuoka
145-1 Yufutsu, Tomakomai, Hokkaido 059-1393
1-1 Matsusakadaira 5-chome, Taiwa-cho, Kurokawa-gun, Miyagi 981-3408
1-1 Ageo, Saitama 362-8523
3121-1 Mida, Konosu, Saitama 365-0062705-24 Komatsudai 2-chome, Hanyu, Saitama 348-0038
2500 Shingai, Iwata, Shizuoka 438-8501800 Tenryu, Iwata, Shizuoka 438-0075
1280 Nakajo, Hamakita-ku, Hamamatsu, Shizuoka 434-85014444 Nakaze, Hamakita-ku, Hamamatsu, Shizuoka 434-00123080 Yamashina, Fukuroi, Shizuoka 437-00661204 Godaijima, Iwata, Shizuoka 438-01141-2 Nakagawa, Morimachi, Syuchi-gun, Shizuoka 437-0223
Honsha Plant Motomachi PlantKamigo PlantTakaoka PlantMiyoshi Plant
Tsutsumi Plant
Myochi Plant
Shimoyama Plant
Kinu-ura PlantTahara Plant
Teiho Plant
Hirose Plant
Miyata PlantKanda Plant
Kokura Plant
Plant
Plant
Ageo Plant
Konosu PlantHanyu Plant
Iwata Main Factory
Iwata South FactoryHamakita Factory
Nakaze Factory
Fukuroi Factory
Toyooka Factory
Morimachi Factory
TOYOTA MOTOR CORPORATIONHead Office : 1 Toyota-cho, Toyota, Aichi 471-8571 Tel: (0565) 28-2121 Tokyo Head Office : 4-18 Koraku 1-chome, Bunkyo-ku, Tokyo 112-8701 Tel: (03) 3817-7111Nagoya Office : 7-1 Meieki 4-chome, Nakamura-ku, Nagoya, Aichi 450-8711 Tel: (052) 552-2111
http://www.toyota.co.jp/
Toyota Motor Kyushu, Inc.Head Office : 1 Kamiaruki, Miyawaka, Fukuoka 823-0015 Tel: (0949) 32-5151
Toyota Motor Hokkaido, Inc.Head Office : 145-1 Yufutsu, Tomakomai, Hokkaido 059-1393Tel: (0144) 57-2121
Toyota Motor Tohoku, Inc.Head Office : 1-1 Matsusakadaira 5-chome, Taiwa-cho, Kurokawa-gun, Miyagi 981-3408 Tel: (022) 345-6711
UD Trucks CorporationHead Office : 1-1 Ageo, Saitama 362-8523 Tel: (048) 781-2301
http://www.udtrucks.co.jp/http://www.udtrucks.com/
YAMAHA MOTOR CO., Ltd.Head Office : 2500 Shingai, Iwata, Shizuoka 438-8501 Tel: (0538) 32-1115Tokyo Office : 1-1 Marunouchi 2-chome, Chiyoda-ku, Tokyo 100-0005 Tel: (03) 5220-7200
http://www.yamaha-motor.co.jp/
Special Friend:
General Motors Japan LIMITEDHead Office : 12-8 Higashi-shinagawa 4-chome, Shinagawa-ku, Tokyo 140-8687 Tel: (03) 6711-5700
http://www.gmjapan.co.jp/
Company Name / Offices Plants / Facilities Major Products
63

● Vehicle Assembly Plants● Parts Plants
■ Locations of Auto Manufacturing Plants
HokkaidoToyota Motor Hokkaido
MiyagiToyota Motor Tohoku
FukushimaNissan (Iwaki)
TochigiIsuzu (Tochigi)Nissan (Tochigi)Fuji Heavy Industries (Eco Technologies)Honda (Tochigi)
SaitamaUD Trucks (Ageo)UD Trucks (Konosu)UD Trucks (Hanyu)Honda (Saitama)Honda (Ogawa)
TokyoHino (Hino)Hino (Hamura)
KanagawaIsuzu (Fujisawa)Nissan (Yokohama)Nissan (Oppama)Mitsubishi Fuso (Kawasaki)Mitsubishi Fuso (Nakatsu)
ShizuokaSuzuki (Takatsuka)Suzuki (Iwata)Suzuki (Osuka)Suzuki (Kosai)Suzuki (Sagara)Honda (Hamamatsu)Honda (Hosoe)Yamaha (Iwata Main)Yamaha (Iwata South)Yamaha (Hamakita)Yamaha (Nakaze)Yamaha (Fukuroi)Yamaha (Toyooka)Yamaha (Morimachi)
GunmaHINO (Nitta)
Fuji Heavy Industries (Main Plant)Fuji Heavy Industries (Yajima)
Fuji Heavy Industries (Ota North)Fuji Heavy Industries (Oizumi)Fuji Heavy Industries (Isesaki)
OsakaDaihatsu (Ikeda)
HyogoKawasaki (Akashi)
KyotoDaihatsu (Kyoto)
Mitsubishi (Kyoto)
ShigaDaihatsu (Shiga)
Daihatsu (Kagami)Mitsubishi (Shiga)
AichiSuzuki (Toyokawa)Toyota (Honsha)Toyota (Motomachi)Toyota (Kamigo)Toyota (Takaoka)Toyota (Miyoshi)Toyota (Tsutsumi)Toyota (Myochi)Toyota (Shimoyama)Toyota (Kinu-ura)Toyota (Tahara)Toyota (Teiho)Toyota (Hirose)Mitsubishi (Okazaki)
MieHonda (Suzuka)
OitaDaihatsu Kyushu (Oita)
FukuokaNissan (Kyushu)Daihatsu Kyushu (Kurume)Toyota Motor Kyushu (Miyata)Toyota Motor Kyushu (Kanda)Toyota Motor Kyushu (Kokura)
KumamotoHonda (Kumamoto)
OkayamaMitsubishi (Mizushima)
HiroshimaMazda (Head Office)
Mazda (Miyoshi)
YamaguchiMazda (Hofu)
64
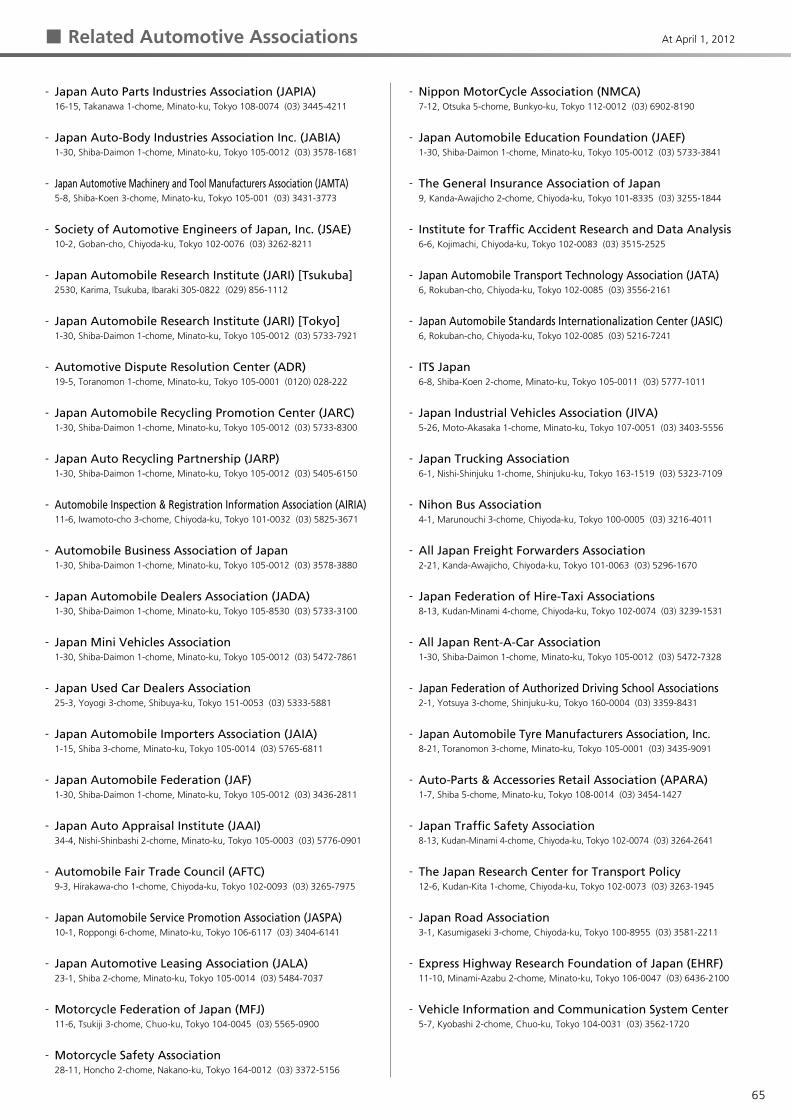
16-15, Takanawa 1-chome, Minato-ku, Tokyo 108-0074 (03) 3445-4211
1-30, Shiba-Daimon 1-chome, Minato-ku, Tokyo 105-0012 (03) 3578-1681
5-8, Shiba-Koen 3-chome, Minato-ku, Tokyo 105-001 (03) 3431-3773
10-2, Goban-cho, Chiyoda-ku, Tokyo 102-0076 (03) 3262-8211
2530, Karima, Tsukuba, Ibaraki 305-0822 (029) 856-1112
1-30, Shiba-Daimon 1-chome, Minato-ku, Tokyo 105-0012 (03) 5733-7921
19-5, Toranomon 1-chome, Minato-ku, Tokyo 105-0001 (0120) 028-222
1-30, Shiba-Daimon 1-chome, Minato-ku, Tokyo 105-0012 (03) 5733-8300
1-30, Shiba-Daimon 1-chome, Minato-ku, Tokyo 105-0012 (03) 5405-6150
11-6, Iwamoto-cho 3-chome, Chiyoda-ku, Tokyo 101-0032 (03) 5825-3671
1-30, Shiba-Daimon 1-chome, Minato-ku, Tokyo 105-0012 (03) 3578-3880
1-30, Shiba-Daimon 1-chome, Minato-ku, Tokyo 105-8530 (03) 5733-3100
1-30, Shiba-Daimon 1-chome, Minato-ku, Tokyo 105-0012 (03) 5472-7861
25-3, Yoyogi 3-chome, Shibuya-ku, Tokyo 151-0053 (03) 5333-5881
1-15, Shiba 3-chome, Minato-ku, Tokyo 105-0014 (03) 5765-6811
1-30, Shiba-Daimon 1-chome, Minato-ku, Tokyo 105-0012 (03) 3436-2811
34-4, Nishi-Shinbashi 2-chome, Minato-ku, Tokyo 105-0003 (03) 5776-0901
9-3, Hirakawa-cho 1-chome, Chiyoda-ku, Tokyo 102-0093 (03) 3265-7975
10-1, Roppongi 6-chome, Minato-ku, Tokyo 106-6117 (03) 3404-6141
23-1, Shiba 2-chome, Minato-ku, Tokyo 105-0014 (03) 5484-7037
11-6, Tsukiji 3-chome, Chuo-ku, Tokyo 104-0045 (03) 5565-0900
28-11, Honcho 2-chome, Nakano-ku, Tokyo 164-0012 (03) 3372-5156
7-12, Otsuka 5-chome, Bunkyo-ku, Tokyo 112-0012 (03) 6902-8190
1-30, Shiba-Daimon 1-chome, Minato-ku, Tokyo 105-0012 (03) 5733-3841
9, Kanda-Awajicho 2-chome, Chiyoda-ku, Tokyo 101-8335 (03) 3255-1844
6-6, Kojimachi, Chiyoda-ku, Tokyo 102-0083 (03) 3515-2525
6, Rokuban-cho, Chiyoda-ku, Tokyo 102-0085 (03) 3556-2161
6, Rokuban-cho, Chiyoda-ku, Tokyo 102-0085 (03) 5216-7241
6-8, Shiba-Koen 2-chome, Minato-ku, Tokyo 105-0011 (03) 5777-1011
5-26, Moto-Akasaka 1-chome, Minato-ku, Tokyo 107-0051 (03) 3403-5556
6-1, Nishi-Shinjuku 1-chome, Shinjuku-ku, Tokyo 163-1519 (03) 5323-7109
4-1, Marunouchi 3-chome, Chiyoda-ku, Tokyo 100-0005 (03) 3216-4011
2-21, Kanda-Awajicho, Chiyoda-ku, Tokyo 101-0063 (03) 5296-1670
8-13, Kudan-Minami 4-chome, Chiyoda-ku, Tokyo 102-0074 (03) 3239-1531
1-30, Shiba-Daimon 1-chome, Minato-ku, Tokyo 105-0012 (03) 5472-7328
2-1, Yotsuya 3-chome, Shinjuku-ku, Tokyo 160-0004 (03) 3359-8431
8-21, Toranomon 3-chome, Minato-ku, Tokyo 105-0001 (03) 3435-9091
1-7, Shiba 5-chome, Minato-ku, Tokyo 108-0014 (03) 3454-1427
8-13, Kudan-Minami 4-chome, Chiyoda-ku, Tokyo 102-0074 (03) 3264-2641
12-6, Kudan-Kita 1-chome, Chiyoda-ku, Tokyo 102-0073 (03) 3263-1945
3-1, Kasumigaseki 3-chome, Chiyoda-ku, Tokyo 100-8955 (03) 3581-2211
11-10, Minami-Azabu 2-chome, Minato-ku, Tokyo 106-0047 (03) 6436-2100
5-7, Kyobashi 2-chome, Chuo-ku, Tokyo 104-0031 (03) 3562-1720
-
-
-
-
-
-
-
-
-
-
-
-
-
-
-
-
-
-
-
-
-
-
-
-
-
-
-
-
-
-
-
-
-
-
-
-
-
-
-
-
-
-
-
Japan Auto Parts Industries Association (JAPIA)
Japan Auto-Body Industries Association Inc. (JABIA)
Japan Automotive Machinery and Tool Manufacturers Association (JAMTA)
Society of Automotive Engineers of Japan, Inc. (JSAE)
Japan Automobile Research Institute (JARI) [Tsukuba]
Japan Automobile Research Institute (JARI) [Tokyo]
Automotive Dispute Resolution Center (ADR)
Japan Automobile Recycling Promotion Center (JARC)
Japan Auto Recycling Partnership (JARP)
Automobile Inspection & Registration Information Association (AIRIA)
Automobile Business Association of Japan
Japan Automobile Dealers Association (JADA)
Japan Mini Vehicles Association
Japan Used Car Dealers Association
Japan Automobile Importers Association (JAIA)
Japan Automobile Federation (JAF)
Japan Auto Appraisal Institute (JAAI)
Automobile Fair Trade Council (AFTC)
Japan Automobile Service Promotion Association (JASPA)
Japan Automotive Leasing Association (JALA)
Motorcycle Federation of Japan (MFJ)
Motorcycle Safety Association
Nippon MotorCycle Association (NMCA)
Japan Automobile Education Foundation (JAEF)
The General Insurance Association of Japan
Institute for Traffic Accident Research and Data Analysis
Japan Automobile Transport Technology Association (JATA)
Japan Automobile Standards Internationalization Center (JASIC)
ITS Japan
Japan Industrial Vehicles Association (JIVA)
Japan Trucking Association
Nihon Bus Association
All Japan Freight Forwarders Association
Japan Federation of Hire-Taxi Associations
All Japan Rent-A-Car Association
Japan Federation of Authorized Driving School Associations
Japan Automobile Tyre Manufacturers Association, Inc.
Auto-Parts & Accessories Retail Association (APARA)
Japan Traffic Safety Association
The Japan Research Center for Transport Policy
Japan Road Association
Express Highway Research Foundation of Japan (EHRF)
Vehicle Information and Communication System Center
■ Related Automotive Associations At April 1, 2012
65
©JAMA. All rights reserved. Printed with Vegetable oil ink.
THE MOTOR INDUSTRY OF JAPAN 2012 Published May 2012
Japan Automobile Manufacturers Association, Inc.Jidosha Kaikan, 1-30 Shiba Daimon 1-chome, Minato-ku, Tokyo 105-0012 JapanFor inquiries about this booklet, write or telephone: Public Relations Office, JAMA Tel: +81 (3) 5405-6119
http://www.jama.or.jp/