Embed Size (px)
Citation preview
International Journal of Rotating Machinery, 10(6): 495–506, 2004Copyright c© Taylor & Francis Inc.ISSN: 1023-621X print / 1542-3034 onlineDOI: 10.1080/10236210490506425
Unsteady Interaction Between a Transonic TurbineStage and Downstream Components
Roger L. DavisUniversity of California-Davis, Davis, California, USA
Jixian YaoGeneral Electric, Corporate R&D Center, Niskayuna, New York, USA
John P. ClarkTurbine Research Facility, Air Force Research Lab, Dayton, Ohio, USA
Gary StetsonPratt & Whitney, E. Hartford, Connecticut, USA
Juan J. Alonso and Antony JamesonStanford University, Stanford, California, USA
Charles W. Haldeman and Michael G. DunnGas Turbine Laboratory, Ohio State University, Columbus, Ohio, USA
Results from a numerical simulation of the unsteady flowthrough one quarter of the circumference of a transonichigh-pressure turbine stage, transition duct, and low-pressure turbine first vane are presented and compared withexperimental data. Analysis of the unsteady pressure field re-sulting from the simulation shows the effects of not only therotor/stator interaction of the high-pressure turbine stagebut also new details of the interaction between the blade andthe downstream transition duct and low-pressure turbinevane. Blade trailing edge shocks propagate downstream,strike, and reflect off of the transition duct hub and/or down-stream vane leading to high unsteady pressure on thesedownstream components. The reflection of these shocks from
Received 14 January 2003; accepted 4 April 2004.The authors would like to thank the U.S. Department of Energy
(DoE) for its generous support under the ASCI program. The au-thors would especially like to recognize the support of the staff at theLawrence Livermore National Laboratory. We would also like to thankthe managers at United Technologies Research Center and Pratt &Whitney for their support.
Address correspondence to Roger L. Davis, Department of Mechan-ical and Aeronautical Engineering, University of California, Davis, OneShields Avenue, 2104 Bainer Hall, Davis, CA 95616, USA. E-mail:[email protected]
the downstream components back into the blade itself hasalso been found to increase the level of unsteady pressurefluctuations on the uncovered portion of the blade suctionsurface. In addition, the blade tip vortex has been found tohave a moderately strong interaction with the downstreamvane even with the considerable axial spacing between thetwo blade-rows. Fourier decomposition of the unsteady sur-face pressure of the blade and downstream low-pressure tur-bine vane shows the magnitude of the various frequenciescontributing to the unsteady loads. Detailed comparisonsbetween the computed unsteady surface pressure spectrumand the experimental data are shown along with a discussionof the various interaction mechanisms between the blade,transition duct, and downstream vane. These comparisonsshow overall good agreement between the simulation and ex-perimental data and identify areas where further improve-ments in modeling are needed.
Keywords Turbomachinery, Aeroelasticity, Forced response, High-cycle fatigue, Unsteady flow
INTRODUCTIONSignificant experimental and numerical research has been
performed over the last several years on highlighting andunderstanding the unsteady aerodynamics of multi-stage
495
496 R. L. DAVIS ET AL.
turbomachinery (e.g., Reinmoller et al., 2001; Arnone et al.,2001; Gombert and Hohn, 2001; Hohn, 2001; Dorney et al.,2001; Clark et al., 2000; Busby et al., 1998; Rao et al., 1994;Chen et al., 1994; Sharma et al., 1992; Takahashi and Ni, 1991;Giles, 1990; Jorgenson and Chima, 1990; Rai, 1987; Dring et al.,1992). Much of this work has focused on quantifying the un-steady flow field resulting from the interaction between rotorsand stators in terms of aerodynamic performance and airfoilsurface unsteady pressure. Losses in aerodynamic performancedue to unsteady flows can be significant and the amplitude andfrequency of the unsteady airfoil surface pressure can resultin excessive stress levels that result in premature fatigue. Thedrive to remove weight and cost from the engine has pusheddesigns toward single-stage, transonic high-pressure turbines.The rotor/stator interaction of transonic turbine stages has beenof particular interest recently because of the additional time-average losses and unsteady interactions caused by the trail-ing edge shock systems that exist at supersonic exit conditions(e.g., Clark et al., 2000; Busby et al., 1998). Another factor re-cently brought to light in transonic high-pressure turbine stagesis the interaction of the trailing edge shock system with transi-tion ducts and the vanes of the downstream low pressure turbine.These downstream components can produce significant reflec-tions of the high-pressure turbine shocks back upstream intothe high-pressure turbine itself causing large unsteady pressureamplitudes and possible stress problems. Also, recent numer-ical investigations (Clark et al., 2000; Yao et al., 2002) havealso shown the importance of modeling actual blade counts inunsteady-flow turbine multi-stage simulations for accurate pre-diction of both entropy migration and the unsteady frequencyspectrum resulting from rotor/stator interaction.
In an effort to drive toward large-scale, multi-component,multi-physics simulation capability, the Department of Energy(DoE) launched the Accelerated Strategic Computing Initiative(ASCI) Program. The goal of this program is to promote theapplication and development of massively parallel computersystems for the solution of large-scale engineering and scienceproblems. The current investigation, which is a part of the DoEASCI program, is focused on developing and demonstratinglarge-scale simulation capability for flows in gas-turbine en-gines (see Reynolds et al., 2001). Specifically, the current efforthas been focused on demonstrating the capability to compute un-steady flows in multi-stages of a turbine and illustrating the flowphysics associated with high-/low-pressure turbine interaction.
This article presents the results from a numerical simula-tion of unsteady flow through a single-stage, high-pressure tur-bine, transition duct, and downstream low-pressure turbine vane.These results are compared with experimental time-averagedand unsteady surface pressure data. In order to obtain accuratepredictions of the loss migration and unsteady surface pressure,one quarter of the circumference of the machine is simulated.Details of the shock/blade/transition duct interaction are dis-cussed along with an analysis of the unsteady pressure spec-trum. The predicted time-average and unsteady surface pressure
distributions are compared with experimental data. These re-sults highlight the flow physics and shock reflections from thedownstream transition duct and low-pressure turbine first vanethat lead to the unsteady surface pressure on the high-pressureturbine blade. Finally, the computed time-average relative totalpressure loss for each blade-row is compared with that from asteady, multi-stage analysis to quantify the unsteady effects onaerodynamic performance.
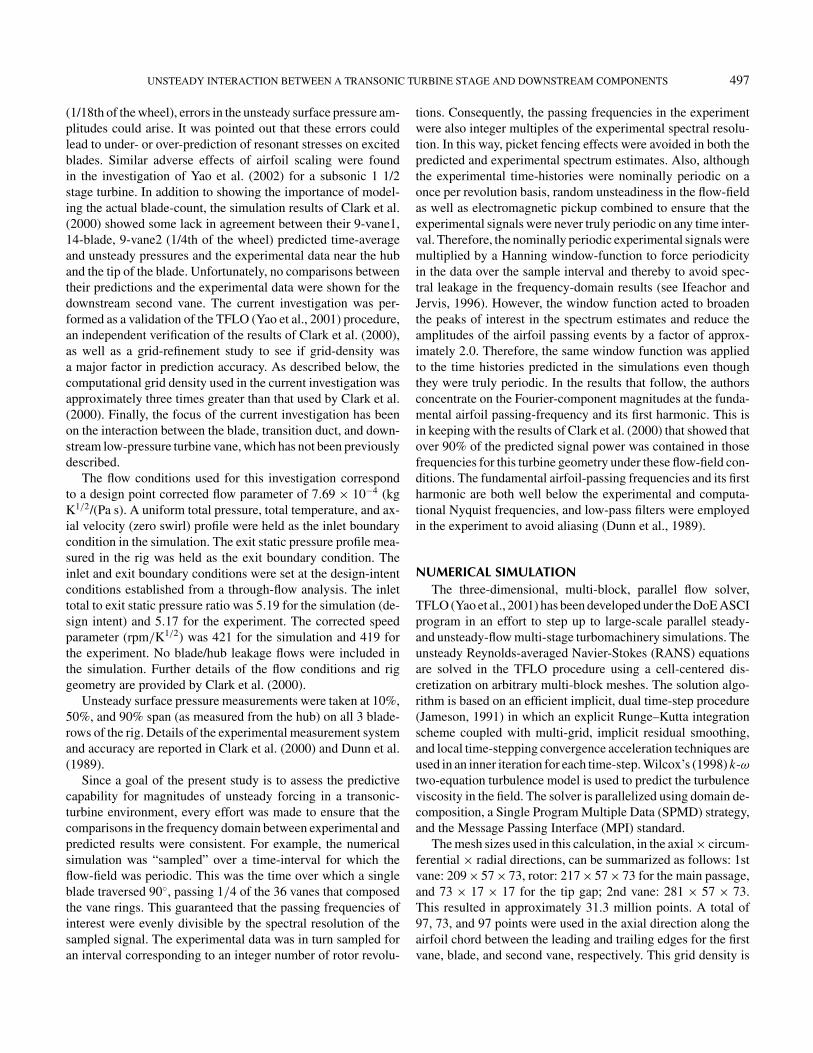
CONFIGURATIONFigure 1 shows the high-pressure turbine stage, transition
duct, and low-pressure turbine first vane that was tested exper-imentally at the Ohio State University Gas Turbine Laboratory(Dunn et al., 1989; Clark et al., 2000) and used in the presentnumerical investigation. This geometry is representative of amodern high-pressure turbine design consisting of 36 and 56high-pressure turbine vanes and blades, respectively, and 36 low-pressure turbine first vanes. The simulation used 1/4 of thesecounts in order to reduce the simulation size but yet maintainthe fundamental periodicity of the configuration. This led to a9-vane1, 14-blade, 9-vane2 model for the simulation. This modelnot only allowed for geometrical similitude between simulationand experiment but also allowed comparisons to be made be-tween the predictions performed here with those by Clark et al.(2000).
The initial investigation by Clark et al. (2000) showed theeffect of blade-count and airfoil scaling on the unsteady pres-sure field for this configuration. Their study showed that if air-foil scaling was used on the blade (holding midspan axial gap)to reduce the simulation to a 2-vane1, 3-blade, 2-vane2 model
FIGURE 1High-pressure turbine stage, transition duct, 1st vane
low-pressure turbine configuration.
UNSTEADY INTERACTION BETWEEN A TRANSONIC TURBINE STAGE AND DOWNSTREAM COMPONENTS 497
(1/18th of the wheel), errors in the unsteady surface pressure am-plitudes could arise. It was pointed out that these errors couldlead to under- or over-prediction of resonant stresses on excitedblades. Similar adverse effects of airfoil scaling were foundin the investigation of Yao et al. (2002) for a subsonic 1 1/2stage turbine. In addition to showing the importance of model-ing the actual blade-count, the simulation results of Clark et al.(2000) showed some lack in agreement between their 9-vane1,14-blade, 9-vane2 (1/4th of the wheel) predicted time-averageand unsteady pressures and the experimental data near the huband the tip of the blade. Unfortunately, no comparisons betweentheir predictions and the experimental data were shown for thedownstream second vane. The current investigation was per-formed as a validation of the TFLO (Yao et al., 2001) procedure,an independent verification of the results of Clark et al. (2000),as well as a grid-refinement study to see if grid-density wasa major factor in prediction accuracy. As described below, thecomputational grid density used in the current investigation wasapproximately three times greater than that used by Clark et al.(2000). Finally, the focus of the current investigation has beenon the interaction between the blade, transition duct, and down-stream low-pressure turbine vane, which has not been previouslydescribed.
The flow conditions used for this investigation correspondto a design point corrected flow parameter of 7.69 × 10⁻⁴ (kgK1/2/(Pa s). A uniform total pressure, total temperature, and ax-ial velocity (zero swirl) profile were held as the inlet boundarycondition in the simulation. The exit static pressure profile mea-sured in the rig was held as the exit boundary condition. Theinlet and exit boundary conditions were set at the design-intentconditions established from a through-flow analysis. The inlettotal to exit static pressure ratio was 5.19 for the simulation (de-sign intent) and 5.17 for the experiment. The corrected speedparameter (rpm/K1/2) was 421 for the simulation and 419 forthe experiment. No blade/hub leakage flows were included inthe simulation. Further details of the flow conditions and riggeometry are provided by Clark et al. (2000).
Unsteady surface pressure measurements were taken at 10%,50%, and 90% span (as measured from the hub) on all 3 blade-rows of the rig. Details of the experimental measurement systemand accuracy are reported in Clark et al. (2000) and Dunn et al.(1989).
Since a goal of the present study is to assess the predictivecapability for magnitudes of unsteady forcing in a transonic-turbine environment, every effort was made to ensure that thecomparisons in the frequency domain between experimental andpredicted results were consistent. For example, the numericalsimulation was “sampled” over a time-interval for which theflow-field was periodic. This was the time over which a singleblade traversed 90◦, passing 1/4 of the 36 vanes that composedthe vane rings. This guaranteed that the passing frequencies ofinterest were evenly divisible by the spectral resolution of thesampled signal. The experimental data was in turn sampled foran interval corresponding to an integer number of rotor revolu-
tions. Consequently, the passing frequencies in the experimentwere also integer multiples of the experimental spectral resolu-tion. In this way, picket fencing effects were avoided in both thepredicted and experimental spectrum estimates. Also, althoughthe experimental time-histories were nominally periodic on aonce per revolution basis, random unsteadiness in the flow-fieldas well as electromagnetic pickup combined to ensure that theexperimental signals were never truly periodic on any time inter-val. Therefore, the nominally periodic experimental signals weremultiplied by a Hanning window-function to force periodicityin the data over the sample interval and thereby to avoid spec-tral leakage in the frequency-domain results (see Ifeachor andJervis, 1996). However, the window function acted to broadenthe peaks of interest in the spectrum estimates and reduce theamplitudes of the airfoil passing events by a factor of approx-imately 2.0. Therefore, the same window function was appliedto the time histories predicted in the simulations even thoughthey were truly periodic. In the results that follow, the authorsconcentrate on the Fourier-component magnitudes at the funda-mental airfoil passing-frequency and its first harmonic. This isin keeping with the results of Clark et al. (2000) that showed thatover 90% of the predicted signal power was contained in thosefrequencies for this turbine geometry under these flow-field con-ditions. The fundamental airfoil-passing frequencies and its firstharmonic are both well below the experimental and computa-tional Nyquist frequencies, and low-pass filters were employedin the experiment to avoid aliasing (Dunn et al., 1989).
NUMERICAL SIMULATIONThe three-dimensional, multi-block, parallel flow solver,
TFLO (Yao et al., 2001) has been developed under the DoE ASCIprogram in an effort to step up to large-scale parallel steady-and unsteady-flow multi-stage turbomachinery simulations. Theunsteady Reynolds-averaged Navier-Stokes (RANS) equationsare solved in the TFLO procedure using a cell-centered dis-cretization on arbitrary multi-block meshes. The solution algo-rithm is based on an efficient implicit, dual time-step procedure(Jameson, 1991) in which an explicit Runge–Kutta integrationscheme coupled with multi-grid, implicit residual smoothing,and local time-stepping convergence acceleration techniques areused in an inner iteration for each time-step. Wilcox’s (1998) k-ωtwo-equation turbulence model is used to predict the turbulenceviscosity in the field. The solver is parallelized using domain de-composition, a Single Program Multiple Data (SPMD) strategy,and the Message Passing Interface (MPI) standard.
The mesh sizes used in this calculation, in the axial × circum-ferential × radial directions, can be summarized as follows: 1stvane: 209 × 57 × 73, rotor: 217 × 57 × 73 for the main passage,and 73 × 17 × 17 for the tip gap; 2nd vane: 281 × 57 × 73.This resulted in approximately 31.3 million points. A total of97, 73, and 97 points were used in the axial direction along theairfoil chord between the leading and trailing edges for the firstvane, blade, and second vane, respectively. This grid density is
498 R. L. DAVIS ET AL.
approximately 3 times (63% more streamwise, 16% more pitch-wise, and 28% more spanwise) that used by Clark et al. (2000)and was chosen to determine the effect of grid resolution on theagreement between the unsteady surface pressure and the ex-perimental data. Since a focus of the current investigation hasbeen on the interaction between the blade and the downstreamcomponents, most of the additional grid density has been addedin this region of the configuration.
The blade tip gap flow was solved as part of the overall simu-lation. The tip gap was uniform and equal to 1.15% of the bladespan. Based upon numerical experience, the grid resolution of73 × 17 × 17 points has been found to adequately resolve theflow in this region. The computational grid is clustered near theblade tip and near the casing to resolve the high flow gradientsand viscous flow in this region.
In order to accurately resolve the wave-forms correspondingto the stator-rotor-stator interaction, a total of 100 time stepswere used to rotate one blade past one first vane passage. Thisresulted in the use of 1400 time steps for one global period cor-responding to 1/4 of the turbomachine circumference. For eachtime step, 30 multi-grid cycles were performed to ensure theconvergence of the inner iteration. The use of 30 inner itera-tions for each time-step is not a general requirement but waschosen in the current investigation to ensure second-order tem-poral accuracy.
The 9–14–9 blade-count simulation was executed on 192 pro-cessors of the DoE Frost IBM SP3 at Lawrence Livermore Lab-oratory. The total memory required was approximately 16 giga-bytes distributed over the 192 processors. Each time step (with 30inner iterations) required approximately 16.5 minutes of clocktime including the computational and restart file input/outputtime. The parallel computational efficiency of the TFLO codefor up to 1024 processors is documented in Yao et al. (2001)demonstrating its linear scalibility. Two global cycles (or 18vane passings by the blade or 28 blade passings by a vane) wereexecuted to achieve a solution in which the airfoil unsteady sur-face pressures were time-periodic. Thus, the turn-around timefor this simulation with the 192 IBM SP3 processors would beapproximately one month.
TIME-AVERAGED PRESSURE AND PRESSUREENVELOPES
The computed time-averaged and minimum/maximum pres-sure envelopes for the blade have been compared with experi-mental data reported by Clark et al. (2000). In addition, similarnew comparisons are shown below for the downstream low-pressure turbine vane.
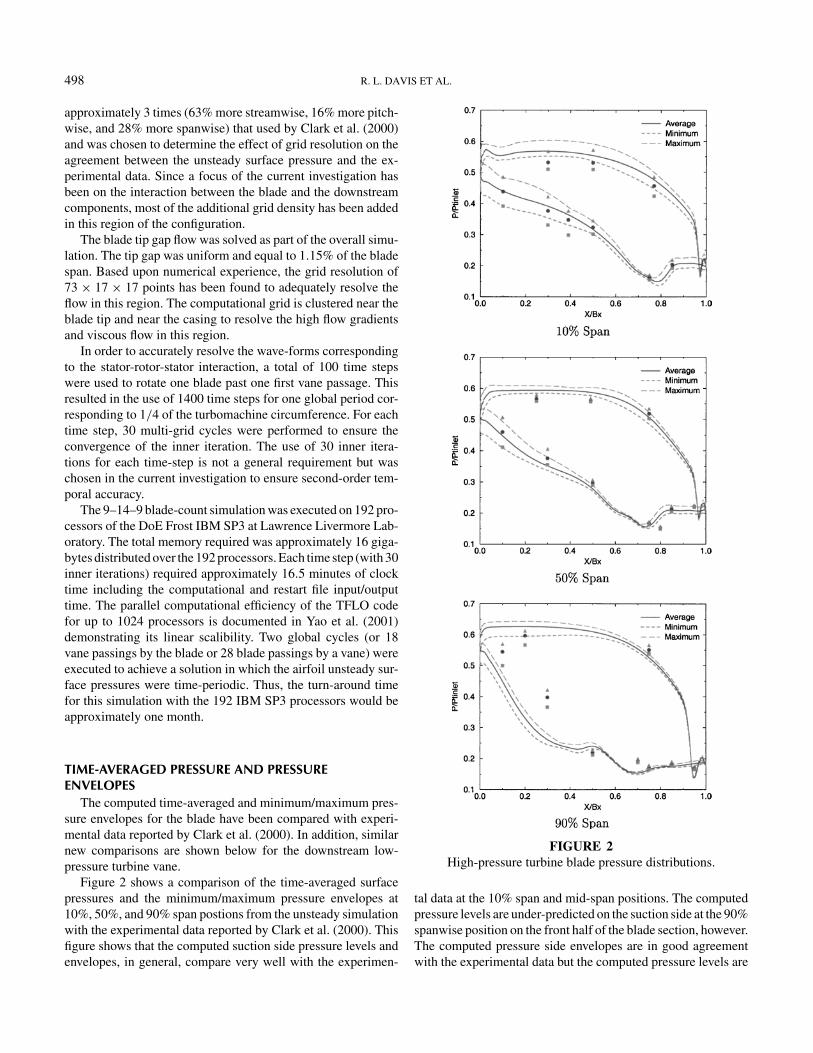
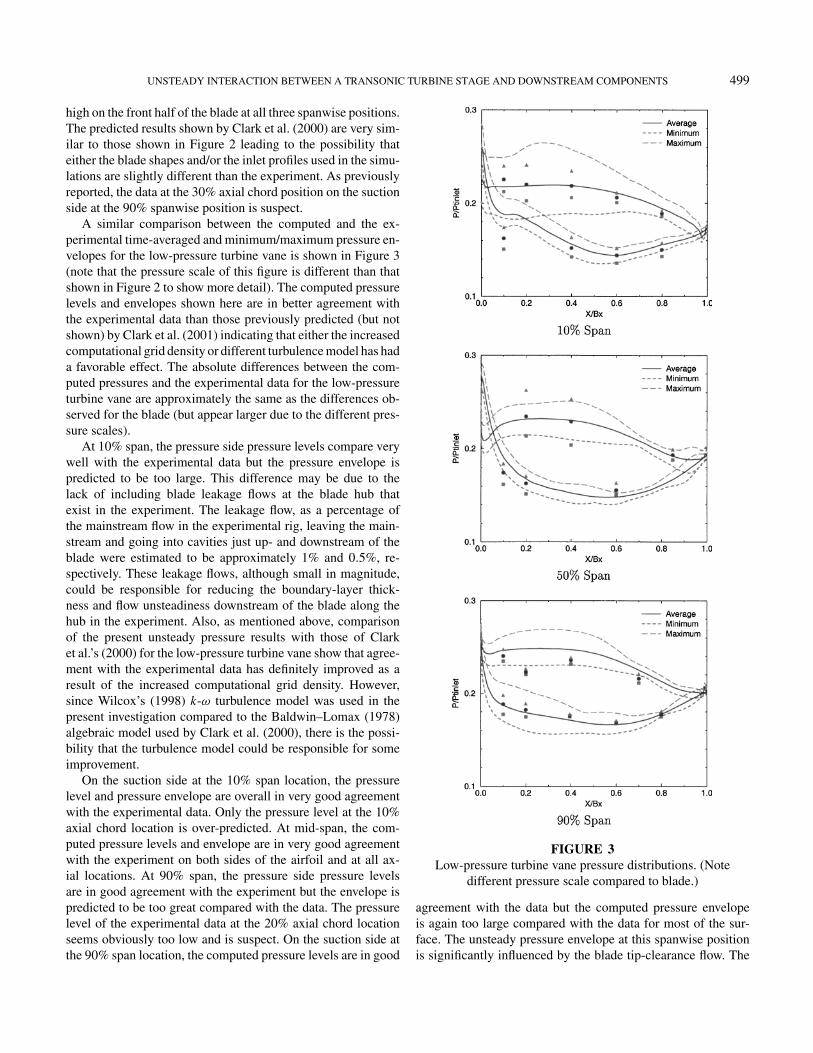
Figure 2 shows a comparison of the time-averaged surfacepressures and the minimum/maximum pressure envelopes at10%, 50%, and 90% span postions from the unsteady simulationwith the experimental data reported by Clark et al. (2000). Thisfigure shows that the computed suction side pressure levels andenvelopes, in general, compare very well with the experimen-
FIGURE 2High-pressure turbine blade pressure distributions.
tal data at the 10% span and mid-span positions. The computedpressure levels are under-predicted on the suction side at the 90%spanwise position on the front half of the blade section, however.The computed pressure side envelopes are in good agreementwith the experimental data but the computed pressure levels are
UNSTEADY INTERACTION BETWEEN A TRANSONIC TURBINE STAGE AND DOWNSTREAM COMPONENTS 499
high on the front half of the blade at all three spanwise positions.The predicted results shown by Clark et al. (2000) are very sim-ilar to those shown in Figure 2 leading to the possibility thateither the blade shapes and/or the inlet profiles used in the simu-lations are slightly different than the experiment. As previouslyreported, the data at the 30% axial chord position on the suctionside at the 90% spanwise position is suspect.
A similar comparison between the computed and the ex-perimental time-averaged and minimum/maximum pressure en-velopes for the low-pressure turbine vane is shown in Figure 3(note that the pressure scale of this figure is different than thatshown in Figure 2 to show more detail). The computed pressurelevels and envelopes shown here are in better agreement withthe experimental data than those previously predicted (but notshown) by Clark et al. (2001) indicating that either the increasedcomputational grid density or different turbulence model has hada favorable effect. The absolute differences between the com-puted pressures and the experimental data for the low-pressureturbine vane are approximately the same as the differences ob-served for the blade (but appear larger due to the different pres-sure scales).
At 10% span, the pressure side pressure levels compare verywell with the experimental data but the pressure envelope ispredicted to be too large. This difference may be due to thelack of including blade leakage flows at the blade hub thatexist in the experiment. The leakage flow, as a percentage ofthe mainstream flow in the experimental rig, leaving the main-stream and going into cavities just up- and downstream of theblade were estimated to be approximately 1% and 0.5%, re-spectively. These leakage flows, although small in magnitude,could be responsible for reducing the boundary-layer thick-ness and flow unsteadiness downstream of the blade along thehub in the experiment. Also, as mentioned above, comparisonof the present unsteady pressure results with those of Clarket al.’s (2000) for the low-pressure turbine vane show that agree-ment with the experimental data has definitely improved as aresult of the increased computational grid density. However,since Wilcox’s (1998) k-ω turbulence model was used in thepresent investigation compared to the Baldwin–Lomax (1978)algebraic model used by Clark et al. (2000), there is the possi-bility that the turbulence model could be responsible for someimprovement.
On the suction side at the 10% span location, the pressurelevel and pressure envelope are overall in very good agreementwith the experimental data. Only the pressure level at the 10%axial chord location is over-predicted. At mid-span, the com-puted pressure levels and envelope are in very good agreementwith the experiment on both sides of the airfoil and at all ax-ial locations. At 90% span, the pressure side pressure levelsare in good agreement with the experiment but the envelope ispredicted to be too great compared with the data. The pressurelevel of the experimental data at the 20% axial chord locationseems obviously too low and is suspect. On the suction side atthe 90% span location, the computed pressure levels are in good
FIGURE 3Low-pressure turbine vane pressure distributions. (Note
different pressure scale compared to blade.)
agreement with the data but the computed pressure envelopeis again too large compared with the data for most of the sur-face. The unsteady pressure envelope at this spanwise positionis significantly influenced by the blade tip-clearance flow. The
500 R. L. DAVIS ET AL.
over-prediction in the unsteady pressure levels at the 90% spanlocation indicates that the computed blade tip-vortex flow doesnot mix enough as it convects along the endwall through thetransition duct.
Comparison of Figures 2 and 3 shows that the largest un-steady pressure envelopes are on the blade suction surface nearthe leading edge due to the interaction with the first vane. Themagnitude of the unsteady pressure in this region of the blade isapproximately twice as large as that anywhere else on the bladeor on the downstream low-pressure turbine vane. The interactionbetween the blade and the downstream vane is weaker than thatbetween the first vane and the blade primarily due to the muchlarger axial spacing between the blade and downstream vane aswell as the radius change between the high- and low-pressureturbine.
Unsteady Flow CharacteristicsThe unsteady pressure signals on the blade surfaces are post-
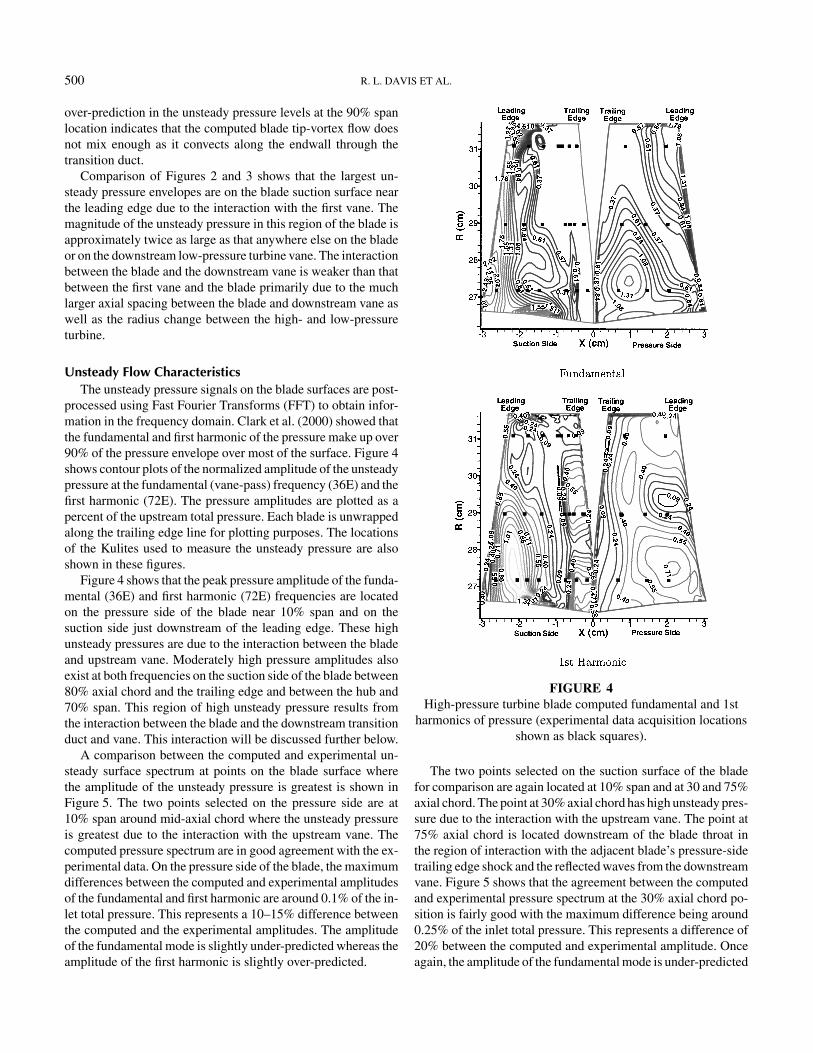
processed using Fast Fourier Transforms (FFT) to obtain infor-mation in the frequency domain. Clark et al. (2000) showed thatthe fundamental and first harmonic of the pressure make up over90% of the pressure envelope over most of the surface. Figure 4shows contour plots of the normalized amplitude of the unsteadypressure at the fundamental (vane-pass) frequency (36E) and thefirst harmonic (72E). The pressure amplitudes are plotted as apercent of the upstream total pressure. Each blade is unwrappedalong the trailing edge line for plotting purposes. The locationsof the Kulites used to measure the unsteady pressure are alsoshown in these figures.
Figure 4 shows that the peak pressure amplitude of the funda-mental (36E) and first harmonic (72E) frequencies are locatedon the pressure side of the blade near 10% span and on thesuction side just downstream of the leading edge. These highunsteady pressures are due to the interaction between the bladeand upstream vane. Moderately high pressure amplitudes alsoexist at both frequencies on the suction side of the blade between80% axial chord and the trailing edge and between the hub and70% span. This region of high unsteady pressure results fromthe interaction between the blade and the downstream transitionduct and vane. This interaction will be discussed further below.
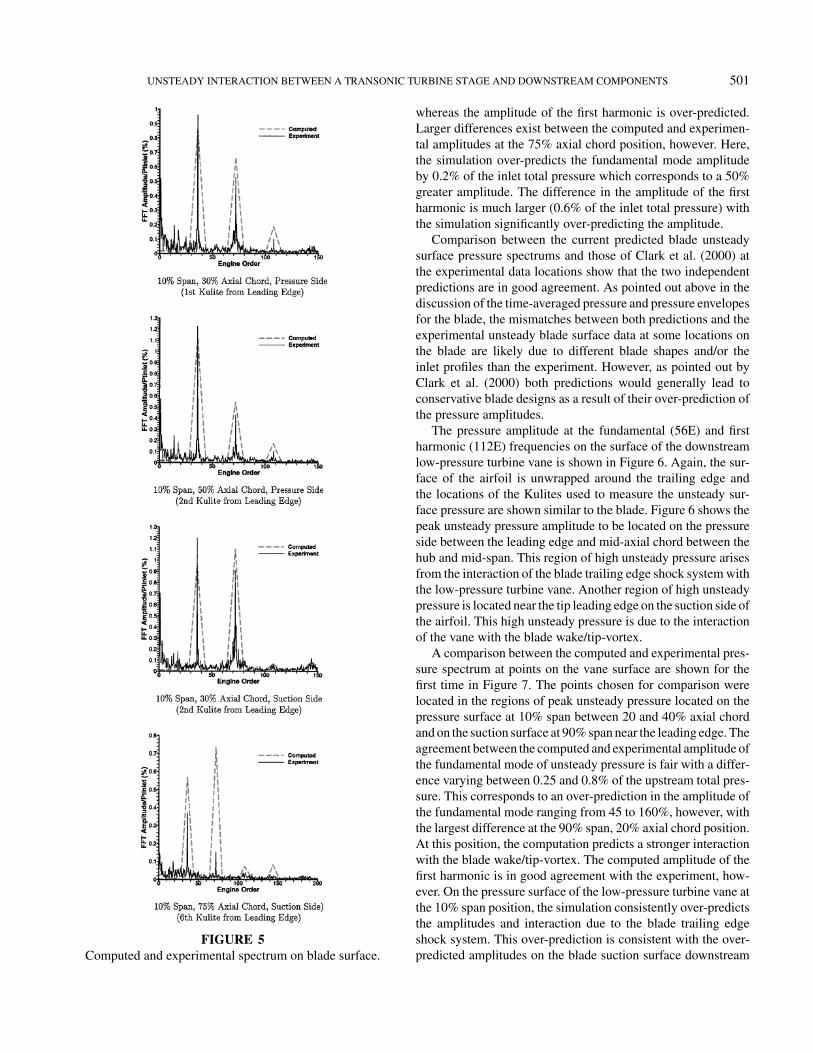
A comparison between the computed and experimental un-steady surface spectrum at points on the blade surface wherethe amplitude of the unsteady pressure is greatest is shown inFigure 5. The two points selected on the pressure side are at10% span around mid-axial chord where the unsteady pressureis greatest due to the interaction with the upstream vane. Thecomputed pressure spectrum are in good agreement with the ex-perimental data. On the pressure side of the blade, the maximumdifferences between the computed and experimental amplitudesof the fundamental and first harmonic are around 0.1% of the in-let total pressure. This represents a 10–15% difference betweenthe computed and the experimental amplitudes. The amplitudeof the fundamental mode is slightly under-predicted whereas theamplitude of the first harmonic is slightly over-predicted.
FIGURE 4High-pressure turbine blade computed fundamental and 1st
harmonics of pressure (experimental data acquisition locationsshown as black squares).
The two points selected on the suction surface of the bladefor comparison are again located at 10% span and at 30 and 75%axial chord. The point at 30% axial chord has high unsteady pres-sure due to the interaction with the upstream vane. The point at75% axial chord is located downstream of the blade throat inthe region of interaction with the adjacent blade’s pressure-sidetrailing edge shock and the reflected waves from the downstreamvane. Figure 5 shows that the agreement between the computedand experimental pressure spectrum at the 30% axial chord po-sition is fairly good with the maximum difference being around0.25% of the inlet total pressure. This represents a difference of20% between the computed and experimental amplitude. Onceagain, the amplitude of the fundamental mode is under-predicted
UNSTEADY INTERACTION BETWEEN A TRANSONIC TURBINE STAGE AND DOWNSTREAM COMPONENTS 501
FIGURE 5Computed and experimental spectrum on blade surface.
whereas the amplitude of the first harmonic is over-predicted.Larger differences exist between the computed and experimen-tal amplitudes at the 75% axial chord position, however. Here,the simulation over-predicts the fundamental mode amplitudeby 0.2% of the inlet total pressure which corresponds to a 50%greater amplitude. The difference in the amplitude of the firstharmonic is much larger (0.6% of the inlet total pressure) withthe simulation significantly over-predicting the amplitude.
Comparison between the current predicted blade unsteadysurface pressure spectrums and those of Clark et al. (2000) atthe experimental data locations show that the two independentpredictions are in good agreement. As pointed out above in thediscussion of the time-averaged pressure and pressure envelopesfor the blade, the mismatches between both predictions and theexperimental unsteady blade surface data at some locations onthe blade are likely due to different blade shapes and/or theinlet profiles than the experiment. However, as pointed out byClark et al. (2000) both predictions would generally lead toconservative blade designs as a result of their over-prediction ofthe pressure amplitudes.
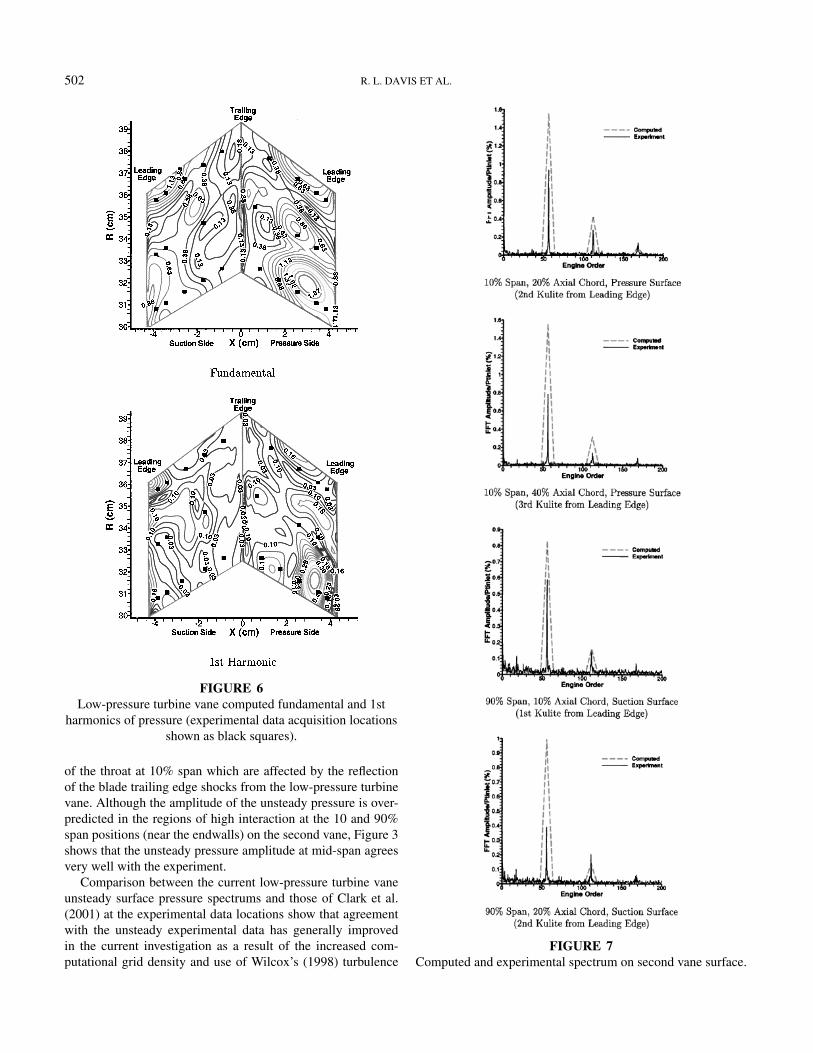
The pressure amplitude at the fundamental (56E) and firstharmonic (112E) frequencies on the surface of the downstreamlow-pressure turbine vane is shown in Figure 6. Again, the sur-face of the airfoil is unwrapped around the trailing edge andthe locations of the Kulites used to measure the unsteady sur-face pressure are shown similar to the blade. Figure 6 shows thepeak unsteady pressure amplitude to be located on the pressureside between the leading edge and mid-axial chord between thehub and mid-span. This region of high unsteady pressure arisesfrom the interaction of the blade trailing edge shock system withthe low-pressure turbine vane. Another region of high unsteadypressure is located near the tip leading edge on the suction side ofthe airfoil. This high unsteady pressure is due to the interactionof the vane with the blade wake/tip-vortex.
A comparison between the computed and experimental pres-sure spectrum at points on the vane surface are shown for thefirst time in Figure 7. The points chosen for comparison werelocated in the regions of peak unsteady pressure located on thepressure surface at 10% span between 20 and 40% axial chordand on the suction surface at 90% span near the leading edge. Theagreement between the computed and experimental amplitude ofthe fundamental mode of unsteady pressure is fair with a differ-ence varying between 0.25 and 0.8% of the upstream total pres-sure. This corresponds to an over-prediction in the amplitude ofthe fundamental mode ranging from 45 to 160%, however, withthe largest difference at the 90% span, 20% axial chord position.At this position, the computation predicts a stronger interactionwith the blade wake/tip-vortex. The computed amplitude of thefirst harmonic is in good agreement with the experiment, how-ever. On the pressure surface of the low-pressure turbine vane atthe 10% span position, the simulation consistently over-predictsthe amplitudes and interaction due to the blade trailing edgeshock system. This over-prediction is consistent with the over-predicted amplitudes on the blade suction surface downstream
502 R. L. DAVIS ET AL.
FIGURE 6Low-pressure turbine vane computed fundamental and 1st
harmonics of pressure (experimental data acquisition locationsshown as black squares).
of the throat at 10% span which are affected by the reflectionof the blade trailing edge shocks from the low-pressure turbinevane. Although the amplitude of the unsteady pressure is over-predicted in the regions of high interaction at the 10 and 90%span positions (near the endwalls) on the second vane, Figure 3shows that the unsteady pressure amplitude at mid-span agreesvery well with the experiment.
Comparison between the current low-pressure turbine vaneunsteady surface pressure spectrums and those of Clark et al.(2001) at the experimental data locations show that agreementwith the unsteady experimental data has generally improvedin the current investigation as a result of the increased com-putational grid density and use of Wilcox’s (1998) turbulence
FIGURE 7Computed and experimental spectrum on second vane surface.
UNSTEADY INTERACTION BETWEEN A TRANSONIC TURBINE STAGE AND DOWNSTREAM COMPONENTS 503
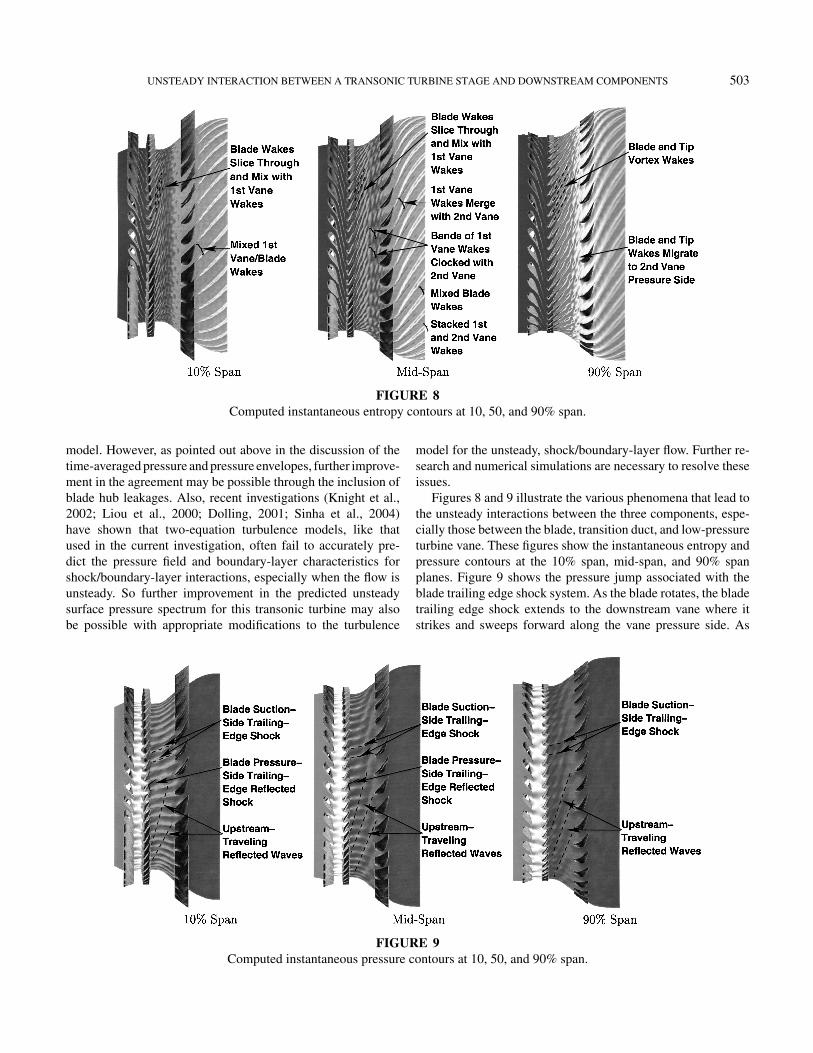
FIGURE 8Computed instantaneous entropy contours at 10, 50, and 90% span.
model. However, as pointed out above in the discussion of thetime-averaged pressure and pressure envelopes, further improve-ment in the agreement may be possible through the inclusion ofblade hub leakages. Also, recent investigations (Knight et al.,2002; Liou et al., 2000; Dolling, 2001; Sinha et al., 2004)have shown that two-equation turbulence models, like thatused in the current investigation, often fail to accurately pre-dict the pressure field and boundary-layer characteristics forshock/boundary-layer interactions, especially when the flow isunsteady. So further improvement in the predicted unsteadysurface pressure spectrum for this transonic turbine may alsobe possible with appropriate modifications to the turbulence
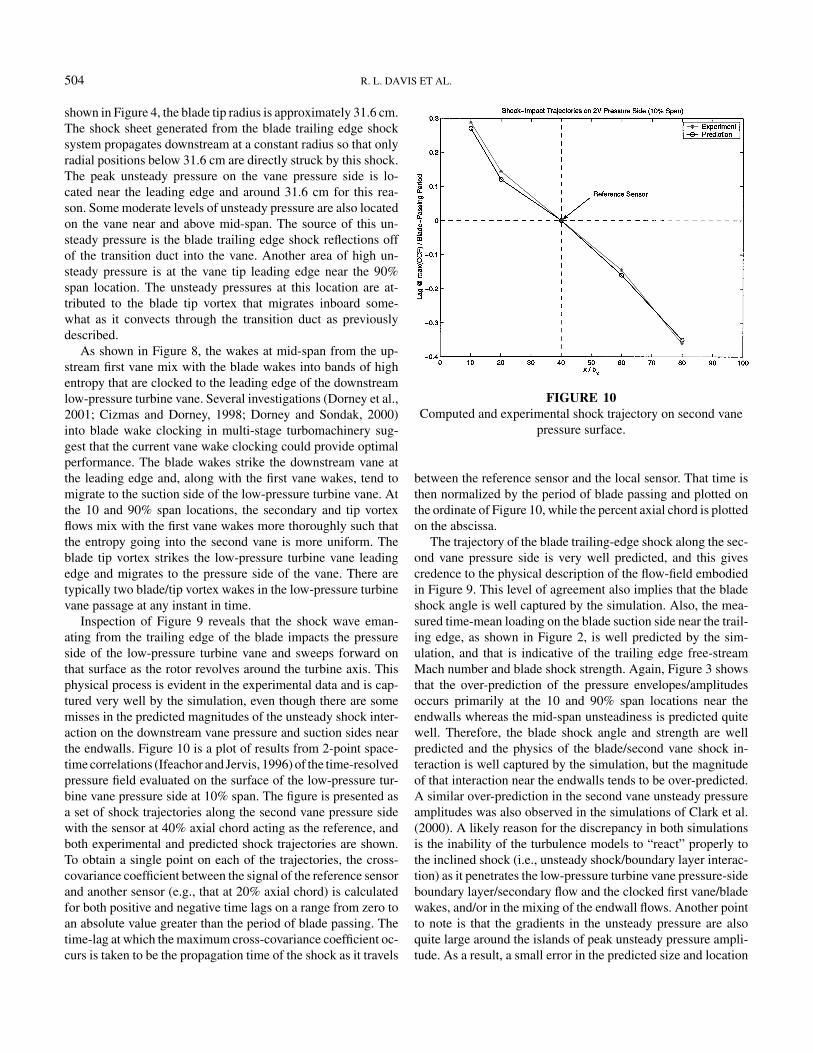
FIGURE 9Computed instantaneous pressure contours at 10, 50, and 90% span.
model for the unsteady, shock/boundary-layer flow. Further re-search and numerical simulations are necessary to resolve theseissues.
Figures 8 and 9 illustrate the various phenomena that lead tothe unsteady interactions between the three components, espe-cially those between the blade, transition duct, and low-pressureturbine vane. These figures show the instantaneous entropy andpressure contours at the 10% span, mid-span, and 90% spanplanes. Figure 9 shows the pressure jump associated with theblade trailing edge shock system. As the blade rotates, the bladetrailing edge shock extends to the downstream vane where itstrikes and sweeps forward along the vane pressure side. As
504 R. L. DAVIS ET AL.
shown in Figure 4, the blade tip radius is approximately 31.6 cm.The shock sheet generated from the blade trailing edge shocksystem propagates downstream at a constant radius so that onlyradial positions below 31.6 cm are directly struck by this shock.The peak unsteady pressure on the vane pressure side is lo-cated near the leading edge and around 31.6 cm for this rea-son. Some moderate levels of unsteady pressure are also locatedon the vane near and above mid-span. The source of this un-steady pressure is the blade trailing edge shock reflections offof the transition duct into the vane. Another area of high un-steady pressure is at the vane tip leading edge near the 90%span location. The unsteady pressures at this location are at-tributed to the blade tip vortex that migrates inboard some-what as it convects through the transition duct as previouslydescribed.
As shown in Figure 8, the wakes at mid-span from the up-stream first vane mix with the blade wakes into bands of highentropy that are clocked to the leading edge of the downstreamlow-pressure turbine vane. Several investigations (Dorney et al.,2001; Cizmas and Dorney, 1998; Dorney and Sondak, 2000)into blade wake clocking in multi-stage turbomachinery sug-gest that the current vane wake clocking could provide optimalperformance. The blade wakes strike the downstream vane atthe leading edge and, along with the first vane wakes, tend tomigrate to the suction side of the low-pressure turbine vane. Atthe 10 and 90% span locations, the secondary and tip vortexflows mix with the first vane wakes more thoroughly such thatthe entropy going into the second vane is more uniform. Theblade tip vortex strikes the low-pressure turbine vane leadingedge and migrates to the pressure side of the vane. There aretypically two blade/tip vortex wakes in the low-pressure turbinevane passage at any instant in time.
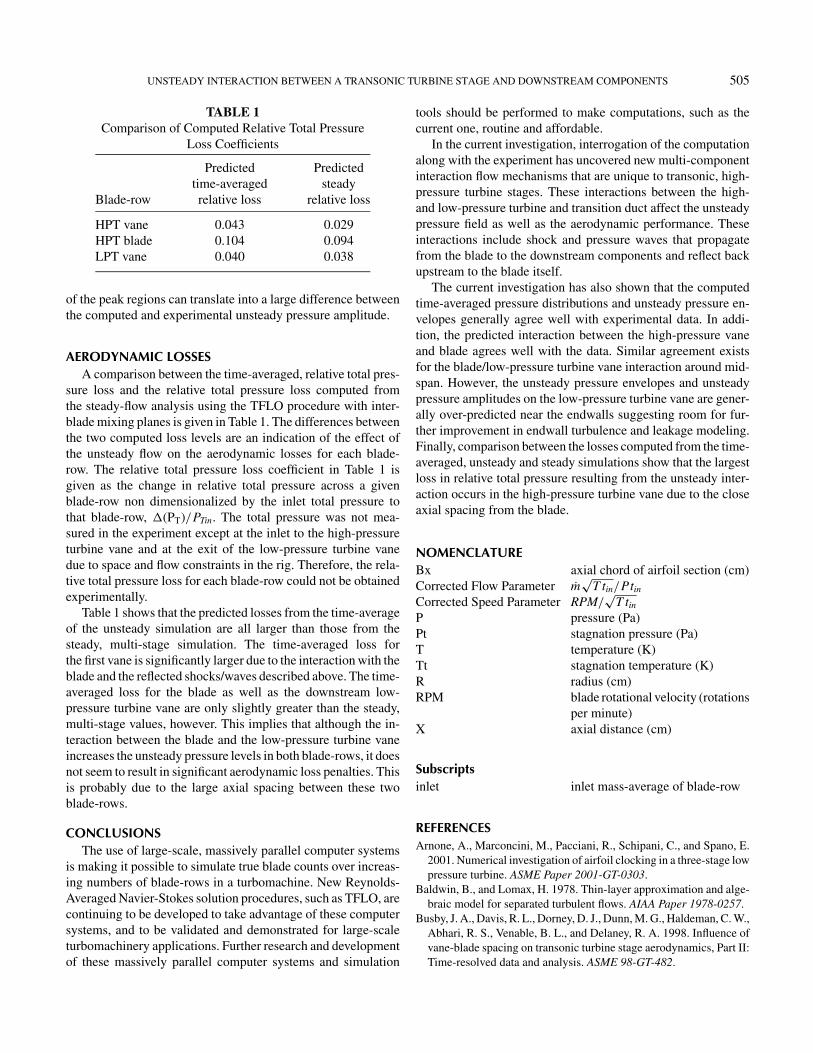
Inspection of Figure 9 reveals that the shock wave eman-ating from the trailing edge of the blade impacts the pressureside of the low-pressure turbine vane and sweeps forward onthat surface as the rotor revolves around the turbine axis. Thisphysical process is evident in the experimental data and is cap-tured very well by the simulation, even though there are somemisses in the predicted magnitudes of the unsteady shock inter-action on the downstream vane pressure and suction sides nearthe endwalls. Figure 10 is a plot of results from 2-point space-time correlations (Ifeachor and Jervis, 1996) of the time-resolvedpressure field evaluated on the surface of the low-pressure tur-bine vane pressure side at 10% span. The figure is presented asa set of shock trajectories along the second vane pressure sidewith the sensor at 40% axial chord acting as the reference, andboth experimental and predicted shock trajectories are shown.To obtain a single point on each of the trajectories, the cross-covariance coefficient between the signal of the reference sensorand another sensor (e.g., that at 20% axial chord) is calculatedfor both positive and negative time lags on a range from zero toan absolute value greater than the period of blade passing. Thetime-lag at which the maximum cross-covariance coefficient oc-curs is taken to be the propagation time of the shock as it travels
FIGURE 10Computed and experimental shock trajectory on second vane
pressure surface.
between the reference sensor and the local sensor. That time isthen normalized by the period of blade passing and plotted onthe ordinate of Figure 10, while the percent axial chord is plottedon the abscissa.
The trajectory of the blade trailing-edge shock along the sec-ond vane pressure side is very well predicted, and this givescredence to the physical description of the flow-field embodiedin Figure 9. This level of agreement also implies that the bladeshock angle is well captured by the simulation. Also, the mea-sured time-mean loading on the blade suction side near the trail-ing edge, as shown in Figure 2, is well predicted by the sim-ulation, and that is indicative of the trailing edge free-streamMach number and blade shock strength. Again, Figure 3 showsthat the over-prediction of the pressure envelopes/amplitudesoccurs primarily at the 10 and 90% span locations near theendwalls whereas the mid-span unsteadiness is predicted quitewell. Therefore, the blade shock angle and strength are wellpredicted and the physics of the blade/second vane shock in-teraction is well captured by the simulation, but the magnitudeof that interaction near the endwalls tends to be over-predicted.A similar over-prediction in the second vane unsteady pressureamplitudes was also observed in the simulations of Clark et al.(2000). A likely reason for the discrepancy in both simulationsis the inability of the turbulence models to “react” properly tothe inclined shock (i.e., unsteady shock/boundary layer interac-tion) as it penetrates the low-pressure turbine vane pressure-sideboundary layer/secondary flow and the clocked first vane/bladewakes, and/or in the mixing of the endwall flows. Another pointto note is that the gradients in the unsteady pressure are alsoquite large around the islands of peak unsteady pressure ampli-tude. As a result, a small error in the predicted size and location
UNSTEADY INTERACTION BETWEEN A TRANSONIC TURBINE STAGE AND DOWNSTREAM COMPONENTS 505
TABLE 1Comparison of Computed Relative Total Pressure
Loss Coefficients
Predicted Predictedtime-averaged steady
Blade-row relative loss relative loss
HPT vane 0.043 0.029HPT blade 0.104 0.094LPT vane 0.040 0.038
of the peak regions can translate into a large difference betweenthe computed and experimental unsteady pressure amplitude.
AERODYNAMIC LOSSESA comparison between the time-averaged, relative total pres-
sure loss and the relative total pressure loss computed fromthe steady-flow analysis using the TFLO procedure with inter-blade mixing planes is given in Table 1. The differences betweenthe two computed loss levels are an indication of the effect ofthe unsteady flow on the aerodynamic losses for each blade-row. The relative total pressure loss coefficient in Table 1 isgiven as the change in relative total pressure across a givenblade-row non dimensionalized by the inlet total pressure tothat blade-row, �(PT)/PTin. The total pressure was not mea-sured in the experiment except at the inlet to the high-pressureturbine vane and at the exit of the low-pressure turbine vanedue to space and flow constraints in the rig. Therefore, the rela-tive total pressure loss for each blade-row could not be obtainedexperimentally.
Table 1 shows that the predicted losses from the time-averageof the unsteady simulation are all larger than those from thesteady, multi-stage simulation. The time-averaged loss forthe first vane is significantly larger due to the interaction with theblade and the reflected shocks/waves described above. The time-averaged loss for the blade as well as the downstream low-pressure turbine vane are only slightly greater than the steady,multi-stage values, however. This implies that although the in-teraction between the blade and the low-pressure turbine vaneincreases the unsteady pressure levels in both blade-rows, it doesnot seem to result in significant aerodynamic loss penalties. Thisis probably due to the large axial spacing between these twoblade-rows.
CONCLUSIONSThe use of large-scale, massively parallel computer systems
is making it possible to simulate true blade counts over increas-ing numbers of blade-rows in a turbomachine. New Reynolds-Averaged Navier-Stokes solution procedures, such as TFLO, arecontinuing to be developed to take advantage of these computersystems, and to be validated and demonstrated for large-scaleturbomachinery applications. Further research and developmentof these massively parallel computer systems and simulation
tools should be performed to make computations, such as thecurrent one, routine and affordable.
In the current investigation, interrogation of the computationalong with the experiment has uncovered new multi-componentinteraction flow mechanisms that are unique to transonic, high-pressure turbine stages. These interactions between the high-and low-pressure turbine and transition duct affect the unsteadypressure field as well as the aerodynamic performance. Theseinteractions include shock and pressure waves that propagatefrom the blade to the downstream components and reflect backupstream to the blade itself.
The current investigation has also shown that the computedtime-averaged pressure distributions and unsteady pressure en-velopes generally agree well with experimental data. In addi-tion, the predicted interaction between the high-pressure vaneand blade agrees well with the data. Similar agreement existsfor the blade/low-pressure turbine vane interaction around mid-span. However, the unsteady pressure envelopes and unsteadypressure amplitudes on the low-pressure turbine vane are gener-ally over-predicted near the endwalls suggesting room for fur-ther improvement in endwall turbulence and leakage modeling.Finally, comparison between the losses computed from the time-averaged, unsteady and steady simulations show that the largestloss in relative total pressure resulting from the unsteady inter-action occurs in the high-pressure turbine vane due to the closeaxial spacing from the blade.
NOMENCLATUREBx axial chord of airfoil section (cm)Corrected Flow Parameter m
√T tin/Ptin
Corrected Speed Parameter RPM/√
T tinP pressure (Pa)Pt stagnation pressure (Pa)T temperature (K)Tt stagnation temperature (K)R radius (cm)RPM blade rotational velocity (rotations
per minute)X axial distance (cm)
Subscriptsinlet inlet mass-average of blade-row
REFERENCESArnone, A., Marconcini, M., Pacciani, R., Schipani, C., and Spano, E.
2001. Numerical investigation of airfoil clocking in a three-stage lowpressure turbine. ASME Paper 2001-GT-0303.
Baldwin, B., and Lomax, H. 1978. Thin-layer approximation and alge-braic model for separated turbulent flows. AIAA Paper 1978-0257.
Busby, J. A., Davis, R. L., Dorney, D. J., Dunn, M. G., Haldeman, C. W.,Abhari, R. S., Venable, B. L., and Delaney, R. A. 1998. Influence ofvane-blade spacing on transonic turbine stage aerodynamics, Part II:Time-resolved data and analysis. ASME 98-GT-482.
506 R. L. DAVIS ET AL.
Chen, J. P., Celestina, M. L., and Adamczyk, J. J. 1994. A new procedurefor simulating unsteady flows through turbomachinery blade rows.,ASME Paper 94-GT-151.
Cizmas, P., and Dorney, D. J. 1998. Parallel computation of turbineblade clocking. AIAA Paper 98-3598.
Clark, J. P. 2001. Private communication.Clark, J. P., Stetson, G. M., Magge, S. S., Ni, R. H., Haldeman, C. W.,
and Dunn, M. G. 2000. The effect of airfoil scaling on the predictedunsteady loading on the blade of a 1 and 1/2 stage transonic turbineand a comparison with experimental results. ASME Paper 2000-GT-0446.
Dolling, D. S. 2001. Unsteadiness of shock-induced turbulent separatedflows—Some key questions. AIAA Paper 2001-2708.
Dorney, D. J., Croft, R. R., Sondak, D. L., Stang, U. E., andTwardochleb, C. Z. 2001. Computational study of clocking an em-bedded stage in a 4-stage industrial turbine. ASME Paper 2001-GT-0509.
Dorney, D. J., and Sondak, D. L. 2000. Three-dimensional simula-tions of airfoil clocking in a 1-1/2 stage turbine. AIAA Paper 2000–3359.
Dring, R. P., Joslyn, H. D., Hardin, L. W., and Wagner, J. H. 1982.Turbine rotor-stator interaction. ASME Journal of Engineering forPower 104:729–742.
Dunn, M. G., Moller, J. C., and Steele, R. C. 1989. Operatingpoint verification for a large shock tunnel test facility. WRDC-TR-2027.
Giles, M. B. 1990. Stator/rotor interaction in a transonic turbine. AIAAJournal of Propulsion and Power 6:621–627.
Gombert, R., and Hohn, W. 2001. Unsteady aerodynamical blade rowinteraction in a new multistage research turbine—Part 1: Experimen-tal investigation. ASME Paper 2001-GT-0306.
Hohn, W., Gombert, R., and Kraus, A. 2001. Unsteady aerodynamicalblade row interaction in a new multistage research turbine—Part 2:Numerical investigation. ASME Paper 2001-GT-0307.
Ifeachor, E. C., and Jervis, B. W. 1996. Digital Signal Processing,New York: Addison-Wesley.
Jameson, A. 1991. Time dependent calculations using multigrid, withapplications to unsteady flows past airfoils and wings. AIAA Paper
91-1596, AIAA 10th Computational Fluid Dynamics Conference,Honolulu, HI.
Jorgenson, P. C. E., and Chima, R. 1990. An Explicit Runge-Kuttamethod for unsteady rotor/stator interaction. AIAA Paper 90–2408.
Knight, D., Yan, H., Panaras, A., and Zheltovodov, A. 2002. RTO WG10: CFD validation for shock wave turbulent boundary layer inter-actions. AIAA Paper 2002-0437.
Liou, W. W., Huang, G., and Shih, T-H. 2000. Turbulence mocel as-sessment for shock wave/turbulent boundary layer interaction in tran-sonic and supersonic flows. Computers and Fluids 29:275–299.
Rai, M. M. 1987. Navier-Stokes simulations of rotor-stator interactionusing patched and overlaid grids. AIAA Journal of Propulsion andPower 3:387–396.
Rao, K. V., Delaney, R. A., and Dunn, M. G. 1994. Vane-blade inter-action in a transonic turbine, Part 1: Aerodynamics. ASME Journalof Propulsion and Power 10(3):305–311.
Reinmoller, U., Stephan, B., Schmidt, S., and Niehuis, R. 2001. Clock-ing effects in a 1.5 stage axial turbine—steady and unsteady exper-imental investigations supported by numerical simulations. ASMEPaper 2001-GT-0304.
Reynolds, W. C., Fatica, M., and Alonso, J. J., Eds. 2001. 2001 an-nual technical report—Department of energy accelerated strategiccomputing initiative, Stanford University Report.
Sharma, O. P., Pickett, G. F., and Ni, R. H. 1992. Assessment of unsteadyflows in turbines. ASME Journal of Turbomachinery 114:79–90.
Sinha, K., Mahesh, K., and Candler, G. V. 2004. Modeling the effect ofshock unsteadiness in shock-wave/turbulent boundary layer interac-tions. AIAA Paper 2004-1129.
Takahashi, R., and Ni, R. H. 1991. Unsteady hot streak simulationthrough 1-1/2 stage turbine. AIAA Paper 91-3382.
Wilcox, D. C. 1998. Turbulence Modeling for CFD, La Canada, CA:DCW Industries, Inc.
Yao, J., Davis, R. L., Alonso, J. J., and Jameson, A. 2002. Massivelyparallel simulation of the unsteady flow in an axial turbine stage.AIAA Journal of Propulsion and Power 18(2):465–471.
Yao, J., Jameson, A., Alonso, J. J., and Liu, F. 2001. Development andvalidation of a massively parallel flow solver for turbomachineryflows. AIAA Journal of Propulsion and Power 17(3):659–668.

International Journal of
AerospaceEngineeringHindawi Publishing Corporationhttp://www.hindawi.com Volume 2010
RoboticsJournal of
Hindawi Publishing Corporationhttp://www.hindawi.com Volume 2014
Hindawi Publishing Corporationhttp://www.hindawi.com Volume 2014
Active and Passive Electronic Components
Control Scienceand Engineering
Journal of
Hindawi Publishing Corporationhttp://www.hindawi.com Volume 2014
International Journal of
RotatingMachinery
Hindawi Publishing Corporationhttp://www.hindawi.com Volume 2014
Hindawi Publishing Corporation http://www.hindawi.com
Journal ofEngineeringVolume 2014
Submit your manuscripts athttp://www.hindawi.com
VLSI Design
Hindawi Publishing Corporationhttp://www.hindawi.com Volume 2014
Hindawi Publishing Corporationhttp://www.hindawi.com Volume 2014
Shock and Vibration
Hindawi Publishing Corporationhttp://www.hindawi.com Volume 2014
Civil EngineeringAdvances in
Acoustics and VibrationAdvances in
Hindawi Publishing Corporationhttp://www.hindawi.com Volume 2014
Hindawi Publishing Corporationhttp://www.hindawi.com Volume 2014
Electrical and Computer Engineering
Journal of
Advances inOptoElectronics
Hindawi Publishing Corporation http://www.hindawi.com
Volume 2014
The Scientific World JournalHindawi Publishing Corporation http://www.hindawi.com Volume 2014
SensorsJournal of
Hindawi Publishing Corporationhttp://www.hindawi.com Volume 2014
Modelling & Simulation in EngineeringHindawi Publishing Corporation http://www.hindawi.com Volume 2014
Hindawi Publishing Corporationhttp://www.hindawi.com Volume 2014
Chemical EngineeringInternational Journal of Antennas and
Propagation
International Journal of
Hindawi Publishing Corporationhttp://www.hindawi.com Volume 2014
Hindawi Publishing Corporationhttp://www.hindawi.com Volume 2014
Navigation and Observation
International Journal of
Hindawi Publishing Corporationhttp://www.hindawi.com Volume 2014
DistributedSensor Networks
International Journal of