Embed Size (px)
Citation preview

Rep
rodu
ced
from
Vad
ose
Zon
e Jo
urna
l. P
ublis
hed
by S
oil S
cien
ce S
ocie
ty o
f Am
eric
a. A
ll co
pyrig
hts
rese
rved
.
Unstable Flow during Redistribution: Controlling Factors and Practical Implications
Zhi Wang,* William A. Jury, Atac Tuli, and Dong-Ju Kim
ABSTRACT 1989a, 1989b; Baker and Hillel, 1990; Nieber, 1996), in-filtration into a hydrophobic medium (van Ommen et al.,Unstable flow causes major uncertainties in the characterization1988; Hendrickx et al., 1993; Ritsema et al., 1993; Ngu-of drainage in the vadose zone by inducing finger-like flow paths in
soils with or without macropores. Recent studies have identified the yen et al., 1999; Carrillo et al., 2000; Wang et al., 2000b),major factors governing fingered flow to be the combined effects of soil air compression during infiltration (White et al.,capillary hysteresis, the existence of a threshold water-entry value in 1976, 1977; Wang et al., 1997, 1998a, 1998c), and unsatu-a porous medium, and a positive matric potential gradient behind the rated infiltration under low application rates (Selkerwetting front. This situation typically occurs during redistribution et al., 1992; Yao and Hendrickx, 1996; Wang et al.,following high-rate infiltration, a common occurrence in hydrology. 1998b; Geiger and Durnford, 2000). In addition to theseThe conditions favoring instability can also develop during infiltration
recognized situations, another condition predicted tointo a fine-over-coarse layered soil, into hydrophobic or air-entrappedcause unstable flow in uniform porous media is redistri-soils, or even in a homogeneous coarse-textured soil if the infiltrationbution following the cessation of infiltration (Raats,rate is low. An analysis of the conditions necessary for the onset of
unstable flow in a uniform soil is provided in this paper. We demon- 1973; Philip, 1975). Diment and Watson (1985) and Ta-strate that if the matric potential gradient (dh/dz ) becomes positive mai et al. (1987) demonstrated that redistribution causesduring redistribution, a perturbation at the wetting front will cause unstable flow in coarse-textured, oven-dry, uniform ma-finger flow. However, if dh/dz remains negative, the perturbation will terials. However, Diment and Watson’s (1985) experi-be dissipated. The analysis is used to predict a critical depth of irriga- ments in a small slab box showed that redistributiontion (Ic) beyond which the flow should become unstable. A series of “stabilized” when the initial water content was increasedpoint-source and line-source infiltration experiments were conducted
to only a few percent of saturation. In contrast, recentusing a slab-box filled with uniform sands. The results confirmed thatexperiments of Wang et al. (2003a, 2003b) in the fieldas soon as Ic is exceeded, a finger was formed at the bottom of theand with a large slab box showed that redistribution iswetting front, channeling the flow and stopping water movement in
the surrounding areas. We discuss this phenomenon’s implications unstable even in a very wet uniform sand. Nicholl et al.for practical irrigation and leaching designs. (1994) observed fingering during redistribution in ini-
tially dry fractures. Analyzing these results, Jury et al.(2003) made the conjecture that water flow is unstableto different degrees in every soil because of redistribu-Unstable flow was originally discovered in petro-
leum engineering as viscous-driven fingering dur- tion, an almost unavoidable scenario in hydrology.ing horizontal and upward water–oil displacement, and The common mechanism driving unstable flow in soilits characteristics were described by linear stability the- under all of these conditions seems to be the combinedory (Saffman and Taylor, 1958; Chuoke et al., 1959). effects of capillary hysteresis, the existence of a thresh-When the theory was applied to downward flow in the old water-entry value of the porous medium and a posi-vadose zone, Hill and Parlange (1972) found that the tive matric potential gradient (dryer toward the surface)gravity-driven fingering occurs when the infiltration flux behind the wetting front (Jury et al., 2003). It is welli falls below the saturated hydraulic conductivity Ks. known that the matric potential becomes more negativeBased on the derivation of Chuoke et al. (1959) and toward the surface as infiltration shifts to redistributionaccounting for the stabilizing effects of soil capillarity, (Youngs, 1958a, 1958b). Thus, the transition from infil-Wang et al. (1998a) predicted that fingering should oc- tration to redistribution creates the very condition nec-cur over a narrower range of flux ratio (i/Ks) and primar- essary for unstable flow.ily in coarse-textured soils. In the past three decades, Many previous field experiments that involved re-numerous experimental studies have confirmed that un- peated infiltration or drainage cycles have observed astable flow occurs under a number of soil and hydraulic breakup of the wetting front into narrow fingers (Juryconditions. The most widely recognized conditions for et al., 1986; Glass et al., 1988; Kung, 1990; Ghodrati andunstable flow are vertical flow from a fine-textured layer Jury, 1992; Flury et al., 1994). These results may haveinto a coarse one (Hill and Parlange, 1972; Parlange been influenced by redistribution, since some period ofand Hill, 1976; Starr et al., 1978, 1986; Glass et al., 1988, time elapsed before excavation and exposure of the
wetting front. It becomes clear that flow uncertaintiesin the subsurface are sometimes dominated by the oc-Z. Wang, Dep. of Earth and Environmental Sciences, California State
University, Fresno, CA 93740; W.A. Jury and A. Tuli, Dep. of Environ- currence of unstable flow in both heterogeneous andmental Sciences, University of California, Riverside, CA 92521; D.-J. homogeneous porous media.Kim, Dep. of Earth & Environmental Science, Korea University,
Unstable channeling of water into fingers in the sur-Seoul, Republic of Korea. Special Section: Uncertainty in Vadoseface zone potentially creates many problems for waterZone Flow and Transport Properties. *Corresponding email address
([email protected]). and chemical management. Management of water forcrop production becomes more wasteful. Fertilizers andPublished in Vadose Zone Journal 3:549–559 (2004).pesticides can move quickly below the depth where they Soil Science Society of America
677 S. Segoe Rd., Madison, WI 53711 USA are needed. Chemical waste can migrate much deeper
549
Rep
rodu
ced
from
Vad
ose
Zon
e Jo
urna
l. P
ublis
hed
by S
oil S
cien
ce S
ocie
ty o
f Am
eric
a. A
ll co
pyrig
hts
rese
rved
.
550 VADOSE ZONE J., VOL. 3, MAY 2004
than predicted on the basis of uniform movement. Inaddition, management strategies devised on the basisof stable flow to optimize water and chemical use mightnot be optimum in the presence of unstable flow.
The objectives of this study were (i) to identify andquantify the critical factors triggering unstable flow dur-ing redistribution after a certain amount of infiltration,(ii) to determine whether an optimum amount of irriga-tion or rainfall will minimize or eliminate unstable flow,and (iii) to conduct experiments to validate the predic-tions made by our analysis.
Fig. 1. Types of possible redistribution profiles after ponded infil-tration.
THEORYEarly investigations of redistribution dealt primarily at the wetting front (Fig. 1a). In the second, the transi-
with the determination of field capacity (Alway and tion plane occurs at an intermediate depth between theMcDole, 1917; Veihmeyer and Hendrickson, 1931; Col- surface and the wetting front, at a location correspond-man, 1944), which has long been accepted as an opera- ing to the depth reached at the end of infiltration (Fig. 1b).tional physical property of soil (Jury et al., 1991). Field Youngs and Poulovassilis explained that these two typescapacity is by definition the amount of water remaining of profile had different rates of redistribution.in surface storage after redistribution has become insig- However, apart from the two forms of redistributionnificant. However, the possibility of fingered flow during discussed by Youngs and Poulovassilis (1976), there wasredistribution obscures this definition and raises ques- clearly a third profile shape shown in Fig. 2 of Youngstions about its utility. (1958b), and redrawn in Fig. 1c here, in which the mois-
ture content is highest at the moving wetting front anddecreases monotonically to the soil surface. This thirdOne-Dimensional Redistributionform of redistribution profile has not been explained
Infiltration and redistribution are generally regarded previously in the literature. It can be inferred from re-as one-dimensional unless the water supply is not spa- cent studies that the third form of redistribution illus-tially uniform. Once capillary hysteresis was detected and trates that a threshold water-entry pressure at the wet-reported by Haines (1930), it became clear that infiltra- ting front is required for water to enter the unwetted zonetion and redistribution required different methods of (see Hillel and Baker, 1988; Baker and Hillel, 1990; Selkeranalysis. In the years following, many studies were con- et al., 1992; Liu et al., 1993, 1994; Geiger and Durn-ducted to conceptually separate redistribution from in- ford, 2000). In this case water content is at its highestfiltration (Childs and Collis-George, 1950; Youngs, 1958a, value at the front.1958b; Nielsen et al., 1962; Biswas et al., 1966; Gardneret al., 1970; Poulovassilis, 1970; Talsma, 1974). However, Relative Dominance of Capillary vs. Gravity Forcesmost experimental and theoretical investigations of re-
If water infiltrates relatively uniformly during infiltra-distribution assumed one-dimensional flow in a uniformtion of an amount of water I, the front will extend to aporous medium (Gardner, 1959; Staple, 1966; Rubin, 1967)depth (L) in the soil given approximately bywith continued advance of the wetting front during both
infiltration and redistribution. However, as a result ofL �
I�a � �i
[1]difficulties in defining the initial conditions and repre-senting the physics of hysteresis at the Darcy scale, theredistribution process remains less well understood than where �a is the average moisture content in the wettedinfiltration, despite considerable effort (Philip, 1991). zone (0 � z � L) and �i is the initial moisture content.
In an important but largely overlooked study, Youngs Figure 2a shows typical wetting and drying matric poten-(1958a, 1958b) showed that the shape of the soil mois- tial–water content curves for a coarse-textured soil withture profile during redistribution was not necessarily a narrow range of pore sizes during the transition fromthe same as that of infiltration. To explain the differing infiltration to redistribution. As shown by Peck (1971),moisture profiles during redistribution, Peck (1971) con- the soil below the transition plane z � z* initially takesceptualized that at each depth during redistribution, up moisture following a wetting curve OA until thethe moisture content increases to a maximum and then moisture content reaches a maximum value (�*) at z �decreases. Thus, when the maximum water content z*, as shown in Fig. 2a. When the water potential reachesvalue is at z � z* (the transition plane), the soil is drying the water-entry value hwe at the wetting front, the waterin the upper zone 0 � z � z* and is wetting in the lower content increases abruptly to �we (Point A). Above theregion z � z*. In a subsequent analysis, Youngs and transition plane, water drains from the soil followingPoulovassilis (1976) identified two forms of redistribu- the drainage curve BO (Fig. 2a). When the potentialtion profile. In the first, the moisture profile shape re- falls to the air-entry value hae (Point C), the major poresmains similar to that of infiltration, maintaining the will begin to empty. Hence, the difference between the
water- and air-entry values indicates the ability of a po-highest water content at the soil surface and the lowest

Rep
rodu
ced
from
Vad
ose
Zon
e Jo
urna
l. P
ublis
hed
by S
oil S
cien
ce S
ocie
ty o
f Am
eric
a. A
ll co
pyrig
hts
rese
rved
.
www.vadosezonejournal.org 551
Fig. 2. Schematics of moisture and pressure redistribution with re-spect to the amount of initial application: (a) hysteresis effects, (b)L � S, (c) L � S, and (d) water blob at the front. The asteriskedvariable indicates the maximum water content of the profile duringredistribution (Peck, 1971).
Fig. 3. Schematic matric potential profiles, h � h(z, t), at the end ofinfiltration (t � 0) and at different times t during redistribution:(a) L � S and (b) L � S. The asterisked variables indicate therous medium to hold a suspended vertical water columnpositions of the maximum water content at the time (Peck, 1971).against gravity (Fig. 2b) or entrap a zone of higher water
content behind the wetting front (Fig. 2d). This special L � hwe � hae. Hence, drainage can start from the sur-moisture retention ability of a porous medium can be face. Once air enters the soil near the surface, the mois-defined as the capillary suspension length (S): ture profile will trap a wetted zone of water from PointC in the profile where h � hae to Point A where h �
S �hwe � hae
cos�[2] hwe at the wetting front (Fig. 2d). To maintain continued
downward flow through this region, the elevation differ-where � is the direction (or slope) of flow with respect ence between A and C should be greater than S (i.e.,to gravity. This equation was first conceived by Glass Gm � 1). This should produce a series of matric poten-et al. (1989a) to describe the length of the “saturated” tial profiles, h � h(z,t), as shown in Fig. 3b. The corre-finger tip in vertical flow (� � 0); it was later used by sponding moisture profiles, � � �(z,t), will display theNicholl et al. (1994) to describe the mechanisms gov- third form of redistribution (Fig. 1c).erning redistribution in a single fracture. It will be shown Thus, the shape of the redistribution profile is a directin the following that the relative magnitudes of L and consequence of hysteresis and the interplay of gravita-S determine whether finger flow will occur. tional (downward) and capillary (upward) forces at the
When L � S � hwe � hae, as shown in Fig. 2b (for end of infiltration. When capillary forces dominate (i.e.,� � 0), downward flux, i � �KG, is not possible unless L � S) at the end of infiltration, then by Eq. [1] and [2]the total pressure gradient G � (hA � L � hB)/L is �0or hB � hA � L. Here, K is the hydraulic conductivity I �
(hwe � hae)(�a � �i)cos�
[3]of the porous medium, hB is the matric potential at thesoil surface (Point B) and hA � hwe is the matric potential In this case there is insufficient suction produced by theat the wetting front (Point A). Thus, for L � S � hwe � downward flow to induce drainage of the large poreshae, hB must be greater than the air-entry value of the near the surface. In contrast, when the gravitationalsoil. For L � S, hB must be even greater to maintain a force dominates the flow (i.e., L � S), thendownward flow. In the early stages following the cessa-tion of water application, hB � hae, the flow of water is I �
(hwe � hae)(�a � �i)cos�
[4]downward and L increases. However, hB will eventuallyfall to a value hae (S � L) before L exceeds S and
In this case, sufficient suction will be generated by theflow will stop, leaving the profile suspended in space.downward flow to induce drainage at the soil surfaceThis situation will produce a sequence of matric poten-first, so that an intermediate zone of high water contenttial profiles as shown in Fig. 3a. The correspondingwill be formed behind the moving wetting front duringmoisture profile will be the first form of redistributionredistribution. The length of this zone is equal to the capil-as shown in Fig. 1a.lary suspension length (S). Since the water-entry valueWhen a larger amount of infiltration occurs such that(hwe) decreases as initial water content �i increasesL � S (Fig. 2c), downward flow continues after water(Smith, 1967; Liu et al., 1994; Wang et al., 2003a), theinput stops, because the matric potential hB at the sur-blob is longer in relatively moist soils than in dry soils.face is above the air-entry value and the matric potential
head gradient across the wetted zone between the sur- Horizontal and Inclined Redistributionface and the front Gm � (hwe � hB)/L � 1. In this case,downward flow will still occur even after the surface Horizontal redistribution (� � 90) should produce
a capillary-dominated moisture profile (Fig. 1a) becausepotential is reduced below the air-entry value because
Rep
rodu
ced
from
Vad
ose
Zon
e Jo
urna
l. P
ublis
hed
by S
oil S
cien
ce S
ocie
ty o
f Am
eric
a. A
ll co
pyrig
hts
rese
rved
.
552 VADOSE ZONE J., VOL. 3, MAY 2004
gravitational potential differences are absent and theright-hand side of Eq. [3] becomes infinite. Experimen-tal evidence of this behavior can be seen in Nielsen et al.(1962) and Youngs and Poulovassilis (1976). For inclinedredistribution, Youngs and Poulovassilis (1976) showedthat for the same amount of water application (I � 3.24cm), the redistribution profiles changed from gravity-dominated (Fig. 1b or 1c) to capillary-dominated (Fig.1a) when the soil column angle of tilt was changed from� � 60 to � � 75. Their results also showed the watercontent near the source of application increased as �increased.
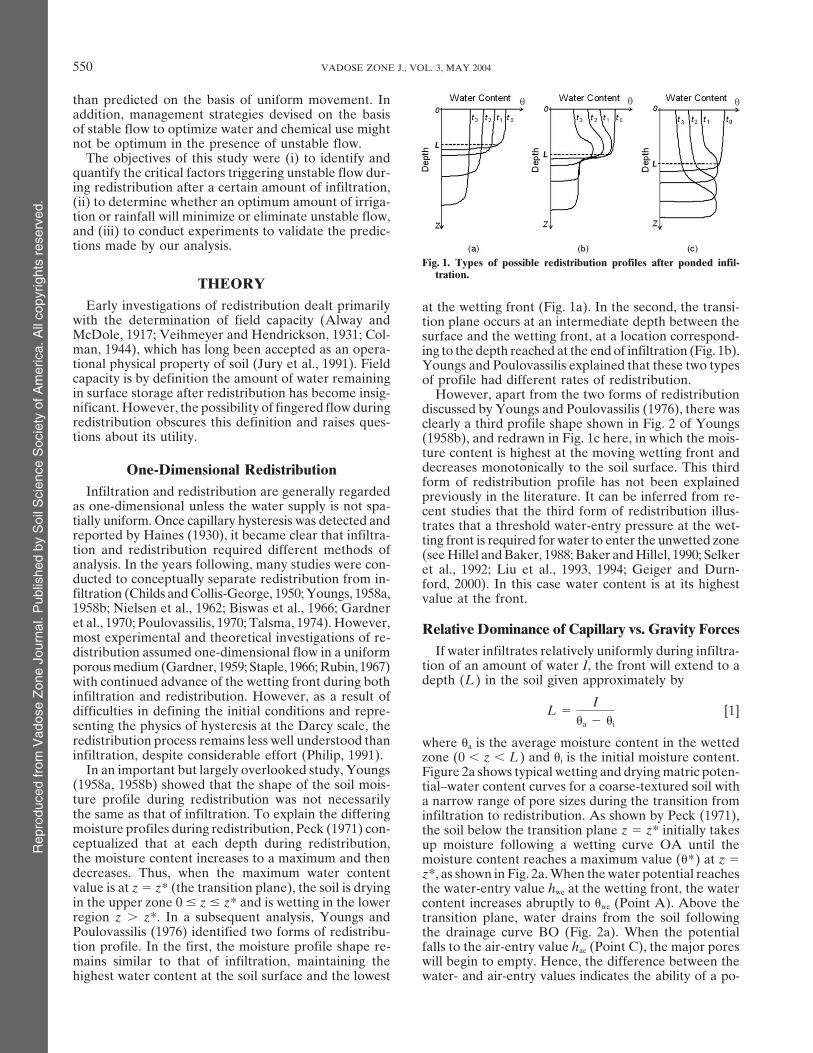
Finger Flow in Two- or Three-dimensional FramesAs shown in Fig. 3a and 3b, the matric potential gra-
dient �h/�z behind the front was initially negative dur-ing saturated infiltration, then changed to positive dur-ing redistribution. If the system flux, i, is governed byDarcy’s Law (with depth z positive downward)
i � Kwe�1 ��h�z � [5]
a positive gradient (�h/�z � 0) means that the flux ratebecomes less than the water-entry conductivity of theporous medium (i � Kwe). Because the wetting frontmoves only when h is greater than the water-entry valuehwe, the flux condition i � Kwe results in a channeling ofthe wetting front into a narrower area (occupied byfingers) that still conducts a total flux of i � Kwe.
In one-dimensional experiments conducted in narrowcolumns, fingers cannot develop when there is insuffi-cient cross-sectional area (Wang et al., 2003a). However,the wetting front in this case may still become inclined,“tongue like,” or wavy, depending on column diameter,soil texture, and initial moisture content (Peck, 1965; Fig. 4. Evolution of a perturbation at the wetting front during (a)White et al., 1976, 1977; Diment and Watson, 1985). Ap- ponded infiltration and (b) redistribution. The arrows show theparently, the column cross section must be able to ac- flow directions.commodate at least one unstable wavelength, which isapproximately equal to twice the finger diameter (Chu- water flow rate from the total cross-sectional area As isoke et al., 1959). Many laboratory experiments fail to equal to that in the fingered area Af; that is, iAs �meet this criterion. KweAf. It follows from Eq. [5] that the fingered flow area
A 10-cm-diameter cylindrical column containing fraction, F � Af/As � i/Kwe, is equal tocoarse-textured soil manifested finger flow due to soilwater redistribution even without air compression. A F � 1 �
�h�z
[6]single large finger down the center of the column wasfrozen and photographed by Wang et al. (2003a). In the Hence, the likelihood of forming fingers is directly re-column experiments of Youngs (1958b), the second type lated to the magnitude of the positive matric potentialof moisture profile (Fig. 1b) was reported, implying a gradient. For capillary-driven redistribution (Fig.1a andpositive matric potential gradient in the transmission 3a), positive gradients are not possible unless upwardzone. Using thermal elements embedded in the soil, flow occurs due to evaporation; therefore, instability willYoungs measured the average water content across the not occur. However, gravity-dominated redistributionentire column cross section. It is thus quite possible that produces positive matric potential gradients and can bethe flow he observed was unstable, since the lower val- very unstable resulting in fingers in the porous mediumues of water content measured below the initial depth (Fig. 1c and 4b).of wetting might have included high values of moistureinside the fingers and extremely low values outside. Explanation of the Initiation of Unstable FlowAssuming that during the early stages of unstableflow the water flow in the fingers moves at a flux rate A physical argument can be used to illustrate why
the direction of the matric potential gradient determinesapproximately equal to K(hwe) � Kwe of the porous me-dium and the flow in the surrounding areas ceases, the whether flow will be unstable. Suppose that a small-
Rep
rodu
ced
from
Vad
ose
Zon
e Jo
urna
l. P
ublis
hed
by S
oil S
cien
ce S
ocie
ty o
f Am
eric
a. A
ll co
pyrig
hts
rese
rved
.
www.vadosezonejournal.org 553
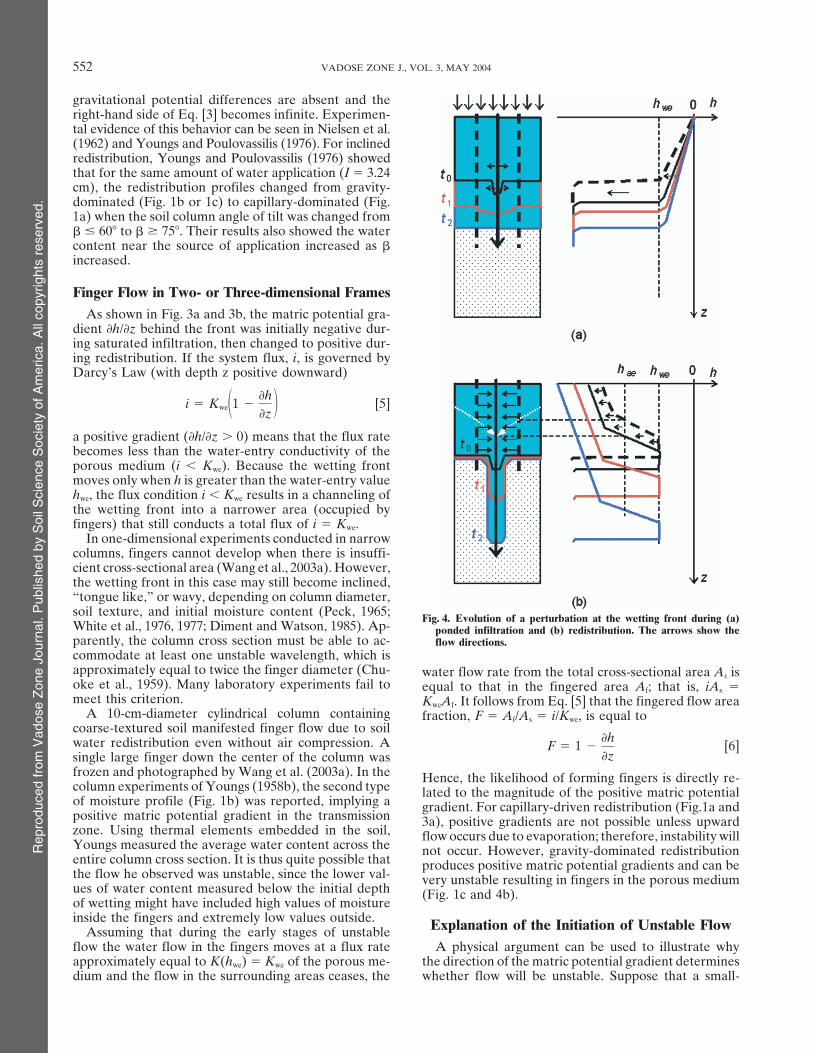
scale perturbation develops at the center of the wettingfront during a surface-saturated infiltration event, caus-ing the wetting front at that point to move slightly belowthe depth of wetting of the main profile (Fig. 4a). Sincethe matric potential at the wetting front remains at thethreshold water-entry value hwe (Jury et al., 2003), the per-turbation causes a downward shift of the matric poten-tial profile above it. When the matric potential increasestoward the surface, as in saturated infiltration, the per-turbation produces a horizontal diverging flow awayfrom the center (solid thick line with an arrow) to theoutside toward the dashed lines, as shown by the hori-zontal arrows, thereby eliminating the growth of the per-turbation. However, during redistribution with the ma-tric potential decreases toward the surface (Fig. 4b),the perturbation produces a horizontal converging flowtoward the central thick line (finger), which depletesthe surrounding matrix and promotes the growth of theperturbation. The white dotted arrow lines indicate the Fig. 5. Drying retention curves of the experimental materials.finger’s capturing zone, above the lines the flow is con-siderably unsaturated. Because in this case the horizon- the sands are shown in Fig. 5 along with lines representing thetal converging flow decreases the matric potential of best fit to the van Genuchten (1980) equation:the soil adjacent to the finger, the pressure at the wetting
� � �r (�s � �r)[1 �(�h)n]�m [7]front of the soil zone may drop below the water-entryvalue, thereby preventing further downward movement where m � 1 � 1/n. The physical properties of the sands andoutside of the fingers (Jury et al., 2003). the optimized equation parameters are shown in Table 1. The
water-entry values (hwe) of the coarser and finer sands (�6.8and �11.7 cm, respectively) were calculated using the empiri-Experimental Validationcal formula (hwe � 4.37/d 0.07) of Baker and Hillel (1990),
Previous experiments have confirmed that (i) the wet- where d (mm) is the median particle size. Baker and Hillelting front does not move until the matric potential at found that measured water-entry values using the capillary-the wetting front exceeds the water-entry value (hwe) of rise method were very close to the inflectional pressure headsthe porous medium (Hillel and Baker, 1988; Baker and [i.e., hinf � (1 m)�m] calculated using the van Genuchten
model for the wetting retention curve. We used the drainageHillel, 1990), (ii) the water potential at the moving wet-parameters and estimated the air-entry values to be hae �ting front stays at hwe (Selker et al., 1992; Liu et al.,�12.6 cm for the coarser sand and hae � �19.0 cm for the finer1994; Geiger and Durnford, 2000), and (iii) the absolutesand. It can be seen from Fig. 5 that although the optimizedvalue of hwe (negative for wettable soils) increases withretention curves using RETC (van Genuchten et al., 1991) didan increase in the initial water content, producing largernot fit very well to the data from the coarse-textured sands, thefingers in the porous medium (Smith, 1967; Liu et al., inflectional pressures were close to the air-entry values at the
1994; Wang et al., 2003a). Our experiments here were water contents near saturation. Hillel and Baker (1988) consid-designed to validate that unstable flow starts during ered that the entry values are actually characteristic of an as-redistribution after Eq. [4] is satisfied, and that fingered semblage of pores, determined by the narrowest or largest poresflow will start sooner in coarse or dry soils than in fine that form a continuous network in the matrix. Therefore, the
entry values do not necessarily correspond to the saturatedor wet soils. If Eq. [4] is valid, it is possible to select anwater content. They can be directly measured using tension-appropriate amount of irrigation that will prevent orpressure infiltrometers (Fallow and Elrick, 1996; Wang et al.,promote finger flow.2000a).
The sands were uniformly packed into a large slab box withMATERIALS AND METHODS transparent walls (100 by 100 cm2 Plexiglass with 1-cm spacing)for visual observation of water flow. The exact packing proce-A sieved coarse silica sand (0.5–0.8 mm particle size, bound-
ing U.S. standard sieves 35 and 60) and a finer silica sand dures were described by Wang et al. (2003a). Because micro-roughness of the sand surface or a slight tilt of the slab-box(0.25–0.5 mm size, bounding sieves 60 and 140) were used in
the experiments. The data for the drying retention curves of will considerably affect the infiltration uniformity when an
Table 1. Physical properties of the experimental material.
Particle Saturated Bulk Total Optimized van Genuchten parameters Threshold entry values†size conductivity density porosity
Material d Ks �b φ �r �s � n hwe hae
mm cm h�1 g cm�3 cm3 cm�3 cm�1 cmCoarser sand 0.5–0.8 504 1.590 0.388 0.039 0.371 0.078 7.17 �6.8 �12.6Finer sand 0.25–0.5 209 1.604 0.383 0.052 0.366 0.052 8.53 �11.7 �19.0
† The air-entry pressure was set equal to the inflection point of the drying retention curve (Wang et al., 1997), and the water-entry pressure hwe wascalculated using the empirical formula of Baker and Hillel (1990).
Rep
rodu
ced
from
Vad
ose
Zon
e Jo
urna
l. P
ublis
hed
by S
oil S
cien
ce S
ocie
ty o
f Am
eric
a. A
ll co
pyrig
hts
rese
rved
.
554 VADOSE ZONE J., VOL. 3, MAY 2004
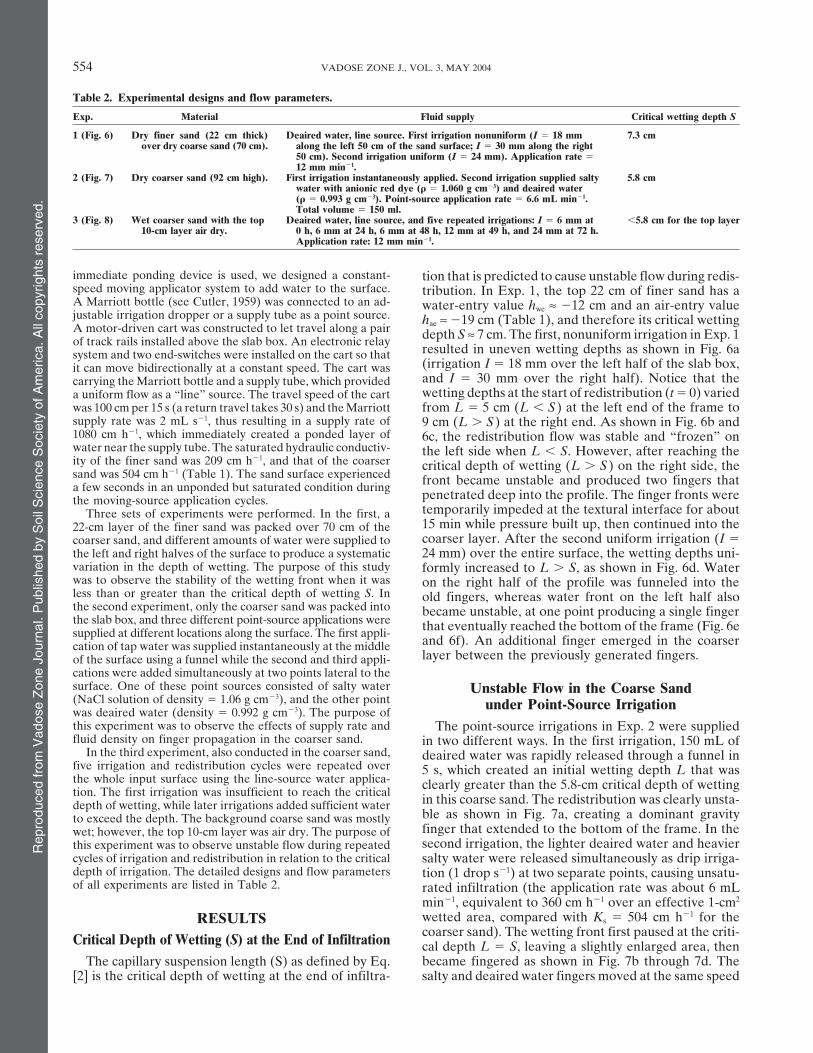
Table 2. Experimental designs and flow parameters.
Exp. Material Fluid supply Critical wetting depth S
1 (Fig. 6) Dry finer sand (22 cm thick) Deaired water, line source. First irrigation nonuniform (I � 18 mm 7.3 cmover dry coarse sand (70 cm). along the left 50 cm of the sand surface; I � 30 mm along the right
50 cm). Second irrigation uniform (I � 24 mm). Application rate �12 mm min�1.
2 (Fig. 7) Dry coarser sand (92 cm high). First irrigation instantaneously applied. Second irrigation supplied salty 5.8 cmwater with anionic red dye (� � 1.060 g cm�3) and deaired water(� � 0.993 g cm�3). Point-source application rate � 6.6 mL min�1.Total volume � 150 ml.
3 (Fig. 8) Wet coarser sand with the top Deaired water, line source, and five repeated irrigations: I � 6 mm at �5.8 cm for the top layer10-cm layer air dry. 0 h, 6 mm at 24 h, 6 mm at 48 h, 12 mm at 49 h, and 24 mm at 72 h.
Application rate: 12 mm min�1.
immediate ponding device is used, we designed a constant- tion that is predicted to cause unstable flow during redis-speed moving applicator system to add water to the surface. tribution. In Exp. 1, the top 22 cm of finer sand has aA Marriott bottle (see Cutler, 1959) was connected to an ad- water-entry value hwe ≈ �12 cm and an air-entry valuejustable irrigation dropper or a supply tube as a point source. hae ≈ �19 cm (Table 1), and therefore its critical wettingA motor-driven cart was constructed to let travel along a pair depth S ≈ 7 cm. The first, nonuniform irrigation in Exp. 1of track rails installed above the slab box. An electronic relay
resulted in uneven wetting depths as shown in Fig. 6asystem and two end-switches were installed on the cart so that(irrigation I � 18 mm over the left half of the slab box,it can move bidirectionally at a constant speed. The cart wasand I � 30 mm over the right half). Notice that thecarrying the Marriott bottle and a supply tube, which providedwetting depths at the start of redistribution (t � 0) varieda uniform flow as a “line” source. The travel speed of the cart
was 100 cm per 15 s (a return travel takes 30 s) and the Marriott from L � 5 cm (L � S) at the left end of the frame tosupply rate was 2 mL s�1, thus resulting in a supply rate of 9 cm (L � S) at the right end. As shown in Fig. 6b and1080 cm h�1, which immediately created a ponded layer of 6c, the redistribution flow was stable and “frozen” onwater near the supply tube. The saturated hydraulic conductiv- the left side when L � S. However, after reaching theity of the finer sand was 209 cm h�1, and that of the coarser critical depth of wetting (L � S) on the right side, thesand was 504 cm h�1 (Table 1). The sand surface experienced front became unstable and produced two fingers thata few seconds in an unponded but saturated condition during
penetrated deep into the profile. The finger fronts werethe moving-source application cycles.temporarily impeded at the textural interface for aboutThree sets of experiments were performed. In the first, a15 min while pressure built up, then continued into the22-cm layer of the finer sand was packed over 70 cm of thecoarser layer. After the second uniform irrigation (I �coarser sand, and different amounts of water were supplied to
the left and right halves of the surface to produce a systematic 24 mm) over the entire surface, the wetting depths uni-variation in the depth of wetting. The purpose of this study formly increased to L � S, as shown in Fig. 6d. Waterwas to observe the stability of the wetting front when it was on the right half of the profile was funneled into theless than or greater than the critical depth of wetting S. In old fingers, whereas water front on the left half alsothe second experiment, only the coarser sand was packed into became unstable, at one point producing a single fingerthe slab box, and three different point-source applications were that eventually reached the bottom of the frame (Fig. 6esupplied at different locations along the surface. The first appli-
and 6f). An additional finger emerged in the coarsercation of tap water was supplied instantaneously at the middlelayer between the previously generated fingers.of the surface using a funnel while the second and third appli-
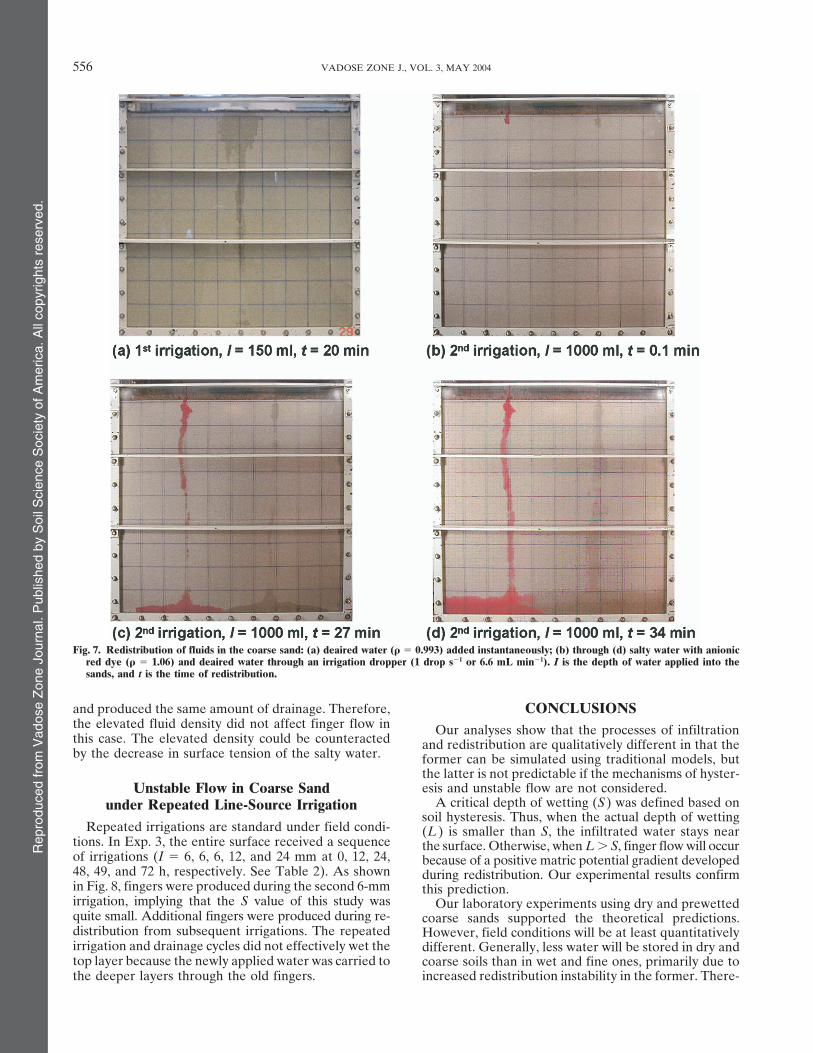
cations were added simultaneously at two points lateral to thesurface. One of these point sources consisted of salty water Unstable Flow in the Coarse Sand(NaCl solution of density � 1.06 g cm�3), and the other point under Point-Source Irrigationwas deaired water (density � 0.992 g cm�3). The purpose ofthis experiment was to observe the effects of supply rate and The point-source irrigations in Exp. 2 were suppliedfluid density on finger propagation in the coarser sand. in two different ways. In the first irrigation, 150 mL of
In the third experiment, also conducted in the coarser sand, deaired water was rapidly released through a funnel infive irrigation and redistribution cycles were repeated over 5 s, which created an initial wetting depth L that wasthe whole input surface using the line-source water applica- clearly greater than the 5.8-cm critical depth of wettingtion. The first irrigation was insufficient to reach the critical in this coarse sand. The redistribution was clearly unsta-depth of wetting, while later irrigations added sufficient water
ble as shown in Fig. 7a, creating a dominant gravityto exceed the depth. The background coarse sand was mostlyfinger that extended to the bottom of the frame. In thewet; however, the top 10-cm layer was air dry. The purpose ofsecond irrigation, the lighter deaired water and heavierthis experiment was to observe unstable flow during repeated
cycles of irrigation and redistribution in relation to the critical salty water were released simultaneously as drip irriga-depth of irrigation. The detailed designs and flow parameters tion (1 drop s�1) at two separate points, causing unsatu-of all experiments are listed in Table 2. rated infiltration (the application rate was about 6 mL
min�1, equivalent to 360 cm h�1 over an effective 1-cm2
wetted area, compared with Ks � 504 cm h�1 for theRESULTScoarser sand). The wetting front first paused at the criti-Critical Depth of Wetting (S) at the End of Infiltration cal depth L � S, leaving a slightly enlarged area, thenbecame fingered as shown in Fig. 7b through 7d. TheThe capillary suspension length (S) as defined by Eq.
[2] is the critical depth of wetting at the end of infiltra- salty and deaired water fingers moved at the same speed

Rep
rodu
ced
from
Vad
ose
Zon
e Jo
urna
l. P
ublis
hed
by S
oil S
cien
ce S
ocie
ty o
f Am
eric
a. A
ll co
pyrig
hts
rese
rved
.
www.vadosezonejournal.org 555
Fig. 6. Redistribution of unevenly applied water in a finer sand (top 22 cm) and a coarser sand (below) through a line source. I is the depth ofwater applied into the sands, and t is the time of redistribution.
Rep
rodu
ced
from
Vad
ose
Zon
e Jo
urna
l. P
ublis
hed
by S
oil S
cien
ce S
ocie
ty o
f Am
eric
a. A
ll co
pyrig
hts
rese
rved
.
556 VADOSE ZONE J., VOL. 3, MAY 2004
Fig. 7. Redistribution of fluids in the coarse sand: (a) deaired water (� � 0.993) added instantaneously; (b) through (d) salty water with anionicred dye (� � 1.06) and deaired water through an irrigation dropper (1 drop s�1 or 6.6 mL min�1). I is the depth of water applied into thesands, and t is the time of redistribution.
and produced the same amount of drainage. Therefore, CONCLUSIONSthe elevated fluid density did not affect finger flow in Our analyses show that the processes of infiltrationthis case. The elevated density could be counteracted and redistribution are qualitatively different in that theby the decrease in surface tension of the salty water. former can be simulated using traditional models, but
the latter is not predictable if the mechanisms of hyster-esis and unstable flow are not considered.Unstable Flow in Coarse Sand
A critical depth of wetting (S) was defined based onunder Repeated Line-Source Irrigationsoil hysteresis. Thus, when the actual depth of wetting
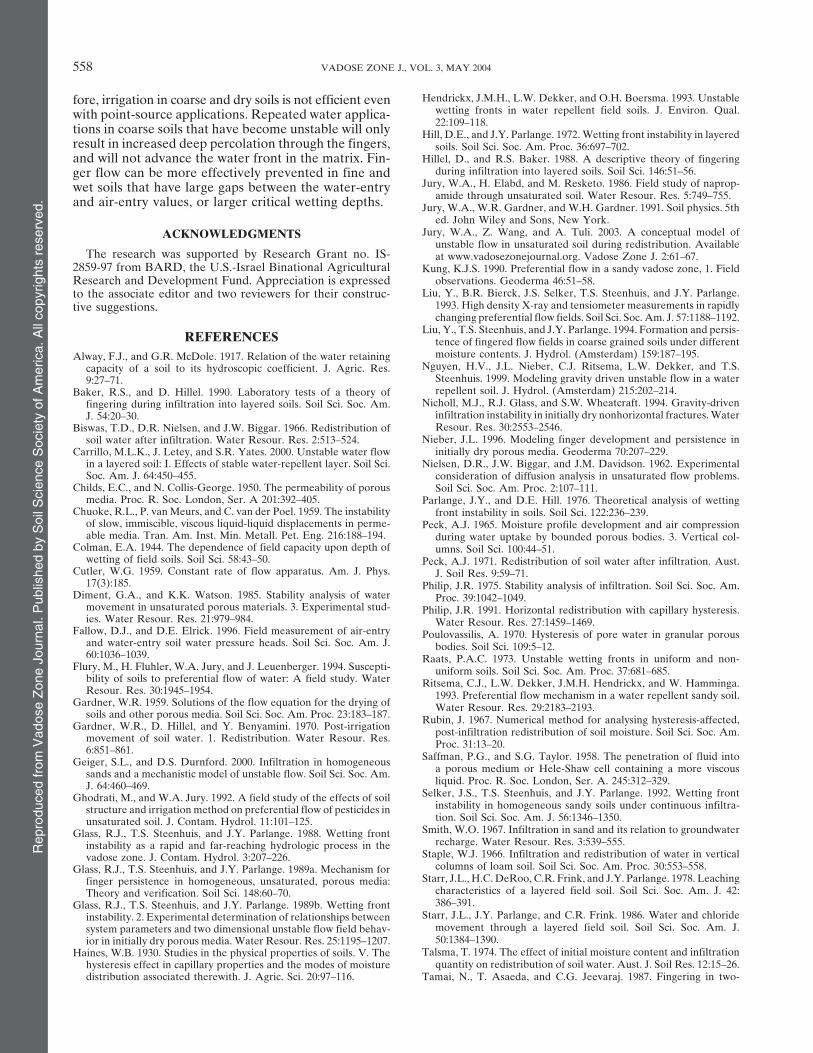
Repeated irrigations are standard under field condi- (L) is smaller than S, the infiltrated water stays neartions. In Exp. 3, the entire surface received a sequence the surface. Otherwise, when L � S, finger flow will occurof irrigations (I � 6, 6, 6, 12, and 24 mm at 0, 12, 24, because of a positive matric potential gradient developed48, 49, and 72 h, respectively. See Table 2). As shown during redistribution. Our experimental results confirmin Fig. 8, fingers were produced during the second 6-mm this prediction.irrigation, implying that the S value of this study was Our laboratory experiments using dry and prewettedquite small. Additional fingers were produced during re- coarse sands supported the theoretical predictions.distribution from subsequent irrigations. The repeated However, field conditions will be at least quantitativelyirrigation and drainage cycles did not effectively wet the different. Generally, less water will be stored in dry andtop layer because the newly applied water was carried to coarse soils than in wet and fine ones, primarily due to
increased redistribution instability in the former. There-the deeper layers through the old fingers.

Rep
rodu
ced
from
Vad
ose
Zon
e Jo
urna
l. P
ublis
hed
by S
oil S
cien
ce S
ocie
ty o
f Am
eric
a. A
ll co
pyrig
hts
rese
rved
.
www.vadosezonejournal.org 557
Fig. 8. Redistribution profiles of water in the wet coarse sand with repeated irrigation cycles. The top 10 cm of sand was air-dry. I is the depthof water applied into the sands, and t is the time of redistribution.
Rep
rodu
ced
from
Vad
ose
Zon
e Jo
urna
l. P
ublis
hed
by S
oil S
cien
ce S
ocie
ty o
f Am
eric
a. A
ll co
pyrig
hts
rese
rved
.
558 VADOSE ZONE J., VOL. 3, MAY 2004
Hendrickx, J.M.H., L.W. Dekker, and O.H. Boersma. 1993. Unstablefore, irrigation in coarse and dry soils is not efficient evenwetting fronts in water repellent field soils. J. Environ. Qual.with point-source applications. Repeated water applica-22:109–118.tions in coarse soils that have become unstable will only Hill, D.E., and J.Y. Parlange. 1972. Wetting front instability in layered
result in increased deep percolation through the fingers, soils. Soil Sci. Soc. Am. Proc. 36:697–702.Hillel, D., and R.S. Baker. 1988. A descriptive theory of fingeringand will not advance the water front in the matrix. Fin-
during infiltration into layered soils. Soil Sci. 146:51–56.ger flow can be more effectively prevented in fine andJury, W.A., H. Elabd, and M. Resketo. 1986. Field study of naprop-wet soils that have large gaps between the water-entry
amide through unsaturated soil. Water Resour. Res. 5:749–755.and air-entry values, or larger critical wetting depths. Jury, W.A., W.R. Gardner, and W.H. Gardner. 1991. Soil physics. 5thed. John Wiley and Sons, New York.
Jury, W.A., Z. Wang, and A. Tuli. 2003. A conceptual model ofACKNOWLEDGMENTSunstable flow in unsaturated soil during redistribution. Available
The research was supported by Research Grant no. IS- at www.vadosezonejournal.org. Vadose Zone J. 2:61–67.2859-97 from BARD, the U.S.-Israel Binational Agricultural Kung, K.J.S. 1990. Preferential flow in a sandy vadose zone, 1. Field
observations. Geoderma 46:51–58.Research and Development Fund. Appreciation is expressedLiu, Y., B.R. Bierck, J.S. Selker, T.S. Steenhuis, and J.Y. Parlange.to the associate editor and two reviewers for their construc-
1993. High density X-ray and tensiometer measurements in rapidlytive suggestions.changing preferential flow fields. Soil Sci. Soc. Am. J. 57:1188–1192.
Liu, Y., T.S. Steenhuis, and J.Y. Parlange. 1994. Formation and persis-REFERENCES tence of fingered flow fields in coarse grained soils under different
moisture contents. J. Hydrol. (Amsterdam) 159:187–195.Alway, F.J., and G.R. McDole. 1917. Relation of the water retainingNguyen, H.V., J.L. Nieber, C.J. Ritsema, L.W. Dekker, and T.S.capacity of a soil to its hydroscopic coefficient. J. Agric. Res.
Steenhuis. 1999. Modeling gravity driven unstable flow in a water9:27–71.repellent soil. J. Hydrol. (Amsterdam) 215:202–214.Baker, R.S., and D. Hillel. 1990. Laboratory tests of a theory of
Nicholl, M.J., R.J. Glass, and S.W. Wheatcraft. 1994. Gravity-drivenfingering during infiltration into layered soils. Soil Sci. Soc. Am.infiltration instability in initially dry nonhorizontal fractures. WaterJ. 54:20–30.Resour. Res. 30:2553–2546.Biswas, T.D., D.R. Nielsen, and J.W. Biggar. 1966. Redistribution of
Nieber, J.L. 1996. Modeling finger development and persistence insoil water after infiltration. Water Resour. Res. 2:513–524.initially dry porous media. Geoderma 70:207–229.Carrillo, M.L.K., J. Letey, and S.R. Yates. 2000. Unstable water flow
in a layered soil: I. Effects of stable water-repellent layer. Soil Sci. Nielsen, D.R., J.W. Biggar, and J.M. Davidson. 1962. ExperimentalSoc. Am. J. 64:450–455. consideration of diffusion analysis in unsaturated flow problems.
Childs, E.C., and N. Collis-George. 1950. The permeability of porous Soil Sci. Soc. Am. Proc. 2:107–111.media. Proc. R. Soc. London, Ser. A 201:392–405. Parlange, J.Y., and D.E. Hill. 1976. Theoretical analysis of wetting
Chuoke, R.L., P. van Meurs, and C. van der Poel. 1959. The instability front instability in soils. Soil Sci. 122:236–239.of slow, immiscible, viscous liquid-liquid displacements in perme- Peck, A.J. 1965. Moisture profile development and air compressionable media. Tran. Am. Inst. Min. Metall. Pet. Eng. 216:188–194. during water uptake by bounded porous bodies. 3. Vertical col-
Colman, E.A. 1944. The dependence of field capacity upon depth of umns. Soil Sci. 100:44–51.wetting of field soils. Soil Sci. 58:43–50. Peck, A.J. 1971. Redistribution of soil water after infiltration. Aust.
Cutler, W.G. 1959. Constant rate of flow apparatus. Am. J. Phys. J. Soil Res. 9:59–71.17(3):185. Philip, J.R. 1975. Stability analysis of infiltration. Soil Sci. Soc. Am.
Diment, G.A., and K.K. Watson. 1985. Stability analysis of water Proc. 39:1042–1049.movement in unsaturated porous materials. 3. Experimental stud- Philip, J.R. 1991. Horizontal redistribution with capillary hysteresis.ies. Water Resour. Res. 21:979–984. Water Resour. Res. 27:1459–1469.
Fallow, D.J., and D.E. Elrick. 1996. Field measurement of air-entry Poulovassilis, A. 1970. Hysteresis of pore water in granular porousand water-entry soil water pressure heads. Soil Sci. Soc. Am. J. bodies. Soil Sci. 109:5–12.60:1036–1039. Raats, P.A.C. 1973. Unstable wetting fronts in uniform and non-
Flury, M., H. Fluhler, W.A. Jury, and J. Leuenberger. 1994. Suscepti- uniform soils. Soil Sci. Soc. Am. Proc. 37:681–685.bility of soils to preferential flow of water: A field study. Water Ritsema, C.J., L.W. Dekker, J.M.H. Hendrickx, and W. Hamminga.Resour. Res. 30:1945–1954. 1993. Preferential flow mechanism in a water repellent sandy soil.
Gardner, W.R. 1959. Solutions of the flow equation for the drying of Water Resour. Res. 29:2183–2193.soils and other porous media. Soil Sci. Soc. Am. Proc. 23:183–187. Rubin, J. 1967. Numerical method for analysing hysteresis-affected,
Gardner, W.R., D. Hillel, and Y. Benyamini. 1970. Post-irrigation post-infiltration redistribution of soil moisture. Soil Sci. Soc. Am.movement of soil water. 1. Redistribution. Water Resour. Res. Proc. 31:13–20.6:851–861.Saffman, P.G., and S.G. Taylor. 1958. The penetration of fluid intoGeiger, S.L., and D.S. Durnford. 2000. Infiltration in homogeneous
a porous medium or Hele-Shaw cell containing a more viscoussands and a mechanistic model of unstable flow. Soil Sci. Soc. Am.liquid. Proc. R. Soc. London, Ser. A. 245:312–329.J. 64:460–469.
Selker, J.S., T.S. Steenhuis, and J.Y. Parlange. 1992. Wetting frontGhodrati, M., and W.A. Jury. 1992. A field study of the effects of soilinstability in homogeneous sandy soils under continuous infiltra-structure and irrigation method on preferential flow of pesticides intion. Soil Sci. Soc. Am. J. 56:1346–1350.unsaturated soil. J. Contam. Hydrol. 11:101–125.
Smith, W.O. 1967. Infiltration in sand and its relation to groundwaterGlass, R.J., T.S. Steenhuis, and J.Y. Parlange. 1988. Wetting frontrecharge. Water Resour. Res. 3:539–555.instability as a rapid and far-reaching hydrologic process in the
Staple, W.J. 1966. Infiltration and redistribution of water in verticalvadose zone. J. Contam. Hydrol. 3:207–226.columns of loam soil. Soil Sci. Soc. Am. Proc. 30:553–558.Glass, R.J., T.S. Steenhuis, and J.Y. Parlange. 1989a. Mechanism for
Starr, J.L., H.C. DeRoo, C.R. Frink, and J.Y. Parlange. 1978. Leachingfinger persistence in homogeneous, unsaturated, porous media:characteristics of a layered field soil. Soil Sci. Soc. Am. J. 42:Theory and verification. Soil Sci. 148:60–70.386–391.Glass, R.J., T.S. Steenhuis, and J.Y. Parlange. 1989b. Wetting front
Starr, J.L., J.Y. Parlange, and C.R. Frink. 1986. Water and chlorideinstability. 2. Experimental determination of relationships betweenmovement through a layered field soil. Soil Sci. Soc. Am. J.system parameters and two dimensional unstable flow field behav-50:1384–1390.ior in initially dry porous media. Water Resour. Res. 25:1195–1207.
Talsma, T. 1974. The effect of initial moisture content and infiltrationHaines, W.B. 1930. Studies in the physical properties of soils. V. Thequantity on redistribution of soil water. Aust. J. Soil Res. 12:15–26.hysteresis effect in capillary properties and the modes of moisture
distribution associated therewith. J. Agric. Sci. 20:97–116. Tamai, N., T. Asaeda, and C.G. Jeevaraj. 1987. Fingering in two-

Rep
rodu
ced
from
Vad
ose
Zon
e Jo
urna
l. P
ublis
hed
by S
oil S
cien
ce S
ocie
ty o
f Am
eric
a. A
ll co
pyrig
hts
rese
rved
.
www.vadosezonejournal.org 559
dimensional, homogeneous, unsaturated porous media. Soil Sci. Wang, Z., L. Wu, T. Harter, J. Lu, and W.A. Jury. 2003b. A field144:107–112. study of unstable preferential flow during soil water redistribution.
van Genuchten, M.Th. 1980. A closed form equation for predicting Water Resour. Res. Vol. 39(4). DOI: 10.1029/2001WR000903.the hydraulic conductivity of unsaturated soils. Soil Sci. Soc. Am. Wang, Z., L. Wu, and Q.J. Wu. 2000a. Water-entry value as an alterna-J. 44:892–898. tive indicator of soil water repellency and wettability. J. Hydrol.
van Genuchten, M.Th., F.J. Leij, and S.R. Yates. 1991. The RETC (Amsterdam) 231–232:76–83.code for quantifying the hydraulic functions of unsaturated soils. Wang, Z., Q.J. Wu, L. Wu, C.J. Ritsema, L.W. Dekker, and J. Feyen.USDA-ARS, U.S. Salinity Lab., Riverside, CA. 2000b. Effects of soil water repellency on infiltration rate and flow
van Ommen, H.C., L.W. Dekker, R. Dijksma, J. Hulsof, and W.H. instability. J. Hydrol. (Amsterdam) 231–232:265–276.van der Molen. 1988. A new technique for evaluating the presence White, I., P.M. Colombera, and J.R. Philip. 1976. Experimental studiesof preferential flow paths in nonstructured soils. Soil Sci. Soc. Am. of wetting front instability induced by sudden changes of pressureJ. 52:1192–1193. gradient. Soil Sci. Soc. Am. Proc. 40:824–829.
Veihmeyer, F.J., and A.H. Hendrickson. 1931. The moisture equiva- White, I., P.M. Colombera, and J.R. Philip. 1977. Experimental studieslent as a measure of the field capacity of soils. Soil Sci. 32:181–193. of wetting front instability induced by gradual changes of pressure
Wang, Z., J. Feyen, and D.E. Elrick. 1998c. Prediction of fingering gradient and by heterogeneous porous media. Soil Sci. Soc. Am.in porous media. Water Resour. Res. 34:2183–2190.Proc. 41:483–489.Wang, Z., J. Feyen, D.R. Nielsen, and M.Th. van Genuchten. 1997.
Yao, T.-M., and J.M.H. Hendrickx. 1996. Stability of wetting frontsTwo-phase flow infiltration equations accounting for air entrap-in dry homogeneous soils under low infiltration rates. Soil Sci. Soc.ment effects. Water Resour. Res. 33:2759–2767.Am. J. 60:20–28.Wang, Z., J. Feyen, and C.J. Ritsema. 1998b. Susceptibility and pre-
Youngs, E.G. 1958a. Redistribution of moisture in porous materialsdictability of conditions for preferential flow. Water Resour.after infiltration, 1. Soil Sci. 86:117–125.Res. 34:2169–2182.
Youngs, E.G. 1958b. Redistribution of moisture in porous materialsWang, Z., J. Feyen, M.Th. van Genuchten, and D.R. Nielsen. 1998a.after infiltration, 2. Soil Sci. 86:202–207.Air entrapment effects on infiltration rate and flow instability.
Youngs, E.G., and A. Poulovassilis. 1976. The different forms ofWater Resour. Res. 34:213–222.moisture profile development during the redistribution of soil waterWang, Z., A. Tuli, and W.A. Jury. 2003a. Unstable flow during redistri-
bution in homogeneous soil. Vadose Zone J. 2:52–60. after infiltration. Water Resour. Res. 12:1007–1012.