Embed Size (px)
Citation preview

Unlocking the Potential: Women and Mobile Financial Services in Emerging Markets


Table of Contents
Executive Summary 01Key Findings 01
Introduction 04Methodology 05
The Financial Lives of Women 06Women Are Active Household Financial Managers 06
Ani: Managing the Household Expenditures in an Indonesian Village 07
Women Contribute to Household Income 08
Remittances and Goverment-to-People Payments Are Important Payment Streams for Women 10
The Role and Limitations of Existing Financial Services in the Lives of Women 11In Resource-Poor Rural Settings, Women are the Ultimate Multitaskers 11
Existing Financial Management Tools Don’t Fully Meet Their Wants and Needs 12
The Role of Mobile Financial Services in Delivering What Women Want and Need 16Women Want and Need Convenience, Reliability, Security, and Privacy 16
Customer Pathway: The Journey to Adopting Mobile Financial Services 19
How Mobile Financial Services Providers Can Promote Faster Adoption 21Increase Mobile Access for Women 21
Conduct Marketing Research Focused on Potential Women Customers 21
Increase Awareness and Understanding of Mobile Financial Services 22
Encourage and Incentivize Trial Use 26
Extend Access and Improve Service Quality and Branding of Agents 26
Streamline Registration 27
Increase Usage among Regular Users 27
Deliver Convenience, Reliability, Security, and Privacy Consistently 28
Appendix: Report Methodology, Country Profiles and Data 29

Executive Summary
Mobile financial services (MFS) are emerging rapidly in the developing world, with over 150 mobile money deployments live and over 110 more planned worldwide at present. Markets such as Tanzania, Bangladesh and Pakistan are realizing success and are potentially able to replicate the widespread adoption of Safaricom’s M-PESA service in Kenya. Others are still works-in-progress, finding mass adoption and scale elusive.
Meanwhile, mobile operators, financial institutions, governments, and other service providers are figuring out how to build attractive and user-friendly services, distribution networks and marketing approaches to embed MFS into their national infrastructures with viable, long-term business models.
A consistently overlooked theme in these discussions has been women, including their wants and needs for and use of mobile financial services, as well as their critical role in the success of any mobile financial services deployment. This is not a surprise: as the GSMA mWomen Programme notes, there is a gender gap in terms of women’s ownership and use of mobile services generally. Despite the proven role women’s financial inclusion can play in advancing economic development and empowerment, and despite the role mobile might play (in 2012, an estimated 1.7 billion people had a mobile phone but not a bank account1), the linkages between women’s financial inclusion and mobile financial services thus far have not been illuminated and elevated for discussion.
The objective of this report is to connect these dots in the context of the developing world, based on findings and insights from the experience of women in five countries at different stages of MFS market development: Indonesia, Kenya, Pakistan, Papua New Guinea, and Tanzania.
Key Findings Women in developing markets are an important potential customer base for mobile financial service providers. They are active household financial managers – in some ways more active than men. While men bring home more of the household income, women often contribute supplementary income and frequently are in charge of undertaking the large volume of small transactions needed to care for family, pay bills, send and receive money from distant family members, and save.
Women across all five countries in this study voiced their need for four key attributes in financial tools and services: convenience, reliability, security, and privacy. Stretched for time and responsible for both children’s daily expenses and unanticipated household economic shocks (e.g., failed crops or illness), women are often risk-averse when it comes to money management. As a result, they value convenient, reliable, secure, and private financial tools.
MFS can better meet women’s financial management needs than many of the formal and informal tools they use today. Mobile financial service providers should consider informal financial services mechanisms in their competitive analyses, since those that are deeply entrenched may create a barrier to customers’ adoption of mobile financial services. Yet, when assessed against mobile financial services, informal mechanisms often fall short of meeting all of women’s needs for convenience, reliability, security, and privacy.
Mobile operators can achieve scale and stability if they build and maintain the women’s segment of the MFS market. Women are active consumers of financial services, with responsibilities for receiving and sending remittances, bill payments, money storage, and other financial management activities that mobile financial services are well-positioned to deliver. When their needs are met consistently, women can be very loyal and evangelizing customers, providing both scale and stability for core mobile financial services business. Furthermore, their role as chief recipients of government-to-person (G2P) payments means that service providers who can serve women may be better positioned to both provide the distribution of the emerging wave of such payments in the coming years and service the outgoing payments that women make with their G2P income.
1 G20 Financial Inclusion Experts Group.
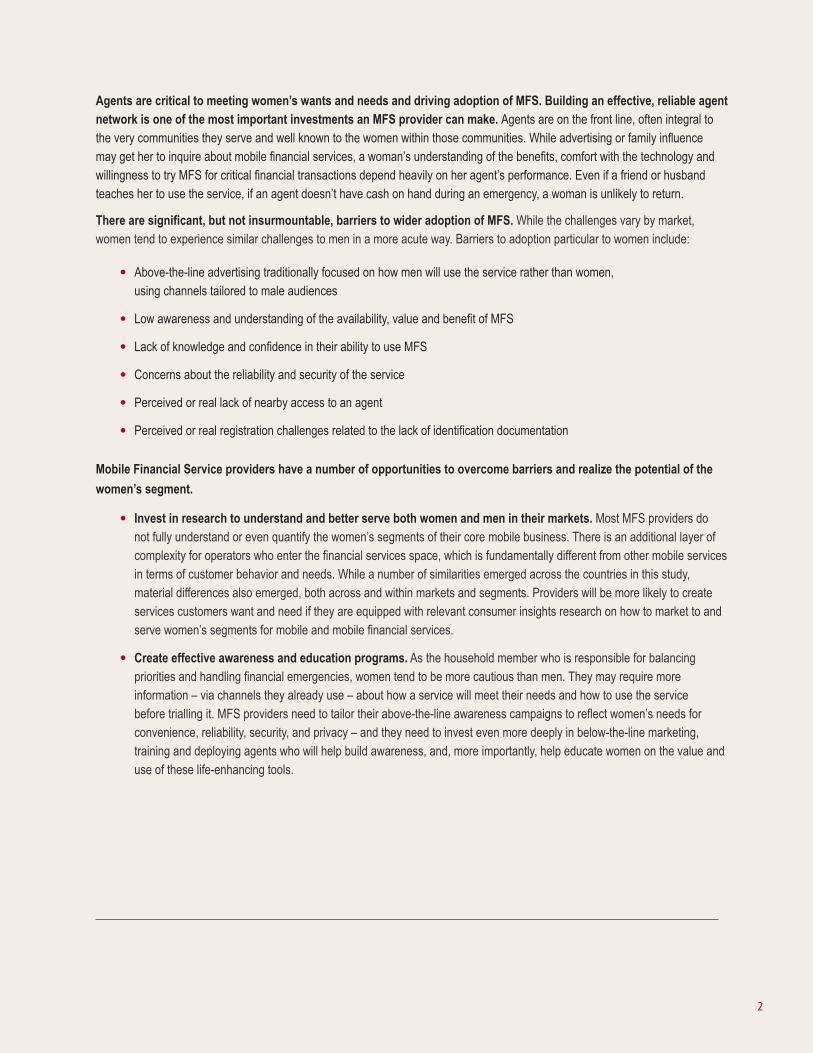
Agents are critical to meeting women’s wants and needs and driving adoption of MFS. Building an effective, reliable agent network is one of the most important investments an MFS provider can make. Agents are on the front line, often integral to the very communities they serve and well known to the women within those communities. While advertising or family influence may get her to inquire about mobile financial services, a woman’s understanding of the benefits, comfort with the technology and willingness to try MFS for critical financial transactions depend heavily on her agent’s performance. Even if a friend or husband teaches her to use the service, if an agent doesn’t have cash on hand during an emergency, a woman is unlikely to return.
There are significant, but not insurmountable, barriers to wider adoption of MFS. While the challenges vary by market, women tend to experience similar challenges to men in a more acute way. Barriers to adoption particular to women include:
� Above-the-line advertising traditionally focused on how men will use the service rather than women, using channels tailored to male audiences
� Low awareness and understanding of the availability, value and benefit of MFS
� Lack of knowledge and confidence in their ability to use MFS
� Concerns about the reliability and security of the service
� Perceived or real lack of nearby access to an agent
� Perceived or real registration challenges related to the lack of identification documentation
Mobile Financial Service providers have a number of opportunities to overcome barriers and realize the potential of the
women’s segment.
� Invest in research to understand and better serve both women and men in their markets. Most MFS providers do not fully understand or even quantify the women’s segments of their core mobile business. There is an additional layer of complexity for operators who enter the financial services space, which is fundamentally different from other mobile services in terms of customer behavior and needs. While a number of similarities emerged across the countries in this study, material differences also emerged, both across and within markets and segments. Providers will be more likely to create services customers want and need if they are equipped with relevant consumer insights research on how to market to and serve women’s segments for mobile and mobile financial services.
� Create effective awareness and education programs. As the household member who is responsible for balancing priorities and handling financial emergencies, women tend to be more cautious than men. They may require more information – via channels they already use – about how a service will meet their needs and how to use the service before trialling it. MFS providers need to tailor their above-the-line awareness campaigns to reflect women’s needs for convenience, reliability, security, and privacy – and they need to invest even more deeply in below-the-line marketing, training and deploying agents who will help build awareness, and, more importantly, help educate women on the value and use of these life-enhancing tools.

� Encourage and incentivize trial use. In all four markets, a meaningful number of men and women who are aware of mobile financial services fail to try them. The good news is that, with the exception of Pakistan, where general awareness is the chief barrier to adoption, many of the non-users already suspect they want to use these services. Once users trial the service, they tend to adopt it for regular use. Providers should consider incentive schemes for agents and/or customers to encourage trial and on-going use of MFS.
� Extend access and improve branding of agents. Trust of and loyalty to an MFS agent can make or break a woman’s commitment to a brand.2 Yet a key issue for any MFS provider is low density of agents. This can be particularly burdensome for women who are time-poor and often tied to the home and children. For example, in Tanzania, 26% of women relative to 19% of men wanting a mobile money account cite “agents are far away” as the main reason for not trialling the service.
� Streamline registration. In Kenya, identification cards are a key barrier. In fact, 35% of Kenyan women interested in trying MFS cited a lack of identification or other documents as their main reason for not opening an account, in contrast to 18% of Kenyan men. Yet, 87% of men and 85% of women surveyed actually own an identification card. Therefore, it is important to better promote what is needed for registration, not only to encourage higher demand but also to streamline the registration process for time-poor women who are solely responsible for all household chores and a good share of household financial management.
� Increase usage among regular users. Across the four study countries, most male and female customers who trial the service tend to become regular users. However, simple adoption isn’t the end of the journey; the next giant leap is to encourage users to increase the types of mobile financial services they use, to increase value to customers as well as the service provider.
� Deliver convenience, reliability, security, and privacy consistently. MFS providers can’t lose sight of what attracted women customers in the first place: women who are risk averse or otherwise slow to adopt may not stick with a service if their early experiences are disappointing or unreliable. Maintaining high service quality levels is as important as building them in the first place.
There’s a potential virtuous circle between mobile financial services and mobile access for women. Of those surveyed, 34% of women in Tanzania, 13% of women in Kenya and 10% of women in in Papua New Guinea who say they want to try MFS cite the lack of a phone as the main reason for not having done so.3 At the same time, prior GSMA mWomen research indicates that lack of perceived value is one barrier to women’s use of mobile.4 If mobile financial services offer a clear, perceived value to women, they are likely to use the service plus become more active subscribers, with greater willingness to try new tools. MFS providers who choose to offer women relevant products will have the opportunity to improve both their core and mobile financial service businesses, as well as to impact women’s lives at scale.
Meeting women’s wants and needs likely will enhance a service provider’s offering for the entire market. Service providers don’t need to create an entirely different set of services, distribution channels or brands for women. Rather, if service providers are able to tailor their marketing, services, customer care, and agent networks to meet women’s needs for convenience, reliability, security, and privacy, men in these markets also are likely to become more loyal customers. Agents who are welcoming, service-oriented, well-trained, and fully equipped to educate and serve new customers are likely to encourage greater adoption and usage across all segments.
2 Valentyna Melnyk, Stijn M.J. van Osselaer and Tammo H.A. Bijmolt. Are Women More Loyal Customers Than Men? Gender Differences in Loyalty to Firms and Individual Service Providers. AMA Journal of Marketing. 2009.
3 Data for Pakistan isn’t available, as only 1% of women in Pakistan who have not tried MFS wish to, hence data on mobile phones as a barrier was not meaningful.
4 GSMA and the Cherie Blair Foundation for Women. Women & Mobile: A Global Opportunity. 2010.

Introduction
Mobile financial services are emerging rapidly in the developing world, with over 150 mobile money deployments live and over 110 more planned worldwide at present. Markets such as Tanzania, Bangladesh and Pakistan are realizing success and are potentially able to replicate the wide-spread adoption of Safaricom’s M-PESA service in Kenya. Others are still works-in-progress, finding mass adoption and scale elusive.
Meanwhile, mobile operators, financial institutions, governments, and other service providers are figuring out how to build attractive and user-friendly services, distribution networks and marketing approaches to embed MFS into their national infrastructures with viable, long-term business models.
A consistently overlooked theme in these discussions has been women, including their wants and needs for MFS, as well as their critical role in the success of any MFS deployment. This is not a surprise: as the GSMA mWomen Programme notes, there is a gender gap in terms of women’s ownership and use of mobile services generally. Despite the proven role women’s financial inclusion can play in advancing economic development and empowerment, and despite the role mobile might play (in 2012, an estimated 1.7 billion people had a mobile phone but not a bank account5), the linkages between women’s financial inclusion and MFS thus far have not been illuminated and elevated for discussion.
Part of the challenge is that the needs of women are overlooked and not fully understood by mobile money managers. Even some large-scale financial inclusion and development programs aiming to serve women, such as government-to-person (G2P) programs, have yet to fully explore how such payments might link women to formal financial services, including mobile mechanisms.
The objective of this report is to connect these dots in the context of the developing world, based on findings and insights from the experience of five countries at different stages of MFS market development. This study:
� Demonstrates that women undertake a high volume of household financial management activities;
� Confirms that women have an appetite for services to better meet their needs;
� Illustrates common barriers to adoption; and
� Identifies opportunities for MFS providers to overcome these barriers in order to grow the women’s segment for MFS and mobile phone services and increase the likelihood of commercial success for the savvy service provider.
5 G20 Financial Inclusion Experts Group.

MethodologyThis study includes a synthesis of findings from primary quantitative research in four markets and primary qualitative research in five markets, chosen for their geographical diversity as well as differences in their stage of mobile financial services development. This primary research was supplemented with secondary research from a number of existing sources cited within the report itself. Primary data collection was designed by Bankable Frontier Associates (BFA) to focus heavily on the female population, as well as differences between mobile phone and MFS users and non-users; all results should be interpreted in this context prior to comparing findings to nationally representative surveys of these same markets.
For the quantitative analysis, BFA commissioned household surveys in Kenya, Pakistan, Papua New Guinea, and Tanzania. Due to the study’s focus on women, the sampling strategy over-sampled women to comprise 75% of the total respondents in each country.
BFA also directly undertook qualitative research across rural and urban areas in Indonesia, Kenya, Pakistan, Papua New Guinea, and Tanzania, including focus groups of 8-10 people and 11-20 in-depth, one-on-one interviews in each country. All discussions were recorded, transcribed and translated.

The Financial Lives of Women
In order to fully understand the opportunity presented by women in emerging markets, it is important to know what their financial lives are like: their transactions, their payment flows, their access to mobile money. Even though there is a significant difference in earnings between men and women, the research found that women take on a substantial amount of responsibility for their families’ financial management, including remittances, emergency payments and daily household management. They also contribute to household income, albeit in smaller amounts and from more informal means than their male counterparts.
Women Are Active Household Financial ManagersAcross five diverse, emerging markets, women consistently prove to be highly active household financial managers and, thus, could benefit greatly from access to MFS.
While men tend to earn the lion’s share of the household income (data across the four countries studied suggest men earn well over 50% of household income), women tend to take responsibility for a significant portion of the household financial manage-ment decision-making, if not more, particularly in terms of how to execute a large volume of small-value household transactions. In addition to purchasing many daily household items such as food, they can also be responsible for paying bills, sending remittances and storing money for both routine and emergency payments, even if they do not earn the income used to conduct these transactions. For example, in Pakistan, 39% of women who earn no income are nevertheless responsible for paying bills or saving for family needs. Women are also the key savings engine for the family, with access to savings groups that help the entire family protect their wealth for emergencies or other lump-sum expenses.
To illustrate, in many instances in the Kenya, Pakistan, Papua New Guinea, and Tanzania studies, women have similar levels of activity as men in terms of their use of the key types of financial payments: paying household bills, storing money for emergen-cies or lump payments and sending remittances. Note that the figures below do not refer to the size of outflows but rather to the percent of respondents who self-report that they make them.
Figure 1: Financial OutflowsRespondents who report having made the following use of money (%)
0 10 20 30 40 50 60 70 80
%
Savings
Supplier payments
School
Utilities
Remittance
Kenya
Pakistan
Tanzania
Women Men
0 10 20 30 40 50 60 70 80
Utilities
Remittance
%
Savings
Supplier payments
School
0 10 20 30 40 50 60 70 80
%
Savings
Supplier payments
School
Utilities
Remittance
0 10 20 30 40 50 60 70 80
%
Remittance
School
Supplier payments
Utilities
Savings
Papua New Guinea
Note: Data refers to the percent of respondents who self-reported that they normally are responsible for conducting each type of activity, which are not mutually exclusive. Everyday cash purchases such as food were not included in the survey.

Ani: Managing the Household Expenditures in an Indonesian Village“Ani” lives in a small village in Indonesia’s West Java province with her children and her husband. Through his jobs as a motorcycle driver and agricultural produce salesman, her husband brings in most of the household income.
Ani does not have a job outside the home but is responsible for handling most of her household’s financial management. She relies on a daily allowance of US$4-10 per day from her husband and supplements this through gifts from friends and small savings. During the two-week period prior to this study, Ani contributed only 19% of the value of the household’s incoming cash flow but was responsible for executing transactions representing 64% of the value of outflows. Removing her husband’s business costs, Ani’s share of outflows increases to 88% of the total value.
Ani generally relies on her savings to handle emergencies. For example, one of Ani’s children suffered an asthma attack shortly before the study. This emergency required a visit to the community health center, where Ani spent $5 on doctor’s fees, withdrawn from the savings she keeps in her piggybank.
Sources and Uses of Ani's Household Income In West Java, Indonesia:
52
10
7
46
21
20
12
6
6
5
5
2
104
52
31
5
Husband: 36%
Ani: 64%
Husband: 81%
Ani: 19%
Taxi Income
Ag Produce Sales Income
Gift
Piggy Bank Savings Funeral Gift
Savings To Piggy Bank
School Fees
Deposit Into Savings Groups
Savings At Children’s School
Children’s Pocket Money
Entertainment
Medical Expenses
Food
Transport
Cigarettes
52 Motorcycle Care
Inflows In Last 2 Weeks (US$) Outflows In Last 2 Weeks (US$)

Women Contribute to Household IncomeAlthough men tend to be the primary household breadwinners, women still play an important role in generating supplementary household income and personally receiving remittances, which tend to remain under their control. In the countries we studied, women across Kenya, Pakistan, Papua New Guinea, and Tanzania show a consistent pattern of contributing to household income, although in different countries they contribute different amounts. In Pakistan, women tend to contribute only about 15% of household income, while in Papua New Guinea, women report earnings that are higher, on average, than men.
"My husband gives me his money and then we manage it togeth-er. I give him the money he… needs and the rest is for me, for every household expense. I manage it. Just like that."
- Rural woman in Indonesia
“I also give my salary to my wife. She will arrange it, including family savings, so I can use it if something urgent happened.”
- Man in East Java, Indonesia
“Women have an important role in money management. They can manage all home expenses and also do saving very effectively compared to men because females dont spend money on unnec-essary things like men, who are used to going out to meet friends, spending money on cigarettes and these types of things.”
- Male NGO employee in Pakistan commenting as an informed observer
Figure 2: Contribution to Household IncomeRespondents who report contributing income of any kind, including receiving remittances (%)
Across markets
75%
87%
Pakistan
59%
87%
Papua New Guinea
89% 86%
Tanzania
68%
81%
Kenya
85% 92% Women
Men

Not surprisingly, men and women tend to receive income from different types of sources. Regarding earned income, women often rely on small businesses, such as selling goods, sewing or making beer. Men, by contrast, tend to earn income from regular employment, casual jobs or selling agricultural produce. Only 12% of women surveyed held regular jobs, compared to 30% of men. Earning income from small businesses, unlike salaried jobs in the formal economy, leads to erratic and unforeseeable income streams, generally in cash, putting greater pressure on women to be active financial managers.6 While there are similarities across markets – for example, women in most markets are more likely to receive remittances than men – there also are differences. For example, women in both Kenya and Tanzania tend to run small businesses, but Kenyan women are much more reliant on remittances to supplement small business income, while Tanzanian women are more actively engaged in selling agricultural produce. The cash flow cycles of each activity are likely to be very different in terms of their frequency, amounts and seasonality, and, therefore, the pattern of women’s demand for MFS may be different as well. To serve their markets more fully, MFS providers need to understand the frequency, types and volumes associated with these various income streams.
6 D. Collins, J. Morduch, S. Rutherford and O. Ruthven. Portfolios of the Poor: How the World’s Poor Live on $2 a Day. Princeton, New Jersey: Princeton University Press. 2009.
Figure 3: Income Sources for Men and WomenRespondents who report having received income from this source (%)
0 10 20 30 40 50 60 70
%
Assistance
Remittance
Agriculture
Self-Employed
Casual
Regular
Women Men
0 10 20 30 40 50 60 70
%
Assistance
Remittance
Agriculture
Self-Employed
Casual
Regular
Kenya
Pakistan
0 10 20 30 40 50 60 70
%
Assistance
Remittance
Agriculture
Self-Employed
Casual
Regular
0 10 20 30 40 50 60 70
%
Assistance
Remittance
Agriculture
Self-Employed
Casual
Regular
Tanzania
Papua New Guinea
Note: Income sources not mutually exclusive. ‘Assistance’ includes rent and pension.
Note: Income sources not mutually exclusive. ‘Assistance’ includes rent and pension.

In Papua New Guinea, women are twice as likely to be self-employed than men and contribute income from traditionally female activities, such as informal sales of baked goods or betel nuts. Across the markets, different factors lead women to contribute to household income:
� Need to supplement husbands’ insufficient incomes. “You both have to struggle. If you are a wife, you have to look for a way to help your husband earn money instead of just sitting at home waiting for his income which is not enough.” – Woman in rural Kenya
� Need to have funds available for daily household priorities. “Children freely express their needs more readily to their mother, so women save in a cash box for them.” – Woman in Tanzania
� Need to save for emergencies. “Sometimes my husband only knows about water, electricity and rent bills… he doesn’t count for the unexpected expenses, like when our kids got sick. We don’t know when it could happen. If we ask for extra money, they [husbands] frown.” – Woman in Jakarta, Indonesia
� Desire for empowerment.
Remittances and Government-to-People Payments Are Important Payment Streams for WomenIn developing countries, it’s common for family members to find work and temporary housing in another city, while sending income to their families back home via remittances. Remittances are thus a key person-to-person transaction for women. In the study, 31% of women, in contrast to 26% of men, receive remittances from siblings, parents, children, and spouses. Because they’re managing the household and caring for children or other dependents, women generally have a great deal of responsibility and control over managing remitted funds. For example, in one study of remittance behavior in India, recipients of funds sent from New Delhi and Mumbai tended to be rural women receiving money from their male relatives in the city.7 The study found that the bulk of financial management rested with the female remittance receivers, who needed to plan ahead to manage household expenses between remittance payments. They were responsible for managing all family needs, including major lump expenses such as agricultural inputs, school fees, emergency medical expenses, and major life cycle events like weddings and funerals.
7 Source: Bankable Frontier Associates. Understanding the Financial Management Patterns Along Domestic Urban-Rural Remittance Corridors: Brief undertaken for ICICI Bank as part of the GAFIS project. 2011.
8 Ibid.
Figure 4: Indian Remittance Senders' and Receivers' Lump Expense Requirements8
% who made payment type in past year
78%
29%
Fertilizer
9%
Education
97%
10%
63%
3%
53%
Life events Medical treatment
Remittance Senders Remittance Receivers
Although few women in the study markets received other common money transfers such as G2P or non-governmental organization (NGO) payments, in many emerging markets women are the primary recipients for a growing volume of conditional cash transfers and other forms of G2P transfers. Some 170 million poor people receive G2P payments, and 45% of G2P programs launched in the past decade use electronic payment mechanisms.9 These transfers will increase in number and frequency as governments from India to Nigeria look to electronic payments to reduce transaction costs and increase security of the payments. Electronic payments are anticipated to enhance value to recipients. For example, Colombia’s Familias en Accion conditional cash transfer program switched from cash to an electronic system, saving beneficiaries about five hours in waiting time to receive payments.10
The Role and Limitations of Existing Financial Services in the Lives of Women
Existing financial services play an important role for women in emerging markets – but they don’t always fully meet their wants and needs. Significant challenges exist for effectively utilizing formal financial services, including time constraints due to location and confusion about fees and penalties. As a result, women frequently utilize informal financial services, including in-person payments, keeping money in the home, savings clubs, use of credit, and informal lending networks. These informal services are not without their own challenges, including a lack of security, reliability and privacy.
In Resource-Poor11 Rural Settings, Women Are the Ultimate Multitaskers Financial manager is one of many roles women play in the household. Globally, women are responsible for 60-80% of work related to tending to the home and caring for the household’s children, sick and elderly.12 Women tend to play roles inside and outside the home and to face more claims on their time than men. Studies have found that women in sub-Saharan Africa, for example, spend most of their time cooking and caring for children; in some cases, simply collecting water and fuel for the home can take hours.13 In rural settings, buses are few and far between and even bicycles are luxuries, so simply paying bills or school fees can cost hours out of an already busy day. Adding to this pressure, in many conservative settings women are limited in their ability to run errands outside the home on their own. Working women face a double burden, as these household responsibilities persist despite their need to contribute income.
These pressures make women’s day-to-day financial management responsibilities in developing markets a complex challenge. Responsible for children’s day-to-day needs, they need access to petty cash. Women generally are responsible for ensuring the family can sustain economic shocks such as illness or failed crops. They must adopt sophisticated cash flow management techniques; allocate their funds carefully; and find safe, reliable means of saving cash, often despite lack of financial management choices. As a result of these competing requirements, women face enhanced pressure to be prepared and therefore tend to be risk-averse in terms of trying new tools, such as mobile money.
9 M. Pickens, D. Porteous, S. Rotman. Banking the poor via G2P payments. CGAP White Paper. 2009.10 L.R. Tejerina, L.R., J.H. Maldonado. Investing in Large Scale Financial Inclusion: The Case of Colombia (Technical Notes). Inter-American Development Bank. 2010.11 "Resource-poor" is a term coined by the GSMA mWomen Programme as a means of focusing its effort to increase women’s access to and use of mobile phones. The programme defines resource-poor women to be those experiencing low income, low level of empowerment, limited access to education, and/or social isolation due to limited mobility or remote locations.12 The World Bank. Chapter 2. The World Development Report 2012: Gender Equality and Development. 201213 Kes Aslihan and Hema Swaminathan. Gender and Time Poverty in Sub-Saharan Africa, in C.M. Blackden and Q. Wodon, editors. Gender, Time Use, and Poverty in Sub-Saharan Africa. World Bank Working Paper No.73. 2006.

Existing Financial Management Tools Don't Fully Meet their Wants and Needs Women use a variety of informal tools that meet their existing needs to varying degrees:
� In-person payments: Includes walking or taking transportation to pay bills, deliver or pick up remittances, etc.
� Savings in the home: Includes any cash kept at home, often stashed in several hiding places.
� Money guard: Women sometimes ask friends or family to hold cash for a certain period of time. They often do this to keep an accumulated lump sum safe, and they worry that, if they hold the money, they will end up spending it or that someone in their household might take it.
� Savings club: There are two main types: Rotating Savings and Credit Associations (RoSCAs) and Accumulating Savings and Credit Associations (ASCAs). RoSCAs are groups in which members generally all contribute the same amount, and one member each cycle takes the collected cash. ASCAs build savings over time, sometimes lending to members or outsiders; at an agreed point, usually within a year, the funds are redistributed to members.
� Credit at the local store: Local shopkeepers often allow individuals or families to take goods now and pay later.
� Hawala networks: Mostly found in South Asian markets, these informal networks of money agents facilitate person-to-person transfers, such as overseas remittances. The remittance sender gives a sum of money to an agent in one location, who communicates to another agent in the network to pay out the sum less fees to the remittance receiver in a location nearest to her home. In some settings, women don’t even need to leave their homes to receive payments.
The financial tools used for sending money, making payments and saving vary across markets. For example, in Kenya and Tanzania, around 80% of remittance senders report using MFS as their standard means of sending money, whereas in Papua New Guinea, around 80% of remittance senders rely on personally delivering money to the receiver or to the receiver’s bank. Within markets, women and men often use fairly similar financial management tools for sending money and making payments. For example, 76% of men and 80% of women remittance senders in Tanzania report using MFS, while both men and women use other methods in Papua New Guinea. Electricity payments across these two markets show the converse: both men and women in Papua New Guinea often use MFS to buy electricity, while both men and women buy electricity in person in Tanzania.
In contrast, when it comes to tools for saving or storing money, men and women tend to have different habits. For example, globally, 55% of men report having an account at a formal financial institution, while only 47% of women do.14 In our study mar-kets, women reported using informal saving tools more than men, such as hiding money in the home and savings groups. While various forms of savings clubs were well-reported in both the quantitative and qualitative data in Kenya and Pakistan, they were not acknowledged as common savings tools in Papua New Guinea.
An interesting comparison is highlighted in Figure 6. Respondents in Kenya and Tanzania, where use of mobile money for storing money is more common than in Papua New Guinea or Pakistan, reported less hiding money in the home, suggesting that MFS may be replacing hiding money in the home for short-term saving of small amounts of money. Likewise, 61% of Pakistani women respondents report hiding money at home, in contrast to the 22% of women in Tanzania, where 18% of women report us-ing mobile money. When MFS providers consider informal competition for small money storage, this data suggests that savings in the home may be the most appropriate “competition” to consider.
14 Asli Demirguc-Kunt and Leora Klapper. Measuring Financial Inclusion: The Global Findex Database World Bank Policy Research Working Paper. April 2012.

Figure 5: Methods for Making Payments in Tanzania and Papua New Guinea% who use each method the most
Figure 6: Tools Used to Save and Store MoneyRespondents who report using each tool (%)
0
10
20
30
40
50
60
70
80
90
100
Men Women
%
Mobile Money or Mobile Banking In-Person Deposit Into Receiver’s Account In-Person or With A Friend Other
Tanzania Papua New Guinea
0
10
20
30
40
50
60
70
80
90
100 %
Mobile Money or Mobile Banking In-Person Visit To Office, Shop, Post Office, or Agent Other
Sending Remittances Electricity Bill Payments
Tanzania Papua New Guinea
Men Women Men Women Men Women
Kenya Tanzania Pakistan Papua New Guinea
Other 3%
7%
Savings club 18%
13%
Bank account 20%
33%
Hiding place at home 25%
22%
Mobile money 26%
32%
Women Men
2%
5%
7%
1%
18%
19%
22%
25%
13%
11% 12%
19%
8%
6%
15%
12%
61%
57%
6%
6%
39%
31%
NA
NA
40%
48%
22%
20%
4%
2%
Note: “Other” includes microfinance institutions, savings and loan cooperatives, money guards

MFS providers should include both formal and informal financial tools in their competitive analyses, since those that are deeply entrenched may create a barrier to customers’ adoption of mobile financial services. Although these informal tools may suit a number of users’ needs, certain deficiencies in informal tools emerge consistently across markets:
� In-person remittances and bill payments can be unsafe. In many settings, women face serious threats to themselves and their money while travelling outside the home, as they can be targets for thieves on busy public transports or isolated roads. Only 56% of Tanzanian women and 57% of Kenyan women who use in-person remittance methods consider them to be “secure,” while far more - 85% of Tanzanian women and 95% of Kenyan women - considered MFS remittances to be secure.
� In-person payments can be inconvenient. Women commonly make payments in person. For example, 84% of Tanzanian and 67% of Kenyan women respondents who pay electricity bills do so by walking or paying for transport to reach a utility counter, at times waiting an average of thirty minutes in a queue to make a single payment. Even low-income women are willing to pay a premium to reduce this time burden, which keeps them from their daily chores or businesses. For example, one rural Indonesian woman explained her willingness to pay a collection agent to handle her electricity bill: “Comparing if we go there, we leave our jobs, then we queue, our transport, it’s better we give it to the officer.”
� Saving cash in the home can be insecure. Cash saved in the home can rot, blow away, be stolen, or, in living conditions with little or no privacy, be claimed by family members.15 Researchers in Uganda found that 68% of home savers surveyed had lost funds as a result of theft, friends’ and relatives’ demands, and their own petty expenditures.16 Although women often appreciate the convenience of easily accessible money in the home, some find it too convenient. Savers often can’t resist dipping into savings. In Pakistan, despite over 60% of women saving in the home, only 67% of these women consider it secure.
� Savings groups can be inconvenient and lack reliability, security and privacy. Savings groups have been highly effective for many women, helping them to structure their savings. For example, one woman in Pakistan with a monthly household income of US$293 reported gathering over $4,000 from four savings clubs to help pay for her sister’s wedding. However, cash from savings groups is not liquid and, hence, doesn’t help with cash on hand when emergencies arise. And the entire community knows when a woman has just received a large pot of cash, often triggering requests and even theft. In a study of South African households, 6% of savings group users lost an average of US$346 in a 10-year period.17
15 S. Rutherford. The Poor and their Money: An Essay about Financial Services for Poor People. University of Manchester: Institute for Development Policy and Management. 1999.16 G. Wright and L. Mutesasira. The Relative Risks to the Savings of Poor People. Nairobi, Kenya: MicroSave. 2001.
17 D. Collins. Portfolio Balancing: Rethinking our Assumptions about the Benefits and Costs of Financial Products for the Poor. CGAP presentation. 2010.
“I feel anxious, because I carry a lot of money.”
“You [barely] gather it. If something happens along the way, there’s no replacing that money.”
– Woman in rural Indonesia
“I keep my money at home but the money doesn’t stay long since there are lots of things to buy. Impulse is my biggest problem with saving at home.”
– Female mobile money user in rural Tanzania
“Some husbands are thieves.”
– Woman in Dar es Salam, Tanzania
“Even some children who are thieves can steal the money.”
– Woman in Tanzania
“In a ROSCA, you can only win once in a cycle, then after that you must wait a bit long until the next ROSCA starts.”
– Woman in Jakarta, Indonesia
“It is difficult to save money alone but in merry go round you can’t withdraw anytime you want.”
– Woman in rural Kenya
“It … depends on the person who keeps the committee [group]. If the person is reliable, the committee is, otherwise, no.”
– Woman in Pakistan
“Once I burned my mother’s money because she put it among the sugar-canes, not knowing that the sugarcanes had some dry leaves.”
– Man in Papua New Guinea

Figure 7: Perceived Reliability and Security of Savings Groups% of women who believe this method is ‘reliable and secure’
� Payment agents can be insecure. Agents who visit homes to collect and distribute payments can offer great convenience by reducing the time women spend travelling to make payments themselves. For example, some women in rural Indonesia choose to pay US$0.21 to 0.31 for the convenience of a door-to-door agent service, rather than leaving their shops and paying US$0.73 for a long journey to the National Electric Company or post office. However, women have expressed security concerns, having experienced fraudulent payment agents. MFS providers need to bear these concerns in mind when developing their distribution networks; women need reassurance that they can trust their local agents.
� Banks can be inconvenient, expensive and intimidating. Banks offer a great variety of instruments and security, including long-term savings tools that MFS rarely offer. In many cases, they do meet women’s need for safe savings. In Tanzania, 86% of women who use banks for savings find them to be reliable and secure.
However, particularly in rural areas, branches are few and far between, presenting a particular challenge given women’s time management and mobility issues. Also in Tanzania, only 74% of surveyed women bank users find them to be convenient – which of course doesn’t account for those who don’t use banks due to distance. Know Your Customer (KYC) requirements mandate identification cards and documents that many women in resource-poor settings can struggle to obtain. Some women in this study also expressed confusion associated with fee structures, which are often not transparent or fully understood. The World Bank’s Global Findex Database of 148 countries offers the following reasons why women and men globally choose not to use banks.18 The top reasons – too expensive and a perception of not having enough money – reveal a common perception in developing markets that banks are only for the wealthy or for saving large sums of money rather than the smaller amounts they might accumulate.
Pakistan
62%
Papua New Guinea
64%
Tanzania
63%
Kenya
85%
Note: In Pakistan, two separate questions were asked for whether “reliable” (60%) or “secure” (64%); average taken (62%).
18 Asli Demirguc-Kunt and Leora Klapper. Measuring Financial Inclusion: The Global Findex Database World Bank Policy Research Working Paper. April 2012.

Figure 8: Self-reported Barriers to Use of Formal AccountsNon-account holders who report a barrier as a reason for not having an account (%)
The Role of Mobile Financial Services in Delivering What Women Want and Need
Examining the financial lives of women in emerging markets, their wants and needs become clear: convenience, reliability, security, and privacy. MFS can play a meaningful role in addressing these needs, providing convenience while also ensuring safety and dependable financial services.
Women Want and Need Convenience, Reliability, Security, and Privacy Women have specific wants and needs for financial services, and they will use and value MFS that meet these needs. Men often share these values but they are more pronounced for women given their tremendous responsibility in the household. Failure to demonstrate the ability to meet these wants and needs may be enough to prevent a woman from trying a new tool such as MFS. Women can’t afford to take risks with so much responsibility resting on their shoulders.
‘‘[I keep enough money] for a month [worth’s of saving] at home. It’s just too tiring, to go back and forth to the ATM.”
– Woman in rural Indonesia
“But I have no deposit, when my children need school fee I withdraw the money, it is only IDR 100,000 left as minimum sum. If we withdraw it all, we can’t receive any transfer.”
– Woman in rural Indonesia
‘’If it’s a huge amount of money I put it in the bank, but smaller amounts I usually use for business circulation so it’s not for saving.”
– Woman in urban Kenya
Restricted - Confidential Information © GSMA 2011
Note: Respondents could choose more than one reason. The data for ‘not enough money’ refer to the percentage of adults who reported only this reason.
5
13
18
20
23
25
30 Not Enough Money
Too Expensive
Family Member Already Has An Account
Too Far Away
Lack of Required Documents
Lack of Trust
Religious Reasons
Note: Respondents could choose more than one reason. The data for ‘not enough money’ refer to the percentage of adults who reported only this reason.Source: Asli Demirguc-Kunt and Leora Klapper. Measuring Financial Inclusion: The Global Findex Database World Bank Policy Research Paper. April. 2012.

Women in this study value four key attributes in financial tools and services:
Across markets and consumer segments, MFS offer convenience, security and affordability. From its inception, mobile money offered a fast, secure way to send money across great distances using the increasingly ubiquitous tool of the mobile phone.19
Where it’s used, customers often report great satisfaction with the tool. For example, a 2009 competitive analysis in Tanzania found that, given the travel and queuing time required by alternative methods, users valued M-PESA for its convenience and affordability.20 Qualitative research in 2011 found that vulnerable Haitians valued the privacy and security of mobile money.21
Another study of 21 women’s groups in rural Kenya22 found that women described the service as convenient, safe, accessible, efficient, and affordable, and particularly valued that the service created opportunities for employment: “On the side of purchasing goods, it’s like we have been freed from traveling by vehicles. We just send the money and the goods are delivered to us … you have paid for everything including transport.”
Participants in this study report similar experiences. In Tanzania, women using MFS to send remittances consider it more reliable and secure than do women who rely on in-person methods, though perceptions of privacy appear equal between the two groups. In Kenya, however, the differences are clear: women using MFS to send remittances are far more satisfied than those women using in-person methods in terms of reliability, security and privacy.
19 Nick Hughes and Susie Lonie. M-PESA: Mobile Money for the "Unbanked" Turning Cellphones into 24-Hour Tellers in Kenya. MIT Press Journals: Innovations. Winter/Spring 2007. Beth Jenkins. Developing Mobile Money Ecosystems. International Finance Corporation and Harvard Kennedy School. 2008.20 Gunnar Camner and Emil Sjoblom. Sending Money in Tanzania: Overview of Available Alternatives in 2009. Cited in Neil Davidson and M. Yasmina McCarty. Driving Customer Usage of Mobile Money for the Unbanked. GSMA Mobile Money for the Unbanked. 2012.21 Mercy Corps. Diary of a Mobile Money Program e-Book Two: Beneficiary Financial Diaries - In Their Own Words. 2011.22 Ndunge Kiiti and Jane Mutinda. Mobile Money Services and Poverty Reduction: A Study of Women’s Groups in Rural Eastern Kenya. Institute for Money, Technology and Financial Inclusion. Working Paper 2011-2.
Convenience Given women’s time management challenges, they want financial tools that fit with their daily routines and take as little time as possible.
‘It takes too long of my time, and the line is also too long.’ – Woman in Indonesia who pays her water bill in person with cash
Women need reassurance that their tools will deliver their small, high-frequency transactions and provide easy access to cash and savings for emergencies, day or night.
‘I keep some money in a piggy bank because maybe if I have a problem late at night I cannot go to the bank and also if I go to [the mobile money agent] I find it closed so I take money out of the piggy bank
and use the money.’ – Woman in Nairobi, Kenya Hard-earned income is precious. Women need to manage their finances without risking harm to their household wealth, their families and themselves.
‘I feel anxious because I carry a lot of money.’ – Woman in rural Indonesia
Women feel empowered and independent if they have the freedom to spend their money as they like, without undue demands from family and friends.
‘I can hide my money but he still finds, so I have to hide it very far so he can’t know where it is.’ – Kenyan woman describing her husband
Reliability
Security
Privacy

Figure 9: Women's Perceptions of MFS versus In-person Methods for Sending RemittancesRemittance senders who agree with statement about their current method (%)
Use of mobile for bill payments is infrequent, but those who use it value its convenience. In Kenya, women who use M-PESA for electricity payments appreciate that it takes less than five minutes to make a transaction. Similarly, in Papua New Guinea, women value the convenience of being able to purchase electricity credits at night when agents are unavailable.
MFS may offer additional benefits for women users. Women report that instant payments to business partners and suppliers via mobile money can build trust and enable small-scale credit, which can otherwise be difficult for women who lack collateral or formal bank accounts. Likewise, shopkeepers who disburse regular remittance payments to a woman in the rural area will be more likely to provide credit, knowing they can count on the customer’s receipt of funds.
23 Beth Cobert, Brigit Helms and Doug Parker. Mobile Money: Getting to Scale in Emerging Markets. McKinsey & Company. 2012.
“Before these services, we faced lot of problems like paying bills in banks and standing in long queues for our turn in the hot weather, and transferring money takes three to four days. Now everything is quick, convenient and secure.”
– Woman mobile money user in Karachi, Pakistan
“I prefer to save on the phone because [my husband] can’t know [the amount] unless you give him the PIN.”
– Urban woman mobile money user in Kenya
“M-PESA is good; it saves time and no one will know how much money is in your phone.”
– Urban woman mobile money user in Kenya
“In the past, my daugh-ter and I sent money to each other through different relatives, so other members in her household knew what she sent me or what I sent to her, and they often didn’t like it. But now [mobile money] has made things easy.”
– Woman in Pakistan
Potential range of mobile financial services:23
� Bill pay
� Payroll direct deposit
� Business-to-business payments
� Domestic and international remittances
� Savings / storing money
� Credit
� Life insurance
� E-wallet (“me-to-me” current account)
� Welfare and other forms of G2P payments
� Pensions
Restricted - Confidential Information © GSMA 2011
Mobile Money
94% 95% 98%
In-Person
52% 57% 61%
Private Secure Reliable
Kenya Tanzania
In-Person
91%
72%
85%
Mobile Money
72%
56%
78%

Customer Pathway: The Journey to Adopting Mobile Financial Services
In many cases, women and men have the phones necessary to use available mobile financial services but, for some reason, do not. GSMA Mobile Money for the Unbanked’s (MMU’s) Customer Journey24 offers a helpful way to think about the pathway – and barriers – to adoption of mobile financial services.
Figure 10: GSMA Mobile Money for the Unbanked's Customer Journey
24 Adapted from GSMA Mobile Money for the Unbanked. Driving Customer Usage of Mobile Money for the Unbanked. 2012.
Unaware Under-standing Knowledge Trial Regular
use Awareness
Customer has never heard of mobile money
Customer has heard of mobile money and knows what it is
Customer understands how mobile money could be useful to her
Customer knows the steps necessary to transact
Customer tries the service
Customer habitually uses the mobile money service
Given the various stages of market maturity, respondents in the study’s four countries each have different distributions across the customer journey.
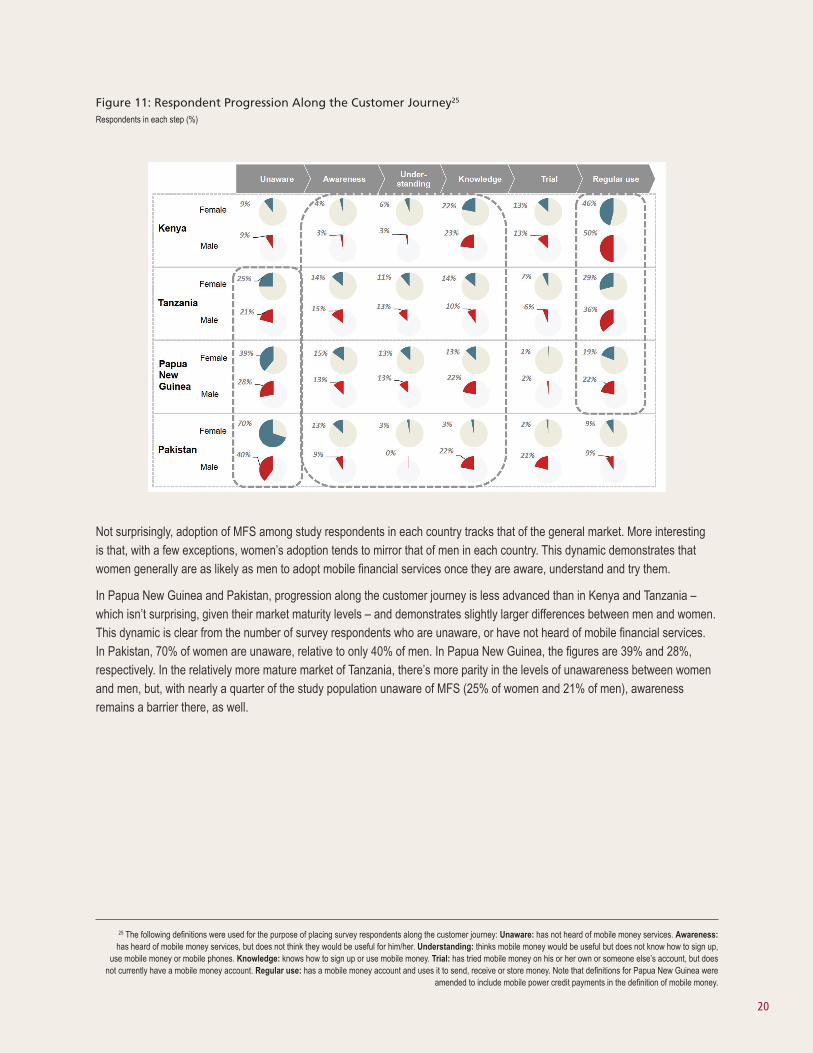
Figure 11: Respondent Progression Along the Customer Journey25
Respondents in each step (%)
Not surprisingly, adoption of MFS among study respondents in each country tracks that of the general market. More interesting is that, with a few exceptions, women’s adoption tends to mirror that of men in each country. This dynamic demonstrates that women generally are as likely as men to adopt mobile financial services once they are aware, understand and try them.
In Papua New Guinea and Pakistan, progression along the customer journey is less advanced than in Kenya and Tanzania – which isn’t surprising, given their market maturity levels – and demonstrates slightly larger differences between men and women. This dynamic is clear from the number of survey respondents who are unaware, or have not heard of mobile financial services. In Pakistan, 70% of women are unaware, relative to only 40% of men. In Papua New Guinea, the figures are 39% and 28%, respectively. In the relatively more mature market of Tanzania, there’s more parity in the levels of unawareness between women and men, but, with nearly a quarter of the study population unaware of MFS (25% of women and 21% of men), awareness remains a barrier there, as well.
25 The following definitions were used for the purpose of placing survey respondents along the customer journey: Unaware: has not heard of mobile money services. Awareness: has heard of mobile money services, but does not think they would be useful for him/her. Understanding: thinks mobile money would be useful but does not know how to sign up,
use mobile money or mobile phones. Knowledge: knows how to sign up or use mobile money. Trial: has tried mobile money on his or her own or someone else’s account, but does not currently have a mobile money account. Regular use: has a mobile money account and uses it to send, receive or store money. Note that definitions for Papua New Guinea were
amended to include mobile power credit payments in the definition of mobile money.

How Mobile Financial Services Providers Can Promote Faster Adoption
Encouraging faster adoption of MFS is mutually beneficial, both for the women who will have greater access to the financial mainstream and also for providers who are looking to grow their business. Women represent a significant untapped market and through various tactics (from financial education to trial use, streamlined registration to better marketing of agents), MFS providers can better reach women and expand access to their products.
Additionally, reaching women can help expand access for all. While MFS appear to offer clear value to women in their roles as household financial managers, outside of Kenya, Tanzania and several other active markets, adoption has been slow for both men and women. While the barriers to adoption will vary by market, women in a given market tend to experience similar challenges to men in a more acute way, meaning a focused effort on women can improve male adoption as well.
The following are recommended steps for promoting faster adoption of MFS among women in emerging markets:
Increase Mobile Access for Women
� Women do not always have the mobile phone access they need to adopt MFS. The study found that 34% of women in Tanzania, 13% of women in Kenya and 10% of women in Papua New Guinea who would like to try mobile financial services cite the lack of a phone as the main reason for not having done so.26 Women in low- and middle-income countries are 21% less likely to own phones than men.27 In many instances, male household members register their wives’, mothers’ and sisters’ SIM cards in their own names; they also are the first to buy a phone and may even influence whether a woman uses a phone. As a result, many MFS providers have failed to see women as a viable customer base.
� MFS providers have the potential to play a significant role in addressing the mobile access gap. They offer the products, services, marketing, and distribution necessary to reach women. The GSMA mWomen Programme, which supports operators seeking to serve women, has identified the key barriers to women’s ownership and use of phones, including the cost of handsets and airtime, cultural barriers related to women’s roles in the household and community, lack of familiarity and comfort with technology, and lack of appreciation for the potential value of mobile phones.
� MFS offer a useful tool for women’s economic and social development. If a woman tries MFS and finds they meet her financial management needs with greater convenience, reliability, security and privacy than current tools, she, and perhaps the men in her life who depend on her financial skills, will appreciate the value of the both the MFS and the phone itself. By offering mobile financial services that meet women’s wants and needs, MFS providers can both build scale and volume for their mobile financial service businesses and increase their female subscriber bases, thereby closing the mobile access gap.
Conduct Marketing Research Focused on Potential Women Customers
� Improve understanding of the specific needs of women as they relate to MFS. In most markets, MFS providers have the scope to improve awareness and understanding among both potential male and female customers. However, to benefit from the stability and scale of active women customers, providers need to research how women in their markets learn and absorb information and tailor their communications accordingly. At the same time, marketing and education campaigns that appeal to women’s wants and needs for convenience, reliability, security, and privacy will likely resonate with both women and men.
26 Data for Pakistan isn’t available, as only 1% of women in Pakistan who have not tried MFS wish to, hence data on mobile phones as a barrier was not meaningful.27 GSMA and the Cherie Blair Foundation for Women. Women & Mobile: A Global Opportunity. 2010.
Increase Awareness and Understanding of Mobile Financial Services
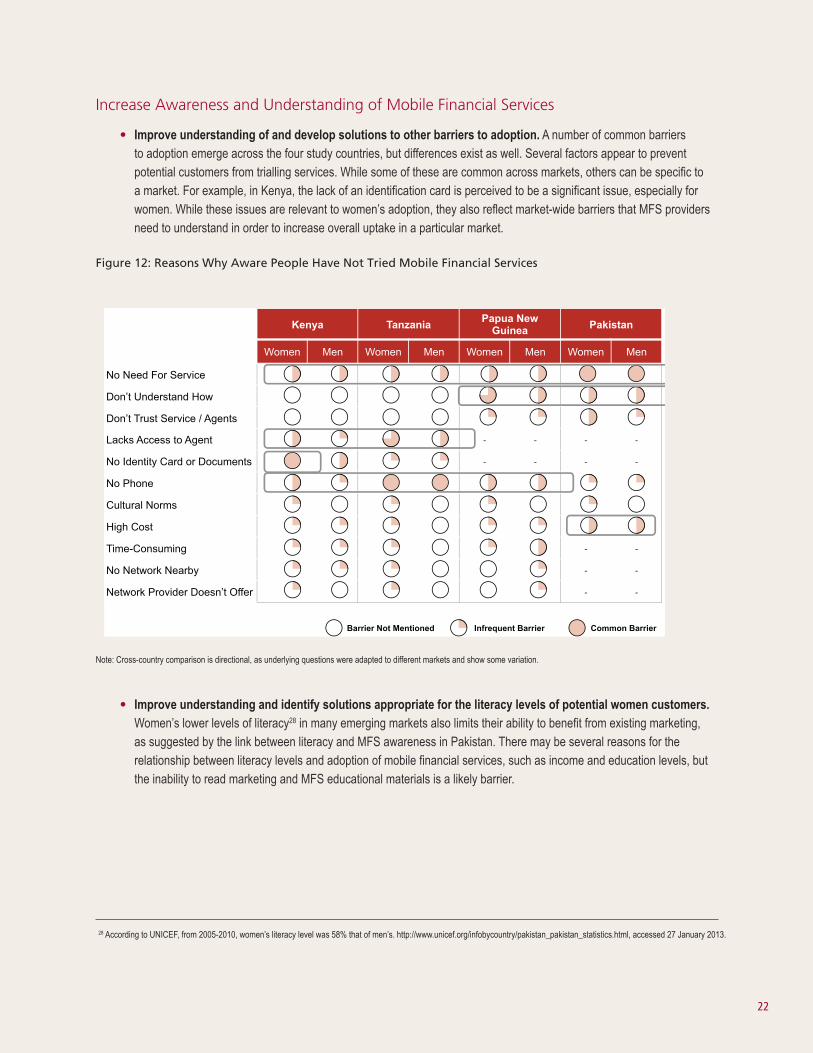
� Improve understanding of and develop solutions to other barriers to adoption. A number of common barriers to adoption emerge across the four study countries, but differences exist as well. Several factors appear to prevent potential customers from trialling services. While some of these are common across markets, others can be specific to a market. For example, in Kenya, the lack of an identification card is perceived to be a significant issue, especially for women. While these issues are relevant to women’s adoption, they also reflect market-wide barriers that MFS providers need to understand in order to increase overall uptake in a particular market.
Figure 12: Reasons Why Aware People Have Not Tried Mobile Financial Services
28 According to UNICEF, from 2005-2010, women’s literacy level was 58% that of men’s. http://www.unicef.org/infobycountry/pakistan_pakistan_statistics.html, accessed 27 January 2013.
Note: Cross-country comparison is directional, as underlying questions were adapted to different markets and show some variation.
Kenya Tanzania Papua New Guinea Pakistan
Women Men Women Men Women Men Women Men
No Need For Service
Don’t Understand How
Don’t Trust Service / Agents
Lacks Access to Agent - - - -
No Identity Card or Documents - - - -
No Phone
Cultural Norms
High Cost
Time-Consuming - -
No Network Nearby - -
Network Provider Doesn’t Offer - -
Infrequent Barrier Common Barrier Barrier Not Mentioned
� Improve understanding and identify solutions appropriate for the literacy levels of potential women customers. Women’s lower levels of literacy28 in many emerging markets also limits their ability to benefit from existing marketing, as suggested by the link between literacy and MFS awareness in Pakistan. There may be several reasons for the relationship between literacy levels and adoption of mobile financial services, such as income and education levels, but the inability to read marketing and MFS educational materials is a likely barrier.

Figure 13: Link between Literacy and MFS Awareness in Pakistan% of women respondents
� Communicate the benefits of MFS over existing services. In any market, existing financial tools may inhibit adoption of MFS for certain types of transactions. But, in other cases, the perceived mismatch between need and service offering may be unfounded. In the Pakistan example, 48% of women cited that having “no money to save or send” was their main reason for not opening a mobile money account, but 66% of them have paid bills, saved money informally or formally, or sent remittances in the last 12 months. It should be emphasized that MFS are suited for small, frequent transactions and money storage.
In many cases, MFS offer a wider range of services beyond person-to-person transfers. For example, while Safaricom’s M-PESA in Kenya has long been understood as a tool for sending money, other features offer a broader range of uses. MFS providers often keep marketing messages simple by focusing on a key service, but there may be an opportunity to broaden the message.
There’s a clear need for MFS providers to better equip their agents to support these messages and to build marketing and education messages to clearly articulate to women that available, easy-to-use services are directly relevant to their needs. Well-trained agents should be able to serve both women and men’s needs for education and reassurance at the point of sale, reinforcing the messages and realities around convenience, reliability, security, and privacy.
� Select effective and tailored communications channels and content. Existing marketing approaches clearly reach some women but leave many others behind – primarily because most above-the-line campaigns tend to be tailored to men. In any effort to increase awareness and understanding, communications channels and content selection matter. In many countries, the double burden of paid and unpaid household work leads women to consume less news than men.29 In a 2008 study, Pakistani men and women were found to watch similar levels of television but to consume very different levels of other media, underscoring the point that it pays to include gender when segmenting and targeting the MFS customer base. Beyond channel selection, women have different consumption patterns for the channels they share with men. Despite similar levels of television usage in many countries, women and men have different habits and preferences, such as timing and programming choices, and they respond to different messages within these media channels.30
29 Christine Benesch. An Empirical Analysis of the Gender Gap in News Consumption. Swiss Institute for International Economics and Applied Economic Research. 2012.30 Millward Brown. Knowledge Point: Do Men and Women Respond Differently to Ads? 2011.
Aware of Mobile Money
10%
16%
74%
Unaware of Mobile Money
31%
24%
45% Cannot Read At All Able To Read but Not Understand Able To Read and Understand

Figure 14: Media Usage in PakistanRespondents who used in the last week (or in last month for Internet), %
� Invest in below-the-line marketing. Below-the-line marketing is critical in the MFS market. Mobile operators and other providers could benefit from strengthening how they educate all potential MFS users through these channels. On the whole, customers require 10 to 15 minutes of in-person engagement with an agent in order to feel comfortable using MFS.31 Yet because women in these markets have less experience with this technology and mobile phones,32 and given their need for reassurance about the reliability, security and privacy of financial services, women require a higher level of engagement to try novel ways of managing their hard-won financial resources. This dynamic is more pronounced for women than for men, as they may need a greater degree of point-of-sale communication to feel comfortable with the new tool. Effective training of MFS agents is critical, as women’s loyalty to a service provider is dependent on face-to-face service quality and relationship.33
It’s important to note that, in some markets, women’s social roles in the household and community can limit the effectiveness of existing word-of-mouth or other below-the-line marketing efforts. Women in more traditional cultures tend to gain word-of-mouth information from other women in their communities and may be dependent on their male family members for information, as they often face limits on interactions with men outside the family. In Pakistan, only 67% of women living with husbands are unaware of MFS, whereas 97% of those living without a husband or male family member are unaware. An understanding of the influences on potential women customers will enable MFS providers to tailor below-the-line approaches to reach this potentially underserved segment.
31 Beth Cobert, Brigit Helms and Doug Parker. Mobile Money: Getting to Scale in Emerging Markets. McKinsey & Company. 2012.32 GSMA and the Cherie Blair Foundation for Women. Women & Mobile: A Global Opportunity. 2010. GSMA mWomen. Striving and Surviving: Exploring the Lives of BOP Women. 2012.
33 Valentyna Melnyk, Stijn M.J. van Osselaer and Tammo H.A. Bijmolt. Are Women More Loyal Customers Than Men? Gender Differences in Loyalty to Firms and Individual Service Providers. AMA Journal of Marketing. 2009.
Restricted - Confidential Information © GSMA 2011
Newspaper
13%
42%
Radio
21%
37%
Television
76% 79%
Internet
7% 1%
Women Men
Note: Based on survey of 4020 adults 15 years or older. Source: BBC Pakistan 2008 survey of adults, as referenced within the Financial Inclusion Tracker Surveys Project, available via: http://www.audiencescapes.org/country-profiles-pakistan-communication-habits-demographic-groups-gender-media-divide-women-men-habits-access-use, accessed 28 January, 2013.

� Demonstrate the ease of using MFS. Both men and women identified lack of knowledge about the service or how to use it as key barriers, believing that it’s too complicated. This barrier may be particularly acute for women. For example, in Papua New Guinea, 47% of women and 35% of men who want an MFS account identified lack of understanding of how to use it as their chief reason for not opening an account.
This gap suggests an opportunity to improve education across an operator’s MFS network, generally through investments in agent capacity-building. Well-trained agents are better equipped to reduce potential customers’ anxiety and overcome women’s risk aversion to try new tools. And if MFS providers invest in these opportunities for women, the data suggests than many potential male customers’ fears also may be addressed.
� Demonstrate the security of MFS. Data on trust issues were mixed. While few people who want MFS cited lack of trust as a reason not to try the service, respondents still indicated concerns about safety. Comparing potential female customers considering MFS to be safe, Kenya had the highest level at 77%, while 57% in Pakistan and just 45% in Papua New Guinea thought the service to be safe. In Pakistan, 19% of women and 10% of men who are not interested in opening an account agreed with the statement that it’s not safe to give money to MFS agents. Given women’s risk-aversion in regard to their hard-won household wealth, MFS providers need to understand the extent to which trust is an issue in their markets and address perceptions through communications; improvements to services; and agent selection, training and monitoring.
“Michelle” is a single mother in Tanzania who has a mobile phone and is interested in using Tigo Pesa or M-PESA. However, while she understands she could use this service to send money, she isn’t aware – or doesn’t know how to use – the other services on offer. She has not received education around the product and lives in a village where mobile service is limited and calls drop frequently, so she’s sceptical about trying MFS.
“Faith” is a widow in rural Kenya who has heard of M-PESA but doesn’t have an account. Her sister asked her to register for M-PESA so she can send Faith money. Although there is an agent in her village, Faith is reluctant to sign up, saying that she is scared and does not trust mobile money.
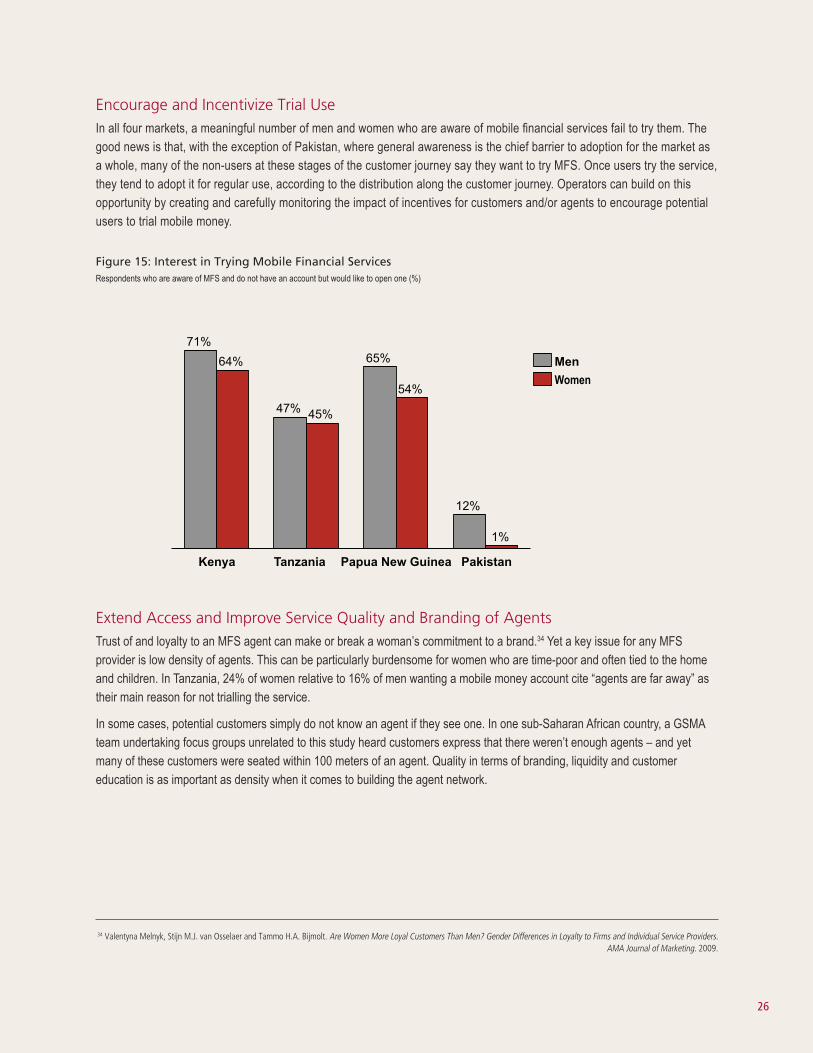
Encourage and Incentivize Trial Use In all four markets, a meaningful number of men and women who are aware of mobile financial services fail to try them. The good news is that, with the exception of Pakistan, where general awareness is the chief barrier to adoption for the market as a whole, many of the non-users at these stages of the customer journey say they want to try MFS. Once users try the service, they tend to adopt it for regular use, according to the distribution along the customer journey. Operators can build on this opportunity by creating and carefully monitoring the impact of incentives for customers and/or agents to encourage potential users to trial mobile money.
Figure 15: Interest in Trying Mobile Financial ServicesRespondents who are aware of MFS and do not have an account but would like to open one (%)
Extend Access and Improve Service Quality and Branding of Agents Trust of and loyalty to an MFS agent can make or break a woman’s commitment to a brand.34 Yet a key issue for any MFS provider is low density of agents. This can be particularly burdensome for women who are time-poor and often tied to the home and children. In Tanzania, 24% of women relative to 16% of men wanting a mobile money account cite “agents are far away” as their main reason for not trialling the service.
In some cases, potential customers simply do not know an agent if they see one. In one sub-Saharan African country, a GSMA team undertaking focus groups unrelated to this study heard customers express that there weren’t enough agents – and yet many of these customers were seated within 100 meters of an agent. Quality in terms of branding, liquidity and customer education is as important as density when it comes to building the agent network.
34 Valentyna Melnyk, Stijn M.J. van Osselaer and Tammo H.A. Bijmolt. Are Women More Loyal Customers Than Men? Gender Differences in Loyalty to Firms and Individual Service Providers. AMA Journal of Marketing. 2009.
Papua New Guinea
12%
Pakistan
1%
Kenya Tanzania
71% 64%
47% 45%
65%
54% Women Men

“Mobile money meets our needs, since it is easy to send and receive money, but the only problem is lack of agents.”
– Rural woman mobile money user in Tanzania
“Why spend US$0.19 in order to travel to receive US$6.30?”
– Rural woman in Tanzania
Streamline Registration In Kenya, identification cards are perceived to be a key barrier. In fact, 35% of Kenyan women interested in trying MFS cited a lack of identification or other documents as their main reason for not opening an account, in contrast to 18% of Kenyan men. Yet 87% of men and 85% of women surveyed actually own an identification card. Therefore, it is important to better promote what is needed for registration, not only to encourage higher demand but also to streamline the registration process for time-stressed women who are solely responsible for all household chores and a good share of household financial management.
While the identification card issue did not arise in the other study markets, it does highlight a key barrier for women and MFS, as women in many markets are less likely to have official identification or other documents that can, in some cases, be required for Know Your Customer (KYC) requirements. For example, in mid-2012, roughly 10 million Pakistani women lacked identification cards, including roughly 70% of Pashtun women from the Northwest of the country.35 In this context, registration requirements need to be proportionate to the risks associated with the financial services provided.
Increase Usage among Regular Users Across the four study countries, with the exception of men in Pakistan, most male and female customers who trial the service tend to become regular users. However, simple adoption isn’t the end of the journey; the next giant leap is to continuously increase value to customers as well as the service provider.
Most regular users tend to use MFS for a single type of use. Encouraging regular users to diversify into additional MFS is the critical – and yet not easy – step for providers. For example, in Kenya, only 5% of women who use MFS to send remittances also use the tool to pay bills, despite the fact that M-PESA has offered bill payment since 2008. And yet, in interviews, women cited additional functionalities that they would value, such as interest-bearing accounts, and the option to pay for online purchases, transport, rent, and medical bills.
In addition to increasing the availability or awareness of other services, providers can explore ways of making existing services more attractive and, hence, can increase usage. For example, some women in Kenya also reported concerns about the paper trail for mobile bill payments. One MFS-using woman reported that she prefers paying school fees in person, despite otherwise enjoying the benefits of MFS: “It is good to go to the school, pay, get the receipt, and be sure that you have paid, and the school knows you have paid.”
35 Pashtun Women Want ID Cards at Last. DeutscheWorld online, http://www.dw.de/pashtun-women-want-id-cards-at-last/a-16197016. Accessed 31 January 2013.

Deliver Convenience, Reliability, Security, and Privacy Consistently MFS providers cannot lose sight of what attracted women customers in the first place: women who are risk averse or otherwise slow to adopt may not stick with a service if their early experiences are disappointing or unreliable. Maintaining high service quality levels is as important as building them in the first place.
There is a potential virtuous circle between mobile financial services and mobile access for women. The study found that 34% of women in Tanzania, 13% of women in Kenya and 10% of women in in Papua New Guinea who would like to try MFS cite the lack of a phone as the main reason for not having done so.36 At the same time, prior GSMA mWomen research indicates that lack of perceived value is one barrier to women’s use of mobile.37 If MFS offer a clear, perceived value to women, they are likely to use the service plus become more active subscribers, with greater willingness to try new tools. MFS providers who choose to offer women relevant products will have the opportunity to improve both their core and mobile financial service businesses, as well as to impact women’s lives at scale.
Meeting women’s wants and needs likely will enhance a service provider’s offering for the entire market. Service providers don’t need to create an entirely different set of services, distribution channels or brands for women. Rather, if service providers are able to tailor their marketing, services, customer care, and agent networks to meet women’s needs for convenience, reliability, security, and privacy, men in these markets also are likely to become more loyal customers. Agents who are welcoming, service-oriented, well-trained and fully equipped to educate and serve new customers are likely to encourage greater adoption and usage across all segments.
Figure 16: The Virtuous Circles of Mobile Financial Services
36 Data for Pakistan isn’t available, as only 1% of women in Pakistan who have not tried MFS wish to, hence data on mobile phones as a barrier was not meaningful.37 GSMA and the Cherie Blair Foundation for Women. Women & Mobile: A Global Opportunity. 2010.
More women adopt mobile
Viral marketing by word of mouth between women
More women use MFS in
their daily lives
MFS better meet men’s
wants & needs
MFS better meet women’s wants & needs
MFS market grows & becomes
more profitable

Appendix: Report Methodology, Country Profiles and Data
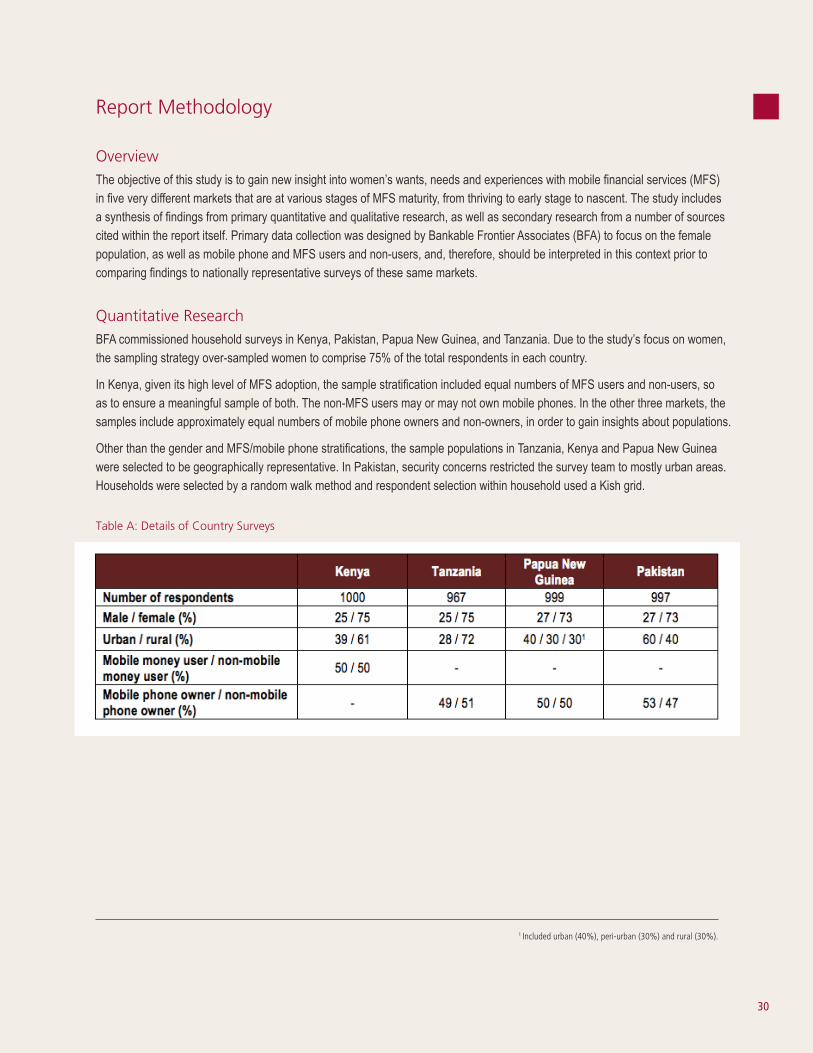
Report Methodology
OverviewThe objective of this study is to gain new insight into women’s wants, needs and experiences with mobile financial services (MFS) in five very different markets that are at various stages of MFS maturity, from thriving to early stage to nascent. The study includes a synthesis of findings from primary quantitative and qualitative research, as well as secondary research from a number of sources cited within the report itself. Primary data collection was designed by Bankable Frontier Associates (BFA) to focus on the female population, as well as mobile phone and MFS users and non-users, and, therefore, should be interpreted in this context prior to comparing findings to nationally representative surveys of these same markets.
Quantitative ResearchBFA commissioned household surveys in Kenya, Pakistan, Papua New Guinea, and Tanzania. Due to the study’s focus on women, the sampling strategy over-sampled women to comprise 75% of the total respondents in each country.
In Kenya, given its high level of MFS adoption, the sample stratification included equal numbers of MFS users and non-users, so as to ensure a meaningful sample of both. The non-MFS users may or may not own mobile phones. In the other three markets, the samples include approximately equal numbers of mobile phone owners and non-owners, in order to gain insights about populations.
Other than the gender and MFS/mobile phone stratifications, the sample populations in Tanzania, Kenya and Papua New Guinea were selected to be geographically representative. In Pakistan, security concerns restricted the survey team to mostly urban areas. Households were selected by a random walk method and respondent selection within household used a Kish grid.
Table A: Details of Country Surveys
1 Included urban (40%), peri-urban (30%) and rural (30%).

Qualitative ResearchBFA also directly undertook qualitative research in Indonesia, Kenya, Pakistan, Papua New Guinea, and Tanzania. Research methods included key informant interviews, focus group discussions of 8-10 participants each, and in-depth, one-on-one interviews with one or two focus group participants. All discussions were recorded, transcribed and translated. Qualitative sites were chosen across rural and urban areas. Interviews with both men and women were conducted, as well as users and non-users of MFS.
Table B: Details of Qualitative Research
Secondary research and expert interviews. BFA consulted a range of secondary literature, much of which is cited in this document, as well as mobile financial service and financial inclusion experts, who provided context and insights to enrich and stress-test the findings.
Insights from GSMA’s mWomen and Mobile Money for the Unbanked (MMU) Programmes. Expertise and prior research from these programmes also has informed this work. Examples include GSMA and the Cherie Blair Foundation for Women’s Women & Mobile: A Global Opportunity, 2010; GSMA mWomen’s Striving and Surviving: Exploring the Lives of BOP Women, 2012; and GSMA MMU’s Driving Customer Usage of Mobile Money for the Unbanked, 2012.
GSMA mWomen (www.mWomen.org), part of GSMA Mobile for Development, aims to increase women’s access to and use of mobile phones and life-enhancing mobile services in developing markets. The GSMA mWomen Global Development Alliance is a programme in partnership with the U.S. Agency for International Development, Australian Agency for International Development, GSMA, and Visa.
Bankable Frontier Associates (www.bankablefrontier.com) is a niche consulting practice supporting the development of financial services for unserved people around the world. Bankable Frontier Associates performed the primary research for this report.
Visa is a global payments technology company that connects consumers, businesses, financial institutions and governments in more than 200 countries and territories to fast, secure and reliable electronic payments. We operate one of the world’s most advanced processing networks—VisaNet—that is capable of handling more than 24,000 transaction messages a second, with fraud protection for consumers and assured payment for merchants. Visa is not a bank and does not issue cards, extend credit or set rates and fees for consumers. Visa’s innovations, however, enable its financial institution customers to offer consumers more choices: pay now with debit, ahead of time with prepaid or later with credit products. For more information, visit corporate.visa.com.
ABOUT US

Country Profiles and Data
Country profile boxes were assembled using information from the GSMA Mobile Money for the Unbanked Mobile Money Tracker and Wireless Intelligence as primary sources.
Definition of terms used in the boxes below:
� MFS provider: The provider of the mobile financial service.
� MFS offering: The brand/product name under which the service is promoted.
� Transfer to unregistered: The facility on a mobile financial service whereby value can be sent to an individual (by sending an SMS code to any mobile phone that is not registered on that scheme). The recipient can then cash in the voucher (code) at an agent of the MFS provider.
� P2P (Person-to-Person) transfer (domestic): Electronic transfer of value from one member of an MFS to another member of the same MFS.
� Bill payment: Payment of a bill from a mobile phone or at an agent of the MFS.
� Merchant payment: A movement of value that is made from a customer to a merchant account to pay for goods or services at the point of sale (retail). Can be a P2P or a specialized “pay to merchant” transaction.
� Airtime top-up: Purchase of airtime with the fund source being a mobile wallet.
� Link to other banking products: Payment is possible from a mobile wallet to other banking products, such as savings, bank transfers and loan repayments (in real time or in batches).
2 Based on unique subscribers, not number of connections. Includes entire population, not just adults. Source consulted for all countries: Wireless Intelligence, https://wirelessintelli-gence.com/markets/, accessed 30 January 2013.
3 Account at a formal financial institution (% age 15+). Source consulted for all countries except Papua New Guinea: World Bank Financial Inclusion data, http://datatopics.worldbank.org/financialinclusion/, accessed 30 January 2013.
4 Q3 2012 share of GSM (Global System for Mobile Communications) is the market share in terms of number of connections. Source consulted for all countries: Wireless Intelligence, https://wirelessintelligence.com/markets/, accessed 30 January 2013.
5 Primary source consulted for all countries: GSMA MMU Mobile Money Tracker, http://www.mobileworldlive.com/mobile-money-tracker, accessed 30 January 2013. Supplemented by provider’s websites.
1
Indonesia Mobile subscribers2 35% Unbanked population3 Men 80% Women 81%
Country context MNO Mobile market share4 Indonesia has one of the highest rates of mobile penetration in the developing world. A variety of operators, led by Telkomsel, ensures this is a very competitive telecommunications market. Indonesia’s market for mobile financial services is nascent but poised, awaiting a more conducive regulatory framework to emerge. Telkomsel’s T-cash launched in 2008, and Indosat’s Dompetku launched at the same time, with both offering a similar suite of services and using agents to perform transactions due to regulatory constraints. Commercial banks also offer mobile access to their existing banking clients.
Telkomsel 45% Indosat 21%
XL Axiata 16% 3 9%
Axis 6% MFS market5
MFS provider MFS offering
Transfer to unregistered
P2P transfer (domestic)
Bill payment
Merchant payment
Airtime top-up
Link to other banking products
Telkomsel T Cash Yes Yes Yes Yes Yes No Indosat Dompetk
u No Yes Yes Yes Yes No
mCoin mCoin No Yes Yes No Yes No

6 http://www.timepey.com/timepayMerchant.html, viewed 30 January 2013.
2
Kenya Mobile subscribers 31% Unbanked population Men 55% Women 61%
Country context MNO Mobile market share
Kenya is home of the world’s most successful mobile financial services platform: Safaricom’s M-PESA. A favorable regulatory environment has supported M-PESA growth from its 2007 launch to a current customer base of 15 million. Safaricom also dominates the mobile voice market. Competitors such as Airtel have launched their own mobile financial service offerings, with person-to-person transfers, bill payments and other features. Orange’s primary service enables customers to connect to their bank platform.
Safaricom 63% Airtel
(Bharti Airtel) 17% Orange
(Telkom Kenya) 10% yu
(Essar Telecom) 10% MFS market
MFS provider MFS offering
Transfer to unregistered
P2P transfer (domestic)
Bill payment
Merchant payment
Airtime top-up
Link to other banking products
Safaricom M-PESA Yes Yes Yes Yes Yes Yes Airtel Airtel
Money Yes Yes Yes Yes Yes Yes Orange
(Telkom Kenya) Iko Pesa Yes Yes Yes No Yes Yes yu
(Essar Telecom) yucash Yes Yes No No Yes No Mobile Pay Tangaza Yes Yes Yes Yes Yes Yes
Equity Eazzy 247 Yes Yes Yes Yes Yes Yes
3
Pakistan Mobile subscribers 29% Unbanked population Men 83% Women 97%
Country context MNO Mobile market share
Pakistan has an early-stage mobile financial services market but a favorable policy and business environment that is ripe for growth. Access to formal financial services is low, but there is a well-developed mobile network sector with five operators. Regulation requires a bank-led mobile financial service model, where banks leverage the network of mobile operators. Seeing the opportunity in MFS, Telenor acquired Tameer Microfinance Bank to launch Easypaisa, the first branchless banking service in Pakistan. Initially, operators in Pakistan tended to promote over-the-counter models whereby customers can access the service through the agent who completes the payment on a mobile phone. Now, operators are looking to shift customers to mobile wallets, benefiting the operator and offering more services to the end-user.
Mobilink 29% Telenor 24% Ufone 20% Zong 14% Warid
Telecom 12% MFS market6
MFS provider MFS offering
Transfer to unregistered
P2P transfer (domestic)
Bill payment
Merchant payment
Airtime top-up
Link to other banking products
Telenor / Tameer
Microfinance Bank
Easypaisa Yes Yes Yes No Yes Yes
Mobilink / Waseela Bank MobiCash Yes Yes Yes No Yes No
UBL Bank Omni Yes Yes Yes Yes Yes Yes Zong /
Askari Bank Timepey Yes Yes Yes Yes Yes Yes

4
Papua New Guinea Mobile subscribers 21% Unbanked population7 85%
Country context MNO Mobile market share
Papua New Guinea has an early-stage – but growing and viable – mobile financial services market. With 85% of the population lacking access to formal banking facilities, mobile financial services could prove to be a useful tool to enable financial inclusion in a country that has a predominantly sparse, rural population. Digicel, which dominates the mobile voice market, launched Cellmoni in 2011, providing customers with person-to-person transfers and bill payment options. Bank South Pacific, the largest national bank, launched an award-winning mobile financial service, as has Nationwide Microbank.
Digicel 81%
Be-Mobile 19%
MFS market
MFS provider MFS offering
Transfer to unregistered
P2P transfer (domestic)
Bill payment
Merchant payment
Airtime top-up
Link to other banking products
Digicel Cellmoni Yes Yes Yes No Yes No
Post PNG Mobile SMK Yes Yes No No No Yes
Bank South Pacific
Bank South Pacific
Yes Yes Yes No Yes Yes
Nationwide Microbank
MiCash Yes Yes Yes No Yes Yes
5
Tanzania Mobile subscribers 29% Unbanked population Men 79% Women 86%
Country context MNO Mobile market share
Tanzania has one of the most competitive mobile markets in the world, with four network operators and aggressive price wars. The scale of mobile financial services may not match that of neighboring Kenya, but the market is firmly in the growth stage. Providers offer similar services to those in Kenya, including free cash deposits and fee-based transfers and withdrawals. All major operators offer MFS, with Vodacom’s M-PESA leading the field.
Vodacom 35% Airtel 30% Tigo 23%
Zantel 11% MFS market
MFS provider MFS offering
Transfer to unregistered
P2P transfer (domestic)
Bill payment
Merchant payment
Airtime top-up
Link to other banking products
Vodacom M-PESA Yes Yes Yes No Yes Yes Airtel Airtel
Money Yes Yes Yes No Yes Yes Tigo Tigo Pesa Yes Yes Yes No Yes No
Zantel EzyPesa Yes Yes Yes No Yes Yes National
Microfinance Bank
NMB Mobile Yes Yes Yes Yes Yes Yes
7 Asian Development Bank, cited in “Papua New Guinea: Banking the Great Unbanked.” http://www.oxfordbusinessgroup.com/economic_updates/papua-new-guinea-banking-great-unbanked. 3 December 2012.

Women Men Women Men Women Men Women Men
Phone access Respondents who own: (%)- SIM and handset 80% 86% 45% 44% 49% 52% 48% 64%- Handset only 0% 1% 0% 0% 1% 0% 2% 2%- SIM only 11% 7% 2% 5% 11% 13% 4% 3%- Neither SIM or handset 9% 6% 53% 50% 38% 35% 46% 31%
Mobile phone usage Respondents who use mobile phones to: (%)- Make phone calls 95% 97% 79% 82% 96% 99% 88% 94%- Flash/buzz/missed calls 74% 72% 64% 65% 89% 91% 65% 74%- Receive phone calls 93% 94% 76% 82% 96% 94% 89% 85%- Send SMS 62% 74% 55% 61% 76% 85% 39% 55%- Receive SMS 72% 83% 58% 63% 79% 85% 39% 55%- Transfer airtime or credit 52% 71% 29% 34% 74% 81% 12% 13%- Check airtime or credit 82% 88% 56% 61% 85% 86% 14% 29%- Use mobile phone to store, send or receive money 48% 58% 33% 42% 27% 33% 9% 10%- Access bank account 16% 24% 27% 32% 8% 13% -- --
Mobile phone providers Average number of providers used (by users) 1.18 1.23 1.39 1.51 1.05 1.04 1.32 1.34SIM choice Respondents who use/chose SIM based on: (%)
- The network of the person I am calling 36% 48% 67% 77% 53% 44% 26% 29%- Rates 51% 39% 16% 19% 29% 50% 15% 13%- Network coverage 8% 11% 14% 5% 14% 6% 12% 11%- Needing MFS 5% 2% 3% 0% 1% 0% 8% 13%- Needing internet -- -- 0% 0% 0% 0% 3% 0%- Emergency loan service -- -- -- -- -- -- 14% 23%- Other 0% 0% 1% 0% 3% 0% 23% 11%
Mobile phone type Respondents who own each type of phone (%)- Basic 62% 57% 72% 65% 58% 49% 73% 64%- Java-enabled 33% 37% 27% 31% 28% 36% 16% 25%- Smartphone 5% 7% 3% 6% 13% 15% 10% 10%
Mobile phone: first to own First in the household to own a mobile phone (%)- Respondent 37% 75% 36% 68% 26% 49% 6% 56%- Spouse 46% 5% 33% 7% 38% 5% 60% 2%- Father/father-in-law 8% 7% 12% 6% 15% 20% 15% 17%- Mother/mother-in-law 4% 3% 4% 4% 4% 5% 2% 2%- Brother/ brother-in-law 2% 8% 5% 10% 7% 8% 9% 13%- Sister/sister-in-law 1% 2% 4% 2% 4% 5% 1% 1%- Grandfather/Grandmother 0% 0% 0% 0% 0% 1% 2% 3%- Son/Daughter 2% 0% 5% 3% 6% 6% 5% 6%
Frequency of use Respondents' use of mobile phone (their own or other's) (%)- Daily 74% 82% 42% 43% -- -- 46% 60%- Several days a week 10% 7% 8% 8% -- -- 18% 13%- At least once a week 5% 3% 4% 2% -- -- 5% 3%- At least once every 2 weeks 4% 2% 4% 4% -- -- 1% 1%- At least once a month 2% 0% 2% 4% -- -- 2% 1%- At least once every 3 months 1% 0% 1% 2% -- -- 0% 1%- Less often 2% 4% 19% 23% -- -- 17% 9%- Never 3% 3% 20% 15% -- -- 11% 10%
Respondents' frequency of air-time top-up (%)*- Once a day or more 51% 73% 48% 57% 33% 35% 13% 24%- Less than once a day, but at least once a week 46% 25% 48% 41% 52% 60% 67% 65%- Less frequent 3% 2% 4% 2% 15% 5% 20% 11%
Average amount per top-up ($) 0.43$ 0.50$ 0.65$ 0.63$ 1.73$ 1.99$ 0.79$ 0.58$
Respondents receiving income by source (%)- Regular job 8% 17% 9% 13% 21% 27% 9% 60%- Casual job 17% 30% 5% 13% 1% 8% 2% 7%- Self-employed 31% 24% 25% 30% 29% 15% 10% 7%- Agriculture 17% 19% 27% 30% 30% 31% 2% 7%- Remittances 32% 24% 9% 7% 43% 41% 42% 29%- Assistance 5% 3% 4% 2% 1% 1% 4% 0%- Pension 0% 2% 0% 1% 0% 0% 1% 2%- Rent 1% 1% 1% 1% 1% 1% 4% 6%
Respondents receiving income through at least one source (%) 85% 92% 68% 81% 89% 86% 59% 87%Respondents receiving an active income (%) 67% 82% 61% 76% 75% 72% 22% 77%Respondents receiving a passive income (%) 36% 26% 14% 11% 43% 43% 46% 33%Urban respondents receiving income by source (%)
- Regular job 11% 23% 10% 16% 39% 39% 9% 61%- Casual job 19% 38% 6% 25% 2% 7% 3% 3%- Self-employed 35% 24% 29% 34% 27% 16% 10% 9%- Agriculture 4% 6% 5% 6% 17% 15% 0% 2%- Remittances 33% 21% 11% 7% 44% 44% 44% 27%- Assistance 4% 7% 9% 1% 1% 1% 1% 1%- Pension 0% 0% 0% 3% 0% 0% 0% 2%- Rent 0% 0% 3% 1% 2% 2% 3% 5%
Urban respondents receiving income through at least one source (%) 86% 94% 61% 78% 90% 85% 59% 85%Urban respondents receiving an active income (%) 66% 84% 45% 72% 76% 66% 21% 73%Urban respondents receiving a passive income (%) 37% 24% 21% 10% 46% 45% 45% 30%Rural respondents receiving income by source (%)
- Regular job 6% 14% 8% 12% 9% 14% 10% 59%- Casual job 17% 25% 5% 9% 1% 12% 1% 13%- Self-employed 28% 24% 24% 29% 22% 16% 10% 3%- Agriculture 25% 28% 36% 39% 49% 41% 3% 15%- Remittances 31% 26% 8% 7% 43% 36% 39% 34%- Assistance 5% 1% 2% 2% 0% 3% 7% 0%- Pension 0% 3% 0% 1% 0% 0% 1% 2%- Rent 1% 1% 0% 1% 0% 0% 6% 7%
Rural respondents receiving income through at least one source (%) 85% 91% 71% 83% 88% 89% 58% 92%Rural respondents receiving an active income (%) 68% 80% 67% 78% 77% 75% 22% 84%Rural respondents receiving a passive income (%) 36% 28% 11% 11% 43% 40% 46% 37%Peri-urban respondents receiving income by source (%)
- Regular job -- -- -- -- 11% 23% -- --- Casual job -- -- -- -- 1% 8% -- --- Self-employed -- -- -- -- 37% 16% -- --- Agriculture -- -- -- -- 28% 43% -- --- Remittances -- -- -- -- 40% 43% -- --- Assistance -- -- -- -- 0% 1% -- --- Pension -- -- -- -- 0% 1% -- --- Rent -- -- -- -- 0% 0% -- --
Peri-urban respondents receiving income through at least one source (%) -- -- -- -- 90% 85% -- --Peri-urban respondents receiving an active income (%) -- -- -- -- 72% 76% -- --Peri-urban respondents receiving a passive income (%) -- -- -- -- 40% 43% -- --Respondents undertaking each type of payment (%)
- Remittances 30% 41% 21% 30% 29% 21% 16% 23%- Utility bills (any) 14% 23% 12% 15% 23% 13% 14% 73%- Electricity bills 11% 20% 9% 13% 21% 12% 13% 72%- Water bills 7% 10% 7% 6% 9% 6% 6% 25%- Gas bills -- -- -- -- -- -- 9% 50%
Income
Payments
Kenya Tanzania Papua New Guinea Pakistan
Financial Activity
Use of mobile
Airtime top-ups
Description Category
*Note that frequency of airtime top-ups depends on the lowest amount of top-up available in each country and the data above should be interpreted in this context.
- School fees 20% 23% 14% 17% 13% 12% 23% 22%- Supplier payments 16% 14% 6% 8% 26% 13% 0% 2%
Respondents undertaking at least one type of payment (%) 56% 66% 37% 49% 54% 46% 40% 84%Remittance senders who most commonly use each method (%)
- In-person by sender or receiver 10% 10% 12% 5% 22% 27% 19% 34%- With a friend / relative / co-worker 4% 6% 7% 11% 11% 5% 9% 10%- In-person deposit into receivers account -- -- -- -- 46% 45% -- --- Other informal method 0% 0% 2% 0% 0% 0% 1% 0%- Bank transfer or wire transfer company 1% 0% 2% 4% 1% 2% 15% 16%- Post office or courier 0% 0% 1% 0% 16% 18% 7% 3%- Mobile money or mobile banking 84% 85% 76% 79% 3% 4% 50% 37%
Electricity bill payers who most commonly use each method (%)- In-person visit to office, shop, post office, or agent 67% 59% 84% 93% 58% 58% 11% 7%- In-person visit to bank or ATM -- -- -- -- 0% 0% 61% 54%- Collector visits home or work 8% 10% 4% 2% -- -- 2% 2%- Bank transfer 0% 1% 0% 0% 1% 1% -- --- Mobile money or mobile banking 20% 19% 2% 0% 39% 39% 25% 37%- Other 4% 11% 10% 6% 3% 1% 1% 0%
Savings Respondents using each type of savings method (%)- Mobile money 26% 32% 18% 25% -- -- 6% 6%- Hiding place in the home 25% 22% 22% 19% 39% 31% 61% 57%- Money guard 1% 2% 4% 3% 9% 9% 7% 6%- Savings clubs 18% 13% 2% 1% 4% 2% 15% 12%- MFI / SACCO / Co-op 2% 5% 3% 2% 11% 9% 1% 0%- Bank account 20% 33% 11% 13% 40% 48% 12% 19%
Respondents' main reason for hiding money at home (%)- Everyday expenses 56% 58% 47% 41% 44% 52% 16% 23%- Emergencies or unexpected expenses 29% 24% 25% 20% 26% 30% 47% 47%- Housing 0% 0% 1% 0% 0% 0% 12% 6%- Business investment 2% 2% 3% 2% 3% 1% 0% 4%- Education for self or children 1% 0% 1% 0% 4% 5% 5% 3%- Health care 0% 4% 2% 4% 0% 0% 3% 6%- Nothing particular / not sure 7% 11% 12% 28% 2% 1% 1% 1%- Other 5% 2% 10% 4% 21% 10% 16% 10%
Respondents' main reason for storing money in mobile financial services account (%)
- Everyday expenses 26% 15% 36% 30% -- -- 0% 6%- Emergencies or unexpected expenses 49% 61% 45% 54% -- -- 48% 75%- Housing 2% 0% 0% 0% -- -- 18% 0%- Business investment 7% 10% 1% 2% -- -- 0% 0%- Education for self or children 3% 0% 1% 0% -- -- 14% 0%- Health care 1% 0% 0% 2% -- -- 7% 0%- Nothing particular / not sure 8% 6% 11% 13% -- -- 7% 0%- Other 5% 8% 7% 0% -- -- 7% 19%
Customer journey Position of respondents along MFS 'customer journey' (%)- Unaware 9% 9% 25% 21% 39% 28% 70% 40%- Awareness 4% 3% 14% 15% 15% 13% 13% 9%- Understanding 6% 3% 11% 13% 13% 13% 3% 0%- Knowledge 22% 23% 14% 10% 13% 22% 3% 22%- Trial 13% 13% 7% 6% 1% 2% 2% 21%- Regular use 46% 50% 29% 36% 19% 22% 9% 9%
Learning to use How MFS users learned to use (%)- Self-taught 56% 69% 46% 56% 54% 80% 7% 32%- Phone seller, airtime or mobile money agent 22% 18% 35% 36% 7% 7% 43% 38%- Spouse or partner 11% 1% 6% 1% 10% 2% 4% 5%- Other relative 9% 4% 5% 1% 15% 7% 10% 5%- Friend / neighbour 2% 6% 7% 5% 2% 1% 3% 3%- Other 1% 2% 1% 0% 11% 2% 19% 8%- Unknown 0% 1% 0% 0% 0% 0% 13% 8%
Desire for MFS Respondents who are aware of MFS but have not tried and say they want an account (%) 64% 71% 45% 47% 54% 64% 1% 12%Confidence using MFS Confidence in using 'mobile money services' among respondents that are aware of but not tried MFS (%)
- Very confident 29% 36% 23% 27% -- -- 0% 10%- Somewhat confident 35% 38% 40% 33% -- -- 26% 24%- Not very confident 25% 15% 24% 27% -- -- 26% 29%- Not confident at all 11% 11% 12% 13% -- -- 49% 37%
MFS account-opening Respondents' main reason for opening an MFS account (%)rationale - Send money to friend or relative 19% 32% 33% 40% 7% 7% 25% 42%
- Receive money from friend or relative 39% 19% 22% 13% 2% 0% 4% 6%- Keep money / save money 28% 34% 22% 22% 0% 11% 23% 6%- Check balance -- -- -- -- 56% 44% -- --- Pay a bill or send money to a business 2% 3% 3% 5% 2% 0% 14% 10%- Receive a payment from a client/customer 2% 4% 0% 2% 0% 7% 3% 0%- Deposit money into a bank account 1% 1% 1% 2% 5% 0% 10% 10%- Withdraw money from a bank account 0% 1% 1% 0% 4% 0% 7% 13%- Buy airtime from mobile account -- -- 3% 1% 0% 4% 0% 3%- No reason, just to try it out 7% 4% 14% 12% 13% 26% 4% 0%- Other 1% 2% 2% 2% 11% 0% 11% 10%
Note: '--' indicates question was not asked in a country, or sample size too small.
Adoption of MFS
Payments
Saving rationale

The GSMA mWomen Global Development Alliance is a programme in partnership with: