Embed Size (px)
Citation preview

· i
This dissertation has beenmicrofilmed exactly as received 67-13,698
);,
HUBBARD, Norman Jay, 1940-SOME TRACE ELEMENTS IN HAWAIIAN LAVAS.
University of Hawaii, Ph.D., 1967Geology
University Microfilms, Inc., Ann Arbor, Michigan

SOME TRACE ELEMENTS IN
HAWAIIAN LAVAS
A DISSERTATION SUBMITTED TO THE GRADUATE DIVISION OF
THE UNIVERSITY OF HAWAII IN PARTIAL FULFILLMENT
OF THE REQUIREMENTS FOR THE DEGREE OF
DOCTOR OF PHILOSOPHY
IN
GEOSCIENCES--GEOLOGY
JUNE 1967
By
Norman Jay Hubbard
Dissertation Committee:
Gordon A. Macdonald, ChairmanI. Lynus BarnesRichard G. InskeepKost PankiwskyjAgatin T. Abbott

ABSTRACT
About 170 Hawaiian lavas have been newly analyzed for
Rb, Sr, and Zr, about 150 for Ni, and about 100 for Co and
V. Twenty Samoan samples also have been analyzed for Rb,
Sr, Zr, and Ni. Eight HIG-USGS interlaboratory standard~
have been analyzed for the above elements, and new independ
ent Rb and Sr analyses have been made for the international
rock standards W-I and G-l.
The distribution of strontium in Hawaiian volcanoes is
linked closely with that of phosphorus. Nickel and cobalt
vary with magnesium, which is a function of the olivine
content. The distribution of vanadium is more closely linked
to that of titanium than to any other element. Zirconium
varies with potassium in alkalic and post-erosional lavas but
shows a weak covariance in Hawaiian tholeiites. Antarctic
tholeiites, with higher potassium contents than Hawaiian
tholeiites, show a K vs. Zr distribution that parallels that
for Hawaiian alkalic lavas.
All element pairs investigated show clear to suggested
differences between individual Hawaiian volcanoes. These
differences presently show no definite correlation with other
features. The covariation of any element pair is almost
always smooth and indifferent to the tholeiitic-alkalic dis
tinction, indicating a common or closely interrelated origin
for both suites. Lavas of the Honolulu and Koloa series, as
well as similar lavas, are commonly distinct in their trace

ii.
element distributions but also show ~eatures that link them
with other lavas of the same volcano.

iii.
TABLE OF CONTENTS
ABSTRACT . . • •
LIST OF TABLES
. . . . . . . . . . . . . . . . . i
iv
LIST OF ILLUSTRATIONS
INTRODUCTION •• •
· . . v
1
MA:fERIALS, METHODS AND ANALYTICAL RESULTS
I. Samples Used . · . . . . · . . . . . · · · 2II. Method and Analytical Results for Sr and Rb 2
III. Method and Analytical Results for Ni · · · 12IV. Method and Analytical Results for Co,
V and Zr . . . · . . . . · . · · · 14V. Recommended Values for Sr, Rb, Zr, Ni, Co,
and V in HIG- USGS Inter~aboratory Standards 22
GEOCHEMICAL RESULTS, DISCUSSION AND CONCLUSIONS
I. Discussion and Presentation of GeochemicalResults • • • . • • . . . . . • . . • . 24
A. Plan of Presentation •••••••B. Strontium •••••••••••C. Rubidium ••.•.••D. Nickel and Cobalt •••••••E. Vanadium •.•.•..•..••.F. Zirconium. . • . • . . . . . . ..G. Post-erosional Lavas •••
II. Cone 1us ions
24244560717582
83
APPENDICES
A.B.C.Dr.E.
F.
G.
· . . . . . . . . . . . .. .Raw Data for Hawaiian and Samoan Lavas ••Computer Program for S Factors ••••••Computer Program for Rb Analyses •••Detailed Emission Spectrographic Methods ••A Copy of the USGS Trace Element LaboratoryRe port •... ... . . . . . . . . .'.Vanadium Data for Lavas of the 1955 PunaEruption . . . . . . . . . . . . .
Diagrams from O'Hara and from Green andRingwood . • . • . . . • • • .
86
8697
100102
112
114
115
BIBLIOGRAPHY . . . • . 118
iv.
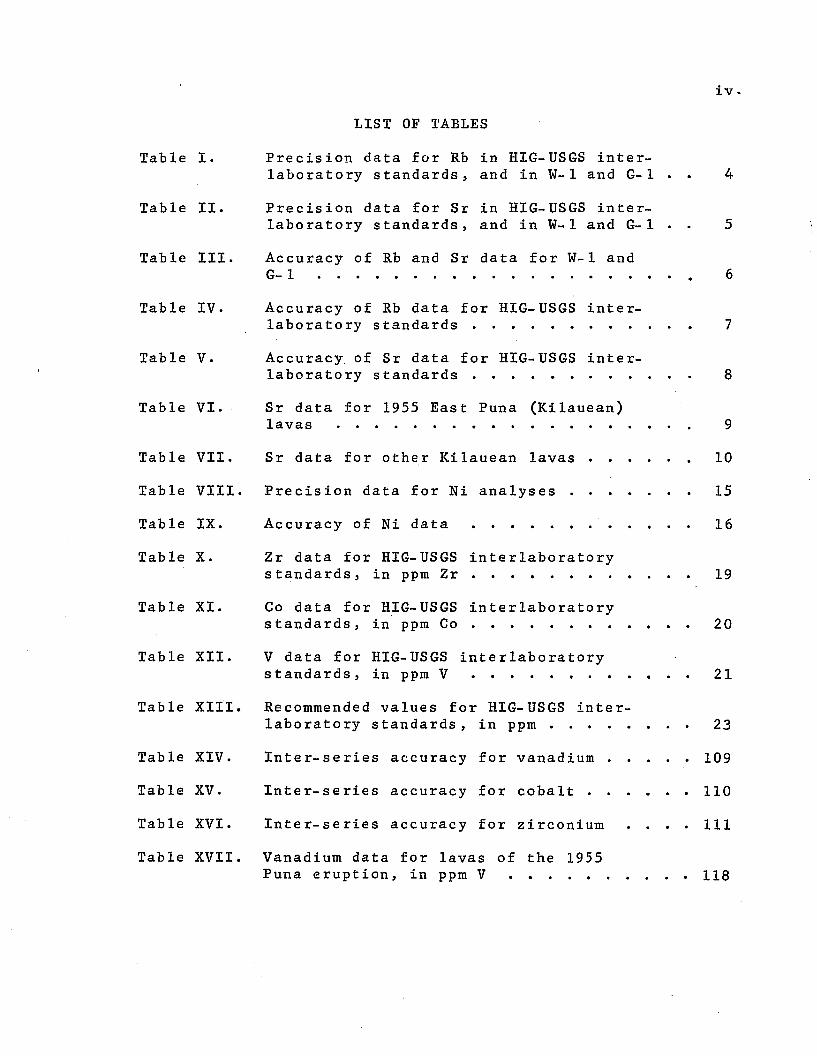
LIST OF TABLES
Table I. Precision data for Rb in RIG-USGS inter-laboratory standards, and in W-1 and G-1 . 4
Table II. Precision data for Sr in RIG-USGS inter-laboratory standards, and in W-1 and G-1 5
Table III. Accuracy of Rb and Sr data for W-1 andG- 1 . . . 6
Table IV. Accuracy of Rb data for RIG-USGS inter-laboratory standards . . • . 7
Table V. Accuracy of Sr data for RIG-USGS inter-laboratory standards . . . . 8
Table VI. Sr data for 1955 East Puna (Ki1auean)lavas . .. ... 9
Table VII. Sr data for other Ki1auean lavas • 10
Table VIII. Precision data for Ni analyses 15
Table IX. Accuracy of Ni data 16
Table X. Zr data for RIG-USGS interlaboratorystandards, in ppm Zr . • . 19
Table XI. Co data for RIG-USGS interlaboratorystandards, in ppm Co . 20
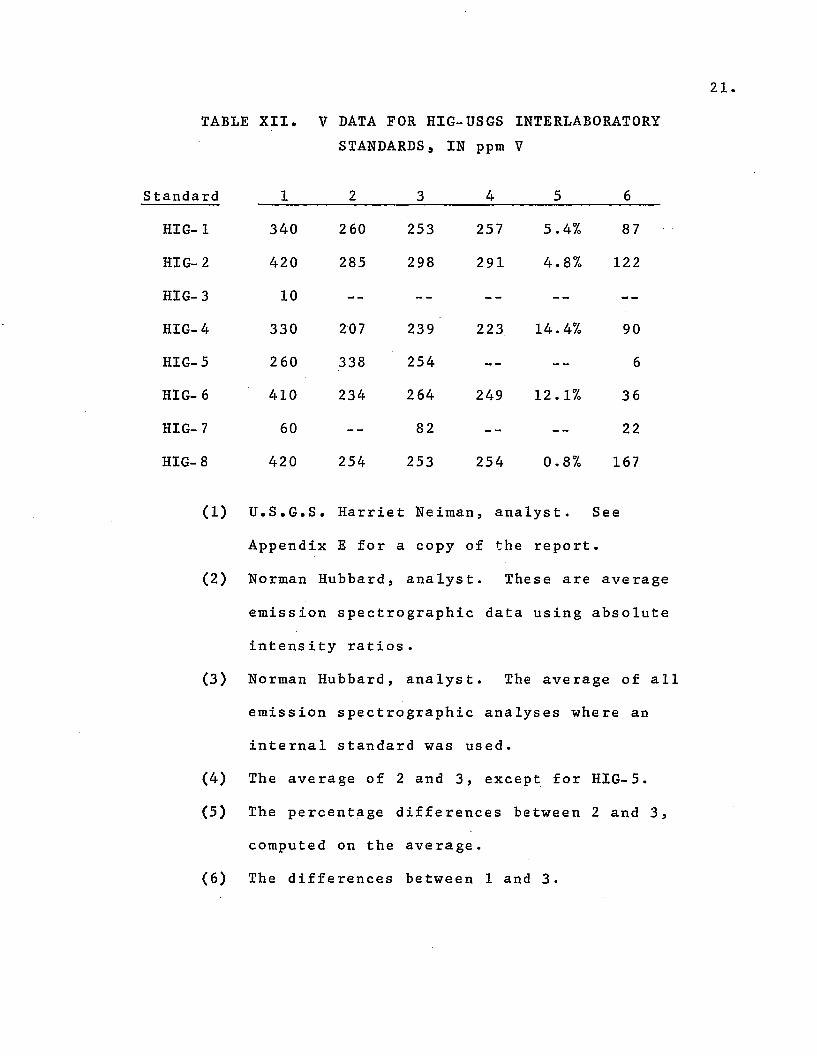
Table XII. V data for RIG-USGS interlaboratorystandards, in ppm V 21
Table XI!I. Recommended values for RIG-USGS inter-laboratory standards, in ppm. 23
Table XIV. Inter-series accuracy for vanadium .Table XV. Inte r- series accuracy for cobalt .Table XVI. Inter-series accuracy for zirconium
Table XVII. Vanadium data for lavas of the 1955Puna eruption, in ppm V
109
110
111
. • 118

v.
LIST OF ILLUSTRATIONS
Figure 1.
Figure 2.
Figure 3.
Figure 4.
Figure S.
Relation of Sr to P20S in Hawaiian lavas .
Trend lines for Sr:P20S in individualHawaiian volcanoes . . . • . • .. . ••
Relation of Sr to P20S in lavas of theWaianae volcano, island of Oahu
Relation of Sr to P20S in lavas of theKohala volcano, island of Hawaii ....
Sr and P2 0 S in the lavas of Kauai .. .
29
30
31
32
33
Figure 6. Relation of Sr to P20S in lavas of the EastMaui (Haleakala) volcano, island of Maui .• 34
Figure 7. Relation of Sr to P 20S in lavas of the WestMaui volcano, island of Maui . 3S
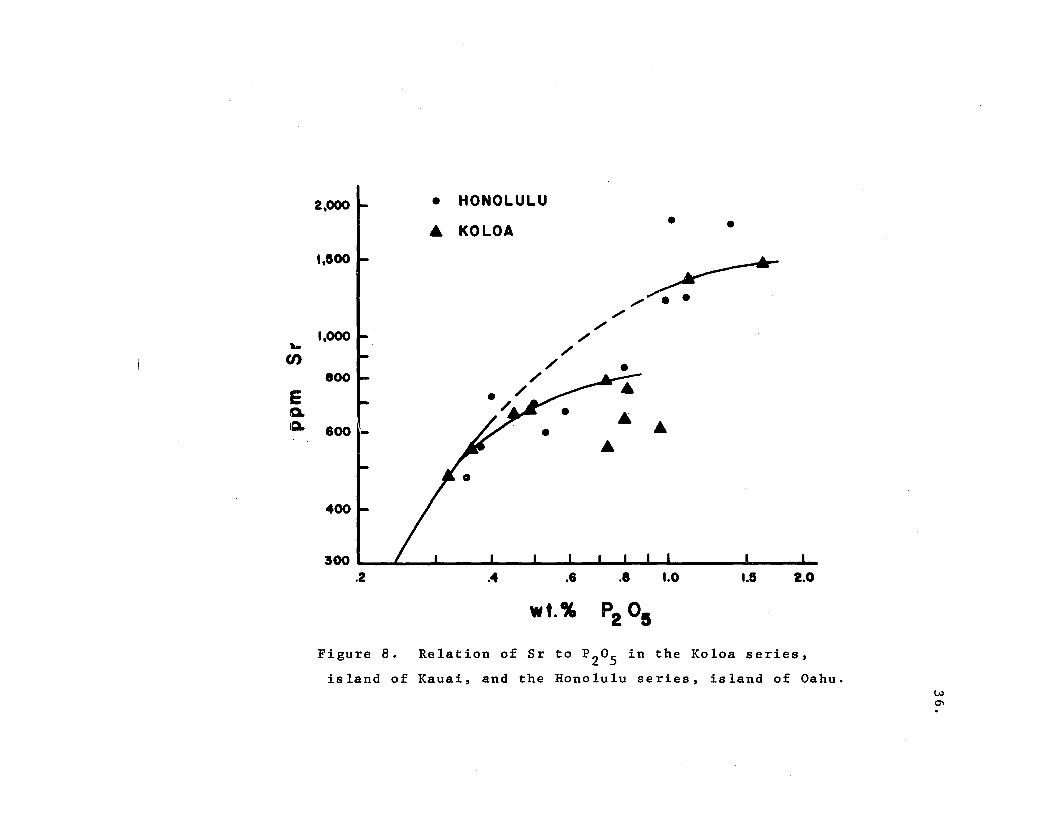
Figure 8. Relation of Sr to P20S in the Koloa series,island of Kauai, and the Honolulu series,island of Oahu . . . • 36
Figure 9. Relation of Sr and P 20S in lavas of theMauna Kea volcafio, island of Hawaii • . •. 37
Figure 10. Sr and CaO in some intra-Pacific volcanics. 38
Figure 11. Relation of Sr and CaO in alkalic lavas ofthe Hawa i ian lsIand s . • . . •. 3 9
Figure 12. Relation of Sr and P20 S in lavas of theEast Maui volcano to Sr and P20S in lavas ofthe West Maui volcano . . . . .. 41
Figure 13. Sr and K2 0of Oahu
in the Waianae volcano, island46
Figure 14. Sr and K2 0 in the Honolulu and Koloa series,and similar Hawaiian lavas • . . . . . . .. 47
Figure IS. Relation of K to Rb in lavas of the Samoanand Hawaiian Islands . . · · · · · · SO
Figure 16. Relation of K to Rb in lavas of the Waianaevolcano, island of Oahu · · · · · · Sl
Figure 17 . Relation of Rb to K in lavas of the Kohalavolcano, is land of Hawaii . · · · · · · S2

vi.
LIST OF ILLUSTRATIONS (Continued)
Figure 18. Relation of Rb to K in lavas of the WestMaui volcano, island of Maui . • • . . • 53
Figure 19. Relation of Rb to K in lavas of the EastMaui (Haleakala) volcano, island of Maui 54
Figure 20. Relation of Rb to K in lavas of the MaunaKea volcano, island of Hawaii • . • .. 55
Figure 21. Relation of Rb to K in lavas of the islandof Kaua i . .. . . . .. 56
Figure 22. K/Rb ratios in lavas o£ the Koloa, Honolulu,Hana and Kula series • • • . • . • .• 57
~
Figure 23. Relation of Ni to MgO in lavas of theHawaiian Islands .••••..
Figure 24. Relation of Ni to MgO in lavas of theKohala volcano, island of Hawaii.
62
63
Figure 25. Relation of Ni to MgO in the Waianae volcano,island of Oahu. . • . . • • • . • . . • •• 64
Figure 26. Relation of Ni to MgO in the West Mauivolcano, island of Maui •.• 66
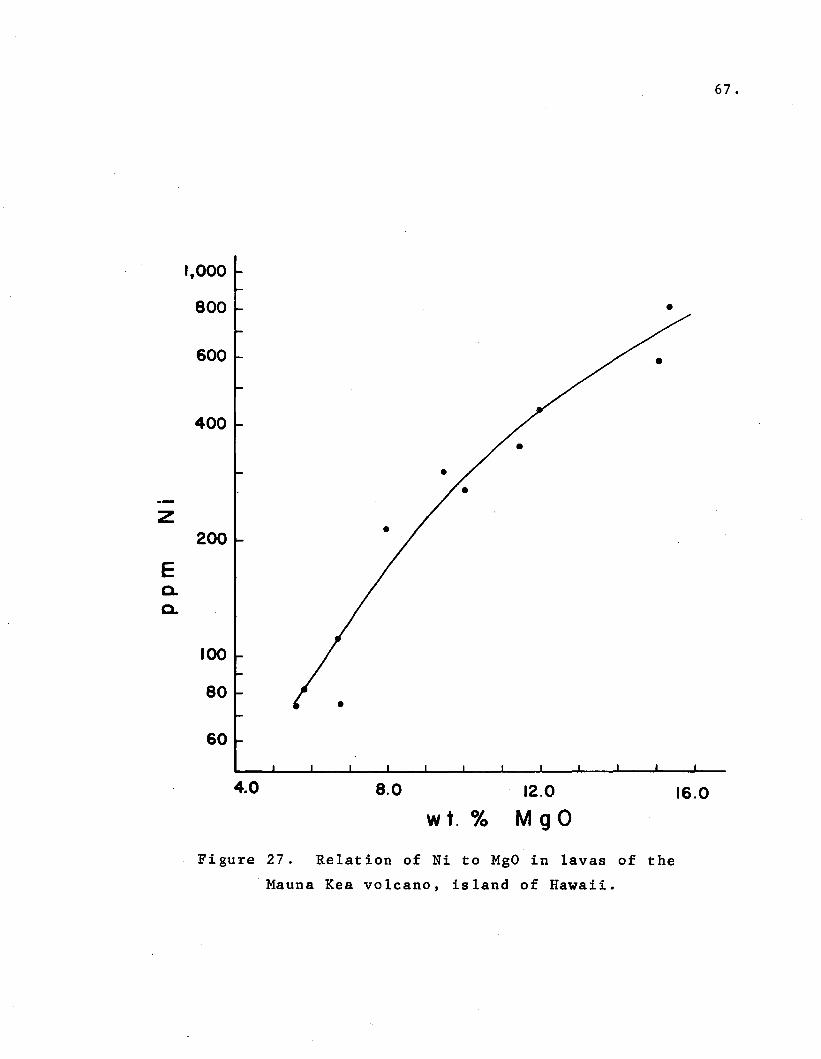
Figure 27. Relation of Ni to MgO in lavas of the MaunaKea volcano, is land. of Hawaii • . • •• 67
Figure 28. Relation of Ni to MgO in lavas of the islandof Kauai . • • • . • . • •• 68
Figure 29. Co and MgO in some Hawaiian lavas 72
Figure 30. A comparison of the relationship of Co andMgO in some samples of Hawaiian lavas withthat in rocks of other regions .•.••• 73
Figure 31.
Figure 32.
Co and Fe in some Hawaiian lavas •
V and Ti02 in some Hawaiian lavas
74
76
Figure 33. A comparison of V and Ti02 in Hawaiianlavas and some simi la r rocks . . • • • . 77
Figure 34. Zr and K20 in some alkalic, tholeiitic andpost-erosional samples • . • • • • • • . •. 79

vii.
LIST OF ILLUSTRATIONS (Continued)
Figure 35. Zr and K20 in the Waianae volcano, islandof Oahu • . . . . . . . . . . . . . . . •. 80
Figure 36. Graph for the normalization of the S seriesto the C series ••••••• •••.• 105

INTRODUCTION
Prior to this research little was known about trace
element distributions in Hawaiian lavas. This is not to say
that data did not exist but that it was limited, often of
low precision and accuracy, and allowed few insights into
the chemistry of Hawaiian volcanoes. This research has
yielded detailed and extensive data on the distributions of
four trace elements, Ni, Sr, Rb and Zr, in Hawaiian lavas
and of two other trace elements, Co and V, in two Hawaiian
volcanoes and two series of post-erosional lavas.
It was hoped that this research would shed some light on
the tholeiitic-alkalic. problem that has been the center of
much controversy and research. This has been done in that
previously unknuwn aspects of the problem have been outlined.
For example, the close association of Sr and P was not only
unknown, it was unexpected in Hawaiian lavas.
In presenting the results of this researGh I have
emphasized similarities and differences in the data rather
than the alkalic or tholeiitic classification of the samples.
This emphasis was arrived at in analyzing the data.

MATERIALS, METHODS AND ANALYTICAL RESULTS
I. Samples used
The samples used in this study are mostly those for
which Macdonald and Katsura (1964) have already published
major element analyses. The second largest body of samples
is from a similar study of the late lavas of the Hawaiian
Islands by G. A. Macdonald. Major element analyses exist for
these samples also. The Samoan samples are those used by G.
Stice (unpublished University of Hawaii Ph.D. thesis) in a
study of the geology and petrology of part of American Samoa.
A set of eight 1955 Ki1auean lavas was donated by H. A. Powers
of the Volcano Observatory. Other data for these samples have
been published by Macdonald and Eaton (1964).
While this research was in progress a set of eight
Hawaiian lavas was assembled as Hawaii Institute of Geophysics
United States Geological Survey interlaboratory standards.
They have been analyzed for the elements studied in this
research.
II. Method and analytical results
for Sr and Rb
The x-ray fluorescence method of Champion, Taylor and
Whittem (1966) was used for both Sr and Rb. Aqueous stand
ards for Rb and Sr were prepared from RbC1, SrC1 2 .6H20, and
distilled water. Scattering factors relative to water were
computed for each sample.
The scattering factors for all samples and standards

3 .
were computed on an IBM 7040 computer using the S values
given by Champion, Tay16r and Whittem for individual elements
and standard chemical analyses for each sample and standard.
The program, co-authored by Ross Grunwald, is given in the
appendix.
The liquid standards were used in ordinary inverted
sample holders, into which a Saran Wrap liner and plastic
retaining ring had been placed.
A Norelco Universal Vacuum X-Ray Spectrograph Type No.
52530 was used for all Rb and Sr analyses. The operating
conditions were as follows: (1) a Tl activated NaI scintil
lation counter was operated at about 1.05 Kv; (2) a LiF
crystal and fine collimation; (3) 50,000 counts were collected
at the Sr K-alpha and Rb K-alpha 2 e positions and background
at +1.10 °26 from the Rb K-alpha position; (4) the pulse
height analyzer was set at about 15.0 v base and 13.0 v
window, with the exact values determined daily.
On the following pages are tables showing the precision
and accuracy of Rb ,and Sr data for Hawaiian lavas. The data
are from the present report and from the literature. The new
Rb and Sr analyses on W-land G-l are also given. Following
the tables is a discussion of the data presented in them.

4.
TABLE I. PRECISION DATA FOR Rb IN HIG- USGS
INTERLABORATORY STANDARDS, AND
IN w- 1 AND G- 1
Sample No. of runs X 2 sigma
HIG-l 8 9 ppm 2 ppm
HIG- 2 3 8 ppm 2 ppm
HIG-3 8 144 ppm 4 ppm
HIG-4 3 7 ppm 2 ppm
HIG-5 8 55 ppm 4 ppm
HIG- 6 7 9 ppm 1 ppm
HIG-7 3 120 ppm 1 ppm
HIG-8 8 33 ppm 2 ppm
G... l 3 216 ppm 2 ppm .- -,'.....
W... l 3 22 ppm 1 ppm
Samoan 20 3 ppm
Hawaiian 13 4 ppm
Note: Samoan indicates 20 samples .run in
duplicate and Hawaiian 13 samples run in
duplicate. All data given above are from
the present research.

TABLE II. PRECISION DATA FOR Sr IN HIG-USGS
INTERLABORATORY STANDARDS, AND
IN W-1 AND G-1
5.
Sample
HIG-1
HIG- 2
HIG-3
HIG-4
HIG-5
HIG- 6
HIG-7
HIG-8
G-1
W-1
No. of runs
9
3
8
3
9
7
3
8
3
3
x
293 ppm
335 ppm
43 ppm
364 ppm
1,838 ppm
424 ppm
322 ppm
827 ppm
236 ppm
194 ppm
2 sigma
10 ppm
20 ppm
4 ppm
18 ppm
50 ppm
22 ppm
20 ppm
20 ppm
12 ppm
6 ppm
Samoan 20 15 ppm
Hawaiian I 7 19 ppm
Hawaiian II 4 35 ppm
Note: Samoan indicates 20 samples run in
duplicate, Hawaiian I indicates 7 samples with
less than 1,000 ppm Sr run in duplicate, and
Hawaiian II indicates 4 samples with greater
than 1,000 ppm Sr run in duplicate. All data
given above are from the present research.

TABLE III. ACCURACY OF Rb AND Sr DATA FOR
W-l AND G-l
Rb Sr
W-l 22 ppm(l) , 22 ppm(2) 194 ppm(l) , 180 ppm(2)
G-l 216 ppm(l) , 220 ppm(2) 236 ppm(l) , .250 ppm(2)
(l) Present report. Norman Hubbard, analyst.
(2) Fleischer (1965).. -
6.

TABLE IV. ACCURACY OF Rb DATA FOR HIG-USGS
INTERLABORATORY STANDARDS
Sample Rb ppm
HIG-l 9 (1)
HIG- 2 8 (1)
HIG- 3* 144 (1), 124 ( 2), 12 2 (3), 3 00 ( 4), 3 25 (5 )
HIG-4 7(1), 8(2)
HIG-5# 55(1), 25(2), 32(3)
HIG- 6 9 (1) .-,(
HIG-7 115(1)
HIG-8 33 (1)
(1) Present report. Norman Hubbard, analyst.
(2) Hamilton (1965). Samples 1, 8, and 9.
(3) Lessing, Decker and Reynolds (1963).
Samples H-86l, H-8-6lg, 17, 18, and 6l-99A.
(4) Wager and Mitchell (1953). Sample J.
(5) Nockolds and Allen (1954). Samples 15 and 16.
* These are five different samples from the
same trachytic mass. The HIG sample is
from Puu Waawaa while some of the other
samples are from Pu~ Anahulu, a small hump
on the trachytic flow from the cinder cone
Puu Waawaa.
# These are three different samples from the
same flow.
7 •

TABLE V. ACCURACY OF Sr DATA FOR HIG-USGS
INTERLABORATORY STANDARDS
Sample Sr ppm
8.
HIG-1
HIG-2
HIG-3
HIG-4
HIG-5
HIG- 6
HIG-7
HIG-8
293 (1), 290 (2)
335(l), 340(2)
43(1),40(2),30(3),35(6), 64(4), 100(5)
364(1), 400(2), 391(4)
1,838(1), 1,200(2), 1,736(4)
428(1), 380(2)
322(l), 360(2)
827(l), 680(2)
Note: Only the data of Hubbard and Neiman are on
the HIG samples. All others are different
samples from the same.flow, quarry, hill, etc.
so that there exists an unknown sampling error.
(1) Present report. Norman Hubbard, analyst.
(2) U.S.G.S. Harriet Neiman, analyst. See
Appendix E for a copy of the report.
(3) Lessing and Catanzaro (1964). Samples H-8- 61,.
H- 8- 61 g , 17, and 18.
(4) Hamilton (1965). Samples 1, 8 and 9.
(5) Wager and Mitchell (1953). Sample J.
(6) Nockolds and Allen (1954). Samples 16 and 15.

9.
TABLE VI. Sr DATA FOR 1955 EAST PUNA
(KILAUEAN) LAVAS
Sample Sr ppm
1 690(1), 385 (2)
2 740(1), 390(2)
3 720(1), 390(2)
4 670(1) , 388 (2)
6 700(1), 384(2)
8 750(1), 395 (2)
9 760(1) , 384(2)
10 760(1) , 394(2)
(1) Sample numbers and data are from Macdonald
and Eaton (1964). Paul Barnett,. analyst.
(2) Present report. Norman Hubbard, analyst.
These data are for samples collected at the
same time and place so that sampling errors
s h 0 u 1d be sma 11 •

10.
TABLE VII. Sr DATA FOR O'XHER KILAUEAN LAVAS
Sample Sr ppm
HIG-1 290(2), 288(1)
HIG- 2 340 (2), 335 (1)
Kilauea Iki*
4
5
7
8
272(1)
254(1)
305 (1)
338(1)
Other Ki1auean samples
1921(1) If
recent flow
date unknown
1960 Kapoho
290 (3)
250(3)
399 (6)
381(6)
379(6)
300 (4)
429, 392(5)
If
If
1959 eruption
1959
1894
(1) Present report. Norman Hubbard, analyst.
(2) U.S.G.S. Harriet Neiman, analyst. See Appendix E
for a copy of the report.
(3) Lessing and Catanzaro (1964).
(4) Hedge and Walthall (1963).
(5) Turekian and Ku1p (1956).
(6) Faure and Hurley (1963).
* The sample numbers are from Macdonald and Katsura
(1961). The samples are the powders used by Katsura.

11.
As can be seen from Tables I and II the absolute pre-
cisio~' of the Rb analyses for the RIG-USGS interlaboratory
standards is good, but the relative ·precision (% 2 sigma) is
poor at the lower concentrations. The precision for the Sr
analyses is similar to that for Rb at similar concentrations.
At Sr concentrations above 200 ppm the % 2 sigma is commonly
under 7.0%.
Table III indicates that the' accuracy of the analytical
method has been high for Rb and Sr in W-l and G-.l. Table IV
shows that three recent analyses of the Puu Anahulu-Puu
Waawaa (RIG-3) trachyte are in rather good agreement. The
absolute Rb values may reflect some sampling error as the
K/Rb ratios from (1) and (3) are 291 and 291. Using the .
same criterion, the Kj-Rb ratios of HIG-5 and the two other
samples of the Moiliili flow are 298(1), 632(2) and 460(3)
while the K values are 1.65% (avg. of U.S.G.S. and Japan),
1.58%(2), and .1.47%(3). This indicates that the major error
is in the Rb values, as a result of either analytical or
sampling errors.
Agreement of the Sr data is generally good as shown by
Table V. The poorest agreement is for RIG-5 and 8, where
the U.S~G.S. values are lower.
One body of published Sr data is in very poor agreement
with all other similar data. This is shown in Table VI along
with new data from the present report. Table VII gives other-~
pub 1 ishe d S r d a t a . It mus t be con c 1u dedth a-t- the Sr da t a

12.
published in Macdonald and Eaton (1964) are in serious dis
agreement with other data for Kilauea.
With the exception of the Sr values noted in the two
above paragraphs, all Sr analyses made using W-1 and G-1 as
standards are in excellent to essential agreement. On this
basis the Sr data of Nocko1ds and Allen (1954) and Wager and
Mitchell (1953) are no longer of much importance for Hawaiian
lavas. The semi-quantitative nature of these two sets of
older data also reduce their importance.
With the exception of the Rb values for the Moi1ii1i
flow (HIG-5), the few existing Rb analyses made using W-1 and
G-1 are in good agreement.
There exists more data from more analysts for Sr than
for any other trace element in Hawaiian lavas.
III. Method and analytical
results for Ni
The basic method is the same as for Sr and Rb except that
semi-synthetic rock standards and G-1 were used in place of
aqueous standards. The standards were made by adding NiO to
a tholeiitic basalt. The initial Ni content was determined
by ordinary standard addition techniques. This series of
standards was used to determine the Ni content of the HIG-USGS
interlaboratory standards and W-1. G-1 was used as a 0 ppm
Ni blank, although it contains about 2 ppm Ni or much less
than the 10 ppm detection limits.

13.
The S factors computed for Rb and Sr were also used for
Ni. While these S factors are not the correct ~nes for the
Ni K-alpha wavelength, they are an improvement over no
corrections. While this is not the best practice, it causes
an error of about ±2% in the extreme cases and about ±l% in
about 80% of the samples. This accounts for about 1/10 of
the total error of most Ni values. These S factors are
second order corrections applied to the basic technique which
uses scattered X-radiation as an internal standard. The
maximum improvement in accuracy given by these correctio~ in
the current body of data is about 20%. The maximum difference
between S factors computed for Sr and S factors for Ni is also
about 20%. Rence, the maximum error is 4% if the. two extremes
are compared with each other or ±2% if the extremes are
compared with the average. Since there are few samples near
the extremes, a better estimate is ±l% from the average.
Data and equations used to estimate this error are in Champion,
Taylor and Whittem (1966) and Compton and Allison (1935).
A Norelco X-ray Diffraction Unit Type No. 12045 with a
X-ray Spectrograph Attachment Type No. 52260 was used for Ni.
The Ni emission was recordeu on a strip chart operated as a
graphical averager.
Precision and accuracy were monitored by repeatedly
interspersing the RIG-USGS standards and W-l, as well as by
a number of duplicate determinations on actual samples. The
RIG-USGS standards, W-l and G-l were also run on the instrument

14.
used for Sr and Rb in order to further check internal con
sistency. These results are given in Tables VIII and IX.
Above 500 ppm Ni duplicate runs often show spreads of 50
to 100 ppm, probably reflecting failure to completely homo
genize the sample. As the Ni is almost entirely in the
olivines, small failures to get a uniform and reproducible
distribution of olivine on the surface of the sample can
easily yield differences of 15% in the amount of Ni determined.
HIG-6 has been particularly bad in this respect, as can be
seen in Table VIII.
IV. Method and analytical results
for Co, V, and Zr
Only a brief description of the emission spectrographic
methods will be given here. Details are given in Appendix D.
The x-ray fluorescence method used for some Zr analyses is
similar to those used for Rb, Sr and Ni: further information
is also in Appendix D.
All the new V and Co data in this report are from emis
sion spectrograms. The Zr data are from emission spectro
grams and x-ray spectrograms.
Two emission spectrographs were used: a 1.5 meter Bausch
and Lomb littrow type with quartz optics and a 3-meter Hilger
compact grating spectrograph. With both instruments D.C. arc
sources were used. Powdered samples were mixed with Spectro
Pure (National Carbon Company) graphite and arced to comple
tion in carbon electrodes: anode excitation was used.

15.
TABLE VIII. PRECISION DATA FOR Ni ANALYSES
Sample No. of runs X 2 sigma
HIG-1 17 1,090 ppm 78 ppm
HIG-2 13 104 ppm 10 ppm
HIG-3
HIG-4 5 89 ppm 10 ppm
HIG-5 6 231 ppm 4 ppm
HIG- 6 18 388 ppm 54 ppm
HIG-7 4 64 ppm 16 ppm
HIG-8 4 231 ppm 10 ppm
W-1 14 93 ppm 10 ppm
Hawaiian* 13 10 ppm
*These are 13 samples run in duplicate and with
Ni less than 500 ppm.

Sample
HIG-1
HIG-2
HIG-3
HIG-4
HIG-5
HIG- 6
HIG-7
HIG-8
W-1
TABLE IX. ACCURACY OF Ni DATA
Ni ppm
1,090(1) , 1,200(2)
104(1), 100 (2) , 100 (3)
, under 5(2),
89(1), 100 (2) , 86(3)
231(1) , 340 (2) , 227(3)
388(1), 400 (2) , 395 (3)
64(1), 50(2), 55 (3)
231(1), 230 (2) , 226(3)
93 (1) , 88 (3) , 78 (4)
16.
.....
(1) Present Report. Norman Hubbard, analyst •
Data from instrument used for main body
of·data.
(2) U.S.G.S. Harriet Neiman, analyst. See
Appendix E for a copy of the report.
(3) Present report. Norman Hubbard, analyst.
Data from instrument used for main body
of Sr and Rb data.
(4) Fleischer (1965).

17.
All densitometry was with an Applied Research Labora
tories Model 2250 microdensitometer and a Varian Model G-IO
recorder. All plate calibration was by line intensity ratio
methods. Iron was used as a variable internal standard for
all three elements.
The standards were W-1, G-l and the HIG-USGS inter
laboratory standards 1 to 8. For V and Co W-1 was taken as
the primary standard, while all standards were considered
primary for Zr.
All emission spectrographic data, using an internal
standard, have been internally normalized. The precision
stated in Tables X, XI and XII refers to the maximum devia
tion from the reported average. Data on the precision and
accuracy of the Co, V and Zr analyses are given in Tables X,
XI and XII.
The U.S.G.S. analyses average about 15 ppm Zr lower than
the ave rage of all three sets of data, except for HIG-3 where
their value is about 1/3 that of Grunwald and .Hubbard. Note
that while the U.S.G.S. Zr values are generally lower than the
average of all, they are still within or very close to their
stated error of ±15% for all standards except HIG- 3. Grunwald
and Hubbard agree to well within their limits of error.
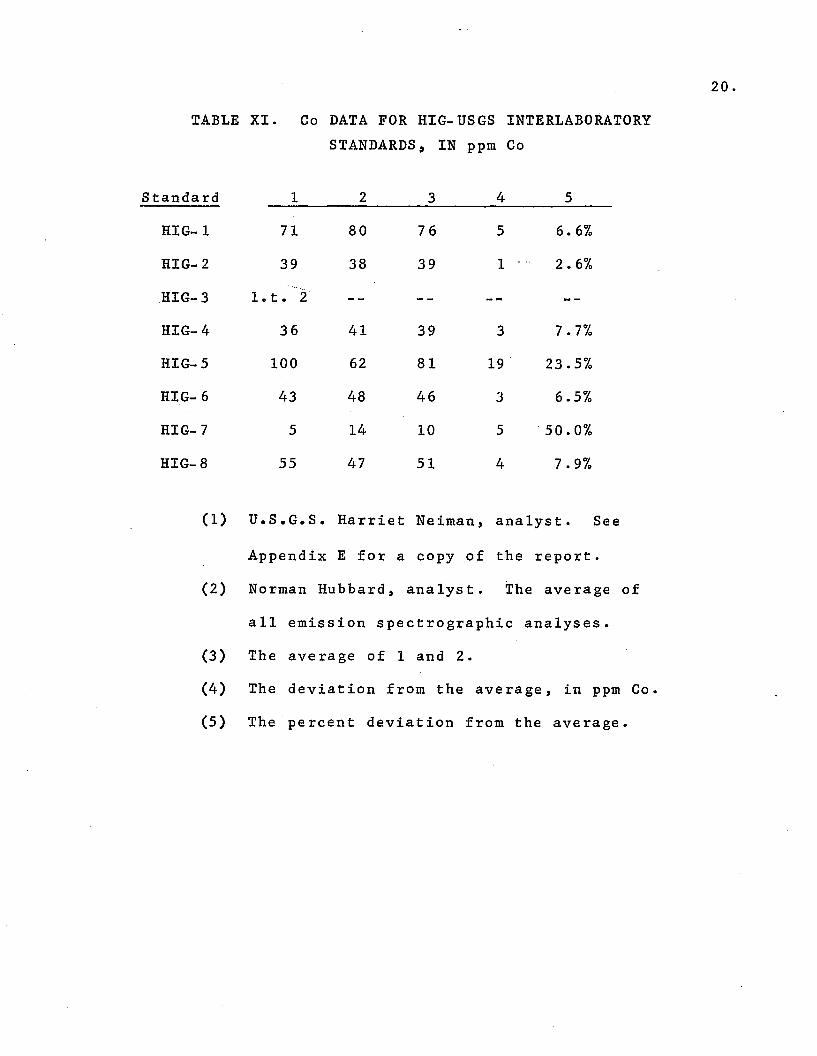
For Table XI the maxim~m deviation from the average is
less than 11.0%, except for HIG-5 which is 30% and HIG-7 which
is a single analysis. W-l (42 ppm Co) was the primary stan
dard. This value was chosen on the basis of recent Co analyses

18.
reported in Fleischer (1965). As can be seen, each set of
values agrees with the average to well within the limits of
error. HIG-5 has proven a difficult sample to get repro
ducible Co values for (see Appendix D, Table XIV). HIG-7
required a long extrapolation of the working curve, thus the
reported value of 14 ppm is open to some question. The
U.S.G.S. value of 5 ppm is near their detection limit of
2 ppm. From this viewpoint, the difference in the two cobalt
values for HIG-7 is not presently serious.
There are currently few additional date allowing an
independent comparison of the new V data. The few there are
suggest that Hubbard's values are more nearly correct, but it
is far from conclusive. The true V content of W-l is also in
so question (see Fleischer, 1965). The most pertinent addi
tional set of V data for Hawaiian lavas is those given in
Macdonald and Eaton (1964). These samples have been re
analyzed in the present work, and the new analyses are given
in Appendix F along with the published values. The agreement
between these two sets of analyses is much better than that
for the RIG-USGS standards. The large variation of the dif
ferences given in Table XII, column 6, indicates that the
error is both systematic and highly random.

19.
TABLE X. Zr DATA FOR HIG-USGS INTERLABORATORY
STANDARDS, IN ppm Zr
Standard 1 2 3 4 5 6
HIG-1 134 100 131 122 -22 18.0%
HIG-2 163 120 155 144 -24 16.7%
HIG-3 1,120 340 1,130
HIG-4 115 90 125 110 - 20 18.2%
HIG-5 191 190 198 193 + 5 2.6%
HIG-6 192 160 180 177 -17 9.6%
HIG-7 170 190 172 177 +13 7.4%
HIG-8 250 240 248 246 - 6 2.4%
(1) Ross Grunwald, analyst. X-ray fluorescence.
(2) U.S.G.S. Harriet Neiman, analyst. See
Appendix E for a copy of the report.
(3) Norman Hubbard, analyst. The average of all
individual emission spectrographic methods,
except HIG-.3 and 7 which are independent
x-ray fluorescence determinations.
(4) The average of 1, 2 and 3.
(5) The maximum deviation from the average, with
its sign.
(6) The percent maximum deviation from the average
in 4.
20.
TABLE XI. Co DATA FOR HIG-USGS INTERLABORATORY
STANDARDS, IN ppm Co
Standard 1 2 3 4 5
HIG-l 71 80 76 5 6.6%
HIG-2 39 38 39 1 2.6%-.. ~- .....
HIG-3 1. t. 2
HIG-4 36 41 39 3 7.7%
HIG-5 100 62 81 19 23.5%
HIG- 6 43 48 46 3 6.5%
HIG-7 5 14 10 5 ·50.0%
HIG-8 55 47 51 4 7.9%
(1) U.S.G.S. Harriet Neiman, analyst. See
Appendix E for a copy of the report.
(2) Norman Hubbard, analyst. The average of
all emission spectrographic analyses.
(3) The average of 1 and 2.
(4) The deviation from the average, in ppm Co.
(5) The percent deviation from the average.
21-
TABLE XII. V DATA FORHIG-USGS INTERLABORATORY
STANDARDS, IN ppm V
Standard 1 2 3 4 5 6
HIG-l 340 260 253 257 5.4% 87
HIG- 2 420 285 298 291 4.8% 122
HIG-3 10
HIG-4 330 207 239 223 14.4% 90
HIG-5 260 338 254 6
HIG- 6 410 234 264 249 12.1% 36
HIG-7 60 82 22
HIG-8 420 254 253 254 0.8% 167
(1) UsS.G.S. Harriet Neiman, analyst. See
Appendix E for a copy of the report.
(2) Norman Hubbard, analyst. These are average
emission spectrographic data using absolute
intensity ratios.
(3) Norman Hubbard, analyst. The average of all
emission spectrographic analyses where an
internal standard was used.
(4) The average of 2 and 3, except for HIG-5.
(5) The percentage differences between 2 and 3,
computed on the average.
(6) The differences between 1 and 3.

22.
V. Recommended values for Sr, Rb, Zr, Ni, Co,
and V in HIG-USGS standards
The values given here are a personal choice based on the
data given in this report. When there is good agreement the
values from different analyst were averaged.
The Co values are an average of U.S.G.S. and the present
report, as are the Ni, excepting the Ni value of HIG-5 which
is Hubbard's. The Zr values are an average of Grunwald and
Hubbard, except HIG-6 which is an average of U.S.G.S.,
Grunwala and Hubbard, and HIG-7 which is an average of
Grunwald and an independent x-ray value by Hubbard. This has
been done because Grunwald and Hubbard were trying for optimum
results in these samples, while the U.S.G.S. values represent
routine analyses. The Sr values are an average of U.S.G.S.
and Hubbard or, where the difference was thought to be too
great, Hubbard's alone. The V values are Hubbard's alone,
representing a semiarbitrary choice. See Appendix F for more
The Rb values areinformation on V values in Hawaiian lavas.
Hubbard's alone, there being no others.
Values between 10 and 1,000 ppm are given to two places,
with the third a zero. Below 10 ppm only one place is given:
above 1,000 ppm three places are given, with a zero in the
fourth. The recommended values are given in Table XIII.

-- Denotes that the concentration is below 10 ppm.

-2A •
GEOCHEMICAL RESULTS, DISCUSSION AND CONCLUSIONS
I. Discussion and presentation of
geochemical results
A. Plan of presentation
Results for each element will first be discussed alone
and then in light of results for previously discussed elements.
Past research on the distribution of each element in situa-
tions bearing on the present results will be presented just
before the discussion of present results. This scheme will
be deviated from in presenting the results for the Honolulu
and Koloa series. It is felt that a separate discussion of
these two series is desirable in view of their geological and
petrological differences.
B. Strontium
Past Research. The largest and most comprehensive body
of Sr data for silicate rocks is that of Turekian and Kulp
(1956). They have reported Sr and Ca data for 23 Hawaiian
samples and for 21 other intra-Pacific basaltic samples. They
found no correlation between Sr and Ca in basaltic rocks in
general but for a given complex of basaltic rocks (Stillwater
complex, Lebombo volcanics, for example), they.found a marked
negative correlation. Plagioclases from the Stillwater com
plex also show a negative correlation up to the least calcic
member of the NaAlSi 3 0a - CaA1 2Si 2 0a solid solution series
analyzed, An 62.5. In granitic rocks they found a definite
positive correlation between Sr and Ca. In Hawaiian samples

25.
the late stage lavas were found to contain much more Sr than
the shield-building lavas. The late stage lavas show a general
negative correlation between Sr and Ca while the shield
building lavas show no correlation between Sr and Ca.
Wager and Mitchell's (1951) data for the Skaergaard com
plex in East Greenland contain a second set of impo~tant Sr
data. They found that Sr reached a maximum in andesine
plagioclase and that the plagioclases contained about 20 to
100 times as much Sr as the pyroxenes. They found two
apatites to contain roughly the same amount of Sr as the
plagioclases. For the intrusion as a whole they found an
initial increase in Sr content with differentiation, followed
by an irregular fall in the most differentiated samples
analyzed. Wager and Mitchell (1953) later reported Sr data
for 10 Hawaiian samples. These data show a rise in Sr content
until the mugearites, followed by a large decrease in the
trachytes. This is the general pattern found by the present
research.
The largest body of Sr data for the Hawaiian Islands
prior to the present research was that of Nockolds and Allen
(1954 and 1956). They found the same behavior as did Wager
and Mitchell.
A small body of Sr data for a single eruption was pub
lished by Macdonald and Eaton (1964). These data have been
discussed in the section dealing with the quality of all
existing Sr data for the Hawaiian Islands. Lessing and

26.
Catanzaro (1964), Hamilton (1965), and Faure and Hurly (1963)
have all published total Sr data in conjunction with other
data. Turekian (1963) has published some data for Sr in
pyroxenes and garnets from Salt Lake Crater xenoliths.
Tatsumoto, Hedge and Engel, and Engel, Engel and Havens (1965)
have published data for Sr in some oceanic basalts. Gunn
(1966) includes Sr data for some Antarctic tholeiitic intru
sions, where the total Sr content is close to that of the
low-K basalts of Engel, Engel and Havens but less than half
the Sr content of Hawaiian tholeiitic basalts.
Nockolds and Mitchell (1948) included Sr in a study of
the relationships of major and trace elements in some
Caledonian plutonic rocks.
Present Research. The key to understanding the distri
bution of Sr in Hawaiian lavas is its relationship to P, as
shown in Figure 1. Within the broad band of points shown in
Figure 1 are more restricted areas occupied by the data for
anyone volcano. The trend lines for individual volcanoes
are grouped together in Figure 2. Figures 3 through 9 show
the distribution of Sr and P for individual volcanoes. The
data for two volcanoes, East and West Maui, have been inter
preted as falling along the two differing trend lines in the
fashion indicated by the solid and dashed lines. The data
for the Koloa series on Kauai have been interpreted as having
a common origin with the other Kauai samples but showing two,
quant i tative ly diffe rent, covariat ions of Sr and P .L~:l.:a for

27.
both the Honolulu and Koloa series have been plotted on
Figure 8 together with the trend lines for Kauai. The inter-
pretation is that Sr and P show the same distribution in the
Honolulu series as in the Koloa series.
The close association of Sr and P in indi~idual Hawaiian
volcanoes indicates that apatite (Ca,Sr,Mn)5 (F,Cl,OH)
(P,As')3012 is responsible. Strontian hydroxylapatite has
been made by Klement (1939) and strontian ch10rapatite by
Carabbi (1050). Larsen, Fletcher and Cisney (1952) have
reported a Sr apatite containing 11.6% SrO. Cruft (1966) has
published data showing that apatites from ultrabasic and
alkalic rocks can be very high in Sr. Examples are: an
apatite from alkalic rock, Kukiswumchodr, Khibina USSR, 7.35%
Sr; from an ultrabasic rock, Snarum, Norway, 2.03%; from an
omphacite-diopside-apatite vein in eclogite, Eriksundjosak,
Norway, 2.61% Sr. Macdonald (personal communication) has
reported 1-3% of large apatite crystals in Hawaiian mugearites,
where both Sr and P reach their peaks. If all the Sr in
mugearites (about 1,200 ppm) is assigned to these apatites,
their Sr contents will range from 4-12%.
The density of common apatite is a little below 3.20 gmkc,
of a Sr apatite (11.6% SrO) 3.35, strontian fluorapatite 3,34,
and of Sr hydroxylapatite 4.17 gm/cc. With the density of
Hawaii basaltic magmas less than 2.90 gm/cc (Macdonald, 1963)
and mugearitic magmas less iron rich and more volatile. rich,
hence less dense, gravitative settling of the large apatite

28.
crystals could easily occur.
Usual geochemical practice is to view the distribution
of a trace element cation in relation to a chemically similar
major element cation. For Hawaiian volcanoes this approach
yields only a meager partial answer for Sr. The distribution
of Sr relative to Ca is shown in Figures 10 and 11.
In the Waianae, Kohala and Kauai volcanoes, except the
Koloa series, the covariance of Sr and P is very close, but
not in all other volcanoes investigated. The close covariance
of Sr and P in some volcanoes and not others indicates that
either conditions or materials associated with some volcanoes
are less uniform. That this close covariation exists in the
Waianae and Kohala volcanoes and is indifferent to the dis
tinction between tholeiitic and alkalic suites is evidence
against mere magmatic differentiation being the cause of less
uniformity but is evidence for one parent material, be it
solid or liquid, for both alkalic and tholeiitic lavas of at
least these volcanoes.
Hawaiian volcanoes have been divided into two basic types,
Haleakala and Kohala by Macdonald and Katsura (1964). The
distinction is based on differences in late-stage eruptive
history and shows no correlation with the distinction made in
the above paragraph. The Waianae volcano is of Haleakala type
but East Maui (Haleakala) does not show the same relationship
of Sr to P. West Maui (Kohala type) shows a strong similarity
to the Waianae and Kohala volcanoes in its distribution of Sr

29 .
•
•
• • ••
•
•
, ..". .•
•••
• •.. .-. ...· .4.. .~.. ,. . .· ..•• ••.- ..
•••••
•• M,E 400 • .. f~· ·• • •Q. . I·· •IQ. • :!a.,. ..300
• ••; f·•
200
•
1,000
800 •••.... 100 •en ••• •
• •
2.01.0.8.6.4.3.2.15
70 .....__....._ ....__....__.........._ ....-'--10-'-.....__.....__1...-__
.1
wt.%
Figure 1. Relation of Sr to P20Sin Hawaiian lavas.

2,000
',500
1,000
800
~ 600en
E 400Q.0.
200
~r7 Ea.' Maul
~walona.
./'~ Ea.' Maul
~ / KauOI
';7...,
Koholo
150
6.04.01.5 2.0.8 1.0.6.4.2.15
100' , , , I I , , , , , , , , , I I
.1
wt.% P205
FigurE;! 2. Trend lines for Sr:P20S in individual Hawaiian volcanoes.
wo

31.
300
250 .....__......__....._1----&0_....."""-.........1-_......._
.2
2,000
1,500
1,000
800..fI)
600Ea.a.
400
Figure 3. Relation of Sr to PZOS in lavas of the
Waianae volcano, island of Oahu.

2.01.51.0.1.1.4.5.2
200 ' , , , , , , , , , , ,:15
1,500
2,000
1,000
~
en 800
E 600~~
400
300
wt. % P20SFigure 4. Relation of Sr to P20S in lavas of the Kohala volcano,
island of Hawaii.WN

2.01.51.0
•
.8
••
.. kOLOA
• OTHERS
.6
~".
"./
'"/
'"'"//.
.4.2I50 ' , , , , , , , , , , ,
.15
600
800
200
1,000
1,500
eCL 400CL
~
en
wt.% P2 Os
Figure 5. Sr and P205 in the lavas of Kauai.ww

1,500
J,ooo
8oo~ - ./
~
-r /CJ)
E /Q. /Q.
/400 ~ /
1.0.1.8.4.2.IS250 ' , , , , , , , , , ,
.1
wt.% PzOs
Figure 6. Relation of Sr to P20S in lavas of the
East Maui (Haleakala) volcano, island of Maui.
w~

1,000
800
'-en 600 - - •E
400 [ / .. • •~
a. • • •
300I •
1.0.8.6.4.3.2.I~
200 ' , , • , , , , , , ,
.I
wt.% P20SFigure 7. Relation of Sr to P20S in lavas of the
West Maui volcano, island of Maui.WlJ1
/~
2,000
1,500
• HONOLULU
• KOLOA • •
2.01.51.0
•
.8
••
.6
•
.4
",
/'"/
// .. //.
500 ' " , , , , , , , , ,
.2
400
.. 1,000
CJ)
800
Ea-lea.
wt.% P20S
Figure 8. Relation of Sr to PZOS in the Koloa series,
island of Kauai, and the Honolulu series, island of Oahu.w(J\

1,500I • • •• ••
1.000 ~ •~
U) 100
EA
800 I-A ••.. ..400L •• •
•t- .
elo.15 .2 .4 •• .1 1.0
wt. cr. PZOS
Figure 9. Relation of Sr and PZOS in lavas of the Mauna Kea
volcano, island of Hawaii.w......

38 .
•• •
IIA................., ............. C I
....... IAlALTi CI IMIIt> .........0 ......
,AIIQA
U.....
10
100
100
•0...-
"• •
•, ,
• • •• •••
''- •
•~, ~t.e)-
ppmSr
10
0.0 100
wt.ItCaO
Figure 10. Sr and CaO in some intra-Pacific volcanics.

39.
3.000
2.000
M M
10
HH
MB
M BBH B
0~~ B
aaN
0
0
A alkalic basalt
B basanitaid
H hawaiite
100 ha hawaiite-alkalic basalt
ho hawaiite-alka Ii c oli~ine basalt
80 M muvearlte
N ankaramite
60 0 alkalic olivine basalt
T trachyte
ta trachyandesite
Tm m u Ve ar it e- trachyte
200
6JO
800
400
I.!loo
1.000
Ea.a.
40
2.0 40 60 8.0 100 120 140
wt. % CaO
Figure 11. Relation of Sr and CaO in alkalic lavas
of the Hawaiian Islands.

40.
and P, but it also shows deviations that link it closely with
East Maui. In the case of East and West Maui similar or
identical paths of differentiation may have been the cause of
these similarities. Figure 12 shows East and West Maui data
plotted together. The lines drawn through the data are thought
to represent the different trends in Sr and P covariation.
The two concave downward lines are just analytically resolv
able for Sr and less so for P at low concentrations but are
easily resolved at high Sr values. The concave upwards line
is easily resolvable from the other two. It should also be
noted that the data for the Waianae, Kohala and Kauai, except
Koloa, volcanoes all fall within narrow limits, approximating
the analytical limits of error.
Different volcanoes show slightly different trend lines
for distribution of Sr and P or, as East and West Maui, a
different sign of curvature for one of the lines. Each
Hawaiian volcano has its own maximum.content of Sr and P, as
can be seen in Figure 2. There is no relationship between
the initial Sr/p ratio and the maximum content of Sr and P.
There is little correlation between the initial content of Sr
and P and the maximum. However, the latter is greatest in
these volcanoes that produced mugearites or nephelinites.
It has been shown (Macdonald and Katsura, 1964) that
different Hawaiian volcanoes have slightly different trends
of differentiation in the major elements and that these dif-
ferences are not related to the type of volcano. This is

•• • W.tt Maul
200 ~• Eatt Maul
I.8 1.0 1.5 2.0
150.4 .6.I .15 .2
wt. % P20S
1,000
800
~
en600
E~
a.400 I •
Figure 12. Relation of Sr and P20S in lavas of the East Maui volcano
to Sr and P2
0S
in lavas of the West Maui volcano..pI-'

42.
just what is found for the Sr and P data.
Macdonald (personal communicatio~has suggested that the
upper magma chambers of different volcanoes were at different
levels and, as low pressure differentiation is thought to
produce mugearites from alkalic olivine basalts in these
chambers, small pressure differences at this stage of magmatic
differentiation may well have been an important variable in
the alkalic series. For the present it is sufficient to know
that different volcanoes followed slightly different paths of
magmatic evolution and that the highest concentration of Sr
and P obtainable in anyone body of Hawaiian magma could be
related to the detailed path of magmatic evolution.
In the East and West Maui volcanoes two different paths
of differentiation seem to have operated in both volcanoes.
The predominant path of one volcano seems to have been the
secondary path of the other. If this interpretation of the
data is the correct one, the factors controlling the differ
entiation paths of these Hawaiian volcanoes have been exterior
to them, or alternatively, they had a common magma source
which underwent a change in operating parameters, perhaps due
to external influences.
O'Hara (1965) has outlined a scheme by which a wide
range of magma types can be obtained. This scheme is based
iOn the differentqpes of fractional crystallization and partial
melting that can occur at different pressures. By this scheme
the composition of a magma erupted at the surface is a function

43.
of how long differentiation was allowed to proceed at dif-
ferent pressures. Present Sr and P data require that the
following restriction be made, at least for some Hawaiian
volcanoes. That is, that some volcanoes (Waianae, Koha1a and
Kauai) had one mean path of differentiation and that f1uctua-
tions atound individual mean paths were small and independent
of the distinction between alkalic and tholeiitic suites.
In other words, O'Hara scheme must be able to operate with
little or no interruption for the life of these volcanoes and
to smoothly make the transition from production of tholeiitic
magma to production of alkalic magma.
Green and Ringwood (1966) have recently pointed out that
the Sr and P content of basalts from different regions show
no correlation to major element chemistry. They find no way
to account for this unless it is assumed that the Er and P
are in a minor mineral phase(s) in the upper mantle and that
this phase(s) varies in concentration geographically. In
addition, it is pointed out that the content of P in alkalic
olivine basalts from Hawaii is greater than it would be if
the alkalic olivine basalts were derived from olivine-rich
tholeiitic basalts by the extraction of 10-30% of enstatite
± subcalcic clinopyroxene. This is not entirely true. In
Hawaiian alkalic olivine basalts of individual volcanoes P
is about 20% to about 100% higher than in the tholeiites.
Sr shows the same behavior. Note that the percentage range
of solid phase removed overlaps the increase in Sr and P in

44.
Hawaiian alkalic olivine basalts. Green and Ringwood propose
that the great increase in Sr and P is due to selective en
richment of these elements from the wall-rock during slow
ascent of magma at considerable depth within the mantle.
The basic scheme of Green and Ringwood is accepted as
plausible but with an important modification. The revised
version is: Alkalic olivine basalt magmas are derived from
olivine-rich tholeiitic magmas by removal of 10-30% enstatite
± subcalcic clinopyroxene and the content of Sr and P, as
well as certain other elements, may increase by this percen
tage; or it may increase by a greater percentage, possibly
due to selective enrichment from the wall-rock while the
magma is still at considerable depth within the mantle.
In summation, the distribution of Sr and P for any
Hawaiian.volcano is a function of the detailed path of mag
matic evolution. This path may be determined by the length
of time the magma is allowed to undergo' differentiation in
different pressure and temperature zones or, keeping tem
perature, pressure and time constant, differences in initial
composition. Differentiation at any temperature and pressure,
or combination of conditions, either with or without selec
tive enrichment of Sr and P, must be able to produce smooth
variations in both Sr and P and to do this without regard to
the alkalic vs. tholeiitic distinction.
Figures 13 and 14 show that Sr also shows a close co
variation with K. In addition, there is a good stratigraphic

45.
correlation in the Waianae volcano. The lower lavas have the
lowest Sr content, the middle lavas have intermediate values,
and the upper lavas the highest. One upper Waianae sample
falls within the lower lavas. This may be due to an error
in mapping (Macdonald, oral communication, 1966). In all
volcanoes investigated, the alkalic basalts contain more Sr
than the tholeiitic basalts. Tholeiitic basalts erupted
late in a volcano's cycle of activity contain more Sr than
earlier ones.
c. Rubidium
Past Research. The largest single body of pre-existing
Rb data for Hawaiian lavas is that of Lessing, Decker and
Reynolds, Jr. (1963). Their conclusion that the high-K
alkalic lavas show a decrease in the K/Rb ratio is not sub
stantiated by the present research. Hamilton (1965) has
reported a small number of Rb data for Hawaiian lavas and
concludes that there is little significant variation in the
K/Rb ratio, except in the trachytes. He attributes the lower
K/Rb ratios of the trachytes to extreme magmatic differentia
tion, not to contamination by marine material, as did Lessing,
et al.
Both Faure and Hurley (1963) and Hedge and Walthall
(1963) have published a very small number of Rb data for
Hawaiian lavas in conjunction with Rb-Sr isotope studies.
Taubeneck (1965) considers the K/Rb ratio a good index

1,250
1,000
•••• t •••. ~800 ••• ·0
0~ 600en 0
0
E 0C-o. • ..
400 • •• 0
•AI" •.....• • • UPPER ME MBE R
v MIDDLE MEMBER
• LOWER MEMBER
2000.0 0.5 1.0 1.5 2.0
Wt. % K2 0
Figure 13. Sr and K20 in the Waianae volcano,
island of Oahu.
46.

2,000
1,500
1,000
800
~
(J) 600
E0.0- 400
200
o 5
B
B basaniteb basanitoidbm II -mlmositeI iJollteM melillte nephelinlhm mlmositeN nephellnlte0 alkalic oIi v in e bas al tto trachyandesite
0 KOLOA
\J HONOLULU
1.0 1.5 2.0
wt. % K 2 0
47.
Figure 14. Sr and K2
0 in the H~~olu1u and Koloa
Series, and similar Hawaiian lavas.

48.
to differentiation in most igneous rock suites and that the
"normal" value of 240 has little meaning.
Gunn (1965) reports that forty-one samples of a dif
ferentiated Antarctic tholeiitic dolerite have a constant
K/Rb ratio near 240. Two series of continental alkalic
basalts from Antarctica and New Zealand have K/Rb ratios of
335 and show no change in the K/Rb ratio.
Gast (1965) has shown that lavas from Gough, Ascension
and St. Helena Islands show an increase in K/Rb ratios with
decrease in K concentration. The same is shown for some
oceanic tholeiites.
Morse and Davis (1966) have shown a strongly increasing
K/Rb ratio with increase in K for the Kig1apait layered
intrusion, Labrador.
In light of the variety of results noted above, it
appears that the only safe generalization that can be current
ly made about K/Rb ratios is that anything is possible.
Present Research. The distribution of Rb relative to K
for the Hawaiian and Samoan islands is shown in Figure 15.
Data for the Waianae volcano are denoted with different
symbols, showing the distribution of a single volcano in
relation to the data for all Hawaiian volcanoes. Three
Samoan lavas show K/Rb ratios of 800 to 1,500. These are not
low-K tholeiitic basalts; they are alkalic lavas with 0.8 to
1.3% K. Other Samoan lavas show ratios within the range of
Hawaiian lavas, or between 300 and 650.

49.
Data for individual volcanoes are shown in Figures 16
to 21. Figure 22 shows data for the Koloa and Honolulu
series together with that for the Hana and Kula series (East
Maui).
In the Waianae"volcano there is indication of a slight
change in K/Rb ratio at about 1.3% K, with a definite change
to 291 in the Mauna Kuwale rhyodacite. This is the only
evidence found in this research of a systematic change in
K/Rb ratio in a single volcano. The lower K/Rb ratio of the
Mauna Kuwale rhyodacite is considered to be due to extreme
low pressure differentiation.
East Maui (Haleakala) shows a spread of K/Rb values in
the Kula series that is well outside the analytical limits of
error (Figures 19 and 22). Figure 19 shows an interpretation
of these data.
Kauai has a K/Rb ratio of around 450 for the shield
building lavas, as opposed to 300 for the Koloa series. Due
to the special nature of the Koloa series this difference is
considered due to a process such as that outlined by O'Hara
(1965) for the generation of melilite basalt, nephelinites
and leucite nephelinite.
In the following paragraphs the "constancy" of the K/Rb
ratios will be discussed. Here "constancy" is used to mean
that few, if any, of the data points fall more than two sigma
(two standard deviations as computed from analytical data)
off the mean K/Rb ratio for one volcano. Note that this

100 t~
~
~
050~
0
o tGJ1Ii&& 0
I
20 ~0
•I
00&/r:oo Ql •ppm Rb ~
•• M&
10
o 0
& "
0/~OOO: 0
a tholeiitic)
5 rHAWAII (alkalic ValcaRa .Oa"u
& Walana.o 0
o otll.,.00 0
SAMOAZ I-YlIYo 0 000
•1
0.05 0.10 0.10 0.50 LOO "z.oo 5.00
Wt.~ K
Figure 15. Relation of K to Rb in lavas of the Samoan
and Hawaiian Islands.VIo

20 ~O.0 4;)
•a:: 15 ~'O
.+'E 10Q.Q.
•5
51.
.06 .1 .15 .2 .5
wt. % K
1.0 1.5 2.0
Figure 16. Relation of K to Rb in lavas of the
Waianae volcano, island of Oahu.

52.
Mauna ,•Kuwait,
// 00, ~
•/ ~~
/ +'
•
••
2 ••
5
50
100
~20
0:15
E •a. • •a- 10
.15 .2 .5 1.0 1.5 2.0 3.0
wt. °/~ KFi gure 17. Relation of Rb to K in lavas of the
Koha1a volcano, island of Hawaii.

53.
100
•2 - I I I I I
.I .15 .2 .5 1.0 1.5 2.0 3.0
wt. °/0 KFigure 18. Relation of Rb to K in lavas of the
West Maui volcano, island of Maui.
50
'1)0Ol
20 ~.a ~'Qa:: *-'15
EG. 10 •G. •••
•5

54.
2 •',. l-
.15 .2 .5 1.0 1.5 2.0 4.0
wt. % K
!:so
90
•20
.a 15 ",0
a: .'" +;,0~"O10 ~, (b
E •~"O
Go
"'"'Q.
5 • •
Figure 19. Relation of Rb to K in lavas of the
East Maui (Ha1eakala) volc~no, island of Maui.

55.
90
50
20
15
EG. 10G.
K/Rb· 385
1.5 2.0 4.01.0.52 .........__.Ao-....._.Ao-..................._ ...._ .........-...._
.15 "2
wt.O/o KFigure 20. Relation of Rb to K in lavas of the
Mauna Kea volcano, island of Hawaii.

56 •
.c0.:
• KOLOA
.6 OTHERS
1.5 2.0 3.0.5 1.0
wt. % K
3 _ .-..__ _
.15 .2
Figure 21. Relation of Rb to K in lavas of the
island of Kauai.

57.
+oJ:» +a:
ECLCL
• KOLOA
• HONOLULU
0 HANA
+ KULA
.2 .5 1.0 1.5 2.0 5.0
wt.% KFigure 22. K/Rb ratios in lavas of the Koloa,
Honolulu, Hana and Kula series.

58.
allows for 10% of the points to fall outside these limits
when the sample population is infinite and with too present
limited populations, more than 10%.
The variation in the K/Rb ratio between individual
volcanoes is often outside the limits of analytical uncer
tainty. The following computations are based only on samples
with more than 10 ppm Rb and an average two sigma of ± 20% for
the K/Rb ratio. The one basic assumption is that there
exists only one K/Rb ratio for each volcano or group of lavas
of interest. The equation (% uncertainty of an individual
sample) VN-l = (% uncertainty of the average), where N =
number of samples, is used for computation. For Kohala with
5 samples the % uncertainty of the average is 10%; fOT the
Waianae volcano with N=27 the uncertainty is 3.9%. Other
volcanoes have intermediate uncertainties of the average K/Rb
ratio.
Computed in the above fashion the results are as follows.
The difference of 90 between the K/Rb ratios of Kohala and
West Maui is greater than the combined uncertainty of 50.
The difference of 60 between the Kohala and Waianae volcanoes
is about equal to the combined uncertainty of 50. The
Waianae and West Maui volcanoes differ by 30 in their K/Rb
ratios, which is midway between the 95% and 67% limits of 42
and 21. For East Maui the inferred ratio of 650 differs by
320, or about twice the 95% limits, from the other ratio of
330 for the Hana series. Figure 22 shows an average K/Rb

59.
ratio of 300 ± 55, or 18%. This is very close to the above
± 20% for the analytical uncertainty. The 95% limits on the
ratio are ± 4.3%, or 13. This is computed on the Honolulu
and Koloa series lavas alone and separates them, as well as
similar lavas, from all volcanoes except Kohala.
Note then the above computations include few tholeiitic
basalts. Hawaiian tholeiitic basalts commonly have less than
10 ppm Rb so that the analytical uncertainty in the K/Rb
ratio is much greater than 20%, and resolution of inter
volcano differences in the K/Rb ratios is impossible. How
ever, judging from the symmetrical distribution of data points
around the average K/Rb ratio, there is little change in the
ratio at ib concentrations of 10 to 2 ppm.
The constancy of the K/Rb ratio for individual Hawaiian
volcanoes, but its variation between volcanoes, means that
all comments of Green and Ringwood (1966) concerning the
increase of K in the alkalic olivine basalts, with respect to
olivine-rich tholeiites, also hold for Rb. This constancy
and the inter-volcano variations also suggest than any phase,
or phases, in the mantle under the Hawaiian Islands contain
ing K and Rb must have a K/Rb ratio similar to that of the
magma produced or, perhaps more important, be able to produce
a constant, yet individual, K/Rb ratio in the magma of any
one volcano. Note that these and following remarks do not
apply to the Honolulu and Koloa series lavas, or to other
post-erosional lavas. These lavas have a K/Rb ratio of 300

60.
± 50 and show no inter-volcano variations.
This constancy of the K/Rb ratio in anyone volcano but
the variation of the ratio between volcanoes puts a limita
tion on that portion of the general scheme of Green and
Ringwood which attempts to explain the great increases of such
elements as Sr, P, Rb, K, etc. in passing from olivine-rich
tholeiites to alkalic olivine basalts. This limitation is
that selective enrichment of K and Rb must not change the K/Rb
ratio more than allowed by the present data. The importance
of this limitation is obvious if the variations in K/Rb ratio
between volcanoes is taken as evidence of heterogeneity of
Rb, K, and K/Rb in the source regions. If the variations in
K/Rb ratios between volcanoes are due to the magma-generating
process, the restriction still holds. The recent Sr isotope
data of Powell (1966) require the same restriction for the
Waianae volcano and the Honolulu series.
D. Nickel and Cobalt
Past Research. There are few good nickel data for
Hawaiian lavas in the literature. Data are found in Turekian
(1963), others in Nocko1ds and Allen (1954 and 1956), a few
in Wager and Mitchell (1953), and Macdonald and Eaton (1964).
Nocko1ds and Allen have the largest body of data, which have
been cross-checked with that of Turekian and found to agree
to within 10%. The eight Ki1auean lavas reported by Macdonald
and Eaton (1964) have been reanalyzed in this research and the

61.
Ni data listed in Appendix A.
Of the above reports, only that by Turekian gives no Co
data.
Notable sets of Ni and Co data for non-Hawaiian samples
are those by Wager and Mitchell (1951) for the Skaergaard
intrusion, by Gunn (1966) for some Antarctic tholeiites, and
by Engel and others (1965) for some submarine basalts. All
sets of data show the usual increase of Ni with increase in
MgO and olivine. Some of these data will be discussed along
with the new data.
A short paper by Merlino (1965) is notable for his
application of crystal field theory to some of Turekian's
data. The data are Cr and Ni concentrations in some Salt
Lake garnets and pyroxenes separated from nodules. The basic
conclusion is that the hypothesis of Yoder and Tilley (1962)
that the alkalic and tholeiitic suites are derived by the
fusion of varying proportions of garnet and alkali-rich
pyroxene is in serious doubt.
Present Results. The Ni data for all Hawaiian lavas are
plotted against MgO in Figure 23. The relationship is more
or less semi-log above Ni concentrations of about 150 ppm
and MgO concentrations of 7.0%. The Kohala and Waianae
volcanoes, Figures 24 and 25, show good semi-log plots up to
about 11.0% MgO. The three most deviate samples of the
Waianae volcano, C-169, 134, and 52, are all hawaiites. They
may represent the crystallization of olivines more iron-rich

62.
2,000
••
1.000
800
•: ..
•
•••
Honolulu ond Koloo Sui.. , plUlbOlonll.. ond balOlIllol dl frOlllo'her Howalion volcallo.l .
How 011011 lovol 110' III tIlt above
llroup .•
•••
•
• • •••• •9.· ."'...! ••• ••
••
•
•....• •••• y....( .... . ....
• •..:~ ,t·.' ••.r
••••• •••• ••
•
•
60
80
100
200
600
400
ECLCL
z
•
40
20
• •
3.0 6.0 9.0 12.0
W t. ,.IS.O
MgO18.0 21.0
Figure 23. Relation of Ni to MgO in lavas
of the Hawaiian Islands.

400
300
z200
EQ.Q. 150
100
80
63.
5.0 7.0 9.0
wt. % MgO11.0
Figure 24. Relation of Ni to MgO in lavas of the
Kohala volcano, island of Hawaii.

1,000
800• C-119 •
64.
600
400
• C-IS4• C-52
••
Z 200 •
•Ea.a.
100
80
60
40
2.0 4.0 6.0 8.0 10.0 12.0 14.0
W t. % MgO
Figure 25. Relation of Ni to MgO in the
Waianae volcano. island of Oahu.

65.
than those of tholeiitic basalts. The graphs for W~st Maui,
Mauna Kea and Kauai, Figures 26, 27 and 28, all show a gentle
flexure at about 10% MgO, suggesting that the Kohala and
Waianae volcanoes would also show this feature if samples of
greater MgO content were analyzed.
Above 10-12% MgO the MgO and Ni contents seem due to
settling of early-formed olivine crystals. This is ~uggested
by the extrapolation of the upper part of the curve to near
the Ni and MgO contents of Hawaiian olivines. Below this
MgO concentration a more complex set of controls, involving
extensive reactions of olivine with the melt, probably keep
the melt and olivines in some semblance of equilibrium.
Murata and Richter (1966) also suggest 10% MgO as tpe divid
ing line for olivine-enriched and olivine-depleted magmas.
The Koloa series show lower Ni concentrations for com
parable MgO concentrations than do the non-Koloa samples of
Kauai. This is consistent with O'Hara's scheme for the
origin of melilite basalt, nephelinites and leucite nephe
linites. This part of the scheme is based on unpublished
data by O'Hara and Yoder, which show that the precipitation
of olivine and spinel in this intermediate pressure regime,
in place of garnet, selectively removes Cr, Ni, Co and V
from the residual liquids. Co and V do not show this
feature and will be discussed further later. Figure 28 shows
that this difference in Ni concentration is valid in a
general way for the Honolulu and Koloa series, as it is also

',000
800
600
400
z
E 200Q.
Q.
100•
80
60 ••
404.0
./-./
8.0 12.0 16.0
wt. tJ. MQO
66.
Figure 26. Relation of Ni to MgO in the West Maui
volcano, island of Maui.
1,000
800
600
400
•
•
67.
8.0 12.0
W t. % M gO16.0
Figure 27. Relation of Ni to MgO in lavas of the
. Mauna Kea volcano, island of Hawaii.

1,500
..I'~~~ ~ ••
600
Z 400
ea.a.
200
1 ://• non-Koloa
• Koloa, Ir
100
60· I , , , I I , I I I I , I I I I I
5.0 10.0 15.0 20.0
wt. % MgO
Figure 28. Relation of Ni to MgO in lavas of the island of Kauai.
0\00

69.
for similar lavas from other Hawaiian volcanoes, in relation
to data for all Hawaiian lavas.
O'Hara also points out that the precipitation of peri
dotite nodules containing clinopyroxenes such as those
reported from peridotite nodules in basalts (Ross and others,
1954) must cause an increase in total alkalies in the resi
dual liquid and a decrease in the K/Rb ratio. This decrease
in the K/Rb ratio has been found for the Honolulu and Koloa
series and similar lavas.
The distribution of Co is very closely linked with that
of Mg, as can be seen in Figure 29. The interesting feature
of this distribution is that the Honolulu and Koloa series
samples plot along with the rest of the samples. The one
exception is HIG-5, a Honolulu series sample which seems
more related to C-124 and C-126. The latter two samples are
alkali.c basalts from thLHonomanu series of East Maui.
Figure 30 shows a comparison of data from Engel and others
(1965) and From Gunn (1966) with Hawaiian data. With the
possible exception of one or two samples, the data of Engel
and others are consistent with the main body of Hawaiian
data. The data for Antarctic tholeiites show two samples
consistent with the main bodyoc Hawaiian data, but three are
more consistent with C-126, C-124 and HIG-5. This suggests
that it is also possible to draw a second curve above the
first one. This is not surprising as other data plots for
Hawaiian volcanoes have also shown two different trends, in

70~
particular that for East Maui.
It is interesting that the Antarctic tholeiites show
differences similar to those of at least one Hawaiian
volcano. The Antarctic samples are from sills which were
assumed to have differentiated in place.
The main distribution of Co and Mg, and the secondary
one, may be explained if it is assumed that in the latter
case either the olivines were more iron and/or cobalt rich
or the melt was more cobalt rich. The factors presently
known to yield more iron-rich olivines are lower temperatures
of crystallization and higher ratios of Fe+2 to Mg and/or
_Fe+2 to Fe+3 in the melt. As more iron-rich olivines are
also more Co rich, this would give more Co-rich olivines.
If the samples falling along the implied secondary curve had
higher ratios of Fe+3 to Fe+2 in their melts, this could have
inhibited the formation of olivine, which in turn can result
in cobalt not being removed from the melt. This nonremoval
could have caused the higher cobalt concentrations found for
some samples. This process is favored for reasons given in
the following paragraph.
Tilley, Yoder, Jr. and Schairer (1964) have shown that
the presence or absence of olivine on the liquidus of a
Hawaiian sample is very dependent on the Fe+3/Fe+2 ratio, the
greater the ratio the less the olivine. Samples C-124 and
C-126 have higher Fe+3/Fe+2 ratios than the average alkalic
basalt given by Macdonald and Katsura (1964). HIG-5 and C-43

71.
have high Fe+3/Fe+2 ratios, as. does C-3l, and are the most
iron-rich samples in the current study. The deviate samples
from Gunn also show higher than normal Fe+3/Fe+2 ratios,
except the one tighist in Co, which is a hypersthene gabbro.
Other samples also have high Fe+3/Fe+2 ratios but do not show
the higher Co concentrations. Perhaps in these samples there
was not time for the increased concentration of Fe+3 to alter
the Co concentration.
It was mentioned earlier that Co does not show the
lower concentrations in the Honolulu and Koloa series that
O'Hara's scheme indicates. This may be due to the removal
of all traces of this feature by a later reaction.
Figure 31 shows Co plotted against Fe and an interpreta
tion of the paths of differentiation. The lines are drawn
on the basis of the general behaviors of the samples on an
AFM diagram. The short left line is drawn through data for
tholeiitic samples that trend directly toward the A-F side of
the AFM diagram. The right line is drawn through data for
normal alkalic ·samples. The samples with 20-25 ppm Co are
hawaiites. HIG-5 and C-43 may belong to a trend that joins
the right one in the hawaiite region.
E. Vanadium
Past Research. Published vanadium data for Hawaiian
lavas are limited to those in Wager and Mitchell (1953), in
Nockolds and Allen (1954 and 1956) and in Macdonald and

72.
100
x
• C-118
8"18-5
.C-11460
eo
•40 •
0U •
= Waianae
E • We.t Maul~ •~ E alt Maul
x Honolulu a Koloa
20 e al marked
10 • "18-7
8
0.0 4.0 8.0 12.0 16.0 20.0
wt. % MgO
Figure 29. Co and MgO in some Hawaiian lavas.

73.
100A
line taken from
Flourl 29
• Data from EnOl1 and othln.
1965. Data normallzld to
W-I- 42 ppM Co.
A Antarctic tholillt.. - Gunn. 1966
Data normallzld 01 abovi.
• C-12 6
9HIG-5
••• ••
• C-124
A A.C-43
.C-31·
••
A
60
80
20
40
EQ.
Q.
oU
10
8
0.0 4.0 8.0 12.0
wt. % MgO
16.0 20.0
Figure 30. A comparison of the relationship of Co and
MgO in some samples of Hawaiian lavas
with that in" rocks of other region&

100
80
60
o 40
U
EQ.Q.
20
• Waianae
• Welt Maui
• Ea,t Maul
•
•x
••
•
••
• "Itl-I
.C-48
10"'1-1
I I I I I
2.0 4.0 6.0 8.0 10.0 12.0 14.0 16.0
total Fe as(w t. %)
FeO
Figure 31. Co and Fe in some Hawaiian lavas.......-Il'-

75.
Eaton (1964).
Vanadium data are given by Gunn (1966) for some
Antarctic tholeiites and by Engel and others (1965) for some
submarine lavas. These data are plotted and discussed with
the new data for Hawaiian lavas.
Present Research. Figure 32 shows that V and Ti are
weakly covarient in Hawaiian basalts and the Honolulu and
Koloa series,. In the hawaiites they are strongly covarient.
Note that the Honolulu and Koloa series have some of the
highest V concentrations, the opposite of what O'Hara's
scheme indicates. As for Co, this may be due toa later
reaction having removed the V distribution features of the
earlier one.
Figure 33 shows that the distributionoc V and Ti in
Antarctic thaleiites is an extension of that in submarine
low-K tholeiites, with the exception of a pegmatoid. Alkalic
basalts of the East Pacific Rise plot in the same region as
HIG-8 and many other Hawaiian alkalic basalts.
The V and Ti data will be left for the present and dis
cussed later along with the Zr and K data.
F. Zirconium
Past Research. Published zirconium data for Hawaiian
lavas are limited to the same reports as the vanadium data.
As with Co, Ni and V, the Zr data from Gunn and from Engel
and others are compared with the new data.

• Waianae
• West Maul
• East Maul
x Honolulu a K 0100
e os marked
500.
400
300
>200
EC-
o. 150
100
80
60
• C-4 3
0.0 1.0 2.0 3.0 4.0 5.0 6.0
Figure 32.
wt. % Ti0 2
V and Ti02 in some Hawaiian lavas.......0\

500
•400 •
+--Iine from Figure 32
6.05.0
submarine tholeiitic
basalts
Antarctic tholeiites
Gunn, 1966
East Pacific Rise
alkalic basalts
A
4.03.0
••
C·
Engel and •o the rs , I9 6 5
•
•
2.0
•300 ~ ••
•• •
> I A200
E I A A.Q.
Q. 150
A
100
80
60
0.0 1.0
wt. % Ti0 2
Figure 33. A comparison of V and Ti02 in Hawaiian lavas
and some similar rocks. -...J-...J

78.
Present Results. Zirconium and potassium have been
plotted in Figure 34. One of the interesting results of
this is that the East Pacific Rise alkalic basalts plot along
with Hawaiian hawaiites. This is similar to the way these
same samples plotted on the V vs. Ti graph. Samoan alkalic
lavas, from picrite-basalt to hawaiite, plot nearby. Low-K
tholeiites sometimes plot with Hawaiian tholeiites but more
often show much lower Zr concentrations, similar 0 the Zr
concentrations of some Antarctic tholeiites. The latter
show K concentrations very similar to those of Hawaiian
alkalic lavas but much lower Zr concentrations. Note that
the tholeiitic nature of these samples has not altered the
form of the Zr vs. K distribution.
The Honolulu, Koloa, Lahaina and Hana series lavas have
Zr values intermediate between those of the Antarctic tholei
ites and most Hawaiian lavas. East and West Molokai lavas,
as well as some other Hawaiian samples and some East Pacific
Rise lavas, plot along with the Honolulu and Koloa series.
It is possible to draw a second curved line through these
samples. The Zr concentrations along this undrawn line are
about one half those of samples along the drawn line. While
these lines can be drawn it is perhaps more correct to des
cribe the covariance of Zr and K by a family of curves
similar to the drawn one and differing only in their Zr con
centrations.
Both O'Hara and Green and Ringwood have developed schemes

2,000 • Hawaii (Honolulu, Koloa, Lahaina, 8 Hana)
• East 8 W..t Molokal
• Other HawaIIan lovas, alkalic 8 tholeIItic
•
•••
East Pacific Rise - alkalic baSalts). Engel, et. a!.
Submarine tholeIItic basalts 1965
Samoa
• • .1.A A
-: A A• _ • ._..ar--_- ~. A A... ~A. . , . A
~.• ..___..... -... •• A AI.
i. J.. .. • \.- • • • • A
• ••• A A
X X A
X III. A
XA
X X A A
MA
A Antarctic tholeiites - Gunn, 1966
oX
5
70
150
100
300
600
1,000
E~
Q.
~
N
40, , T , , , , , , , , , .."", , , , , , ,
.04 0.1 0.3 1.0
wt. % K 2 03.0
Fi gure 34. Zr and K2
0 in some alkalic, tholeiitic
and poit-erosional samples.-...J\0

800
600
4000 t:.~..
~ •N .....E 200 I .0 %
•0. •0. •• • •••••• • ,. •- • 00.. •••
100 • lower member
80 0 middle member
• upper member
60
400.1 0.2 0.4 1.0 2.0
wt. % K20
Figure 35. Zr and K2
0 in the Waianae volcano,
island of Oahu.
80.

81.
showing how it may be possible to get a wide range of magma
types by varying either the conditions of initial generation
or subsequent differentiation. Except for one low-pressure
thermal barrier, both schemes can give a continuous spectrum
of magma types or element distributions. The Zr vs. K dis
tributions shown in Figure 34 may be an indication that such
schemes are basically correct.
Figure 34 may be an indication of large variations in
Zr concentrations in magmatic source materials. This idea
is particularly well illustrated in the Hawaiian data, where
two source materials may exist. Alternatively, the two
parallel lines that can be drawn through the Hawaiian Zr and
K data may indicate two predominant paths of differentiation,
one for normal tholeiitic and alkalic basalts and one for
the post-erosional lavas and some otherwise apparently normal
alkalic and tholeiitic lavas.
On an earlier page it was pointed out that some East
Maui samples mapped as Kula resemble the Hana lavas in K/Rb
ratio. These same samples plot along with Hana lavas on the
Zr vs. K graph. The samples are: C-135, C-141, C-143, C-146
and C-147.
~igure 35 is similar to Figure 13 except that a middle
member hawaiite plots with the upper member samples, which
are also hawaiites. The one upper member tholeiitic basalt
again plots along with the lower member. The most important
feature of this graph is the smooth covariation of Zr and K

Here salient features will
82.
in the Waianae volcano. This feature is common for all
Hawaiian volcanoes and all elements studied and is perhaps
the most important single result of this research.
G. Post-erosional lavas
These lavas have been discussed at various points in
preceding parts of this report.
be collected and restated.
The close similarities of these lavas are perhaps their
most important feature and indicates a common mo~e of origin.
Perhaps the second most important feature of this group
of lavas is that the distribution pattern of any element
pair is very similar to that for tholeiitic and alkalic lavas
in general. This indicates that many of the chemical re
actions associated with these lavas are only quantitatively
different from those associated with tholeiitic and alkalic
basalts.
The Koloa series of Kauai is clearly linked by its Sr
and P distributions to the other lavas of that volcano in
the same manner that the tholeiitic and alkalic lavas of any
one Hawaiian volcano are related (see Figure 5). For East
and West Maui volcanoes, the Hana and Lahaina series lavas
plot along with the other lavas and are not separately noted
on the Sr vs. P graphs of these volcanoes. This indicates
that the genesis of these lavas is closely linked to that of
the other lavas of these volcanoes.

83.
Figure 10 shows that the Sr vs. CaO distribution of
these lavas overlaps Hawaiian and Samoan alkalic lavas
extensively and Hawaiian tholeiites slightly.
In conclusion, the post-erosional lavas are commonly
distinct from, but related to, the other lavas of the volcano
on which they occur. Post-erosional lavas of Hawaiian
volcanoes are often more similar chemically to one another
than to other Hawaiian lavas.
II. Conclusions
Perhaps the most potentially fruitful conclusion is that
the similarities and differences of Hawai~an lavas are more
important in understanding their origins than are their
alkalic or tholeiitic classifications.
The most significant feature of the data presented in
this report is the repeated occurrence of smooth covariations
of such e1.ement pairs as Sr-P, Zr-K and Ni-Mg in individual
Hawaiian volcanoes and the indifference of these covariations
to the alkalic or tholeiitic classification of the samples.
Even the post-erosional lavas show more similarities than
differences when compared with other lavas. From this I
conclude that the lavas of anyone Hawaiian volcano have
closely interrelated origins.
Not surprisingly, each Hawaiian volcano is somewhat
different from all others. This is not a new conclusion,
but we now have data orr the existence and extent of some

84.
more differences. At present little correlation is known
between the chemical and physical features of Hawaiian
volcanoes. Further study could give correlations or could
show that the two aspects are basically unrelated in indi-
vidual volcanoes.
Some Hawaiian volcanoes, for example Waianae and Kohala,
have been uni-modal in their chemical variations, and hence
in th~ way they operated. Others 'such as East and West Maui
have been either less consistent or multi-modal. The Sr-P
data for East and West Maui volcanoes suggest that factors
external to either volcano were important in controlling at
least the Sr-P covariations.
The distributions of some trace elements, for example
.'Sr, Ni and Co, are a function of the concentration of single
mineral phases.
The behavior of Zr and K indicates that the distribution
of Zr in the rocks studied is in some presently obscure way
related to the K concentration.
The Co-Mg data indicate that oxidation of the iron can
occur early enough to alter the "normal" Co-Mg distribution.
This seems to take place before extensive olivine crystalli-
zation.
There are significant variations in the K/Rb ratio
between individual Hawaiian volcanoes. This may indicate
heterogeneity of one or both of these elements in the source
region of Hawaiian magmas or variations of the conditions

85.
under which Hawaiian magmas were generated. However, the
constancy of the K/Rb ratio in the post-erosional lavas may
indicate the opposite for these lavas.
The concentrations of Sr, Rb and K are usually a func
tion of the period in a volcano's eruptive cycle when the
lavas are erupted. Zirconium and vanadium are functions of
rock type while Co and Ni are so associated with olivine
that this relationship may have wiped out other possible
features, excepting oxidation of iron.
The last conclusion is that the Hawaiian petrogenesis
problem is still very much in the definition stage.

86.
APPENDIX A
In this appendix are the raw data from the emission
spectrographs and x-ray spectrometers. Eighty to ninety
percent of the x-ray fluorescence values are single analyses,
with the rest duplicates. Duplicate analyses are not noted.
The precision for the Sr values is two sigma = ± 5%.
For the Zr and Ni values two sigma = ± 10%, except above 500
ppm Ni where ± 15% is a better estimate. All emission spec
trographic values have two sigma ± 15%. Precision is
variable for Rb (see method).
The x-ray fluorescence Zr values are enclosed in paren
theses: the emission spectrographic ones are not. Dashed
lines denote no analysis. Asterisks denote that the element
was below the detection limits. The detection limits are:
10 ppm Ni, 2 ppm Rb, 5 ppm Co and 25 ppm V. The detection
limits for Co and V may be high and have not been carefully
checked.

87.
APPENDIX A. RAW DATA
Waianae Volcano, Island of Oahu
Lower Member
SampleNo. Rb ppm Sr ppm Ni ppm Co ppm V ppm Zr ppm
C-1 4 338 43 263 135C- 2 3 332 49 312 134C-3 8 374 210 37 247 161
C-4 359 235 45 350 158C-5 5 373 245 42 291 179C- 6 4 339 767
C-7 4 361 50 262 133C-8 2 386 41 250 122C- 9 4 376 45 294 148
C-10 8 405 42 251 149C-11 6 403 292 45 266 165C-12 4 360 142 45 238 194
C-13 4 365C-14 6 345 188C-15 5 331 47 255 128
C-16 8 425 138C.. 17 7 362 303C-18 7 398 44 195
C-19 6 350 185 49 267 142C- 20 5 375 39 293 197C- 21 3 316 190 47 256 156
C- 22 4 404 150 50 270 155C- 23 6 425 188C-24 8 405 208 39 282 200
C- 25 6 385C-26 6 381 142C- 27 11 356 142 42 140
C- 28 2 383 46 267 205C.. 29 47 294 139C-33 6 363 135
C-34 7 363 105 44 327 145C-35 7 365 170 49 291 143C-36 8 374 134 43 286 160

88.
Waianae Volcano, Island of Oahu (continued)
SampleNo. Rb ppm Sr ppm Ni ppm Co ppm V ppm Zr ppm
C-37 11 368 103 35 327 169C-38 6 316 --C-39 9 350 138
C-40 8 348 142 38 333 161C- 41 6 345 132 41 259 (160),139C-46 13 432 152 338 (165)
Middle Member
C-47 16 665 165 51 302 (203),210C-48 14 575 74 (220)C-49 10 475 314 (142)
C- 50 8 528 521 55 240 (215),184C-51 11 415 212 42 (137),139C- 52 21 690 339 45 (273),380
Upper Member
C-30 33 827 231 50 275 261C-31 21 985 52 44 274 (238) ,256C-42 26 780 86 (245)
C-43 47 469 280C-134 26 708 355 43 352 (205)C-169 23 735 723 51 286 (250)
C-170 26 960 ** 28 265 (300)C-171 25 936 ** 25 230 (315)C-172 25 934 28 260 (265)
C-173 27 975 ** 27 247 (313)C-174 33 900 -](* 29 245 (335)C-175 31 872 ** 29 273 (335)
C-176 28 880 ** 28 282 (340)C-177 27 863 ** 26 245 (302)C-178 44 915 ** 17 162 (370)
C-179 41 895 ** 20 180 (390)C-180 40 935 ** 27 220 (322)C-181 43 894 ** 18 196 (410)
C-182 45 895 ** 22 227 (368)C-198 10 402 207 47 284 (135),139

890
Koha1a Volcano, Island of Hawaii
Po101u Series
SampleNoo Rb ppm Sr ppm Ni ppm Co ppm V ppm Zr ppm
c- 53 6 308 137 (160)C-54 4 274 180 (145)C-55 265 317 (125)
c- 56 308 165 (138)c- 57 338 95 (167)C-58 248 265 (125)
c- 59 2 299 112 (130)c- 60 270 142 (118)c- 61 2 273 176 (142)
c- 62 304 113 (133)c- 63 6 302 132 (140)c- 64 3 280 125 (120)
c- 65 3 365 93 (203)c- 66 8 303 167 (llt.2)
Hawi Se ries
C-70 32 540 115 (348)c- 69 17 596 95 (230)c- 68 58 1,294 ** (485)
c- 210 48 1,670 ** -- (370)c- 211 (355)c- 212 47 1,700 ** (333)

90.
Mauna Kea Volcano, Island of Hawaii
Hanakua Series
SampleNo. Rb ppm Sr ppm Ni ppm Co ppm V ppm Zr ppm
c- 77 12 490 215 (248)C-78 11 323 302 (205 )c- 76 7 354 582 (152)
C-75 11 468 270 (215)C-74 3 454 75 (208)c- 71 13 461 350 (172)
c- 67 15 479 435 (185)
Laupahoehoe Series
c- 72 46 1,280 ** (455)C-73 51 1,170 ** (535)c- 79 43 1,294 ** (445)
C-201 37 1,245 (447)C- 202 17 575 (215)C- 203 484 113 (175)
C- 204 40 1,245 ** (437)C-205 12 578 82 (230)C- 206 43 1,210 ** (530)
C- 207 23 608 74 (260)C- 208 60 970 ic* (1,310)C- 209 8 385 798 (120)

91-
Kauai Volcano, Island of Kauai
Waimea Canyon Series
SampleNo. Rb ppm Sr ppm Ni ppm Co ppm V ppm Zr ppm
C-80 4 304 173 (150)C-81 5 292 190 (150)C-82 7 299 148 (152)
C-83 9 294 135 (130)C-84 177 1,440C-p", 9 327 85 (160)
C-86 5 323 178 (155)C-87 8 262 1,240 (107)C-88 11 408 692 (130)
C-89 7 255 515 (103)
Koloa Series
C- 90 14 522 672C- 91 27 477 342 (140)C-183 60 1,470 ** 26 144 (350) ,325
C-184 25 550 645 70 323 (128)C-185 34 668 207 46 322 (145),162C-186 41 695 490 66 340 (168)
C-187 30 658 438 56 293 (138),124C-188 28 610 303 52 325 (115),134C-189 36 752 857 58 330 (185),168
C-190 14 638 462 64 351 (162),174C-191 42 785 400 51 284 (150),166C-192 59 1,340 112 39 323 (260),244
C-193 23 551 388 56 "308 (117)

92.
West Maui Volcano, Island of Maui
Wailuku Se ries
SampleNo. Rb ppm Sr ppm Ni ppm Co ppm V ppm Zr ppm
C- 93 5 322 162 50 295 195C- 94 3 352 275 50 288 158C-95 8 335 173 50 291 140
C- 96 6 303 295 46 264 155C- 97 265 58 251 159C-98 5 325 228 43 273 131
C- 99 5 322 120 46 275 127C-100 8 310 262 56 271C-101 39 294 164
C-102 2 338 230 51. 257 154C-103 2 271 512 59 257 138C-104 2 298 286 291
C-105 3 270 840 68 223 122C-106 2 327 193 50 282 136C-107 379 166 48 356
C-108 2 268 672 69 250 129C-109 10 475 90 40 293 247C-110 9 .378 130 44 274 157
C-111 7 355 79 42 347 203C-112 5 428 522 61 275 175C-113 5 410 202 43 298 189
C-114 6 575 90 40 342 (208),208C-117 9 404 525 68 255 141C-118 262 972 76 245 118
C-119 10 504 52 48 313 187C-120 5 355 518 65 280 118
Hono1ua Series
C- 92 58 1,090 ** ** ** (748)C-116 72 416 ** ** **C-128 68 528 ** ** ** (950)
C-149 57 1,126 ** ** ** (725 )C-150 50 1,165 ** ** ** (705)C-151 54 1,060 ** ** ** (805)

93.
West Maui Volcano, Island of Maui (continued)
SampleNo. Rb ppm Sr ppm Ni ppm Co ppm V ppm Zr ppm
C-152 56 1,054 ** ** ** (722)C-153 9 492 62 34 243 (288)C-154 58 419 ** ** ** (828)
C-155 51 1,227 ** ** ** (677)
Lahaina Series
C-115 46 795 395 57 262 189C-130 14 387 521 65 304 (104),109
East Maui (Ha1eaka1a) Volcano, Island of Maui
Honomanu Series
C-123 1 308 1,210 80 308 (143),152C-122 5 238 780 70 243 (100),102C-124 5 490 68 59 318 (233),178
C-125C-126 5 378 340 90 250 (165),160C-121 2 338 265 59 318 (310) ,204
Kula Series
C-127 34 945 ** 24 158 (318)C-135 42 505 (245)C-137 (300)
C-140 26 575 (260)C-141 71 770 ** (450)C-143 41 1,085 ** (250)
C-144 31 940 ** (317 )C-145 23 1,095 ** (263)C-146 49 1,085 ** (270)
C-147 40 980 13 (235)
Hana Series
C-129 27 505 352 64 340 (157),143C-136 (158)C-138 (210)
C-139 41 880 (212)C-142 34 770 43 (202)C-148 (195)
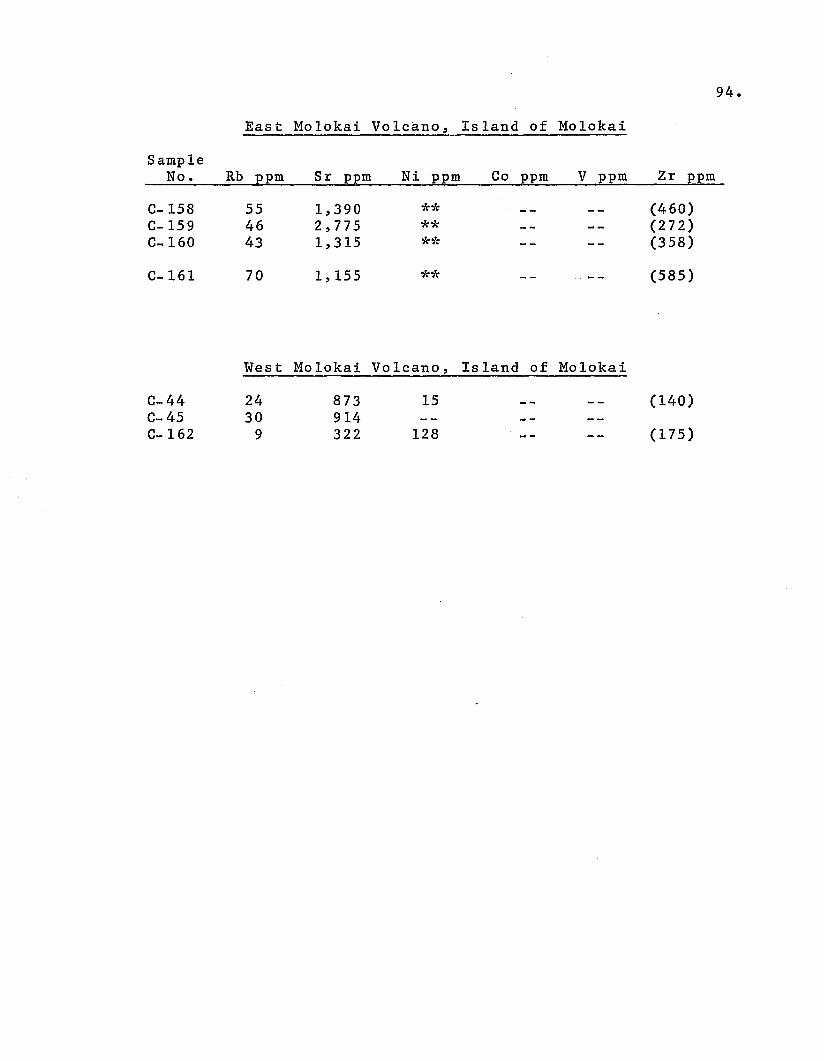
94.
East Mo1okai Volcano, Island of Mo1okai
SampleNo. Rb ppm Sr ppm Ni ppm Co ppm V ppm Zr ppm
C-158 55 1,390 ** (460)C-159 46 2,775 ** (272)C-160 43 1,315 *"/: (358)
C-161 70 1,155 ** (585)
West Mo1okai Volcano, Island of Mo1okai
C-44C-45C-162
2430
9
873914322
15
128
(140)
(175)

95.
Honolulu Series, Island of Oahu
SampleNo. Rb ppm Sr ppm Ni ppm Co ppm V ppm Zr ppm
C- 32 22 555 382 66 287 133C-163 10 845 475 55 281 (165),144C-164 21 599 357 54 266 (115),93
C-165 29 1,205 385 58 309 (162),146C-194 10' 473 147 41 285 (163),178C-195 42 1,210 374 56 286 (180),138
C-196 18 725 197 48 295 (130),108C-197 52 1,810 290 (242)HIGS- 5 55 1,838 231 80 250 190
Koo1au Volcano, Island of Oahu
C- 200 10 390 155 (145)

96.
Kilauea Volcano, Island of Hawaii
SampleNo. Rh ppm Sr ppm Ni ppm Co ppm V ppm Zr ppm
KI-4 10 281 1,070KI-5 10 263 1,740KI-7 8 326 809KI-8 17 349 325
1955- 9 19 391 911955-10 17 376 146
1955 Puna
1 20 385 95 377 (245)2 21 390 8"5 359 (248)3 18 390 119 352 (240)
4 17 388 91 302 (240)5 16 384 125 295 (223)6 17 395 147 307 (203)
7 14 384 146 293 (203)8 17 394 135 312 (220)

APPENDIX B. IBM 7040 COMPUTER PROGRAM
FOR COMPUTATION OF X-RAY
SCATTERING FACTORS
$IBFTC XSCAF
2 FORMAT (lH1)
4 FORMAT (48X,25H X-RAY SCATTERING FACTORS)
1 WRITE (6,2)
WRITE (6,4)
LINE=1
6 READ (5,5) ID,SIO,TIO,ALO,FE30,FE20,HMNO,
HMGO,1CAO,HNAO,HKO,PO
5 FORMAT (I6,11F6.4)
3 FORMAT (10X,I6,5H S = ,F5.3)
SSIO=SIO*1.10
STIO=TIO*1.58
SALO=ALO*1.03
SFE30=FE30*1. 79
SFE20=FE20*1.87
97.

APPENDIX B. (Continued) IBM 7040 COMPUTER
PROGRAM FOR COMPUTATION OF X-RAY
SCATTERING FACTORS
SMNO=HMNO*1.81
SMGO=HMGO*1.02
SCAO=CAO*1.76
SNAO=HNAO*0.97
SKO=HKO*1.80
SPO=PO*1.13
STOTAL=SSIO+STIO+SALO+SFE30+SFE20+SMNO+SMGO+
lSCAO+SNAO+SKO+SPO
WRITE (6,3) ID,STOTAL
LINE=LINE+1
8 IF (ID) 7,7,9
9 IF (LINE-54) 6,6,1
7 STOP
END
98.

APPENDIX B. (Continued) IBM 7040 COMPUTER
PROGRAM FOR COMPUTATION OF X-RAY
SCATTERING FACTORS
ID = sample number
. SIO = %Si0 2
TIO = %Ti0 2
ALO = %A1 20 3
FE30 = %Fe 20 3
FE20 = %FeO
HMNO = %MnO
HMgO = %MgO
CAO = %CaO
HNAO = %Na 2O
HKO = %K2O
PO = %P 2OS
SSIO, etc. are the partial scattering factors
due to individual oxides. The number to the
right of the asterisk is from Champion, Taylor
and Whittem, 1966.
99.

100.
APPENDIX C. IBM 7040 COMPUTER PROGRAM
FOR RUBIDIUM ANALYSES
$IBFTC RB
11 WRI TE ( 6 , 12)
LINE=l
12 FORMAT (lH1)
WRITE (6,13)
13 FORMAT (48X,12H RB ANALYSES)
1 READ (5,2) N,ID,BG,RB,S
2 FORMAT (I3,I6,2F6.2,7X,F3.2)
HBG=50000./BG
HRB=5 0000. / RB
Y=«HRB/HBG)-l.)*S
CEPT=0.205
SLOPE=!. 00
CRB=«Y-CEPT)/SLOPE)*(145./95.)*100.
LINE=LINE+1
WRITE (6,3) N,ID,Y,S,CRB
3 FORMAT (lOX',I5,3X,3H C- ,I3,3X,5H Y = ,F5.3,3X,
15H S = ,F4.2,3XF4.0,7H PPM RB)
IF (N) 5,5,4
4 IF (LINE-54) 1,1,11
5 STOP
END
BG = time for 50,000 counts at the background position
RB = time for 50,000 counts at the Rb K-a1pha position

APPENDIX C. (Continued) IBM 7040 COMPUTER
PROGRAM FOR RUBIDIUM ANALYSES
S = scattering factor
CEPT = intercept of the standard curve for that day's
analyses
SLOPE = slope of the standard curve
101.

102.
APPENDIX D. DETAILED EMISSION
SPECTROGRAPHIC METHODS
Three groups of samples were run on the Bausch and Lomb
spectrograph" and three on the Hilger spectrograph. Below
are given the operating conditions and techniques used with
each group. Following this is a section about the internal
normalization of the six groups of analyses. The average
emission spectrographic values for Zr, V, and Co in the HIG-
USGS interlab standards are given along with the normalized
values from each group.
Group 1. The S Series
Spectrograph:
optics.
1.5 meter Bausch and Lomb with quartz
Power supply: A Mellaphone Corp. rectifier, type ElOAP,
full wave, 230 DC volts at a maximum current of 10 amperes.
Arcing conditions: Samples were arced to completion
at 6.2 amperes. Anode excitation was used. The electrodes
were National Carbon Co. preformed graphite electrodes L395l
AGKSP (upper) and L4000 AGKSP (lower). Each sample was arced
twice on the same plate.
Photography: Kodak Spectrum Analysis -1 plates were
developed for 3 minutes 15 seconds at 26.0°C in Kodak D-19
developer, fixed for 5 minutes at26.0°C in Kodak Fixer, and
washed for 30 minutes at the same temperature. Plate calibra-
tion was by a line intensity ratio method using Fe lines.
This method differs from that given in the USGS Bulletin

103.
APPENDIX D. (Continued) DETAILED EMISSION
SPECTROGRAPHIC METHODS
1084-G, pp. 177-178, in that different Fe lines were used.
The Fe lines used are those given in Ahrens and Taylor, 1961,
p. 153. Line densities were measured by an Applied Research
Laboratories Model 2250 Projection Comparator Densitometer,
with a Varian recorder replacing the galvonometer.o
Lines: Co 3453.505 Ao
Zr 3438.230 Ao
Fe 3450.33 A - the internal standard line for
Zr and Co.o
V 3102.3 Ao
Fe 3205.3 A - the internal standard line for V.
Slit: About 250 microns. The accuracy of the slit
adjustment is open to question. This very wide slit was
unintentional and was reduced in a later group. It seems to
have had little effect on either the precision or accuracy
of the data.
Standards: W-l was the primary standard for all three
elements. The HIG-USGS interlab standards did not yet exist.
Standards and samples were on separate plates, a practice
that was abandoned for all subsequent groups. This practice
required a normalization of the S series to the C series.
This was done by rearcing samples from the S series in the
C series and then plotting the values from the S series vs.
those from the C series. The results for V are shown in

104.
Figure 36. There were three plates in the S series that
contained two or three samples rearced in the series, while
others contained only one. These data were used to plot
Figure 36. The conclusion is obvious; there were serious
interplate errors. The errors cannot be photographic; the
lines drawn through the points parallel the line of no
systematic error. Using this information, each plate was
normalized to the C series for V, Co, and Zr.
Precision: Only data for V will be given here; overall
precision for the other elements will be given later. Thirty
two samples in duplicate give 2 sigma = 22.6 ppm V. This is
about 10%. Twenty-two runs of W-l on 5 different plates
give % 2 sigma = 21.6%, indicating large interplate differ
ences. Duplicates are on the same plates.
Group 2. The C Series
Everything is as for the S series except that HIG-2, 4,
and 5 were used as secondary standards for Co and as primary
standards for Zr. Standards and samples were intermixed on
the plates.
Precision: Fifteen samples in duplicate give 2 sigma =
30 ppm V, or about 12%. Eleven runs of W-l on 5 different
plates give % 2 sigma = 12.8%, indicating small interplate
differences.
Group 3. The Band L Series
Basically the techniques are the same as for the Sand

105.
series
aQree
/400
rn > 300CD
~ ECDrn 0.
0. results from three pia te su
200
100
100 200 300
ppm V
S series
400 500
Figure 36. Graph for the normalization of the
S series to the C series.

C series.
106.
The slit was reduced to about 25 microns, and the
entire HIG-USGS interlab series was used as secondary stan-
dards for Co and as primary standards for Zr.
Precision: Twenty-six samples in duplicate give 2 sigma
= 28.4 ppm V, or about 11%. Seventeen runs of W-l on 5
different plates give % 2 sigma = 15.4%, indicating moderate
interplate differences. Four runs of W-l on one plate and
six runs on a second plate give % 2 sigma = 11.0%, support-
ing the indicated interplate differences.
Groups 4 through 6. The Hilger Series
There are only minor changes in operating conditions
for these three groups. It was sometimes necessary to use
separate working curves for the different group~ hence the
separation into three groups. The cause of the differing
working curves is unknown but thought to reflect uncon-
scious daily variations by the operator. Whatever the cause,
it often affected the integrated intensity of emission lines
to varying extents.
The operating conditions for these groups are given
below.
The features in common for these three groups will be
given first.
Spectrograph: A Hilger 3 meter compact grating spectro-
ograph with a reciprocal dispersion of about 2.8 A/mm in the
second order was used.
Power supply: A Hilger - B.N.F.S. Spectrographic Source
107.
Unit was operated as a DC unit.
Photography: Kodak Spectrum Analysis -1 plates were
developed in Kodak D-19, fixed for 5 minutes in Kodak Fixer,
and washed for 30 minutes. The developing times were
determined by the temperature. A time vs. temperature plot
was made from 3 plates having the same gamma but which were
developed at different times and temperatures. Line densi
ties were measured as before.
Plate calibration was by the Na 3302 doublet.
This method uses Na lines in the sample spectra and
requires previously calibrated plates.
Step 1. Determine the intensity ratio of the Na do~blet
in similar samples on previously calibrated plates.
Step 2. Read the Na doublet in samples on the plates
to be calibrated.
Step 3. Use the data from steps 1 and 2 to construct
a plate calibration curve for the new plates.
This method suffers from all the limitations inherent
to such a method. Of special importance are errors due to
self-absorption and variations in the intensity ratio due to
matrix changes or changes in arcing conditions.
The calibration of the plates exposed on the Hilger
spectrograph seems to contain an error due to a change in the
arcing conditions: the Na intensity ratio was taken from
plates exposed on the Bausch and Lomb. The effect of this.
error is included in the Zr, Co, and V values given in

108.
Tables X, XI, and XII for the Hilger series.
oV 3102.3 A
Fe 3160.66 - the internal standard line for V.
S 1it: 0 • 02 0 mm •,
·Standards: W-l was primary for Zr, V, and Co. The HIG-
USGS interlaboratory standards were secondary for Co and
primary for Zr.
Arcing conditions: Samples were arced to completion at
.10.5 amperes.
The overall precision for all groups of analyses from
both spectrographs and for all three elements is set at 2
sigma = ± 15%.
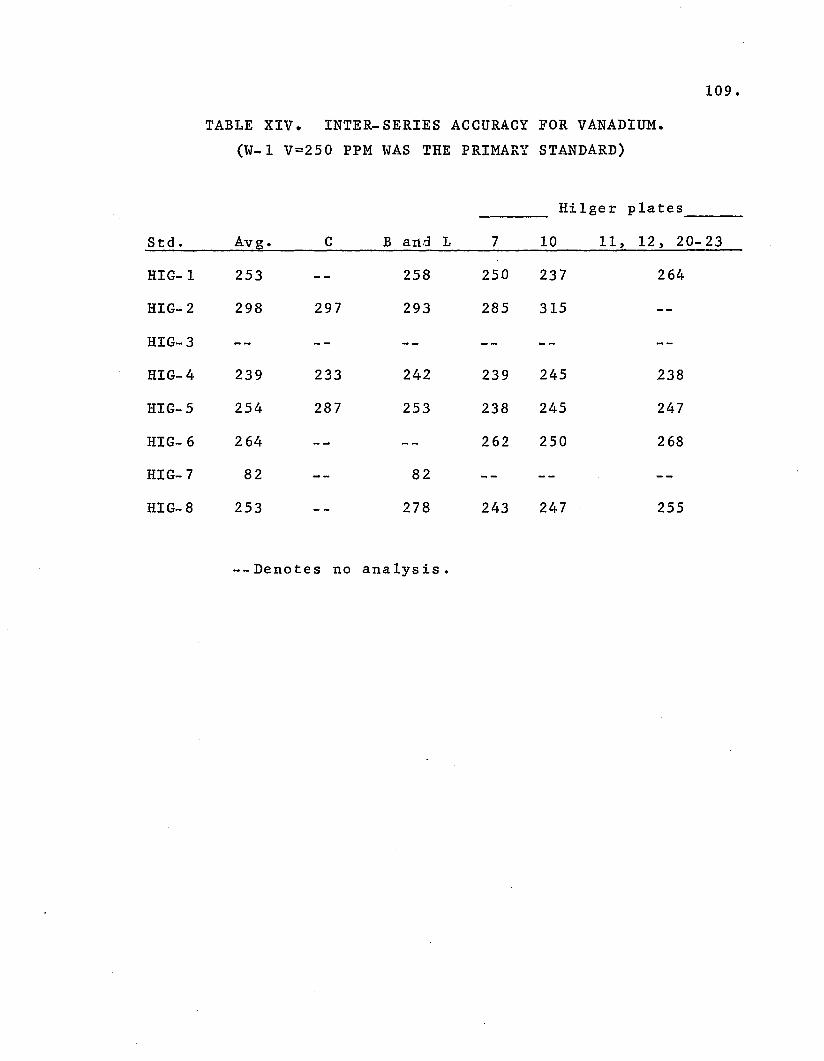
TABLE XIV. INTER-SERIES ACCURACY FOR VANADIUM.
(W-1 V=250 PPM WAS THE PRIMARY STANDARD)
109.
Hilger plates
Std. Avg. C B arid L 7 10 11, 12, 20- 23 .
HIG-l 253 258 250 237 264
HIG-2 298 297 293 285 315
HIG-3
HIG-4 239 233 242 239 245 238
HIG-5 254 287 253 238 245 247
HIG- 6 264 2.62 250 268
HIG-7 82 82
HIG-8 253 278 243 247 255
--Denotes no analysis.

TABLE XV. INTER-SERIES ACCURACY FOR COBALT.
(W-l CO=42 PPM WAS THE PRIMARY STANDARD)
--Hilger plates__
Std. Avg. C B and L 10-12 20- 23
HIG-l 80 76 75 88
HIG- 2 38 39 41 34
HIG-3
HIG-4 41 42 43 41 40
HIG-5 62 72 64 49
HIG- 6 48 48 47
HIG-7 14 14
HIG-8 47 47 47 46
--Denotes no analysis.
110.

Ill.
TAB:,E XVI. INTER-SERIES ACCURACY FOR ZIRCONIUM.
(W-1, 100 PPM, AND G-1, 210 PPM WERE
OTHER PRIMARY STANDARDS)
__Hilger plates--Std. Avg. C Band L 7 and 8 10-12
HIG-1 131 136 139 124 124
HIG- 2 155 163 155 148 153
HIG-3
HIG-4 125 123 128 116 132
HIG-5 198 190 189 215 198
HIG- 6 180 163 177 200
HIG-7
HIG-8 248 250 250 245
--Denotes no analysis.

APPENDIX E. A COpy OF THE U.S.G.S. TRACE ELEMENT
LABORATORY REPORT
112.
'. ",.tRt\ "U.:- 1:,1.,,:
UNITED STATES DEPARTMENT OF THE INTERIORGEOLOGICAL SURVEY
LABORATORY RE~RT
RE~RT NO. 66DS-4l
JOB NO 82S (DC&S)
FOR H. A. Power•.PROJECT OR ORGANIZATION
DATE I.b~uary 8, 1966Z"-PG&P972010 H.V.O.
LOT NO. 49-01 REFER TO OTHER REPORTS 65D9-230, 10/1/65. ~ic.l aoal78l1.. ~ :u _.. ~'.. ' .... "". -.. -=-=-.~~Jtintlli1.
Quantit.tive .pectrographic ana1y.ia of .ight (8) ...pl•• fra. Ha..ii.
Suia1 No. Field No. County oa.criptioD
D101097 HIGS-l HawaU 1959 KU.ue. - 01. r ich l.~ic. froaKi1.ue. lkl fir. fount.iD.
0101098 HIGS-2 do. Pr.hiitoric Kilauea - 01. !re. b•••1tcr.ter ru. flow •• e. ru..
0101099 HIGS-3 do. Pr.hiatoric Hue1al.i, Trachyt~ ob.idleDPuu .,......
D101100 IlIGS-4 1no1u1u Small intru.iv. body co.r•• Ir.i~d
b••alt - .a10lo Querry.0101101 HIGS-5 do. Co.n. arainad napb...1. ba.alt.
d••cribed ani ana1y••d 1D ero.. 1.v..of 1laW11.
0101102 HIGS-6 do. Tho1.iitic pahoeho. of ..in ••1aDae~.
D101103 HIGS-7 do. Mie. hornblende tr.chyt. - a1ao •..,1"for ••e deCemlDaC1oD.
0101104 HIGS-8 do. A1ka11cbl.a1c flow eapP1D& VaLaaae .....
'lat. II 3514
Seri.l No. rie1d No. ...!..!.- ..!!...L ..A!..l.. ~ ~ ~
D101097 HIGS-1 <.001 .011 <.0005 .0071 .15 .014098 -2 <.001 .012 <.0005 .0039 .044 .014099 -3 <.001 .028 <.0005 <.0002 .0002 .0011100 -4 <.001 .009 <.0005 .0036 .0It8 .015101 -5 <.001 .073 <.0005 .010 .047 .011102 -6 <.001 .014 <.0005 .0043 .061 .on103 -, .004 .024 .0009 .0005 .OOS .0036104 -8 <.001 .045 <.0005 .0055 .041 .012
-1-

APPENDIX E. (Continued) A COpy OF THE U.S.G.S.
TRACE ELEMENT LABORATORY REPORT
113.
Ifh\ I_I',
UNITED STATES DEPARTMENT OF THE INTERIORGEOLOGICAL SURVEY
LA.OIIATOIIY IIEI"O..T
-----REPORT NO 6608-41 1'0" H. A. l'owr. DAn: hbruary I, 1966
J08 NO 82>(DC&S) ""OJECT Of( OAG"""IZATlor~ 972010
LOT NO. 49-01 "11:,.11:11 TO OTH[" "1E"O"T5 S~~ ~"S' 1.-- -
§!.U!.1_~. Pi.alel No. Ga i. lA-L ...!!'1.-l.. ~ .J!!.1.. !U..D101097 tll,,;;-l .0017 <.:J(jc .1)005 <.002 .12 <.-
098 -2 .0027 <'.\.102 <.0001 <.002 .010 <.-U99 -3 .0033 .,.1.0 .0003 .004 <.0005 .-100 -4 .IJ~S :.,)0;2 <.0001 <.002 .010 <.OCII101 -5 .0033 .009 .0007 .006 .0,.. <.-102 -0 .0025 <'. iJOC: .0005 <.002 .040 <.-103 -7 .0021 ,')03 .0008 .005 .005 .OCII104 -8 .1.1030 •out- .0005 .004 .023 <.OCII
~ J.!!....L -1!...1:.. -LL ....LJ-. ..n..z.... ..lLLDI01097 .0022 <.001. ."c-~ .034 .002 .0002 .010
098 .0028 <.ooi .034 .042 .003 .0003 .012099 .0008 <.001 .(104 <.001 .006 . .000tt .034100 .0022 <.001 .040 .033 .0012 .00CII2 .oat101 .0018 .004 .12 .026 .003 .0003 .01'102 .(\023 <.001. .(136 .0111 .003 .0003 .016103 .0006 .001 .03t. .006 .00' .0001 .019184 .0020 <.001 .QuS .011I .003 •00CIl2 ...
.U: TM a~va r ••u1ta hava an overaU accurac), of t 157, ..capt that~ ar.le•• accurace n.ar lu.lt. of detaccion, .vbera onl)' ODa dllit l. r.,.rtad.
~ to: PoveLl>Lyn'~' BarnaD )Hubbard ~ ) tbroqh 'ownJa~1\, Nau.bton),t."aIU-2a•• t I "'I
'acKLa •• ' ln~r •. "
-2-
.y spectrolfaph1t jervlc•••n4 ~....rcb
ADllyn: ~rr Let NeiAAn /"'1
A_"ID
t ! l tril!'" .! .tftfs.,l. e-tnl
trecta of Aaal)'tu.l LMIo~ace~tu

114.
APPENDIX F.
TABLE XVII. VANADIUM DATA FOR LAV'AS OF
THE 1955 PUNA ERUPTION, IN PPM V_ •••h_••..
Samp1_e 1 2 3 4 5 6
1 400 377 22 5.8%
2 400 359 41 11.4%
3 390 352 370 38 10.8% 5.4%
4 400 302 98 32.4%
6 370 295 75 25.4%
8 340 307 350 33 10.4% 2.9%
9 340 293 47 16.0%
10 350 312 38 12.2%
1. USGS. Paul Barnett, analyst. Data from Hawaiian
Volcanoes During 1955, USGS Bull. 1171, p. 87.
2. Norman Hubbard, analyst. Data from Bausch and
Lomb C series: average of two runs.
3. Norman Hubbard, analyst. Data from Bausch and
Lomb B and L series: average-of six runs.
4. Difference between 1 and 2.
5. Percent difference between 1 and 2, computed on 2.
6. Percent difference between 1 and 3, computed on 3.

APPENDIX G
The diagrams on the two following pages have been
included to provide the reader ready reference to them.
One is from Green and Ringwood (1966) and the other from
o' Ha r a (19 65) •
115.

• TABLE I
s.;",muy ofsugacecI bau11 fractionation schcmn dcpmdml upon cIcpth ofqin ..Kl rale of miJlraliOl1 10 rbc surface
..I..•...1c
~ I:rj11
~ 05 S~;I 0.. -..a l:I:l!l III3 112 III~S....
I-'... \000\
13 VI'3
RIDOTITE...INITE~ GAallRO
ALL RIIRE
COGNATEACCUIIMJLATEBASIC AND ULTR~iBASIC NODULES 2PRESENT ~.r-- -- i
~
LIQUIDERUPTIVEPRODUCTSOBSERVED
1W5~ATED
. &"TICLTS
oc. r- ICARBONATITE \lOnlC GARNET-
KIMBERLITE ~R~mH'llE~t Ii'h~idl orc«noli Ie,-----
j,qANDESITEAUG~I
1·'4.':,~C: at DACITE ~~W mE,RHYOLITE
HORNBLENDE I-'GABBRO J-I
0\
TEMPERATUREAND
I.'.....,ccd atde'lIJCd
I·
..________t~lal '........al. !
I.'........'.d 01'delayed
I
PASSING:
'.len..," 01' I ,...."""" ... THO~"TlCdelayed i deT' ~UIT ATEDI >RA TIONATt ,SERIES
~_I;"~ ...~!~~IVEI.'"=.=- ; >~.::.'" f QUARTZ '.l', ~""~I~~ t ~Fd:~fil '- -~ r-l ...1'·' I"SI~UM I > ~~~OlNINE AND C!;.'fOMITE
'.lerr....d... ,~lIfTE I OLIVINEd.'e,od >iTRACHYTE GABBRO
,~ AMPH)BQUTE
C 'H r l1f"o'ftd~!Ift >1~/rfiF.~ WITH:-' u. ---'''' ...... i I~TJNITE ttt~~Mft
I I I >:POTASSICt.W'lC1 AUGUTE.; ,i , LAVAS ; PERIOC,TITE
i~il~Ti~i6lcT.~ IT~ ...... !r.et~1WLt.T lAND P~I~T1TE
TIME
~
I11lt.....,led 01'
delayed
., :::!':::I~h.·";I;'lt. I-+--f=.a....
21='~':~~1::'':'.0; ~e-\(_Ia.Srtare carth .''''''1. etc..
DRY MELTINGHIGH PRESSURE REGIME
WET MELTING

117.
From Green and Ringwood, 1966.
STAGES OF BABA.LT GENESIS
Example
Albl1 bualt8 aDdtboleUtee with Dormal or pr1m1UveFelll, raUoe. butcbaracter1aed byb1P allaDdaDCe. oflDooberet tracee1em_ta.
Example
HiBblY fracUClIlated a1kal1 wite.lr01l-rich adhlp potu81umthole11tea
- SURFACE - - -
200 km
60 -180 km
fCooIJDg ~mqmaapIut CClDduIt;Cl'JMaWaUClIl ofrtville. pyroxeaN- plqIoclue.Wall-rock COIl--.oT'-
Bapld SlowuC8lt alCeDt
V8trGa~ arlcJuDet IDd fracUOIl&UClIlof IDCClheret trace memellta. e.l·K. Jk:.. Rb. Sr. U. Th. rare-earth8by reactlCllllDvolYiDI "ZOIle refln1lllt'.lIoderate fracUClD&UClIl· of major
e1,'" e.l. FeIIIl
8ep'epUClIl of bualt &epoepU= accompaDledJDaIID& freD ultra- bJ reactlClll of mapi& withIUflc refractor1 1&1'18 volume. oflUlTOUDd-
reeidlle \ /iiiiDtle•·ParUal meltllll of
pyrol1te (5-301 me1tlD&)
1 rUpward mC"..eaumt of UIlIDelted
IIWltle (pyrolite) by aolld flow.t I .
Blowerucet
tIIqma 10.. beatby CODducUClIl towall rocb of CClIl
dldt. CClIlUDuouacryata111uUClIl of +oIlville. PJrtS&le plqIoclue. lIler..eID Felll,. Nale.raUoe by CI'J8t&lfracUClD&UClIl

118.
BIBLIOGRAPHY
Ahrens, L. H., Pinson, W. H., and Kearns, M. M., Association
of rubidium and potassium and their abundance in common
igneous rocks and meteorites: Geochim. Cosmochim.
Acta, Vol. 2, pp. 229-242, 1952.
Ahrens, L~ H., and Taylor, S. R., Spectrochemical Analysis
2nd. ed.: Addison-Wesley Publishing Co., Inc., 1961.
Anderman, G., and Kemp, J. W., Scattered x-rays as internal
standards in x-ray emmission spectroscopy: Anal. Chem.,
Vol. 30, No.8, pp. 1306-1309, August 1958.
Bastron, H., Barnett, P. R., and Murata, K. J., Method for
the quantitative spectrochemical analysis of rocks,
minerals, ores, and other materials by a powder D-C arc
technique: u. S. Geol. Sur. Bull. 1084-G, pp. 161-182,
1960.
Carobbi, G., Celestina e apatite di stronzio contenenti
picco1e quantita di mercurio: R. Accad. Lincei, C1.
sce. fis., mat. e nat., Atti. Serie 8, 8 fasc. 2, 87-93,
1950.
Champion, K. P., Taylor, J. C., and Whittem, R. N., Rapid
x-ray fluorescence determination of traces of strontium
in samples of biological and geological origin: Anal.
Chem~, Vol. 38, No.1, pp. 109-112, January 1966.
Compton, A. H., and Allison, S. K., X-rays in theory and
experiment: D. Van Nostrand Company, Inc., 828 pp.,
1935.

119.
Curtis, C. D., Applications of the cry~tal-field theory to
the inclusion of trace transition elements in minerals
during-magmatic differentiation: Geochim. Cosmochim.
Ac·ta, Vol. 28, pp. 389-403, 1964.
Engel, A. E. J., Engel, C. G., and Havens, R. G., Chemical
characteristics of oceanic basalts and the upper mantle:
Geol. Soc. Amer. Bull., Vol. 76, pp. 719-734, July 1965.
Faure, G., and Hurley, P. M., The isotopic composition of
strontium in oceanic and continental basalts: Applica
tion to the origin of igneous rocks: Jour. Petro.,
Vol. 4, pp. 31-50, 1963.
Fleischer, M., Summary of new data on ro~k samples G-l and
W--l", 1962-1965: Geochim." Cosmochim. Acta, Vol. 29,
pp. 1263-1283, 1965.
Greenland, L., and Lovering, F. F., Fractionation of fluorine,
chlorine and other trace elements during differentia
tion of a tholeiitic magmas: Geochim. Cosmochim. Acta,
Vol. 30, pp. 963-982, 1966.
Grunwald, R., M.S. thesis in progress: Department of
Oceanography, University of Hawaii.
Gunn, B. M., K/Rb and K/Ba ratios in Antarctic and New
Zealand tholeiites and alkali basalts: Jour. Geophys.
Res., Vol. 70, pp. 6241-6248, 1965.
Gunn, B. M., Modal and element variation in Antarctic
tholeiites: Geochim. Cosmochim. Acta, Vol. 30, pp. 881
920, 1966.

120.
Hamilton, E. I., Distribution of some trace elements and the
isotopic composition of strontium in Hawaiian lavas:
Nature, Vol. 206, pp. 251-253, 1965.
Hedge, C. E., and Walthall, F. G., Radiogenic strontium-87
as an index to geologic processes: Science, Vol. 140,
pp. 1214-1217, 1963.
Larsen, E. S., Jr., Fletcher, M. H., and Cisney, E. A.,
Strontian apatite: Amer. Min., Vol. 37, p. 656, 1952.
Lessing, P., and Catanzaro, E. J., Sr 87/Sr 86 ratios in
Hawaiian lavas: Jour. Geophys. Res., Vol. 69, pp. 1500-
1502, 1964.
Lessing, P., Decker, R. W., and Reynolds, R. C., Potassium
and rubidium distribution in Hawaiian lavas: Jou--.r-.
Geophys. Res., Vol. 68, No. 20, pp. 5851-5855, 1963.
Liebhafsky, H. A., Pfeiffer, H. G., Winslow, E. H., and
Zemany, P. D., X-ray absorption and emmission in ana1yti-
cal chemistry: John Wiley and Sons, Inc., 357 pp.,
1960.
~acdona1d, G. A., Physical properties of erupting Hawaiian
magmas: Geol. Soc. Amer. Bull., Vol. 74, pp. 1071-1078,
1963.-
Macdonald, G. A., and Eaton, J. P., Hawaiian volcanoes during
1955: u. S. Geo1. Sur. Bull., 1171, pp. 1-170, 1964.
Macdonald, G. A., and Katsura) T., Variations in the lava of
the 1959 eruption in Kilauea Iki: Pacific Science,
Vol. XV , No.3, pp. 3 5 8- 3 69, 19 61.

121.
Macdonald, G. A., and Katsura, T., Chemical composition of
Hawaiian lavas: Jour. Petro., Vol. 5, No.1, pp. 82
133, February 1964.
Merlino, S., Applicazione della teoria del campo cristallino
a1lo studio della rip~rtizione de elementi in tracce:
Atti della Soc. Tosc. Sc. Nat., Serie A-Vol. LXXII,
pp. 1-14, 1965.
Murata, K. J., and Richter, D. H., The settling of olivine in
Ki1auean magma as shown by lavas of the 1959 eruption:
Amer. Jour. Sci., Vol. 264, pp. 194-203, 1966.
Nockolds, S. R., and Allen, R., The geochemistry of some
igneous rock series: Part II: Geochim. Cosmochim.
Acta, Vol. 5, pp. 245-285, 1954.
Nocko1ds, S. R., and Allen, R., The geochemistry of some
igneous rock series: Part III: Geochim. Cosmochim.
Acta, Vol. 9," pp. 34-77, 1956.
O'Hara, M. J., Primary magmas and the origin of basalts:
Scottish Journal of Geology, Vol. 1, Part 1, pp. 19-40,
1965.
Powell, J. L., Faure, G., and Hurley, P. M., Strontium 87
abundance in a suite of Hawaiian volcanic rocks of
varying silica content: Jour. Ger~~ys. Res. 70,
pp. 1509-1513, 1965.
Powers, H. A., Composition and origin of basaltic magma of
the Hawaiian Islands: Geochim." Cosmochim. Acta, Vol. 7,
pp. 77-107, 1955.

122.
Tatsumoto, M., Hedge, C. E., and Engle, A. E. J:, Potassium,
rubidium, strontium, thorium, uranium and the ratio of
Sr 87 to Sr 86 in oceanic tholeiitic basalt: Science,
Vol. 150, pp. 886-888, 1965.
Taubeneck, W. H., An appraisal of some potassium-rubidium
ratios in igneous rocks: Jour. Geophys. Res., Vol. 70,
pp. 475-478, 1965.
Taylor, S. R., Emeleus, C. H., and Exley, C. S., Some
anomalous K/Rb ratios and their petrological signifi-
cance: Geochim. Cosmochim. Acta, Vol. 7, pp. 224-229,
1956.
Tilley, C. E., Yoder, H. S., Jr., and Schairer, J. F.,
Melting relations of basalts: Carnegie lnst., Annual
Rep. Dir. Geophys. Lab., Year Book 62, pp. 77-84, 1962-
63.
Tilley, C. E., Yoder, H. S., and Scha.irer, J. F., Melting
relations of volcanic tholeiite and alkali rock series:
Carnegie lnst., Annual Rep. Dir. Geophys. Lab., Year.': ".
Book 64, pp. 69-82, 1964-65.
Turekian, K. K., The chromium and nickel distribution in
basaltic rocks and eclogites: Geochim. Cosmochim. Acta,
Vol. 27, pp. 835-846, 1963.
Turekian, K. K., Gast, P. W., and Kulp, J. L., Emission-
spectrographic method for the determination of strontium
in silicate materials: Spectrochim. Acta, Vol. 9,
pp. 40-46, 1957.

123.
Turekian, K. K., and Ku1p, J. L., The geochemistry of
strontium: Geochim. Cosmochim. Acta, Vol. 10, pp. 245
296, 1956.
Wager, L. R., and Mitchell, R. S., The distribution of Cr,
V, Ni, Co, and Cu during the fractional crystallization
of a basic magma: Intern. Geo1. Congo Report Eighteenth
Session, Part II, Great Britain, pp. 140-150, 1948.
Wager, L. R., and Mitchell, R. S., The distribution of trace
elements during strong fractionation of basic magma--
a further study of the Skaergaard intrusion, East
Greenland: Geochim. Cosmochim. Acta, Vol. 1, No.3,
pp. 123-208, 1951.
Wager, L. R., and Mitchell, R. S., Trace elements in a suite
of Hawaiian lavas: Geochim. Cosmochim. Acta, Vol. 3,
No.5, pp. 217-223, 1953.
Yoder, H. S., Jr., and Tilley, C. E., Origin of basalt magmas:
An experimental study of natural and synthetic rock
systems: Jour. Petro., Vol. 3, No.3, pp. 342-532,
Oct. 1962.