Embed Size (px)
Citation preview
UNIVERSITI PUTRA MALAYSIA
Performance of Oil Palm (Elaeis Guineensis Jacq.) DxP Progenies from Different Agencies under Various Planting Densities
MOHD ISA BIN ZAINOL ABIDIN
FP 2007 19
Performance of Oil Palm (Elaeis Guineensis Jacq.) DxP Progenies from Different Agencies under Various Planting Densities
By
MOHD ISA BIN ZAINOL ABIDIN
Thesis Submitted to the School of Graduate Studies, Universiti Putra Malaysia, in Fulfilment of the Requirements for the Degree of Master of Agricultural Science
August 2007

Abstract of thesis presented to the Senate of Universiti Putra Malaysia in fulfilment of the requirement for the degree of Master of Agricultural Science
Performance of Oil Palm (Elaeis Guineensis Jacq.) DxP Progenies from Different
Agencies under Various Planting Densities
By
MOHD ISA ZAINOL ABIDIN
August 2007
Chairman: Mohd Rafii Hj. Yusop, PhD Faculty: Agriculture
Fifteen dura x pisifera (DxP) bi-parental crosses from six Malaysian seed producers
(agencies) were studied for yield, bunch quality, vegetative characters and physiological
traits in four planting densities. Analysis of variance indicated significant differences
among the fifteen progenies that were obtained from six agencies and planted under
four planting densities. However, all the progenies and agencies were considered
responding similarly across planting densities for all the 34 traits studied by showing no
significant difference in genotype x planting density interaction, pooled over years.
Broad-sense heritability estimates (h2B) using intra-class correlation varied between
13.3% and 47.6%. Generally, the genetic variations and heritability estimates were low,
which may restrict further improvements of the parental stocks. On the other hand,
uniform performance for yield is advantageous in commercial plantings. The difference
in yield among progenies and among agencies reflected the different genetic
background and selection pressure. The low genetic variability could be due to the
narrow genetic base. The fresh fruit bunch (FFB) yield of the six agencies ranged from
ii
18.41 to 21.46 t/ha/yr. The highest FFB yield in agency A2 was attributed to its high
bunch number (BNO). Oil to bunch (O/B) varied from 25.93 to 28.21% with the latter
extreme observed in agency A1. Heights (HT) of the 21-year old palms were between
8.97m and 10.02m with the height increment of between 47cm and 53cm among
agencies, while the HT among densities were between 8.73m and 10.43m with the
height increment of between 46cm (density D1) and 55cm (density D4). Agencies A1
and A6 had the lowest HT increment reflecting the dumpy ancestry. Oil yield (OY),
which ranged from 5.11 t/ha/yr to 6.03 t/ha/yr was highest in agency A2, due its high
FFB. Bunch index (BI) ranged between 0.39 and 0.43 with agency A2 was the highest.
Agency A2 produced the best total economic product (TEP) at 6.93 t/ha/yr. Minimum
TEP of 5.80 t/ha/yr was produced by agency A3. Density D2 (148 palms/ha) recorded
the highest FFB and OY with 21.74 and 6.0 t/ha/yr, respectively. Densities
D3 (170 palms/ha), D4 (215 palms/ha) and D1 (120 palms/ha) was the second, third and
fourth (lowest) respectively, in FFB and OY productions. Density 2 (148 palms/ha) was
the ideal planting density for maximum oil yield per unit land area. This density (148
palms/ha) is the current planting density used in commercial oil palm cultivation on
inland soil.
iii
Abstrak tesis yang dikemukakan kepada Senat Universiti Putra Malaysia sebagai memenuhi keperluan untuk ijazah Master Sains Pertanian
Prestasi Progeni Kelapa Sawit (Elaeis Guineensis Jacq.) DxP daripada Agensi yang Berbeza di Berbagai Kepadatan Tanaman
Oleh
MOHD ISA ZAINOL ABIDIN
Ogos 2007
Pengerusi: Mohd Rafii Hj. Yusop, PhD Fakulti: Pertanian
Lima belas progeni dura x pisifera (DxP) kacukan dwi-induk dari enam pengeluar
benih kelapa sawit di Malaysia (agensi) telah dikaji dari segi hasil buah tandan segar,
kualiti tandan, sifat vegetatif dan ciri fisiologi di empat kepadatan tanaman. Analisis
varians antara lima belas progeni, enam agensi dan empat jarak tanaman menunjukkan
perbezaan yang bererti di antara progeni, agensi dan kepadatan tanaman.
Bagaimanapun, kesemua 34 ciri yang kaji tidak menunjukkan perbezaan yang bererti
terhadap kesan interaksi antara progeni atau agensi dengan kepadatan tanaman.
Anggaran heritabiliti luas (h2B) menggunakan korelasi intra-kelas adalah pada julat
13.3% hingga 47.6%. Secara umumnya, variasi genetik dan anggaran nilai heritabiliti
adalah rendah yang mungkin menghadkan usaha penambahbaikan. Sebaliknya,
keseragaman di dalam progeni memudahkan pemilihan bagi penghasilan bahan
tanaman komersil. Prestasi hasil yang berbeza di antara progeni dan antara agensi
mencerminkan kesan pemilihan dan sumber genetik yang berbeza. Variabiliti genetik
yang rendah bagi hampir semua ciri mungkin disebabkan bahan tanaman yang
iv
mempunyai asas genetik yang sempit. Hasil buah tandan segar (FFB) dari semua agensi
adalah di antara 18.41 dan 21.46 tan/hektar/tahun. Hasil tertinggi yang direkodkan oleh
agensi A2 adalah disebabkan bilangan tandan (BNO) yang banyak. Nisbah minyak ke
tandan (O/B) adalah di antara 25.93 dan 28.21% dengan nilai tertinggi pada agensi A1.
Ketinggian pokok (HT) di kalangan agensi selepas 21 tahun penanaman adalah di antara
8.97m dan 10.02m dengan purata pertambahan ketinggian di antara 47cm dan 53cm,
manakala di kalangan kepadatan tanaman pula di antara 8.73m dan 10.43m dengan
pertambahan ketinggian di antara 46cm (kepadatan D1) dan 55cm (kepadatan D4).
Agensi A1 dan A6 mempunyai pokok paling rendah yang mencerminkan pewarisan
sifat renek. Jumlah penghasilan minyak (OY) berjulat di antara 5.11 dan 6.03 tan
sehektar dengan nilai tertinggi dicatat oleh agensi A2. Julat indeks tandan (BI) adalah di
antara 0.39 dan 0.43 dengan nilai tertinggi pada agensi A2. Agensi A2 juga
mencatatkan penghasilan ekonomi total (TEP) yang tertinggi (6.93 tan sehektar),
manakala Agensi A3 adalah yang terendah (5.80 tan sehektar). Jarak tanaman D2 (148
pokok sehektar) merekodkan FFB dan OY tertinggi, dengan masing-masing 21.74 dan
6.0 tan sehektar. Kepadatan tanaman D3 (170 pokok/hektar), D4 (215 pokok/hektar)
dan D1 (120 pokok/hektar) adalah masing-masing mengikut susunan kedua, ketiga dan
keempat (terendah) dari segi penghasilan FFB dan OY. Kepadatan tanaman D2, yang
banyak diamalkan secara komersil di tanah pedalaman, didapati paling ideal untuk
pulangan hasil yang maksimum per unit kawasan.
v
ACKNOWLEDGEMENTS
I am indebted to the Director General of Malaysian Palm Oil Board (MPOB) for the
opportunity given to do this work.
My deep appreciation goes to the Chairman of my Supervisory Committee, Dr. Hj.
Mohd Rafii Hj. Yusop, for his patience, guidance and endless encouragement
throughout my graduate studies and research. I would also like to thank the other
committee members, Prof. Dr. Ghizan Saleh and Dr. A. Kushairi Din for their valuable
inputs and comments on my thesis. I would like to give my special thanks to Dr. N.
Rajanaidu, for his encouragements and support.
I wish also to thank the staff of the Breeding Section at the MPOB Station, Hulu Paka
for assistance with the data collection. I am grateful to Mr. Mukesh Sharma at
Messieurs United Plantations Malaysia Berhad, Mr. Ng Woo Jien of Felda Agricultural
Services Sendirian Berhad, Mr. Mohaimi Mohamed of Golden Hope Plantations Berhad
and Mr. Mustafa Kamal Mohamed of Chemara Research, Guthrie Malaysia.
I would like to express my deepest thanks to my parents and other family members for
their love, support, and encouragements. I would not have had it completed without my
wife Maimunah Abu Samah’s love, support and prayers.
vi
I certify that an Examination Committee has met on 29th August 2007 to conduct the final examination of Mohd Isa bin Zainol Abidin on his Master of Science thesis entitled “Performance of Oil Palm (Elaeis guineensis Jacq.) DxP Progenies from Different Agencies under Various Planting Densities” in accordance with Universiti Pertanian Malaysia (Higher Degree) Act 1980 and Universiti Pertanian Malaysia (Higher Degree) Regulations 1981. The Committee recommends that the student be awarded the degree of Master of Science. Members of the Examination Committee were as follows: Mihdzar bin Abdul Kadir, PhD Associate Professor Faculty of Agriculture Universiti Putra Malaysia (Chairman) Mohd Said bin Saad, PhD Associate Professor Faculty of Agriculture Universiti Putra Malaysia (Internal Examiner) Sheikh Awadz bin Sheikh Abdullah, PhD Associate Professor Faculty of Agriculture Universiti Putra Malaysia (Internal Examiner) Othman bin Omar, PhD Malaysian Agricultural Research and Development Institute (External Examiner)
________________________________ HASANAH MOHD. GHAZALI, PhD Professor and Deputy Dean School of Graduate Studies Universiti Putra Malaysia
Date:
vii
This thesis was submitted to the Senate of Universiti Putra Malaysia and has been accepted as fulfilment of the requirement for the degree of Master of Agricultural Science. The members of the Supervisory Committee were as follows: Mohd Rafii Hj. Yusop, PhD Associate Professor Faculty of Agriculture Universiti Putra Malaysia (Chairman) Ghizan Saleh, PhD Professor Faculty of Agriculture Universiti Putra Malaysia (Member) Ahmad Kushairi Din, PhD Director of Biological Research Malaysian Palm Oil Board (Member)
__________________________
AINI IDERIS, PhD Professor and Dean School of Graduate Studies Universiti Putra Malaysia Date: 21 February 2008
viii
DECLARATION
I hereby declare that the thesis is based on my original work except for quotations and citations which have been duly acknowledged. I also declare that it has not been previously or concurrently submitted for any other degree at Universiti Putra Malaysia or other institutions.
__________________________ MOHD ISA ZAINOL ABIDIN
Date: 28 December 2007
ix
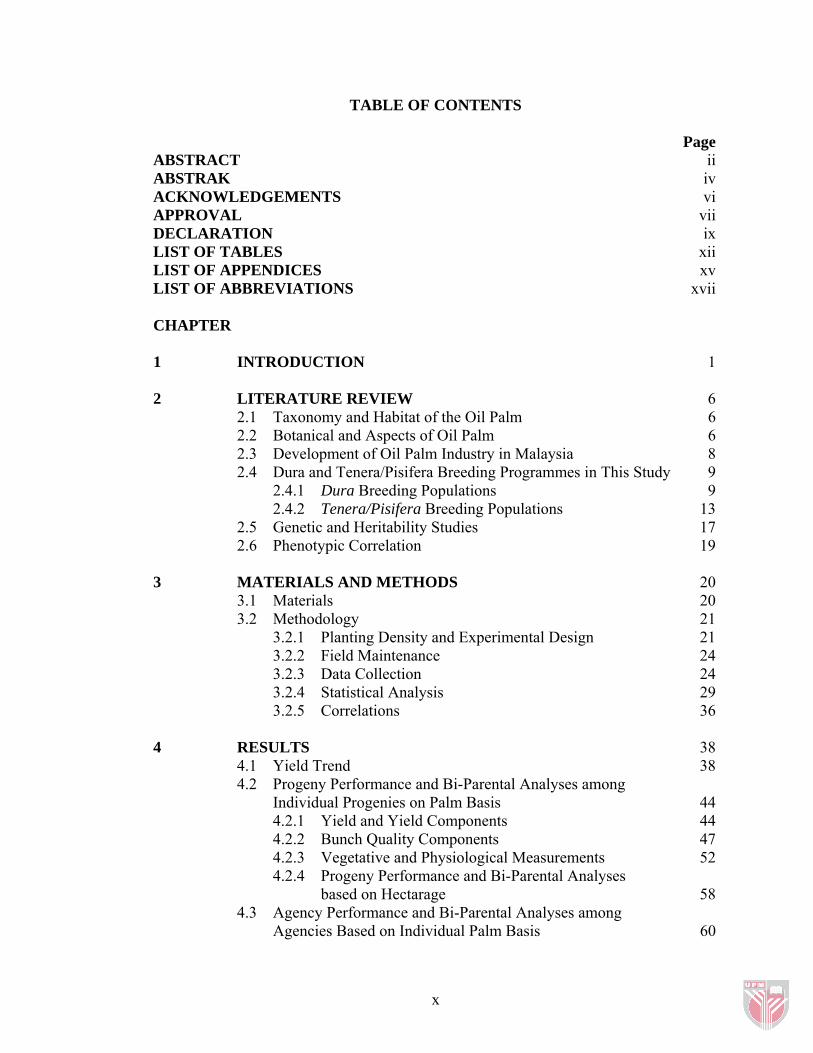
TABLE OF CONTENTS
Page ABSTRACT ii ABSTRAK iv ACKNOWLEDGEMENTS vi APPROVAL vii DECLARATION ix LIST OF TABLES xii LIST OF APPENDICES xv LIST OF ABBREVIATIONS xvii CHAPTER 1 INTRODUCTION 1 2 LITERATURE REVIEW 6 2.1 Taxonomy and Habitat of the Oil Palm 6 2.2 Botanical and Aspects of Oil Palm 6 2.3 Development of Oil Palm Industry in Malaysia 8 2.4 Dura and Tenera/Pisifera Breeding Programmes in This Study 9 2.4.1 Dura Breeding Populations 9 2.4.2 Tenera/Pisifera Breeding Populations 13 2.5 Genetic and Heritability Studies 17 2.6 Phenotypic Correlation 19 3 MATERIALS AND METHODS 20 3.1 Materials 20 3.2 Methodology 21 3.2.1 Planting Density and Experimental Design 21 3.2.2 Field Maintenance 24 3.2.3 Data Collection 24 3.2.4 Statistical Analysis 29
3.2.5 Correlations 36 4 RESULTS 38 4.1 Yield Trend 38 4.2 Progeny Performance and Bi-Parental Analyses among Individual Progenies on Palm Basis 44 4.2.1 Yield and Yield Components 44 4.2.2 Bunch Quality Components 47 4.2.3 Vegetative and Physiological Measurements 52 4.2.4 Progeny Performance and Bi-Parental Analyses based on Hectarage 58
4.3 Agency Performance and Bi-Parental Analyses among Agencies Based on Individual Palm Basis 60
x
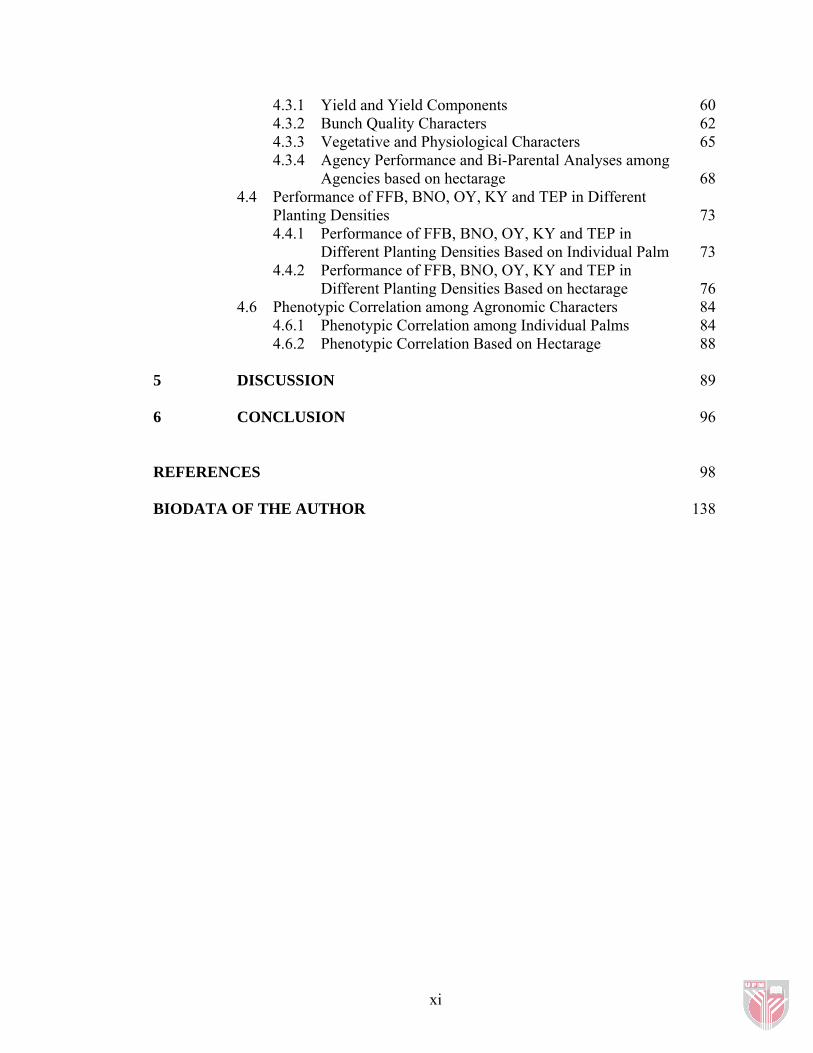
4.3.1 Yield and Yield Components 60 4.3.2 Bunch Quality Characters 62 4.3.3 Vegetative and Physiological Characters 65 4.3.4 Agency Performance and Bi-Parental Analyses among
Agencies based on hectarage 68 4.4 Performance of FFB, BNO, OY, KY and TEP in Different Planting Densities 73 4.4.1 Performance of FFB, BNO, OY, KY and TEP in Different Planting Densities Based on Individual Palm 73 4.4.2 Performance of FFB, BNO, OY, KY and TEP in Different Planting Densities Based on hectarage 76 4.6 Phenotypic Correlation among Agronomic Characters 84 4.6.1 Phenotypic Correlation among Individual Palms 84 4.6.2 Phenotypic Correlation Based on Hectarage 88 5 DISCUSSION 89 6 CONCLUSION 96 REFERENCES 98 BIODATA OF THE AUTHOR 138
xi

LIST OF TABLES Table Page 3.1 DxP Comparative Trial planted in four planting densities at MPOB Hulu Paka Research Station, Terengganu, Malaysia. 22 3.2 Genetic background of oil palm progenies from different agencies used for DxP Comparative trial planted in four planting densities at
MPOB Hulu Paka Research Station, Terengganu, Malaysia 23 3.3 Computation formulae for bunch analysis components 28 3.4 Computation formulae for analyses of morphophysiological traits 30 3.5 Outline of ANOVA and expected mean squares (EMS) for full-sib
analysis pooled over planting densities in oil palm progenies 33 3.6 Outline of ANOVA and expected mean squares (EMS) for agencies
pooled over planting densities in oil palm 35 4.1 Mean squares of analysis of variance (ANOVA) and progeny means for bunch yields pooled over densities in oil palms planted in four
densities. 39 4.2 Fresh fruit bunch (FFB), bunch number (BNO) and average bunch weight (ABW) in oil palm planted in four planting densities, 1987 - 2003 41 4.3 Planting density means for fresh fruit bunch/ha (FFB/ha) and bunch
number/ha (BNO/ha) over years (1987 - 2003) 43 4.4 Variance components and heritability estimates for fresh fruit bunch
(FFB), bunch number (BNO) and average bunch weight (ABW) 46 4.5 Mean squares of analysis of variance (ANOVA) and progeny means for bunch quality components pooled over densities in oil palm progenies 48 4.6 Variance components and heritability estimates for bunch quality
components 53 4.7 Mean squares of analysis of variance (ANOVA) and progeny means for vegetative components and physiological traits pooled over densities in oil palm 54
xii
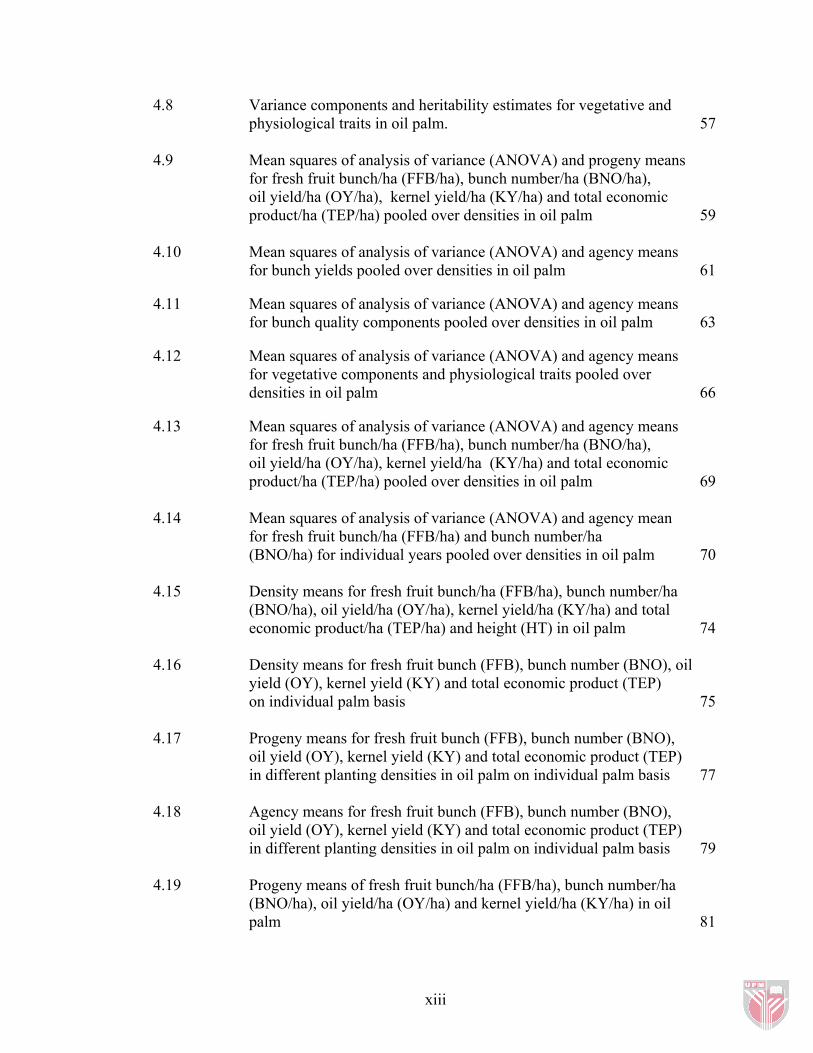
4.8 Variance components and heritability estimates for vegetative and physiological traits in oil palm. 57
4.9 Mean squares of analysis of variance (ANOVA) and progeny means for fresh fruit bunch/ha (FFB/ha), bunch number/ha (BNO/ha), oil yield/ha (OY/ha), kernel yield/ha (KY/ha) and total economic
product/ha (TEP/ha) pooled over densities in oil palm 59 4.10 Mean squares of analysis of variance (ANOVA) and agency means for bunch yields pooled over densities in oil palm 61 4.11 Mean squares of analysis of variance (ANOVA) and agency means for bunch quality components pooled over densities in oil palm 63 4.12 Mean squares of analysis of variance (ANOVA) and agency means for vegetative components and physiological traits pooled over densities in oil palm 66 4.13 Mean squares of analysis of variance (ANOVA) and agency means
for fresh fruit bunch/ha (FFB/ha), bunch number/ha (BNO/ha), oil yield/ha (OY/ha), kernel yield/ha (KY/ha) and total economic product/ha (TEP/ha) pooled over densities in oil palm 69
4.14 Mean squares of analysis of variance (ANOVA) and agency mean
for fresh fruit bunch/ha (FFB/ha) and bunch number/ha (BNO/ha) for individual years pooled over densities in oil palm 70
4.15 Density means for fresh fruit bunch/ha (FFB/ha), bunch number/ha (BNO/ha), oil yield/ha (OY/ha), kernel yield/ha (KY/ha) and total economic product/ha (TEP/ha) and height (HT) in oil palm 74
4.16 Density means for fresh fruit bunch (FFB), bunch number (BNO), oil yield (OY), kernel yield (KY) and total economic product (TEP) on individual palm basis 75
4.17 Progeny means for fresh fruit bunch (FFB), bunch number (BNO), oil yield (OY), kernel yield (KY) and total economic product (TEP) in different planting densities in oil palm on individual palm basis 77
4.18 Agency means for fresh fruit bunch (FFB), bunch number (BNO), oil yield (OY), kernel yield (KY) and total economic product (TEP) in different planting densities in oil palm on individual palm basis 79 4.19 Progeny means of fresh fruit bunch/ha (FFB/ha), bunch number/ha
(BNO/ha), oil yield/ha (OY/ha) and kernel yield/ha (KY/ha) in oil palm 81
xiii

4.20 Agency means of fresh fruit bunch/ha (FFB/ha), bunch number/ha (BNO/ha), oil yield/ha (OY/ha), kernel yield/ha (KY/ha) and total economic product/ha (TEP/ha) over different planting densities in
oil palm 83
xiv
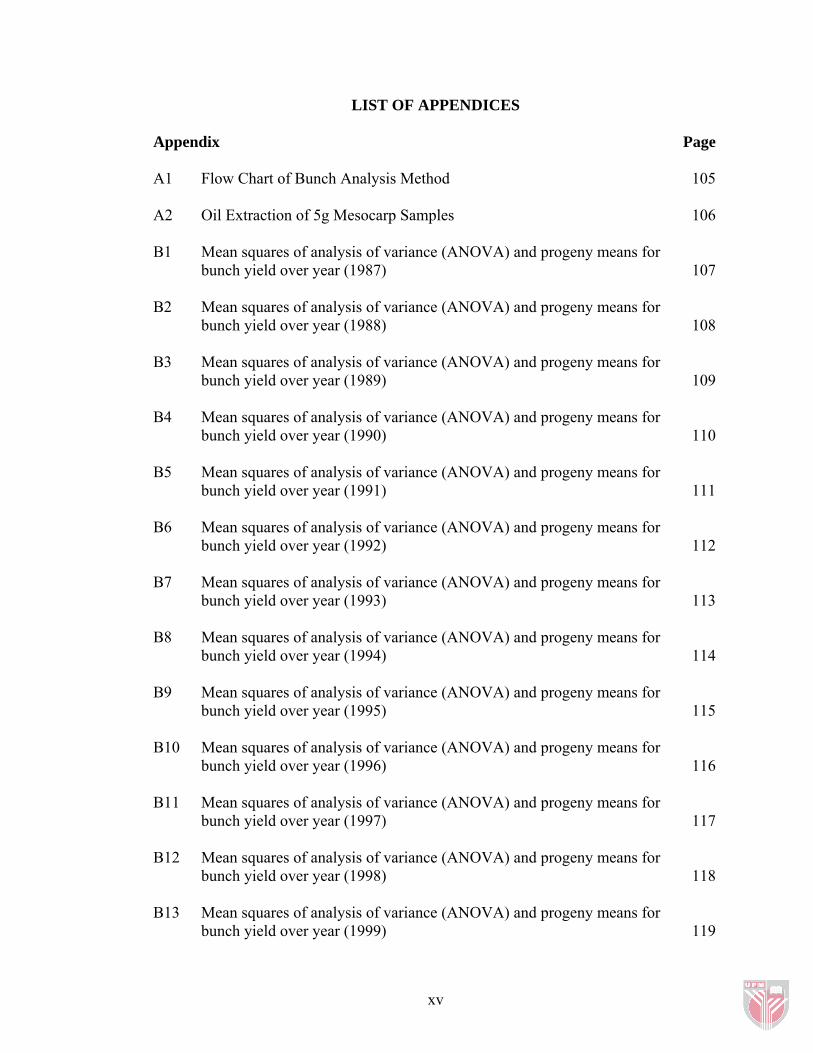
LIST OF APPENDICES
Appendix Page A1 Flow Chart of Bunch Analysis Method 105 A2 Oil Extraction of 5g Mesocarp Samples 106 B1 Mean squares of analysis of variance (ANOVA) and progeny means for bunch yield over year (1987) 107
B2 Mean squares of analysis of variance (ANOVA) and progeny means for bunch yield over year (1988) 108 B3 Mean squares of analysis of variance (ANOVA) and progeny means for bunch yield over year (1989) 109 B4 Mean squares of analysis of variance (ANOVA) and progeny means for bunch yield over year (1990) 110 B5 Mean squares of analysis of variance (ANOVA) and progeny means for bunch yield over year (1991) 111 B6 Mean squares of analysis of variance (ANOVA) and progeny means for bunch yield over year (1992) 112 B7 Mean squares of analysis of variance (ANOVA) and progeny means for bunch yield over year (1993) 113 B8 Mean squares of analysis of variance (ANOVA) and progeny means for bunch yield over year (1994) 114 B9 Mean squares of analysis of variance (ANOVA) and progeny means for bunch yield over year (1995) 115 B10 Mean squares of analysis of variance (ANOVA) and progeny means for bunch yield over year (1996) 116 B11 Mean squares of analysis of variance (ANOVA) and progeny means for bunch yield over year (1997) 117 B12 Mean squares of analysis of variance (ANOVA) and progeny means for bunch yield over year (1998) 118 B13 Mean squares of analysis of variance (ANOVA) and progeny means for bunch yield over year (1999) 119
xv
B14 Mean squares of analysis of variance (ANOVA) and progeny means for bunch yield over year (2000) 120 B15 Mean squares of analysis of variance (ANOVA) and progeny means for bunch yield over year (2001) 121 B16 Mean squares of analysis of variance (ANOVA) and progeny means for bunch yield over year (2002) 122 B17 Mean squares of analysis of variance (ANOVA) and progeny means for bunch yield over year (2003) 123 C Phenotypic Correlation among FFB, Bunch Quality, Vegetative Components and Physiological Traits over Different Planting Densities and Pooled over Densities 124 – 130 D1 Mean squares of analysis of variance (ANOVA) and agency means for bunch yields (1987 - 1989). 131 D2 Mean squares of analysis of variance (ANOVA) and agency means for bunch yields (1990 - 1992). 132 D3 Mean squares of analysis of variance (ANOVA) and agency means for bunch yields (1993 - 1995). 133 D4 Mean squares of analysis of variance (ANOVA) and agency means for bunch yields (1996 - 1998). 134 D5 Mean squares of analysis of variance (ANOVA) and agency means for bunch yields (1999 - 2001) 135 D6 Mean squares of analysis of variance (ANOVA) and agency means for bunch yields (2002 - 2003). 136 E Phenotypic Correlation among FFB/ha, BNO/ha, ABW, O/B, K/B, OY/ha and TEP/ha in Individual Densities and Pooled over Densities 137
xvi
LIST OF ABBREVIATIONS
FFB fresh fruit bunch
BNO bunch number
ABW average bunch weight
BWT bunch weight
MFW fruit weight
P/B parthenocarpic/bunch
M/F mesocarp/fruit
K/F kernel/fruit
S/F shell/fruit
O/DM oil/dry mesocarp
O/WM oil/wet mesocarp
F/B fruit/bunch
O/B oil/bunch
K/B kernel/bunch
OY oil yield (kg/palm/yr)
KY kernel yield kernel/palm/year
TEP total economic product (kg/palm/yr)
FP frond production
PCS petiole cross-section
RL rachis length
LL leaflet length
xvii
LW leaflet width
LN leaflet number
HT palm height
LA leaf area
LAI leaf area index
DIA diameter
LDW leaf dry weight
TDW trunk dry weight
FDW frond dry weight
LAR leaf area ratio
VDM vegetative dry matter
BDM bunch dry matter
TDM total dry matter
BI bunch index
NAR net assimilation rate
SD standard deviation
CV coefficient of variation
ANOVA analysis of variance
FS full-sib
BIPS bi-parental
r correlation coefficient of variation
df degree of freedom
h2B broad-sense heritability
xviii
xix
MS mean squares
EMS expected mean squares
D1 density 1 (120 palms/ha/year planted at 9.79m distance)
D2 density 2 (148 palms/ha/year planted at 8.81m distance)
D3 density 3 (170 palms/ha/year planted at 8.22m distance)
D4 density 4 (215 palms/ha/year planted at 7.31m distance) AVROS Algemene Vereniging van Rubber-planters ten Oostkust van Sumatera
(now known as Balai Penelitian Pekebun Medan) MPOB Malaysian Palm Oil Board
CHAPTER 1
INTRODUCTION
The oil palm (Elaeis guineensis) is comparatively the highest oil bearing plant. The
increase in yield performance of superior planting materials through proper plantation
management and agronomic practices has further enhanced productivity of the crop.
Oil palm development in Malaysia has been phenomenal. Starting off as an ornamental
plant, the crop has developed into a multi billion ringgit industry. Malaysia is currently
the largest producer and exporter of palm oil in the world supplying 51% of the total
world production with 13.4 million tonnes of oil in 2005 (MPOB, 2006). However, the
national average of oil palm yield, 3.80 t/ha/yr in 2005 (MPOB, 2006), was about 75%
lower than the maximum theoretical potential yield of 18.2 t/ha/yr (Corley, 1996). Thus,
efforts towards increasing oil productivity are necessary to reduce this gap.
Increasing oil yield remains the primary objective of oil palm breeding programmes. In
order to get optimum oil yield per unit area, options to emphasize on the planting
density may be more attractive. Genetic and physiological researches are possible
avenues towards this goal by producing planting materials with high FFB yield and high
oil yield with high planting density. The optimum planting density will enable optimum
growth and economic yield production of oil palm through its life span.
1
Oil palm planting density has been a topic of interest since the 1970’s. Results have
been reported from trials testing various spacing and planting patterns, thinning of
existing stands as well as variable density planting i.e. deliberately planting at high
initial density for future thinning (Mohd Nazeeb et al., 1989). High optimal densities,
leading to higher early yields, are possible in areas where palms grow relatively slow or
if suitable planting materials are used.
Sly and Chapas (1963) reported that FFB yield decline at 180 palms/ha occurred only
after the eighth year in Ghana while such decline was observed in Nigeria after the
seventh year of planting (Hartley, 1988).
Corley (1973a) observed that the general increase in yield with age during the early
bearing years was reversed with increasing density. Mok et al., (1971) recorded a
decrease in bunch weight after the fourth year, especially at densities greater than 225
palms/ha. They also noted apparently greater frond length from the third year in palms
the very high densities of 227 and 334 palms/ha. In the very fertile environments at
Dami, Papua new Guinea, the rachises of palms at the comparatively lower stand of 148
palms/ha were very significantly longer from the fifth year compared to those grown at
56 or 110 palms/ha (Breure, 1977). On coastal clay soil soils of Peninsular Malaysia,
Tan and Ng (1976) observed rachis etiolation in palms at the highest density of 185
palms/ha in the sixth year of planting. Tanipura et al., (1985) observed significantly
longer rachises from the fifth year in palms grown at 160 and 180 palms/ha on reddish
yellow podsols in North Sumatera.
2

Ramachandran et al., (1973) studied the long term effects of density on yield for the
period of seven to eighteen years and noted a consistent reduction in FFB, bunch
number and bunch weight at the highest density of 183 palms/ha. They concluded that
bunch weight decreases by about one kg for every 25 palms/ha increase in density.
Corley et al., (1973b) found that the optimum density for costal clay soils was 151
palms per hectare, 158 palms per hectare for well-fertilized inland soils and 166 palms
per ha for poorer inland soils. Based on equilateral triangular plantings with 111, 136,
161 and 185 palms per hectare, Tan and Ng (1976) observed that on per hectare basis in
coastal soils, early yields of the higher density plantings were significantly higher but
trend lasted only until the fifth year of harvest, when all treatments gave similar yields.
Within the next two years, the density of 136 palms/ha out-yielded 185 palms/ha by 9%
or 5 tonnes FFB/ha.
Density effects on eleven years old of ten open-pollinated Nigerian germplasm planted
in Kluang in 1976 under three spacings of approximately 125, 175 and 225 palms per
hectare gave drastic reduction in FFB yield with increasing density due to reduced
bunch number and also reduced bunch weight from fewer and smaller spikelets (Rao et
al., 1993). The study showed no significant effect of planting density on oil/bunch
(O/B) ratio at the 5% level. Corley (1976) also reported no significant change in O/B
with planting density besides no significant difference in fruit/bunch (F/B) ratio.
3
Hardon et al., (1969) and Corley et al., (1971a) suggested that increasing the leaf area
index by high density planting might be a promising way of improving yield of oil
palm. It has also been suggested that selection for high harvest index might be a more
effective way of increasing oil yield per hectare than selection for individual palm yield.
(Rees, 1963; Corley et al., 1971b).
Results based on 13 years yield record of commercial DxP (or 16 years planting) of a
spacing trial (120, 160 and 200 palms/ha) at MPOB’s peat area in Teluk Intan showed
continued significant increase in FFB yield and O/B with increase in planting densities
(Mohd Tayeb et al., 2002).
Two oil palm spacing trials evaluating a range of planting densities on riverine alluvial
and organic muck soil in Sabah using four DxP progenies of Oil Palm Research Station,
Banting, revealed the strong indications of positive effect of increased planting density
on oil and kernel extraction rates, through improved fruit to bunch ratio (Donough and
Betty Kwan, 1991). The palm height increment was unaffected by density until seven to
eight years after planting. Thereafter, increasing density increased height increment.
Donough and Betty Kwan, (1991) estimated that every ten palms per hectare increase in
planting density would necessitate earlier replanting by four to six months.
Although various studies were carried out to determine the effect of planting density on
oil palm productivity, there has been no known information on interaction between
various genotypes and planting densities in oil palm.
4
This study has the following objectives:
1) To evaluate the agronomic performance of different genotypes of different
source of origins planted in four different planting densities.
2) To estimate and quantify the genetic control and heritabilities of various
agronomic traits.
3) To estimate the correlation among the agronomic traits i.e. yield, bunch quality
and vegetative characters of the different progenies planted in different planting
densities.
4) To identify and select high yielding and stable oil palm genotypes with respect to
planting density.
5