Embed Size (px)
Citation preview
Reproduced with permission of the copyright owner. Further reproduction prohibited without permission.
UNIVERSITÉ DU QUÉBEC
THÈSE PRÉSENTÉE À L'UNIVERSITÉ DU QUÉBEC A TROIS-RIVIÈRES
COMME EXIGENCE PARTIELLE DU DOCTORAT EN GÉNIE PAPETIER
PAR FANG HUANG
THE MECHANISM OF RUPTURE OF EARL Y- AND LATEWOOD IN REFINING (LE MÉCANISME DE RUPTURE DU BOIS DE PRINTEMPS ET BOIS D'ÉTÉ
AU COURS DU RAFFINAGE)
JUIN 2006
Université du Québec à Trois-Rivières
Service de la bibliothèque
Avertissement
L’auteur de ce mémoire ou de cette thèse a autorisé l’Université du Québec à Trois-Rivières à diffuser, à des fins non lucratives, une copie de son mémoire ou de sa thèse.
Cette diffusion n’entraîne pas une renonciation de la part de l’auteur à ses droits de propriété intellectuelle, incluant le droit d’auteur, sur ce mémoire ou cette thèse. Notamment, la reproduction ou la publication de la totalité ou d’une partie importante de ce mémoire ou de cette thèse requiert son autorisation.
Reproduced with permission of the copyright owner. Further reproduction prohibited without permission.
11
Acknowledgements
1 would like to sincerely thank Dr. Kwei-Nam Law, and Dr. Robert Lanouette for their
constant supervision and support throughout my work at UQTR.
1 want to thank the technical staffs of the Centre Intégré en Pâtes et Papiers (CIPP),
especially Mr. Alain Marchand and Mr. Pierre Gendron, for their valuable advice
relating to handsheets testing during the experiments, and Dr. Agnès Lejeune in SEM
studies.
My thanks also go to the following students who had participated in wood chip
preparation and pulp characterization: Carolle Aurélie Okala, Guillaume Magnan,
Geneviève Rivard, Sana Walid, Sabrina Ouellet, and Frédrérick Malenfant.
The financial supports from the N atural Science and Engineering Research Council of
Canada (NSERC), Kruger. Inc. and the Foundation de l'UQTR are gratefully
appreciated.
Finally, 1 would like to thank my parents, my sister for unwavering support during my
study.
Reproduced with permission of the copyright owner. Further reproduction prohibited without permission.
iii
Summary
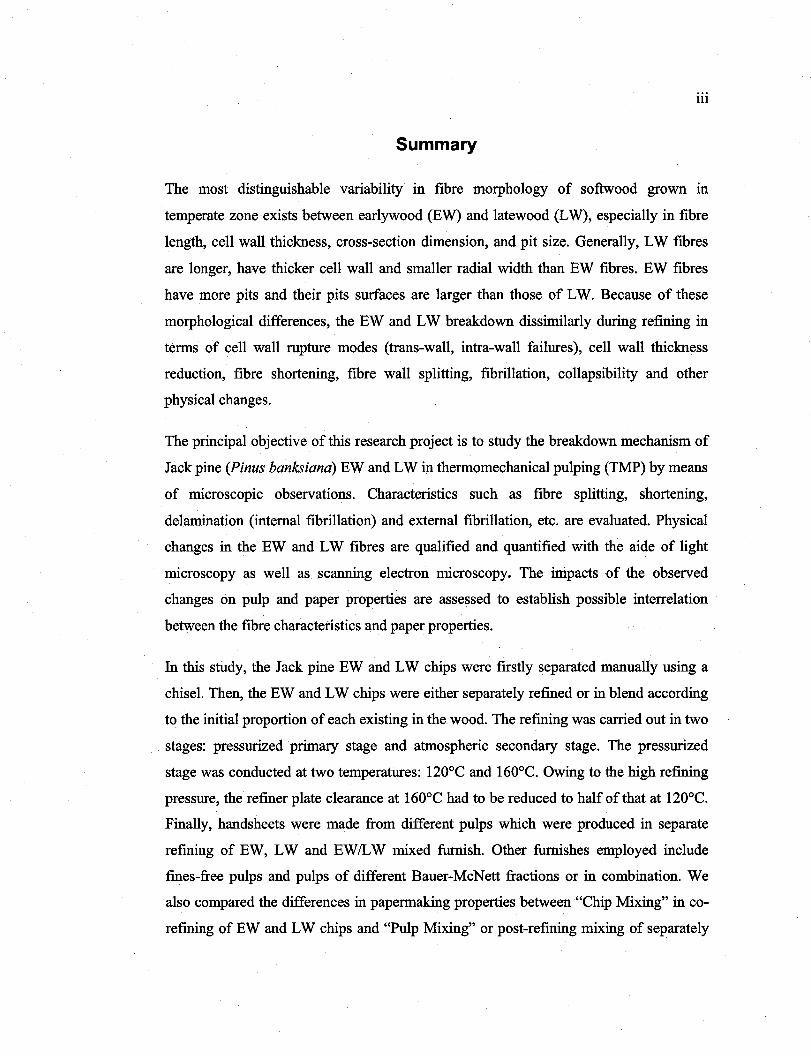
The most distinguishable variability in fibre morphology of softwood grown in
temperate zone exists between earlywood (EW) and latewood (LW), especially in fibre
length, cell wall thickness, cross-section dimension, and pit size. Generally, LW fibres
are longer, have thicker cell wall and smaller radial width than EW fibres. EW fibres
have more pits and their pits surfaces are larger than those of LW. Because of these
morphological differences, the EW and LW breakdown dissimilarly during refining in
terms of cell wall rupture modes (trans-wall, intra-wall failures), cell wall thickness
reduction, fibre shortening, fibre wall splitting, fibrillation, collapsibility and other
physical changes.
The principal objective of this research project is to study the breakdown mechanism of
Jackpine (Pinus banksiana) EWand LW in thermomechanical pulping (TMP) by means
of microscopic observations. Characteristics such as fibre splitting, shortening,
delamination (internaI fibrillation) and external fibrillation, etc. are evaluated. Physical
changes in the EW and LW fibres are qualified and quantified with the aide of light
microscopy as well as scanning electron microscopy. The inipactsof the observed
changes on pulp and paper properties are assessed to establish possible interrelation
between the fibre characteristics and paper properties.
In this study, the Jack pine EW and LW chips were firstly separated manually using a
chisel. Then, the EW and LW chips were either separately refmed or in blend according
to the initial proportion of each existing in the wood. The refming was carried out in two
stages: pressurized primary stage and atmospheric secondary stage. The pressurized
stage was conducted at two temperatures: 120°C and 160°C. Owing to the high refming
pressure, the refiner plate clearance at 160°C had to be reduced to half of that at 120°C.
Pinally, handsheets were made from different pulps which were produced in separate
refining of EW, LW and EW!LW mixed furnish. Other furnishes employed include
fmes-free pulps and pulps of different Bauer-McNett fractions or in combination. We
also compared the differences in papermaking properties between "Chip Mixing" in co
refming of EW and LW chips and "Pulp Mixing" or post-refining mixing of separately
Reproduced with permission of the copyright owner. Further reproduction prohibited without permission.
IV
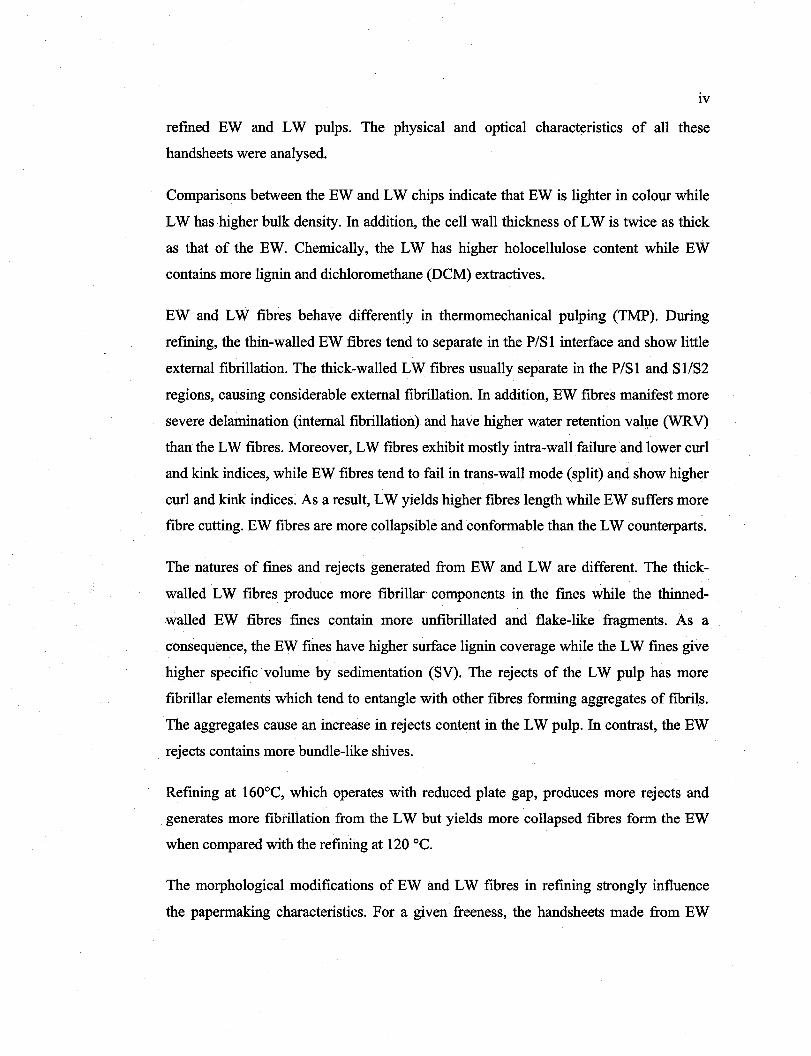
refmed EW and LW pulps. The physical and optical characteristics of all these
handsheets were analysed.
Comparisons between the EW and LW chips indicate that EW is lighter in colour while
LW has higher bulk density. In addition, the cell wall thickness of LW is twice as thick
as that of the EW. Chemically, the LW has higher holocellulose content while EW
contains more lignin and dichloromethane (DCM) extractives.
EW and LW fibres behave differently in thermomechanical pulping (TMP). During
refming, the thin-walled EW fibres tend to separate in the PISI interface and show little
external fibrillation. The thick-walled LW fibres usually separate in the PIS 1 and S1/S2
regions, causing considerable external fibrillation. In addition, EW fibres manifest more
severe delamination (internaI fibrillation) and have higher water retention value (WRV)
than the LW fibres. Moreover, LW fibres exhibit mostly intra-wall failure and lower curl
and kink indices, while EW fibres tend to fail in trans-wall mode (split) and show higher
curl and kink indices. As a result, LW yields higher fibres length while EW suffers more
fibre cutting. EW fibres are more collapsible and conformable than the LW counterparts.
The natures of fines and rejects generated from EW and LW are different. The thick
walled LW fibres produce more fibrillar components in the fines while the thinned
walled EW fibres fmes contain moreunfibrillated and flake-like fragments. As a
consequence, the EW fines have higher surface lignin coverage while the LW fines give
higher specific volume by sedimentation (SV). The rejects of the LW pulp has more
fibrillar elements which tend to entangle with other fibres forming aggregates of fibrils.
The aggregates cause an increase in rejects content in the LW pulp. In contrast, the EW
rejects contains more bundle-like shives.
Refining at 160°C, which operates with reduced plate gap, produces more rejects and
generates more fibrillation from the LW but yie1ds more collapsed fibres form the EW
when compared with the refming at 120 oC.
The morphological modifications of EW and LW fibres in refining strongly influence
the papermaking characteristics. For a given freeness, the handsheets made from EW
Reproduced with permission of the copyright owner. Further reproduction prohibited without permission.
v
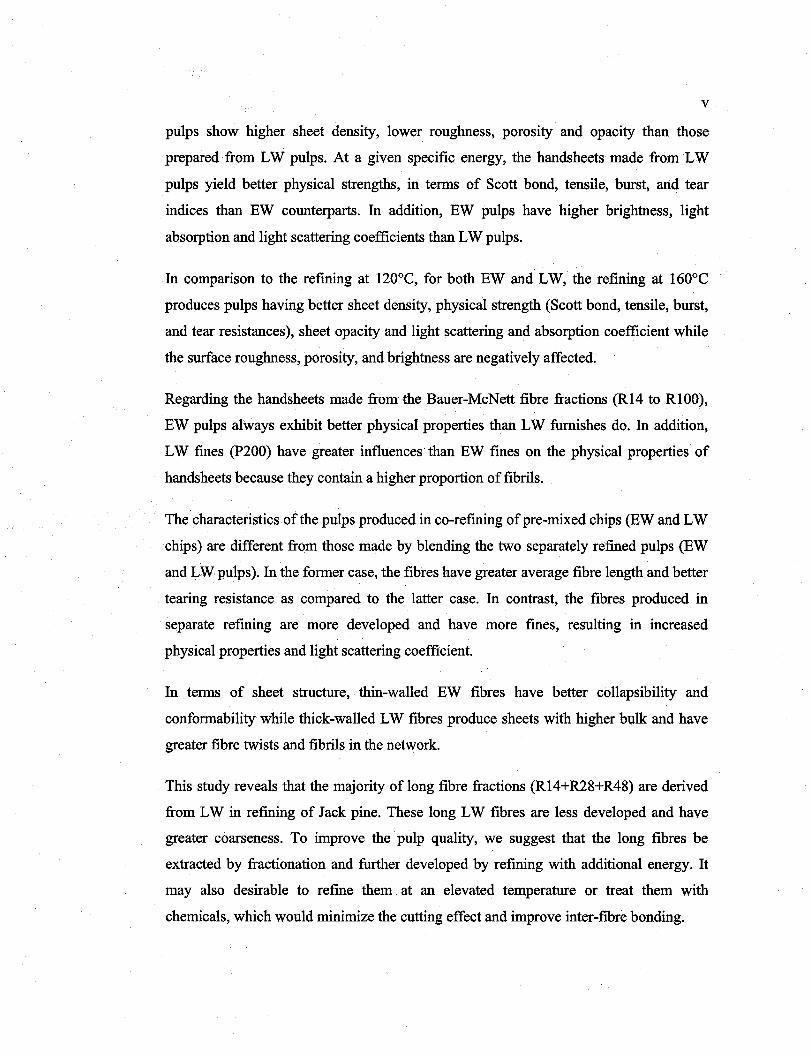
pulps show higher sheet density, lower roughness, porosity and opacity than those
prepared from LW pulps. At a given specific energy, the handsheets made from LW
pulps yield better physical strengths, in terms of Scott bond, tensile, burst, and tear
indices than EW counterparts. In addition, EW pulps have higher brightness, light
absorption and light scattering coefficients than LW pulps.
In comparison to the refining at 120oe, for both EW and LW, the refining at 1600 e produces pulps having better sheet density, physical strength (Scott bond, tensile, burst,
and tear resistances), sheet opacity and light scattering and absorption coefficient white
the surface roughness, porosity, and brightness are negatively affected.
Regarding the handsheets made fromthe Bauer-McNett fibre fractions (R14 to RlOO),
EW pulps always exhibit better physicaI properties than LW furnishes do. In addition,
LW fines (P200) have greater influences· than EW fines on the physical properties of
handsheets because they contain a higher proportion of fibrils.
The characteristics of the pulps produced in co-refining of pre-mixed chips (EW and LW
chips) are different from those made by blending the two separately refined pulps (EW
and LW pulps). In the former case, the fibres have greater average fibre length and better
tearing resistance as compared to the latter case. In contrast, the fibres produced in
separate refming are more developed and have more fines, resulting in increased
physical properties and light scattering coefficient.
In terms of sheet structure, thin-walled EW fibres have better collapsibility and
conformability while thick-walled LW fibres produce sheets with higher bulk and have
greater fibre twists and fibrils in the network.
This study reveals that the majority of long fibre fractions (R14+R28+R48) are derived
from LW in refming of Jack pine. These long LW fibres are less developed and have
greater coarseness. To improve the pulp quality, we suggest that the long fibres be
extracted by fractionation and further developed by refining with additional energy. It
may also desirable to refine them at an elevated temperature or treat them with
chemicals, which would minimize the cutting effect and improve inter-fibre bonding.
Reproduced with permission of the copyright owner. Further reproduction prohibited without permission.
VI
Keywords: Pinus banksiana, earlywood, latewood, Thennomechanical pulping, fibre
morphology, light microscopy, scanning electron microscopy, physical and optical
properties
Reproduced with permission of the copyright owner. Further reproduction prohibited without permission.
vii
Résumé
Il existe une grande variation de morphologie des fibres entre le bois de printemps (BP)
et le bois d'été (BE) chez les résineux dans la zone tempérée. Ces variations incluent
notamment la longueur des fibres, l'épaisseur de paroi cellulaire, la dimension
transversale et la taille des ponctuations. En général, les fibres de BE sont plus longues
que celles de BP. Dans la section transversale, les fibres de BE ont des parois plus
épaisses et des largeurs radiales plus étroites par rapport à celles de BP. Le BP présente
des ponctuations plus nombreuses et ayant des surfaces plus grandes que celles de BE. À
cause de ces différences structurelles, les fibres du BP et du BE auraient des
comportement différents au cours du raffmage au niveau du mode de rupture (inter ou
intra cellulaire), de la réduction en épaisseur, du clivage de la paroi cellulaire, de la
coupure en longueur, de la fibrillation, de l'aplatissement et d'autres changements
physiques.
Cette étude a pour objectif principal d'examiner le mécanisme de rupture du HP et du
BE de pin gris (Pinus banksiana) au cours de la mise en pâte thermomécanique (PTM) à
l'aide de la microscopie. Les caractéristiques telles que le clivage de la paroi cellulaire,
de la coupure en longueur, de la délamination (la fibrillation interne) et de la fibrillation
externe sont évaluées. Les changements physiques de fibres du BP et du BE sont
qualifiés et quantifiés avec l'aide du microscope optique et du microscope électronique à
balayage (MEB). Les impacts de ces changements sur les propriétés du papier sont
évalués, ce qui pourrait nous aider à établir les rapports possibles entre les
caractéristiques des fibres et celles du papier.
Dans cette étude, les copeaux du BP et du BE de pin gris sont d'abord séparés
manuellement à l'aide d'un ciseau à bois. Par la suite, les copeaux du BP et du BE ont
été raffinés individuellement ou en mélange selon la proportion massique initiale dans le
bois entier. Le raffmage s'est réalisé en deux étapes: une 1re étape pressurisée à 120°C et
160°C et une i ème étape à pression atmosphérique. À cause de la haute pression à
160°C, la distance entre les plaques du raffineur a due être réduite de la moitié par
rapport à celles utilisée à 120°C pour obtenir raffmage semblable. Finalement, des
Reproduced with permission of the copyright owner. Further reproduction prohibited without permission.
Vlll
feuilles ont été fabriquées à partir des différentes pâtes produites à partir de copeaux de
BP et de BE seuls ainsi qu'avec leurs mélanges. Des formettes ont aussi été fabriquées à
partir de pâtes sans fines et de pâtes des différentes de fractions Bauer-McNett ainsi que
leurs combinaisons. On a également examiné les caractéristiques des feuilles qui
proviennent de deux processus de mélange de BP et de BE, c'est-à-dire, le «mélange des
copeaux avant raffinage» et le «mélange des pâtes après raffmage». Les propriétés
physiques et optiques ont été évaluées pour toutes les sortes de feuilles.
La comparaison entre les copeaux de BP et de BE démontre que le BP est plus clair que
le BE. Ce dernier a une densité basale plus grande que le premier. Par ailleurs,
l'épaisseur de paroi cellulaire du BE est presque le double de celle du BP. La
composition chimique de ces deux bois est aussi différente. Le BE contient plus
d'hollocellulose que le BP, mais ce dernier a plus de lignine et plus des matières
extractibles dans le dichloromethane (DCM) que le BE.
Le BP et le BE se comportent différemment dans la mise en pâte thermomécanique
(PTM). Le BP présente une paroi plus mince et a tendance à se séparer à l'interface P/Sl
en manifestant peu de fibrillation externe. Le BE, à paroi plus épaisse, est souvent brisé
dans les régions P/Sl et S1/S2, ce qui cause une fibrillation externe considérable. De
plus, les fibres de BP montrent des délaminations (fibrillation interne) et des capacités
de rétention d'eau «water retention value» plus importantes que celles de BE. Les fibres
des BP exhibent principalement des ruptures trans-paroi cellulaire (clivage) alors que
celles de BE sont plutôt intre-paroi. Les fibres de BP ont un indice de courbure «curl
index» et un indice en dents de scie <drink index» plus élevés que celles de BE. Par
conséquence, au cours du raffmage, le BE produit plus de fibres longues alors que les
fibres de BP subissent plus de coupures en longueur. En outre, le BP, à paroi plus mince,
manifeste un degré d'aplatissements et de conformabilité plus grand que le BE qui a une
paroi plus épaisse.
La production de fines et de rejets du BP et du BE est différente au cours du raffinage.
Les fibres de BE produisent plus de fines de type fibrillaire tandis qu l'on retrouve plus
de fines en flocons dans les fmes de BP. Ces dernières contiennent plus de lignine à
leurs surfaces alors les premières ont des volumes spécifiques par sédimentation (VS)
Reproduced with permission of the copyright owner. Further reproduction prohibited without permission.
IX
plus grands. Dans les rejets, les fibres de BE ont également plus de fibrilles. Les
agrégats de ces fibrilles rendent la production de rejets de BE plus élevée que pour le
BP. Par contraste, les rejets de BP contiennent plus de bûchettes.
Lors du raffinage à 160°C, la distance entre les plaques du raffineur doit être réduite
pour obtenir le même niveau de raffinage, ce qui produit plus de rejets (emmêlement des
flocons et des fibrilles) et génère plus de fibrillation externe pour le BE tandis que, pour
le BP, plus de fibres écrasées sont présentes lors de la comparaison avec le raffinage à
120°C.
Les différences mécanisme de rupture du BP et du BE au cours du raffmage influencent
fortement les caractéristiques physiques et optiques du papier. Pour un indice
d'égouttage donné, les feuilles fabriquées à partir des pâtes de BP ont une densité plus
élevée mais une rugosité, une porosité et une opacité plus basses que celles de BE. Pour
une énergie donnée, les feuilles faites à partir de pâte de BE ont des résistances
physiques, telles que la cohésion interne «Scott bond», l'allongement, l'éclatement ainsi
que la déchirure plus fortes que celles de BP. De plus, les feuilles de BP ont des
blancheurs supérieures, un coefficient d'absorption de la lumière ainsi qu'un coefficient
de diffusion de la lumière plus élevées par rapport à celles de BE.
En comparaison avec le raffinage à 120°C, pour le BP et le BE, le raffinage à 160°C
produit des feuilles qui ont une plus grande densité et des résistances physiques
(cohésion interne «Scott bond», allongement, éclatement et déchirure) supérieures.
L'opacité ainsi que les coefficients d'absorption et de diffusion de la lumière sont plus
élevés tandis que la rugosité, la porosité et la blancheur des feuilles sont négativement
affectées.
Dans les tests des feuilles fabriquées à partir des fractions Bauer-McNett (de R14 à
RIOO), les BP exhibent toujours propriétés physiques supérieures à celles de BE. En
outre, les fmes (P200) de BE ont une influence plus importante que celles de BP au
niveau des résistances physiques des feuilles car elles contiennent une haute proportion
de fibrilles.
Reproduced with permission of the copyright owner. Further reproduction prohibited without permission.
x
Les pâtes démontrent des caractéristiques différentes dans les deux processus de
mélange de BP et de BE tels que le «mélange de copeaux» et le «mélange de pâtes».
Dans le premier cas, les fibres sont plus longues et ont une meilleure résistance à la
déchirure que celles dans le dernier cas. Par contraste, les fibres dans le processus de
«mélange de pâtes» sont mieux développées et ont plus de fines. Cela a une influence
positive sur les caractéristiques des feuilles au niveau des propriétés physique et du
coefficient de diffusion de la lumière par rapport au processus «mélange de copeaux».
En observant la structure des feuilles, les fibres de BP avec les parois plus minces ont un
plus grand degré d'aplatissement et de conformabilité. Néanmoins, les feuilles
fabriquées de fibres de BE sont plus bouffantes et ont plus de torsion dans les fibres
ainsi que plus de fibrilles.
Cette étude révèle que la majorité des fibres longues dans les fractions R14, R28 et R48
proviennent du BE au cours du raffinage. De plus, ces fibres longues du BE sont moins
développés et ont des masses linéiques plus élevées. Afin d'améliorer les qualités de la
pâte, on conseille de séparer les fibres de BP à partir des fractions de fibres longues par
fractionnement avant d'imposer une énergie supplémentaire aux fibres longues (ou aux
fibres de BE) pour les développer. Il semble préférable de raffiner ces fibres à
température plus élevée ou après un traitements chimiques, ce qui est favorable pour
ramollir les fibres et minimiser la coupure de fibre en longueur. Une telle pratique
pourrait certainement améliorer les liens inter fibres et la qualité de la pâte.
Mots clés: Pinus banksiana, bois de printemps, bois d'été, mise en pâte
thermomécanique, morphologie des fibres, microscopie optique, microscopie
électronique à balayage, propriétés optique et physique

Reproduced with permission of the copyright owner. Further reproduction prohibited without permission.
xi
Résumé substantiel
PROBLÉMATIQUE
Le bois est un matériel ayant des caractéristiques chimiques et physiques variables entre
les espèces, entre les arbres de la même espèce et même entre les différences parties de
la tige à l'intérieur d'un même arbre. Cependant, dans la zone tempérée, les plus grandes
variations morphologiques des fibres se trouvent entre le bois de printemps (BP) et le
bois d'été (BE) chez les résineux. En général, les fibres de BP ont un périmètre extérieur
plus grand, une paroi cellulaire plus mince ainsi qu'une largeur radicale plus grande par
rapport à celles du BE. Ces différences ont des effets sur, non seulement les propriétés
des fibres telles que la densité et les résistances mécaniques, mais aussi sur les mises en
pâte chimique et mécanique ainsi que sur les propriétés du papier.
Lors du raffmage, les parois cellulaires du BP brisent plus facilement car leur épaisseur
est plus mince, elles ne supportent pas les forces mécaniques causées par les barres du
raffmeur. Par contre, les fibres de BE, aux parois plus épaisses, ont des résistances plus
fortes à l'action du raffinage et ainsi subissent des réductions importantes d'épaisseur au
cours du raffinage.
Due à leur paroi cellulaire plus mince, les fibres du BP ont tendances à changer de forme
transversalement facilement en manifestent un plus grand degré d'aplatissement et de
flexibilité. Inversement, les fibres de BE, aux parois plus épaisses sont plus résistantes à
de tels changements au cours du raffinage. Des rapports précédents montrent que le BP
se brise en fragments de formes irrégulières (bûchettes) tandis que le BE se désintègre
en fibres individuelles. Des recherches indiquent aussi que le BP a besoin de plus
d'énergie pour atteindre le même niveau d'indice égouttage que le BE.
De plus, à cause de leurs différences morphologiques, le BP et le BE influencent
différemment les propriétés du papier. Par exemple, les fibres de BP produisent un
papier de haute densité, tandis que les fibres de BE produisent des papiers avec une
rugosité et une résistance à la déchirure plus élevées.
Reproduced with permission of the copyright owner. Further reproduction prohibited without permission.
xii
Malgré ces découvertes, il y encore des questions sans réponse: comment ces deux types
de bois se transforment-ils du bois solide en des fibres individuelles? De quelle manière
contribuent-ils aux résistances physiques du papier? Dans cette investigation, nous
espérons apporter un peu de lumière sur ces questions. Effectivement, bien que des
progrès se fassent au niveau de la compréhension de la théorie du raffinage, il y a très
peu de connaissance sur les mécanismes de rupture du BP et du BE au cours du
raffmage, particulièrement dans la mise en pâte thermomécanique (PTM). De
nombreuses questions ne sont pas élucidées, surtout sur la réaction du BP et du BE en
fonction de la température du raffinage, leur mécanisme de rupture (inter ou intra
cellulaire) ainsi que sur leur consommation énergétique. Jusqu'à ce jour, nous savons
peu de chose sur les rapports entre les changements morphologiques du BP et du BE au
cours du raffmage et leur influence sur les propriétés du papier. DanS cette étude, un
processus systématique de recherche est proposé, sur la séparation du BP et du BE, sur
la mise en pâte thermomécanique à différentes températures, ainsi que sur la
caractérisation des feuilles. Des séries d'analyses physique et chimique sont réalisées
dans chaque étape expérimentale. Ces études nous aideront à mieux comprendre les
mécanismes de rupture de ces deux types de bois pour ainsi améliorer les qualités des
pâtes qui proviennent du pin gris puisque il est présentement sous-exploité et moins
désirable dans les industries forestières. Le fruit de cette recherche nous aidera
également à améliorer l'efficacité du raffinage.
OBJECTIF
Cette étude a pour un objectif principal d'examiner le mécanisme de rupture du BP et du
BE dans la mise en pâte thermomécanique (PTM) par le biais d'observations au
microscope. Les caractéristiques telles que le clivage des fibres, la réduction de la
longueur, la délamination (fibrillation interne) ainsi que la fibrillation externe, etc. sont
évaluées. Les changements physiques des fibres de BP et de BE sont qualifiés et
quantifiés à l'aide du microscope optique et du microscope élèctronique à balayage
(MEB). Des changements observés sont évalués dans le but d'établir un lien entre les
caractéristiques des fibres et les propriétés du papier.
Les points importants dans cette étude sont les suivants:
Reproduced with permission of the copyright owner. Further reproduction prohibited without permission.
X111
1. Indentification des fibres de BP et de BE dans les pâtes d'après leurs différences
morphologiques telles que l'épaisseur cellulaire, la taille et la distribution des
ponctuations et la taille du lumen;
2. Détermination des compositions chimiques du BP et du BE, notamment la
cellulose, les hémicelluloses et la lignine;
3. Évaluation des changements physiques des fibres de BP et de BE au cours du
raffinage, particulièrement sur le clivage de fibre, la délamination de la paroi
cellulaire, la coupure en longueur des fibres, les productions de-fines et de rejets;
4. Mesures des propriétés optiques et physiques des feuilles fabriquées par des
pâtes de BP et de BE.
Plusieurs analyses sont employées pour caractériser les propriétés physiques des fibres
ainsi que les changements structurels résultant de l'action de raffmage. Les aspects
d'analyses incluent:
• Modifications morphologiques des fibres telles que les modes de séparation, le
changement de longueur, la surface de lumen, l'épaisseur de la paroi cellulaire, le
clivage, l'aplatissement ainsi que la fibrillation externe et interne;
• Les caractéristiques de feuille telles que la densité, l'indice de rupture, l'indice
d'éclatement, l'indice de déchirure, la porosité, la rugosité, la blancheur, le
coefficient de diffusion de la lumière, le coefficient d'absorption de la lumière.
Les résultas de ces analyses sont reliées avec les observations microscopiques en
espérant établir des liens entre les caractéristiques des fibres et les propriétés du
papier.
MÉTHODOLOGIE
Afm d'étudier le mécanisme de rupture de BP et BE dans la mIse en pâte
thermomécanique (PTM), nous avons élaboré des processus expérimentaux, incluant des
méthodes pour caractériser les propriété physiques et chimiques du BP et du BE sous
différentes formes, c'est-à-dire sous forme de copeaux, de pâtes et de feuilles.
Reproduced with permission of the copyright owner. Further reproduction prohibited without permission.
xiv
Préparation des matériaux
Des billes de pin gris (Pinus banksiana Lam.) fraîchement coupées sont utilisées dans
cette expérimentation. Le pin gris provient d'une plantation de 30 ans de la région de la
Mauricie. Les billes sont d'abord coupées en rondelles de 2,5 cm d'épaisseur à l'aide
d'une scie mécanique. Par la suite, les rondelles sont écorchées manuellement avec un
ciseau à bois. Les copeaux sont préparées à partir de l'aubier en excluant le bois de cœur
afm que minimiser les effets des matières extractibles sur les propriétés de la pâte. Des
copeaux de BP et de BE d'environ 2-3 cm en largeur et en longueur, sont ainsi préparés
manuellement avec un ciseau à bois. L'épaisseur des copeaux varie en fonction de la
largeur des anneaux de croissance ainsi que de la proportion de BP et de BE dans cette
région. La séparation du BP te du BE est basée sur leur différence en couleur, car le BE
est plus foncé que le BP.
Raffinage
Les pâtes de BP et de BE ont été produites avec le raffmeur de laboratoire CD 300
(Mesto Inc.) du Centre Intégré en Pâtes et Papiers d l'UQTR. Les copeaux de BP et de
BE sont raffinés individuellement ou en mélange selon leur proportion massique initiale
dans le bois entier. Les raffmages sont divisés en deuX étapes. La première étape
s'effectue sous pression à des températures de 120 oC et 160 oC, tandis que la seconde
étape est à pression atmosphérique. L'indice d'égouttage de la pâte dans la première
étape est d'environ 500 mL, tandis que dans la deuxième une plage de 50-250 mL est
ciblée. La consistance de la première étape est plus élevée que celle de la deuxième
étape, soient 20-24% contre 10-14%. De plus, dû à la haute pression de raffinage avec la
température de 160°C, l'entrefer dans cette condition est plus bas que celui à
température moins élevée, soit 120°C.
Fractionnement de la pâte
Les pâtes du deuxième stade de raffinage sont fractionnées sur un appareil de classage
Bauer-McNett en 6 fractions: R14, R28, R48, R100, R200 et P200 (fines). Cette
méthode de fractionnement de fibre est généralement utilisée· pour caractériser les
Reproduced with permission of the copyright owner. Further reproduction prohibited without permission.
xv
distributions en longueur des fibres des pâtes. Les fibres dans chaque fraction sont
morphologiquement différentes, ce qui pourrait avoir une influence sur les propriétés du
papier. Par exemple, les fibres longues de la fraction R14 sont rigides et leur surface
moins fibrillée offre peu de contact pour les liaisons inter-fibres. Les matières fmes P200
sont définies comme les particules qui passent à travers un tamis 200 mailles au pouce
du classificateur Bauer-McNett. Les fmes sont celles que l'on retrouve dans la pâte, soit
les cellules de parenchyme, les rayons ainsi que les débris de la paroi cellulaire SI et S2.
Les fmes ont une haute surface spécifique (de 10 à 50 m2Jg alors les fibres ont une
surface de 1 m2Jg) , ce qui favorise une meilleure consolidation de la feuille lors du
séchage en augmentant les forces de compression sous l'effet de la tension de surface.
De plus, les fmes augmentent la surface de contact en remplissant les cavités ou pores.
Caractérisation de la pâte
Les fibres dans chaque fraction sont caractérisées sur leur mode de rupture (inter et intra
cellulaire), la délamination de la paroi, le clivage des fibres, les fibrillations externes et
internes, ainsi que l'aplatissement. Ces analyses sont réalisées par microscopies optique
et électronique. De plus, le volume spécifique par sédimentation (VS) des fmes est
évalué. Il présente une mesure du degré de développement de la pâte, surtout au niveau
de la fibrillation externe. Ce concept est toutefois utilisé pour les pâtes après un
traitement mécanique tel le raffinage. Aussi, la fibrillation interne peut se qualifier par
une mesure de rétention d'eau de gonflement «Water Retention Value». La fibrillation
interne (délamination) correspond à un gonflement de la paroi cellulaire suite à une
action mécanique telle que le raffinage. Le gonflement de la fibre s'effectue par un
clivage tangentiel des fibrilles élémentaire de la macro fibrille. De toute évidence, la
présence de ces caractéristiques sur les fibres .implique une augmentation appréciable de
la flexibilité des fibres dans les feuilles.
La longueur des fibres, l'indice de courbure «curl index», l'angle de brisure «kink
index» et la masse linéique sont déterminées à l'aide d'appareil optique sur des
suspension de fibres dans l'eau tel que le FQA «Fibre Quality Analyser, Optest
Equipmenb>. Au cours du raffinage, les fibres peuvent êtres coupées (i.e. réduction de la
longueur), courbées (i.e. indice de courbure «curl» et indice en dents de scie «kink») ou
Reproduced with permission of the copyright owner. Further reproduction prohibited without permission.
XVI
fibrillées en diminuant la masse linéique de la fibre. La facilitée avec laquelle les fibres
changent morphologiquement dépend de l'épaisseur de la paroi cellulaire ainsi que de la
flexibilité des fibres. Toutes ces modifications sont d'une grande importance pour
obtenir une meilleure formation du papier. Par exemple, la porosité et l'absorption d'eau
augmentent avec la courbure des fibres. Une diminution de longueur entraîne une
augmentation au niveau de l'opacité et du fmi de surface des feuilles.
Le pourcentage de rejets est déterminé par l'appareil «Pulmac Shive Analyzer,
MasterScreen) tandis que le pourcentage des fines est obtenu par le classificateur Bauer
McNett.
L'épaisseur de paroi cellulaire de fibre est évaluée à l'aide d'un appareil tel l'analyseur
d'épaisseur de paroi de fibre (Techpap, France). Ce paramètre est une caractéristique
morphologique importante qui est liée avec la rigidité des fibres ou à leur habileté à
créer des liaisons entre les fibres. Cette mesure nous apporte des informations sur la
réponse de fibre au raffinage.
Fabrication de feuille
En général, les fibres longues des fractions R14, R28 et R48 sont rigides, moms
développées et présentent peu de contacts inter fibres. Les fines (P200) comprennent
des particules en rubans, des rayons ainsi que des fibrilles. Les fines de pâte mécanique
jouent un rôle important pour les résistances physiques de la feuille. Afm de mieux
comprendre l'influence des caractéristiques de fibres sur les propriétés papetières,
plusieurs catégories de feuilles sont faites à partir de différentes fractions Bauer-McNett
de BP et de BE ainsi que leurs mélanges. Les feuilles sont fabriquées à partir des pâtes
comme suit:
• Pâte entière;
• Pâte sans fines (P200);
• Combinaison des fractions de fibres longues (R14+R28+R48);
Reproduced with permission of the copyright owner. Further reproduction prohibited without permission.
XVll
• Combinaison des fractions de fibres courtes (RI00+R200+P200);
• Fractions individuelles R14, R28, R48 et RIOO;
• Mélange des pâtes de BP et de BE après le raffinage. Ce mélange a la même
proportion massique que le mélange des copeaux de BP et de BE avant le
raffmage. Les comparaisons nous permettent de comprendre l'effets de mélange
pour les deux processus, soient le co-raffmage et le raffinage individuel de BP et
BE.
Caractérisation de feuille
Les propriétés physiques, chimiques, et optiques sont analysées sur les feuilles des pâtes
du deuxième stade de raffinage. À partir de ces mesures, on espérait établir des liens
possibles entre les caractéristiques de fibres et les propriétés papetières.
a. Propriétés physiques telles que l'allongement, la déchirure, l'éclatement, la
densité, la porosité, la rugosité, et la liaison inter fibres (Scott Bond);
b. Propriété chimique telle que la teneur de lignine à la surface de fibre
(spectroscopie par rayon X);
c. Propriétés optiques telles que la blancheur, le coefficient de diffusion de la
lumière, le coefficient d'absorption de la lumière et l'opacité;
d. Propriétés structurelles telle que l'angle de torsion de la fibre dans la feuille, qui
pourraient être mesurées par microscopie électronique à balayage (MEB).
e. Les caractéristiques intrinsèques telles que l'épaisseur de parois cellulaires, la
taille du lumen, l'aplatissement, le clivage des fibres sont aussi analysées par la
MEB.
Reproduced with permission of the copyright owner. Further reproduction prohibited without permission.
XV111
RÉSULTAS ET DISCUSSION
1. Caractéristiques des matières primaires
La couleur des copeaux de BP est plus claire que celle du BE. Ce dernier a une densité
basale plus élevée. De plus, il contient plus de fibres longues dans la matrice du bois.
Les fibres de BE ont une double épaisseur de paroi cellulaire plus grande que celle du
BP. Les feuilles produites à partir de pin gris ont des résistances physiques inférieures à
celles fabriquées d'essences traditionnelles telles que l'épinette car la première contient
une proportion importante de BE.
Quant aux compositions chimiques, le BE a plus d'holocellulose que le BP, alors que ce
dernier contient plus de lignine. De plus, le BP a plus de matières extractibles dans le
dichlorométhane (DCM) puisque il a plus de canaux résinifères, abondants en résine.
Ceci pourrait être à l'origine des problèmes de poix associés au pin gris dans la mise en
pâte.
2. Caractéristiques des pâtes, pour un indice d'égouttage donné
À cause de leurs différences morphologiques, le BP et le BE se comportent
différemment lors de la mise en pâte thermomécanique (PTM), aussi bien au niveau de
la séparation que du développement des fibres. Le HP, à la paroi mince, a tendance à se
séparer dans l'interface P/SI en manifestant peu de fibrillation externe tandis que le BE,
à paroi plus épaisse, est souvent brisé dans les régions P/Sl et Sl/S2, ce qui cause une
fibrillation externe considérable. De plus, les fibres de BP présente une délamination
(fibrillation interne) et une capacité de rétention d'eau «water retention value» plus
importantes que celles de BE.
Au cours du raffmage, les fibres de BE sont plus résistantes que celles de BP aux forces
mécaniques. Les fibres de BP exhibent principalement des ruptures trans-paroi cellulaire
(clivage) alors que celles de BE sont plutôt de type inter-paroi. Les fibres de BP ont un
indice de courbure «curl index» et un indice en dents de scie <<kink: index» plus élevés
que celles de BE. Par conséquent, au cours du raffinage, le BE produit plus de fibres
longues que les fibres du BP, qui subissent plus de coupures en longueur.
Reproduced with permission of the copyright owner. Further reproduction prohibited without permission.
xix
Face aux forces de compression existant dans le raffinage, les fibres de BP et de BE
manifestent des déformations transversales différentes. Grâce à leur paroi cellulaire plus
mince et à un lumen plus large, les fibres de BP montrent plus d'aplatissement et de
conformabilité que celles de BE qui ont des parois plus épaisses.
La production de fines et de rejets du BP et du BE est fortement influencée par leur
modification morphologique au cours du raffinage. Les fibres de BE sont fibrillées
(fibrillation externe) considérablement en produisant plus d'éléments fibrillaires dans
leurs fines tandis qu'on trouve plus de flocons dans les fines de BP. Par conséquent, les
fmes de BP contiennent plus de lignine à leur surface que celles de BE qui ont un
volume spécifique (VS) plus grand. Principalement en raison de leur développement de
fibre différent, les rejets de BP et de BE sont qualitativement et quantitativement
différents. Dans les rejets, les BE ont également plus de fibrilles. Les agrégats de ces
fibrilles rendent la production de rejets de BE plus élevée que le BP. Par contraste, les
rejets de BP contiennent plus de bûchettes.
Lors du raffinage à 160°C, la distance des plaques du raffineur doit être réduite pour
obtenir le même niveau de raffmage, ce qui produit plus de rejets (emmêlement des
flocons et des fibrilles) et génère plus de fibrillation externe pour le BE tandis que, pour
le BP, plus de fibres écrasées apparaissent en comparaison avec le raffinage à 120°C.
3. Caractéristiques des feuilles
La différence dans la mode de rupture du BP et BE au cours du raffinage influence
fortement les caractéristiques physiques et optiques du papiers. Pour un indice
d'égouttage donné, grâce à leur conformabilité des fibres supérieure, les feuilles
fabriquées à partir des pâtes de BP ont une densité plus élevée, mais une rugosité, une
porosité et une opacités plus basse que celles de BE. Pour une énergie donnée, en raison
de leurs fibres hautement fibrillées ainsi que leur abondance d'élément fibrillaires dans
leur fmes, les feuilles de BE ont des résistances physiques plus fortes que celles de BP
telles que le «Scott bond», l'allongement, l'éclatement ainsi que la déchirure. De plus,
les feuilles de BP ont des blancheurs supérieures dues à leurs valeurs initiales plus
élevées. En outre, les pâtes de BP ont un coefficient d'absorption de la lumière plus
Reproduced with permission of the copyright owner. Further reproduction prohibited without permission.
xx
grand que celles de BE car elles contiennent plus de lignine. Les pâtes de BP ont aussi
un coefficient de diffusion de la lumière plus élevée par rapport à celles de BE
puisqu'elles produisent plus de particules en flocons dans les fmes, ce qui est favorable
pour la diffusion de la lumière.
En comparaison avec le raffinage à 120°C, pour le BP et le BE, le raffmage à 160°C
produit des feuilles qui ont une plus forte densités et des résistances physiques telles que
la cohésion interne «Scott bond», l'allongement, l'éclatement et la déchirure, l'opacité,
ainsi que les coefficients d'absorption et de diffusion de la lumière plus élevés. La
rugosité, la porosité et la blancheur des feuilles sont négativement touchées .. Ces
caractéristiques sont expliquées par l'augmentation du contenu en fines et un plus grand
aplatissement des fibres dans le raffinage à 160°C par rapport à celui à 120°C.
Dans les tests des feuilles fabriquées à partir des fractions Bauer-McNett (de Rl4 à
RIOO), malgré leur bas degré de fibrillation dans ces fractions de fibres, le BP exhibe
toujours des propriétés physiques supérieures à celles de BE. Il semble que les fibres de
BP manifestent un plus grand indice de conformabilité pendant la consolidation de
feuille en formant de meilleures liaisons inter-fibres que celles de BE.
Les fines de pâte thermomécanique (PTM) jouent un rôle important pour les propriétés
physiques des feuilles telles que la densité, l'allongement, l'éclatement, la déchirure, la
rugosité, la porosité ainsi les propriétés optiques. En raison des différences dans les
compositions de fmes, les fines du BP et du BE démontent des contributions différentes
aux propriétés physiques des pâtes. Les fmes (P200) de BE ont des influences plus
importantes que celles de BP aux niveaux des résistances physiques des feuilles car elles
contiennent une haute proportion de fibrilles, ce qui est plus bénéfique aux liaisons inter
fibres que les flocons produit par le BP.
Les pâtes démontrent des caractéristiques différentes dans les deux processus de
mélange de BP et de BE tels que le «mélange de copeau» et le «mélange de pâtes». Les
interactions du BP et du BE sont différentes dans ces deux processus. Cela rend les
propriétés des feuilles différentes. Lors du raffinage en mélange des copeaux,
.probablement en raison d'un effet tampon possible, les fibres à parois minces de BP sont
Reproduced with permission of the copyright owner. Further reproduction prohibited without permission.
XXI
protégées par les fibres à parois épaisses de BE contre le traitement mécanique sévère au
cours du raffmage. En conséquence, les fibres sont plus longues et ont une meilleure
résistance à la déchirure que lorsque les pâtes sont mélangées après raffinage. Par
contraste, les fibres dans ce dernier cas sont mieux développées et ont plus de fines. Cela
a une influence positive sur les caractéristiques des feuilles aux niveaux des propriétés
physiques et du coefficient de diffusion de la lumière par rapport au raffinage des
copeaux en mélange.
En observant la structure de feuilles, on note que les fibres du BP à paroi plus mince
présentent un plus grand aplatissement et une meilleure conformabilité. Néanmoins, les
feuilles fabriquées de fibres de BE sont plus bouffantes. Les fibres ont un niveau de
torsions plus grand et ont plus de fibrilles que le BP.
Cette étude révèle que la majorité fibres longues dans les fractions telles que les
(R14+R28+R48) provient du BE. De plus, ces fibres longues du BE sont moins
développées et ont des masses linéiques plus élevées. Afm d'améliorer la qualité de la
pâte, on conseille de séparer les fibres de BP de ces fractions de fibres longues par
fractionnement avant d'appliquer une énergie supplémentaire sur ces fibres longues (ou
de BE) pour les développer. Il est désirable de raffiner ces fibres à une température plus
élevée ou après un traitement chimique, ce qui est favorable pour ramollir les fibres et
minimiser la coupure de fibre en longueur. Une telle pratique pourrait certainement
améliorer les liens inter fibres et la qualité des pâtes.
D'autres efforts génétiques tels que la technique de clonage, croisement de différentes
espèces d'arbres seraient favorables pour l'exploitation de pin gris. Ces pratiques ont
pour but de diminuer ou de retarder la production de BE à paroi plus épaisse ainsi que
diminuer la teneur en matières extractibles.
Reproduced with permission of the copyright owner. Further reproduction prohibited without permission.
xxii
List of Contents
Acknowledgements ........................................................................................................... ii
Summaty .......................................................................................................................... iii
Résumé ............................................................................................................................ vii
Résumé substantie1. .......................................................................................................... xi
List of Contents ............................................................................................................. xxii
List of Figures ............................................................................................................ xxviii
List of Tables ............................................................................................................. xxxiv
List of Equations ........................................................................................................ xxxvi
Abbreviations ............................................................................................................ xxxvii
Chapter 1 - Introduction .................................................................................................... 1
1.1 Background .................................................................................................. 1
1.2 Characteristics of EW and LW .................................................................... 2
1.3 Response of EW and LW to refining ........................................................... 4
1.3.1 Response to pre-treatment ............................................................. 4
1.3.2 Behaviour in refmingstage ............................................................ 5
1.3.3 Influences on paper property ......................................................... 6
1.4 Objective ofresearch ................................................................................... 6
Chapter 2 - Physical structure of wood ............................................................................. 8
2.1 General definition ofEW and LW ............................................................... 8
2.2 Formation ofEW and LW ........................................................................... 9
2.3 Macro-structure ofwood ............................................................................. 9
2.4 Micro-structure ofwood ............................................................................ 10
2.4.1 Micro-structure ofhardwood and softwood ................................ 10

Reproduced with permission of the copyright owner. Further reproduction prohibited without permission.
XX111
2.4.2 Micro-structure ofEW and LW ................................................... 1 1
2.4.3 Ultra-structure ofEW and LW fibres .......................................... 15
2.5 Anatomical definition of EW and LW ....................................................... 16
2.6 Other physical properties ofEW and LW ................................................. 18
2.7 Summary .................................................................................................... 19
Chapter 3 - Chemical properties of wood ....................................................................... 20
3.1 Chemical composition of wood ................................................................. 20
3.2 Chemical properties of major wood components ...................................... 22
3.3 Summary .................................................................................................... 23
Chapter 4 - Effects of EW and LW on pulping and papermaking .................................. 24
4.1 Effects on pulping ...................................................................................... 24
4.1.1 Effects on mechanical pulping ..................................................... 24
4.1.1.1 Refining mechanism .................................................... 25
4.1.1.2 Variables affecting chip refining ................................. 26
4.1.1.3 Pre-treatment in refiner mechanical pulping ............... 26
4.1.1.4 Behaviour ofEWand LW in refining ......................... 27
4.1.1.5 Separation of EW and LW .......................................... 32
4.1.2 Effects on chemical pulping ........................................................ 34
4.2 Influences on paper strength ...................................................................... 34
4.3 Summary .................................................................................................... 35
Chapter 5 - Research proposaI ........................................................................................ 37
5.1 Background ................................................................................................ 37
5.2 Objective and approaches .......................................................................... 38
Chapter 6 - Methodology ................................................................................................ 40
6.1 Experimental design .................................................................................. 40
6.2 Material and preparation ............................................................................ 41
6.3 Physical and chemical characterization of raw material.. .......................... 41
6.3.1 Basic density ................................................................................ 41
6.3.2 Chemical analysis ........................................................................ 41
6.3.3 Characterization ofEW and LW fibres ....................................... 42
Reproduced with permission of the copyright owner. Further reproduction prohibited without permission.
XXIV
6.4 Refining ..................................................................................................... 42
6.4.1 Temperature ................................................................................. 43
6.4.2 Consistency .................................................................................. 44
6.4.3 Refmer plate gap clearance .......................................................... 44
6.5 Fractionation of pulps ................................................................................ 45
6.6 Pulp characterization .................................................................................. 46
6.6.1 FQA analysis ............................................................................... 46
6.6.1.1 Fibre length ................................................................. 47
6.6.1.2 Fibre coarseness .......................................................... 48
6.6.1.3 Curl index .................................................................... 49
6.6.1.4 Kink: index ................................................................... 49
6.6.2 Shives analysis ............................................................................. 50
6.6.3 Specific volume (SV) analysis of fines by sedimentation ........... 51
6.6.3.1 Fines collection ........................................................... 51
6.6.3.2 SV measurement ......................................................... 52
6.6.4 Water retention value (WRV) determination .............................. 53
6.6.5 Cell wall thickness measurement.. ............................................... 54
6.6.6 Light microscopy and image analysis .......................................... 55
6.6.7 Scanning electron microscopy (SEM) and image analysis .......... 57
6.7 Handsheet formation .................................................................................. 59
6.7.1 Characterization of handsheets .................................................... 60
6.7.1.1
6.7.1.2
6.7.1.3
X-ray photoelectron spectroscopy (XPS) analysis ...... 61
Twist angle determination ........................................... 61
Optical and physical properties analysis ..................... 62
Chapter 7 - Results and discussion (1) - raw material .................................................. 65
7.1 Physical characteristics .............................................................................. 65
7.1.1 Cross-section view of Jack pine .................................................. 65
7.1.2 Physical characteristics ................................................................ 66
7.2 Chemical components ................................................................................ 68
7.3 Summary .................................................................................................... 70
Reproduced with permission of the copyright owner. Further reproduction prohibited without permission.
xxv
Chapter 8 - Results and discussion (2) - pulp characterization .................................... 72
8.1 Refining energy .......................................................................................... 72
8.2 Fibre fraction .............................................................................................. 73
8.3 Microscopie study of fibre fraction ........................................................... 77
8.4 Pulp characterization .................................................................................. 84
8.4.1 Fibre length .................................................................................. 84
8.4.2 Cell wall thickness ....................................................................... 86
8.4.3 Fibre coarseness ........................................................................... 90
8.4.4 Curl index and kink index ........................................................... 92
8.4.5 Rejects ......................................................................................... 96
8.4.6 Specifie volume ........................................................................... 98
8.4.7 Water retention value ................................................................... 99
8.5 X-ray photoelectron spectroscopy (XPS) analysis .................................. 101
8.6 Microscopie study .................................................................................... 104
8.6.1 Light microscopy study ............................................................. 105
8.6.1.1 External fibrillation ................................................... 105
8.6.1.2 Fibre wall failure ....................................................... 106
8.6.2 Scanning electronic microscopy (SEM) study .......................... 107
8.6.2.1 InternaI fibrillation (delamination) ............................ 107
8.6.2.2 Fibre surface .............................................................. 110
8.6.2.3 Cross-section deformation ........................................ 113
8.7 Summary .................................................................................................. 115
Chapter 9 - Results and discussions (3) - handsheet characterization ........................ 117
9.1 Handsheet properties of whole pulp ........................................................ 117
9.1.1 Physical properties ..................................................................... 117
9.1.1.1 Density ...................................................................... 117
9.1.1.2 Roughness ................................................................. 119
9.1.1.3 Porosity ..................................................................... 120
9.1.1.4
9.1.1.5
9.1.1.6
InternaI bond strength (Scott bond) ........................... 122
Tensile and burst indices ........................................... 123
Tear index .................................................................. 126

Reproduced with permission of the copyright owner. Further reproduction prohibited without permission.
xxvi
9.1.2 Optical properties ....................................................................... 127
9.1.2.1 Brightness .................................................................. 127
9.1.2.2 Light scattering coefficient ....................................... 128
9.1.2.3 Light absorption coefficient.. .................................... 130
9.1.2.4 Opacity ...................................................................... 132
9.2 Characteristics of fibre fraction ............................................................... 133
9.2.1 Freeness ..................................................................................... 134
9.2.2 Coarseness ................................................................................. 134
9.2.3 Sheet density .............................................................................. 135
9.2.4 Physical properties ..................................................................... 136
9.3 Influence of short fibres and fmes ........................................................... 13 8
9.3.1 Freeness ..................................................................................... 138
9.3.2 Sheet density .............................................................................. 139
9.3.3 Tensile index .............................................................................. 140
9.3.4 Burst index ................................................................................. 141
9.3.5 Tear index .................................................................................. 142
9.3.6 Porosity ...................................................................................... 143
9.3.7 Roughness .................................................................................. 144
9.4 Influence of mixing processes ................................................................. 145
9.4.1 Effect on fibre properties ........................................................... 145
9.4.1.1 Fibre length ............................................................... 145
9.4.1.2 Fines content ............................................................. 147
9.4.1.3 Refining energy ......................................................... 148
9.4.2 Effect on sheet properties .......................................................... 148
9.4.2.1 Density ...................................................................... 148
9.4.2.2 Physical properties .................................................... 149
9.4.2.3 Optical properties ...................................................... 150
9.5 Scanning electronic microscopie (SEM) study ........................................ 154
9.5.1 Collapsibility ............................................................................. 154
9.5.2 Twist angle ................................................................................ 158
9.5.3 Fibre bonding ............................................................................. 159
9.6 Summary .................................................................................................. 161
Reproduced with permission of the copyright owner. Further reproduction prohibited without permission.
xxvii
Chapter 10 - Conclusions ... ........................................................................................... 163
Chapter Il - Recommendations ................ .................................................................... 167
Bibliography .................................................................................................................. 169
Appendix ....................................................................................................................... 193
Reproduced with permission of the copyright owner. Further reproduction prohibited without permission.
Figure 1.1
Figure 2.1
Figure 2.2
Figure 2.3
Figure 2.4
Figure 2.5
Figure 2.6
Figure 2.7
Figure 2.8
Figure 2.9
Figure 3.1
Figure 4.1
Figure 4.2
Figure 4.3
Figure 4.4
Figure 4.5
Figure 4.6
Figure 4.7
Figure 4.8
Figure 4.9
xxviii
List of Figures
Typical flowsheet of refmer pulping ........................................................... 4
EW and LW within hardwood and softwood growth rings ......................... 8
Macrostructure of softwood and hardwood ................................................. 9
Fibre lengths across one growth increment of Pinus Radiata ................... 12
Cross-section ofEW and LW tracheid ...................................................... 12
Variation of cell diameter and cell wall thickness within a growth ring ........................................................................................................ 13
Profiles ofpit pairs ..................................................................................... 14
Diagrams of EW and LW fibres of southem yellow pine ......................... 14
Typical cell wall structure of softwood fibre ............................................. 15
Transition from EW to LW ........................................................................ 18
An approximate percentage distribution of the chemical components in different layers of softwood tracheid ............................ 21
Mechanism of chip refining ....................................................................... 25
The relation between freeness and long fibre content ............................... 26
Typical ruptures in high-yield pulping processes ...................................... 27
Load deformation curve for radial compression ........................................ 28
Collapse of EW and LW fibres in refming ................................................ 29
Form circ1e ofEW and LW in a growth ring ofNorway spruce ............... 30
Reduction of fibre cell wall thickness in refming ...................................... 30
Typical shive in larch RMP ....................................................................... 31
Temperature record of southem pine in repetitive cyc1ic compression ........................................................................................... 32
Figure 4.10 Separation ofEW and LW before refining by veneer machine ................. 33
Figure 4.11 Separation ofEW and LW after refining by hydrocyc1one ....................... 33
Figure 4.12 Influences of softwood properties on fibre network and paper properties ............................................................................................... 35
Figure 4.13 Physical properties of Douglas fIT pulp vs. LW content ............................ 35
Figure 6.1 Experimental procedures ........................................................................... 40
Figure 6.2 Refming actions on wood matrix ............................................................... 45
Figure 6.3 Combined action of shear and compression .............................................. 45
Figure 6.4 Flow cell configuration ofFQA. ................................................................ 47
Reproduced with permission of the copyright owner. Further reproduction prohibited without permission.
Figure 6.5
Figure 6.6
Figure 6.7
Figure 6.8
XXIX
Defmition of fibre curl index ..................................................................... 49
Illustration ofkink in fibre ......................................................................... 50
Procedures for the measurement of specific volume of fines .................... 53
Profile of MorFi cell wall thickness device ............................................... 55
Figure 6.9 External fibrillation of fibre ....................................................................... 56
Figure 6.10 Cell wall damage in refming ...................................................................... 56
Figure 6.11 Sample preparation for image analysis ...................................................... 57
Figure 6.12 Fibre cross-section analysis ....................................................................... 58
Figure 6.13 Sample preparation for SEM image analysis ............................................. 59
Figure 6.14 Defmition of fibre twist angle .................................................................... 62
Figure 6.15 General outline of analysis parameters ...................................................... 64
Figure 7.1 Incident light micrograph showing the cross-sectional view of
Figure 7.2
Figure 7.3
Figure 8.1
Figure 8.2
Figure 8.3
Figure 8.4
Figure 8.5
Figure 8.6
Figure 8.7
Figure 8.8
Figure 8.9
Jack pine (xl0) ...................................................................................... 66
Photomicrograph showing the cross-section morphology of EW and LW of Jack pine (x200) .................................................................. 68
Resin canals in Jack pine (x40) .................•................................................ 70
Freeness as a function of specific refming energy ..................................... 73
Contributions of shear and compression actions in refining ...................... 74
R14 fraction as a function ofspecific energy ............................................ 75
R28 fraction as a function of specific energy ............................................ 75
R48 fraction as a function of specific energy ............................................ 75
RI00 fraction as a function ofspecific energy .......................................... 76
R200 fraction as a function of specific energy .......................................... 76
P200 fraction as a function of specific energy ........................................... 76
Micrographs showing the surface characteristics of LW fibres in R14 fraction (x400) ............................................................................... 78
Figure 8.10 Micrographs showing the surface characteristics ofEW fibres in R14 fraction (x400) ............................................................................... 79
Figure 8.11 Micrographs demonstrating the refming effect on R28 fraction of LW and EW fibres (x400) ..................................................................... 80
Figure 8.12 Micrographs showing the surface characteristics offibres of LW and EW in R48 fractions ....................................................................... 81
Figure 8.13 Micrographs showing the nature of the fibres ofRlOO fraction of LW and EW ........................................................................................... 82
Reproduced with permission of the copyright owner. Further reproduction prohibited without permission.
xxx
Figure 8.14 Micrographs showing the nature fibrous elements of LW and EW fibres in R200 fractions ......................................................................... 83
Figure 8.15 Micrographs showing the partic1es ofP200 fraction (fines) ...................... 84
Figure 8.16 Fibre length as a function ofspecific energy ............................................. 85
Figure 8.17 Fibre length reduction as a function of specific energy ............................. 85
Figure 8.18 Cell wall thickness ofR14 fraction as a function ofspecific energy .................................................................................................... 86
Figure 8.19 Cell wall thickness ofR28 fraction as a function ofspecific energy .................................................................................................... 87
Figure 8.20 Cell wall thickness ofR48 fraction as a function of specific energy .................................................................................................... 87
Figure 8.21 Image of cell wall thickness of LW fibres ................................................. 88
Figure 8.22 Image of cell wall thickness ofEW fibres ....................... ; ......................... 89
Figure 8.23 Cell wall thickness reduction ofL W fibres as a function of specific energy ...................................................................................... 89
Figure 8.24 Cell wall thickness reduction ofEW fibres as a function of specific energy ....................................... : .............................................. 90
Figure 8.25 Cell wall thickness reduction of fibres in the mixture ofEW and LW as a function of specific energy ..................................................... 90
Figure 8.26 Fibre coarseness ofR28 fraction as a function of specific energy ............ 91
Figure 8.27 Fibre coarseness ofR48 fraction as a function ofspecific energy ............ 91
Figure 8.28 Curl index oflatented fibres ofR28 fraction as a function of specific energy ...................................................................................... 93
Figure 8.29 Curl index of delatented fibres ofR28 fraction as a function of specific energy ...................................................................................... 93
Figure 8.30 Curl index oflatented fibres ofR48 fraction as a function of specific energy ................................................................. : .................... 94
Figure 8.31 Curl index of delantented fibres of R48 fraction as a function of specific energy ...................................................................................... 94
Figure 8.32 Kink index oflatented fibres ofR28 fraction as a function of specific energy ...................................................................................... 95
Figure 8.33 Kink index of delatented fibres ofR28 fraction as a function specific energy ...................................................................................... 95
Figure 8.34 Kink index oflatented fibres ofR48 fraction as a function of specific energy ...................................................................................... 96
Figure 8.35 Kink index of delatented fibres ofR48 fraction as a function of specific energy ...................................................................................... 96
Reproduced with permission of the copyright owner. Further reproduction prohibited without permission.
XXXI
Figure 8.36 Basic elements in rejects ............................................................................ 97
Figure 8.37 Rejects as a function of specifie energy ..................................................... 98
Figure 8.38 Specifie volume as a function of specifie energy ...................................... 99
Figure 8.39 Water retention value ofR14 fraction as a function of specifie energy .................................................................................................. 100
Figure 8.40 Water retention value ofR28 fraction as a function of specifie energy .................................................................................................. 100
Figure 8.41 Water retention value ofR48 fraction as a function of specifie energy .................................................................................................. 101
Figure 8.42 Water retention value ofRI00 fraction as a function of specifie energy .................................................................................................. 101
Figure 8.43 Surface Iignin coverage of different samples .......................................... 103
Figure 8.44 Cell wall failure of EWand LW fibres in refining .................................. 106
Figure 8.45 InternaI fibrillation in EW fibres ............................................................. 108
Figure 8.46 InternaI fibrillation in LW fibres ............................................................. 109
Figure 8.47 Surface nature ofEW fibres ..................................................................... 111
Figure 8.48 Surface nature of LW fibre ...................................................................... 112
Figure 8.49 Collapsed EW fibres after refining .......................................................... 114
Figure 8.50 Uncollapsed LW fibres after refining ...................................................... 115
Figure 9.1 Handsheet density as a function offreeness ............................................ 118
Figure 9.2 Handsheet density as a function of specifie refining energy ................... 118
Figure 9.3 Roughness as a function of specifie refining energy ............................... 119
Figure 9.4 Roughness as a function of freeness ........................................................ 120
Figure 9.5 Porosity as a function of specifie energy ................................................. 121
Figure 9.6 Porosity as a function of Freeness ........................................................... 121
Figure 9.7 InternaI bonding strength as a function of specifie refining energy ........ 123
Figure 9.8 InternaI bonding strength as a function offreeness ................................. 123
Figure 9.9 Tensile index as a function of specifie energy ......................................... 124
Figure 9.10 Burst index as a function of specifie energy ............................................ 124
Figure 9.11 Tensile index as a function of freeness .................................................... 125
Figure 9.12 Burst index as a function offreeness ....................................................... 125
Figure 9.13 Tear index as a function of specifie energy ............................................. 126
Figure 9.14 Tear index as a function offreeness ........................................................ 127
Figure 9.15 Brightness as a function of specifie energy ............................................. 128
Reproduced with permission of the copyright owner. Further reproduction prohibited without permission.
xxxii
Figure 9.16 Brightness as a function offreeness ........................................................ 128
Figure 9.17 Light scattering coefficient as a function of specific refining energy .................................................................................................. 129
Figure 9.18 Light scattering coefficient as a function offreeness .............................. 130
Figure 9.19 Light absorption coefficient as a function ofspecific refining energy .................................................................................................. 132
Figure 9.20 Light absorption coefficient as a function offreeness ............................. 132
Figure 9.21 Opacity as a function of specific refining energy .................................... 133
Figure 9.22 Opacity as a function offreeness ............................................................. 133
Figure 9.23 Coarseness ofBauer-McNett fractions .................................................... 135
Figure 9.24 Sheet density ofBauer-McNett fractions ................................................. 135
Figure 9.25 Scott bond of Bauer-McNett fractions ..................................................... 136
Figure 9.26 Tensile index of Bauer-McNett fractions ................................................ 136
Figure 9.27 Burst index of Bauer-McNett fractions ................................................... 137
Figure 9.28 Tear index ofBauer-McNett fractions ..................................................... 138
Figure 9.29 Density ofhandsheets made from different combinations ofpulp fraction ................................................................................................ 140
Figure 9.30 Tensile index of different pulp fraction combinations ............................. 141
Figure 9.31 Burst index of different pulp fraction combinations ................................ 142
Figure 9.32 Tear index of different pulp fraction combinations ................................. 143
Figure 9.33 Porosity of different pulp fraction combinations ..... ~ ............................... 144
Figure 9.34 Roughness of different pulp fraction combinations ................................. 145
Figure 9.35 Effect of chip mixing and pulp mixing on fibre length (1w) as a function of freeness ............................................................................. 146
Figure 9.36 Effect of chip mixing and pulp mixing on fibre length (1w) reduction as a function of freeness ...................................................... 146
Figure 9.37 Fibre length reduction as a function offreeness with a refming temperature of 160°C .......................................................................... 147
Figure 9.38 Effect of chip mixing and pulp mixing on weight-weighted fines contents as a function offreeness ........................................................ 147
Figure 9.39 Effect of chip mixing and pulp mixing on freeness as a function of refining energy ................................................................................ 148
Figure 9.40 Effect of chip mixing and pulp mixing on density as a function of freeness ................................................................................................ 149
Figure 9.41 Effect of chip mixing and pulp mixing on tensile index as a function offreeness ............................................................................. 150
Reproduced with permission of the copyright owner. Further reproduction prohibited without permission.
xxxiii
Figure 9.42 Effect of chip mixing and pulp mixing on burst index as a function of freeness ............................................................................. 150
Figure 9.43 Effect of chip mixing and pulp mixing on tear index as a function offreeness ........................................................................................... 151
Figure 9.44 Effect of chip mixing and pulp mixing on opacity as a function of freeness ................................................................................................ 151
Figure 9.45 Effect of chip mixing and pulp mixing on light scattering coefficient as a function offreeness .................................................... 152
Figure 9.46 Effect of chip mixing and pulp mixing on light absorption coefficient as a function offreeness .................................................... 152
Figure 9.47 Effect of chip mixing and pulp mixing on brightness as a function offreeness ........................................................................................... 153
Figure 9.48 SEM micrograph showing a cross-section ofEW sheet made from R28 fraction (CSF: 680 mL, refined at 160°C) ................................... 156
Figure 9.49 SEM micrograph showing a cross-section of LW sheet made from R28 fraction (CSF: 690 mL, refmed at 160°C) ................................... 156
Figure 9.50 SEM micrograph showing a cross-section ofEW sheet made from whole pulp (CSF: 150 mL, refined at 160°C) ..................................... 157
Figure 9.51 SEM micrograph showing a cross-section of LW sheet made from whole pulp (CSF: 150 mL, refined at 160°C) ..................................... 157
Figure 9.52 SEM micrograph showing a cross-section ofwhole pulp sheet containing EW fibres (CSF: 150 mL, refmed at 160°C) ..................... 160
Figure 9.53 SEM micrograph showing cross-section whole pulp sheet containing LW fibres (CSF: 150 mL, refmed at 160°C) ..................... 160
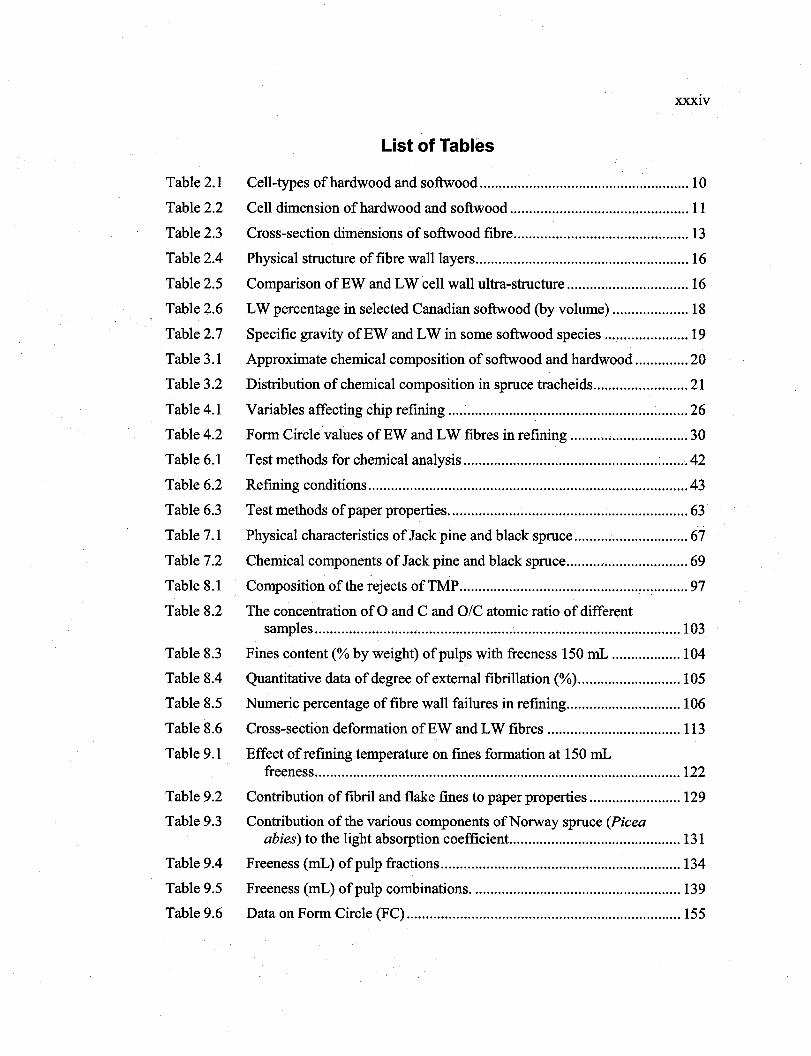
Reproduced with permission of the copyright owner. Further reproduction prohibited without permission.
Table 2.1
Table 2.2
Table 2.3
Table 2.4
Table 2.5
Table 2.6
Table 2.7
Table 3.1
Table 3.2
Table 4.1
Table 4.2
Table 6.1
Table 6.2
Table 6.3
Table 7.1
Table 7.2
Table 8.1
Table 8.2
Table 8.3
Table 8.4
Table 8.5
Table 8.6
Table 9.1
Table 9.2
Table 9.3
Table 9.4
Table 9.5
Table 9.6
XXXIV
List of Tables
Cell-types ofhardwood and softwood ....................................................... 10
Cell dimension of hardwood and softwood ............................................... Il
Cross-section dimensions of softwood fibre .............................................. 13
Physical structure of fibre walllayers ........................................................ 16
Comparison of EW and LW cell wall ultra-structure ................................ 16
LW percentage in selected Canadian softwood (by volume) .................... 18
Specific gravity ofEW and LW in sorne softwood species ...................... 19
Approximate chemical composition of softwood and hardwood .............. 20
Distribution of chemical composition in spruce tracheids ......................... 21
Variables affecting chip refining ............................................................... 26
Form Cirele valùes ofEW and LW fibres in refining ............................... 30
Test methods for chemical analysis ........................................................... 42
Refming conditions .................................................................................... 43
Test methods of paper properties ............................................................... 63
Physical characteristics of Jack pine and black spruce .............................. 67
Chemical components of Jack pine and black spruce ................................ 69
Composition of the rejects ofTMP ............................................................ 97
The concentration of a and C and O/C atomic ratio of different samples .........................................................................•...................... 103
Fines content (% by weight) ofpulps with freeness 150 mL .................. 104
Quantitative data of degree of external fibrillation (%) ........................... 105
Numeric percentage of fibre wall failures in refming .............................. l06
Cross-section deformation ofEW and LW fibres ................................... 113
Effect of refining temperature on fmes formation at 150 mL freeness ................................................................................................ 122
Contribution of fibril and flake fines to paper properties ........................ 129
Contribution of the various components ofNorway spruce (Picea abies) to the light absorption coefficient ............................................. 131
Freeness (mL) ofpulp fractions ............................................................... 134
Freeness (mL) ofpulp combinations ....................................................... 139
Data on Form Circle (FC) ........................................................................ 155
Reproduced with permission of the copyright owner. Further reproduction prohibited without permission.
xxxv
Table 9.7 Twist angles e) in different handsheets .................................................. 158
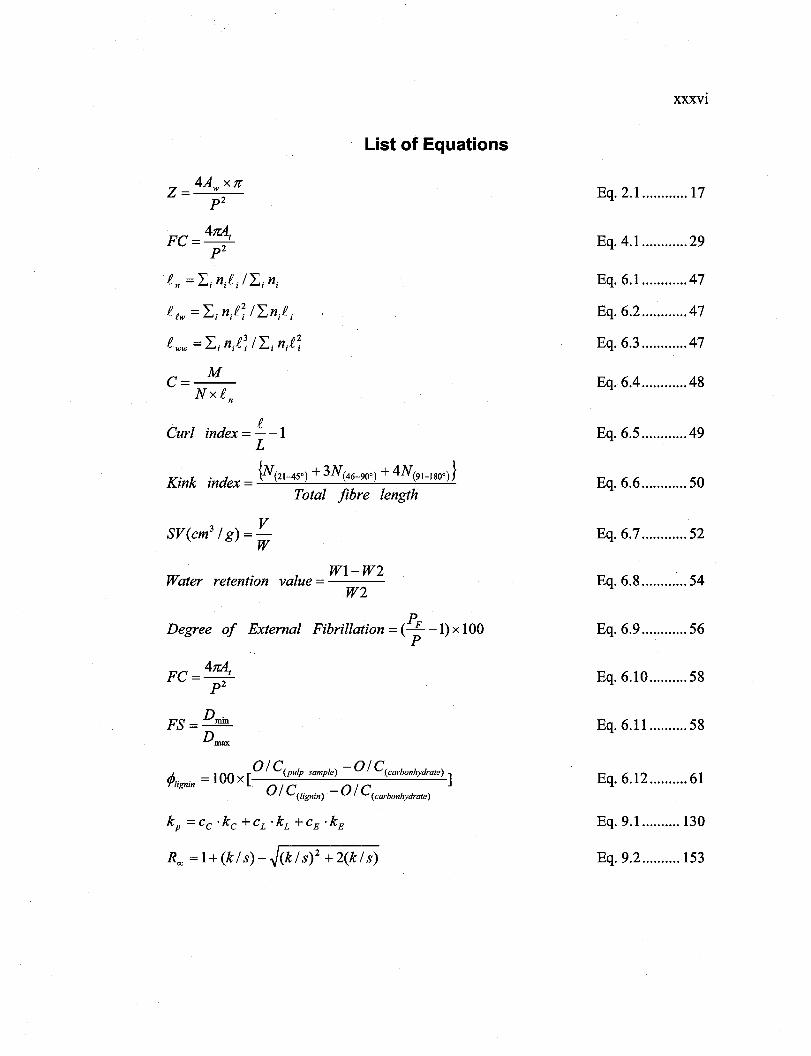
Reproduced with permission of the copyright owner. Further reproduction prohibited without permission.
List of Equations
FC= 41ZAt
p2
Curl index = i -1 L
.. {N(21-450 ) + 3N(46_900 ) + 4N(9H800 )} Kmk mdex = --'---''----'----'-------'---''-----'-'-Total fibre length
SV(cm 3 / g) = ~
W
. WI-W2 Water retentlOn value = --
W2
p Degree of External Fibrillation = ( ......E... -1) x 100
P
FC = 41ZAt
p2
FS = Dmin Dmax
tjJ. . = 100 x [0/ C(pulp sample) - 0/ C(carbonhydrate) ]
irgnm 0/ C(lignin) - 0/ C(Carbonhydrate)
Roc; = 1 + (k / s) - ~(k / S)2 + 2(k / s)
xxxvi
Eq. 2.1 ............ 17
Eq.4.1 ............ 29
Eq.6.1 ............ 47
Eq.6.2 ........... .47
Eq.6.3 ............ 47
Eq.6.4 ............ 48
Eq.6.5 ............ 49
Eq.6.6 ............ 50
Eq.6.7 ............ 52
Eq.6.8 ............ 54
Eq.6.9 ............ 56
Eq.6.10 .......... 58
Eq.6.11 .......... 58
Eq. 6.12 .......... 61
Eq.9.1 .......... 130
Eq. 9.2 .......... 153
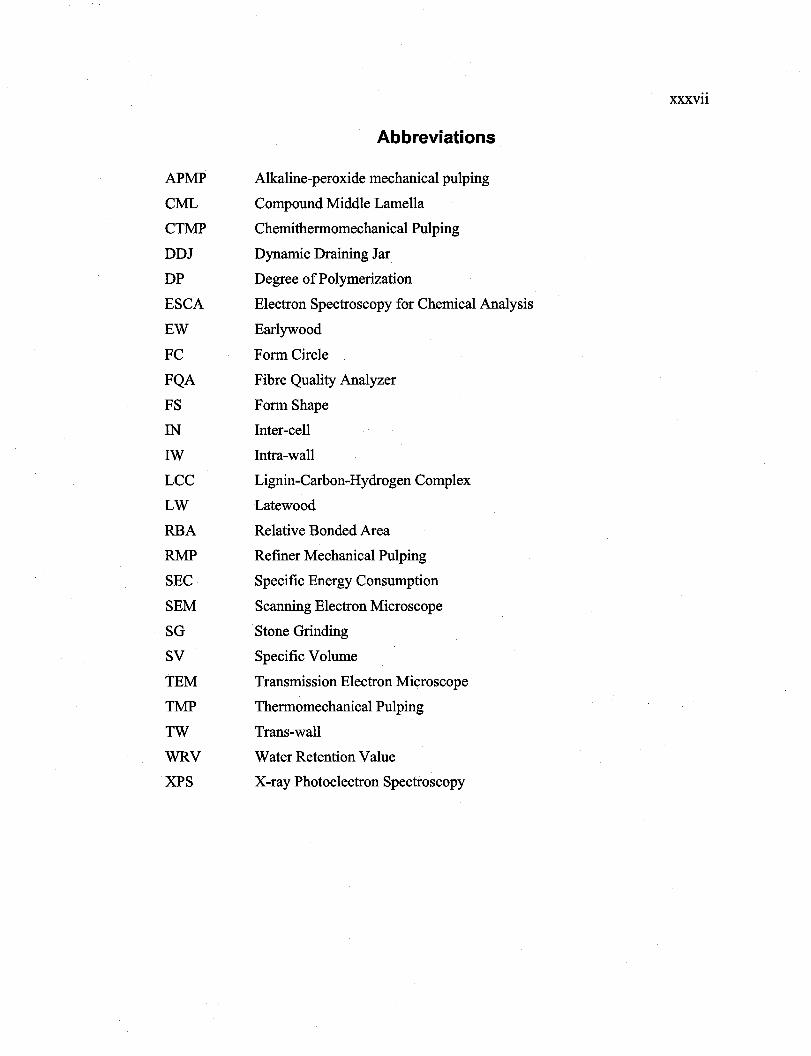
Reproduced with permission of the copyright owner. Further reproduction prohibited without permission.
xxxvii
Abbreviations
APMP Alkaline-peroxide mechanical pulping
CML Compound Middle Lamella
CTMP Chemithermomechanical Pulping
DDJ Dynamic Draining Jar
DP Degree ofPolymerization
ESCA Electron Spectroscopy for Chemical Analysis
EW Earlywood
FC Form Circ1e
FQA Fibre Quality Analyzer
FS Form Shape
IN Inter-cell
IW Intra-wall
LCC Lignin-Carbon-Hydrogen Complex
LW Latewood
RBA Relative Bonded Area
RMP Refiner Mechanical Pulping
SEC Specifie Energy Consumption
SEM Scanning Electron Microscope
SG Stone Grinding
SV Specifie Volume
TEM Transmission Electron Microscope
TMP Thermomechanical Pulping
TW Trans-wall
WRV Water Retention Value
XPS X-ray Photoelectron Spectroscopy
Reproduced with permission of the copyright owner. Further reproduction prohibited without permission.
1
Chapter 1 - Introduction
1.1 Background
Wood is a heterogeneous material in which the chemical and physical characteristics
vary between species, between trees of the same species, and even between different
parts of the stem within a tree. However, in temperate zone, the most distinguishable
variability in fibre morphology exists between early- and latewood of softwood.
Generally, earlywood (EW) fibres have larger outer perimeter, thinner cell wall and
larger radial width compared with those of latewood (LW) [1,2]. These differences
affect not on1y fibre properties, such as density [3, 4] and mechanical strength [5, 6], but
also the chemical [7, 8] and mechanical pulping [9, 10], and paper properties [10].
EW fibres are more flexible [11, 12, 13], and collapsible [6, 14, 15, 16, 17] than those of
LW; the latter being stiffer and less collapsible. In refining the LW fibres exhibit a
greater reduction in cell wall thickness. What's more, the EW fibres tend to split
especially in the 1 st stage refining [9], and they require more refining energy to reach the
same freeness as compared to the LW fibres [10]. These findings indicate that EW and
LW respond differently to mechanical actions. Due to this dissimilarity, the property of
the fmal pulp or paper would depend on the proportion of EW and LW fibres in the
furnish. To minimize the impact of the differences in refining between the EW and LW,
sorne suggestions [18, 19, 20] have been made to separately refine EW and LW.
However, this approach is not practical since EW and LW are naturally and intimately
grown together, making it economically and technically difficult to achieve a c1ear
separation of the two growth tissues.
In view of the variability of wood and to gain a better understanding on the breakdown
mechanism of EW and LW in refining, this proposed research has been initiated to
examine the influence of various fibres properties, physical and chemical, on refining.
The possible different behaviour of EW and LW (e.g. fibre splitting, cell-wall thickness
reduction, collapsibility, etc.) in refining will be investigated.
Reproduced with permission of the copyright owner. Further reproduction prohibited without permission.
2
1.2 Characteristics of EW and LW
In the temperate region, when the atmospheric temperature rises in the spring tree
growth activities begin with cambium cells division. This activity is believed to be
regulated by a growth hormone, aux.in. The early growth is fast and gives rise to fibres
or tracheids in conifers (softwood) with large diameter and relatively thin cell wall. This
wood tissue is called springwood or EW. As the late summer approaches the
temperature falls and the tree growth gradually slows down, producing fibres with
smaller cell lumen and thicker cell wall. This zone of thick-walled fibres is called
summerwood or LW. The tree growth season ends in the fall as the trees begin to shed
leaves or needles. The most visible differences between the EW and LW fibres are that
the former tend to have larger diameter, thinner cell wall than the latter. Other
differences can be c1assified into three categories: fibre morphology, physical property
and chemical composition, as described in the following paragraphs.
1. Morphology of fibre
Wood fibre has a hollow structure with closed ends. The fibres are connected by a
lignin-rich middle lamella (ML). Fibre wall itself is composed of a primary wall (P) and
a secondary wall. The latter has three distinct layers: SI, S2 and S3. Among these layers,
S2 is the thickest (1-5 J.lll1), while the SI and S3 are similar in thickness (0.1-0.2 J.lll1).
The three layers of the secondary wall are constituted of severallaminas of microfibrils.
The orientation of the microfibrils is different in each layer. The SI and S3 tend to have
larger fibril angles while the S2 has a relatively sma1ler angle [21]. Due to the dramatic
change in fibril angle between SI and S2, the interface between them constitutes a weak
zone [22]. As such, the SI layer or S2 layer would be exposed under the influence of
mechanical refming, allowing a better development of fibre properties.
In comparison with thin-wa1led EW fibre, LW fibre would have a larger proportion of
S2 layer [23] due to its thicker cell wall. But the fibril angle of the S2 layer is greater for
EW fibre than for LW fibre [24]. EW fibre is relatively shorter but has larger celliumen
compared to LW fibre [25]. In addition, EW fibre has larger pit surface and effective pit
pore radius compared with the LW fibre [26,27,28]. This suggests that EW has higher
Reproduced with permission of the copyright owner. Further reproduction prohibited without permission.
3
permeability, and is more favourable to water and chemical transfers. The differences in
morphology render EW fibre more collapsible under mechanical action, improving the
fibre bonding in paper.
2. Physical property
The inherent structural organization of wood plays an important role in determining its
physical properties. In refming, it is of great importance to understand the mechanical
behaviour of the wood structure under the influences of various types of mechanical
stresses, such as compression, tensile, shear, and torsion. Mechanically, EW fibre shows
greater flexibility [11], elongation [29], collapsibility [14, 15] when compared to that of
LW, mainly due to its thinner cell wall and larger lumen. On the contrary, LW fibre is
stiffer [10], more brittle [30]. Consequently, the EW fibre is more vulnerable to
longitudinal splitting, causing trans-wall failure. On the other hand, LW shows mostly
intra-wall failure due to its thick cell wall [31].
3. Chemical composition
Basically, wood is made of three natural polymers: (1) cellulose, a linear and partly
crystallized macromolecule, (2) amorphous molecules branched called hemicelluloses,
and (3) lignin, a cross-linked amorphous polymer. Besides, there are sorne minor
components, such as extractives and ash. The distribution of these chemical components
seems to be different in EW and LW. Forinstance, the concentration oflignin in EW is
higher than that in LW while the reverse is true for the concentration of holocellulose
[32,33]. These differences could have sorne effects on the chemical pre-treatment of
wood chips.
In sum, the differences between EW and LW in terms of morphology, physical and
chemical characteristics are evident. These differences could influence their responses to
refining actions.

Reproduced with permission of the copyright owner. Further reproduction prohibited without permission.
4
1.3 Response of EW and LW to refining
The mechanical pulping industry (e.g. chip refming) has made great progresse during the
last three decades or so [34]. This industry has developed various processes: refiner
mechanical pulp (RMP), thermomechanical pulping (TMP), chemithermomechanical
pulping (CTMP), and alkaline-peroxide mechanical pulping (APMP) to fulfil diverse
needs of consumers. The main flowsheet of the various processes is similar as shown in
Figure 1.1 [35]. There are, however, sorne variations in pre-treatment of chips or in the
refming stage. According to the flowsheet, the main structural changes of wood chips
take place in the pre-treatment and refining (inc1uding 1 st and 2nd refining stages) stages.
In this project, the study will focus on the behaviour of EW and LW in the 2nd stage.
re-treatment
• Pre-steaming
• Compression
HO
Screening and reject refming
Figure 1.1 Typical flowsheet of retiner pulping
1.3.1 Response to pre-treatment
The aim of pre-treatment is to change the physical properties or chemical structure of
wood chips, to reduce the specifie energy consumption (SEC) and to improve the pulp
Reproduced with permission of the copyright owner. Further reproduction prohibited without permission.
5
properties. There are various measures to fulfil these requirements, such as treating the
chips with mechanical compression, thermal softening, enzyme, and chemicals before
refming [36]. Among these measures, the mechanical compression and chemical
treatment have particularly received much attention for their efficacy.
The purpose of mechanical compression of wood chips is to de-structure the wood
matrix, reducing their partic1e size and thus increasing their specific surface. This has
two main effects: first, it lowers the subsequent refming energy requirement, and second,
it improves the chemical impregnation efficiency. In the refining industry, chip
compression is achieved by means of a plug screw. However, static compression [37]
can also used with less fibre damaged. But its industrial application has yet to be
implemented.
On the other hand, the main purpose of chemical treatment is to degrade or soften the
lignin, facilitating fibre separation. As a result, more intact fibres can be preserved
(longer average fibre length) and the fibre flexibility can be improved (increased fibre
conformability in paper). Common impregnation chemicals inc1ude sodium hydroxide,
sodium sulphite, and hydrogen peroxide. Since EW fibre has thinner cell wall and bigger
pit area, it has greater permeability for chemical agents when compared with LW fibre.
Consequently, the chemical reaction is expected to be more efficient in EW.
1.3.2 Behaviour in refining stage
According to the structural changes of wood fibres, refining can be c1assified into two
concurrent stages: fibre defibration and fibre development [38,39,40]. In refming, the
wood chips first break down into individual fibres and undefibrated fibre bundles
(shives). The fibre defibration stage consumes re1ative1y little energy [41]. In the fibre
development stage, the primary wall (P) and SI layer of the secondary wall are removed,
and parts of the S2 are stripped off [9]. The reduction in fibre wall thickness decreases
fibre stiffness. These physical changes improve inter-fibre bonding.
Due to their differences in morphology, the EW and LW fibres behave differently in
refming. Studies [1,42] indicated that cell wall splitting occurs principally in EW fibres,

Reproduced with permission of the copyright owner. Further reproduction prohibited without permission.
6
particularly in the frrst stage of refining, and wall thickness reduction takes place more
often on the thick-walled LW fibres. Moreover, EW fibre tends to change its form easily
because of its greater compressibility and flexibility. Conversely, the LW fibre is more
resistant to the refining action including flexion and kneading, which makes it difficult
to change its cross-sectional shape. It was reported that EW absorb energy easily and
require more energy to reach the same freeness in comparison to LW [9]. EW tends to
break into fragments of irregular forms and sizes (shives) while LW disintegrates into
slender bundles or individual fibres [2].
1.3.3 Influences on paper property
Fibre morphology plays an important role in determining the properties ofpaper. Studies
[43, 44] suggested that EW fibre increases sorne physical strengths, such as density,
tensile and burst strength, while the stiffer LW fibre produces bulky sheet with rough
surface. Since EW fibre is much more flexible and conformable than LW fibre, it has
larger bonding surface, giving better paper strength. However, LW fibre improves
tearing resistance.
In summary, the different responses of EW and LW to refining are closely related to
their differences in morphological characteristics. Due to these differences, the final pulp
quality is dependent on their proportion in wood. This study will examine their
behaviour in greater depth, hoping to further advance the understanding of the refming
mechanism.
1.4 Objective of research
The main objective of this study was to investigate the mechanism of mechanical failure
of EW and LW in relation to their morphology, physical and chemical properties in
refming. More precisely, the following aspects were examined:
1) Difference between EW and LW (morphology, physical property and
chemical composition);
2) Response ofEW and LW in refining;
Reproduced with permission of the copyright owner. Further reproduction prohibited without permission.
7
3) Influence ofEW and LW on sheet properties.
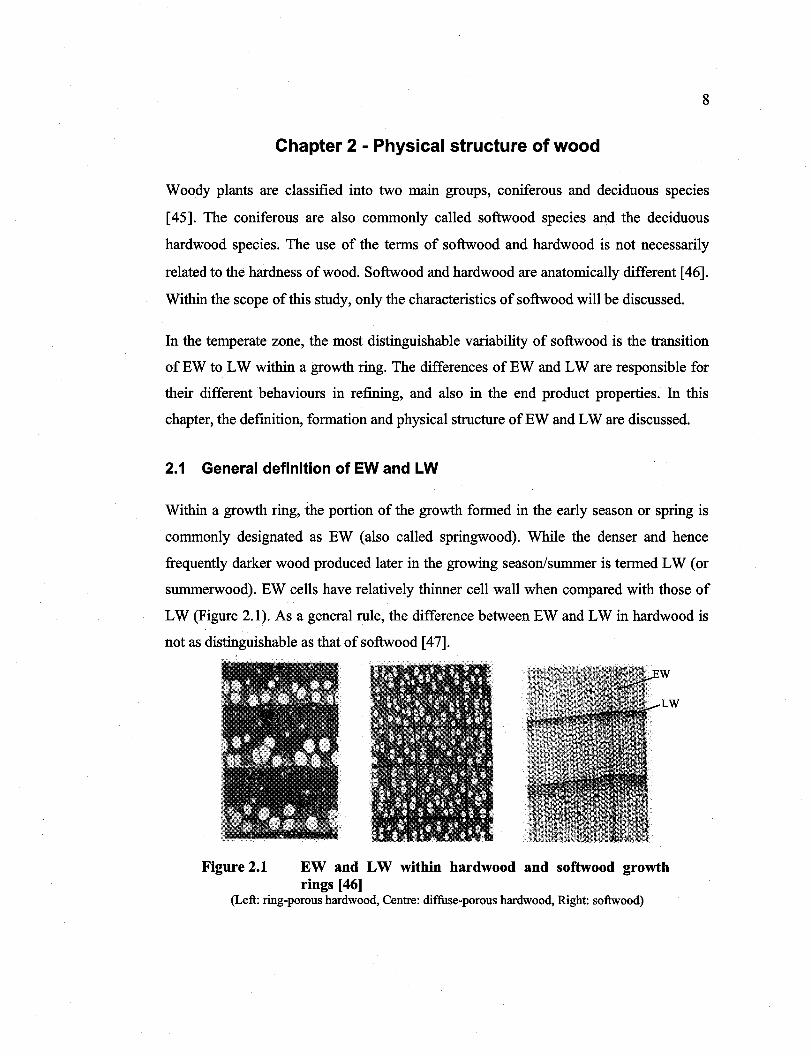
Reproduced with permission of the copyright owner. Further reproduction prohibited without permission.
8
Chapter 2 - Physical structure of wood
Woody plants are c1assified into two main groups, coniferous and deciduous species
[45]. The coniferous are also commonly called softwood species and the deciduous
hardwood species. The use of the terms of softwood and hardwood is not necessarily
related to the hardness ofwood. Softwood and hardwood are anatomically different [46].
Within the scope ofthis study, only the characteristics of softwood will be discussed.
In the temperate zone, the most distinguishable variability of softwood is the transition
of EW to LW within a growth ring. The differences of EW and LW are responsible for
their different behaviours in refining, and also in the end product properties. In this
chapter, the definition, formation and physical structure ofEW and LW are discussed.
2.1 General definition of EW and LW
Within a growth ring, the portion of the growth formed in the early season or spring is
commonly designated as EW (also called springwood). While the denser and hence
frequently darker wood produced later in the growing season/summer is termed LW (or
summerwood). EW cells have relatively thinner cell wall when compared with those of
LW (Figure 2.1). As a general mIe, the difference between EW and LW in hardwood is
not as distinguishable as that ofsoftwood [47].
Figure 2.1 EW and LW within hardwood and softwood growth rings [46]
(Left: ring-porous hardwood, Centre: diffuse-porous hardwood, Right: softwood)
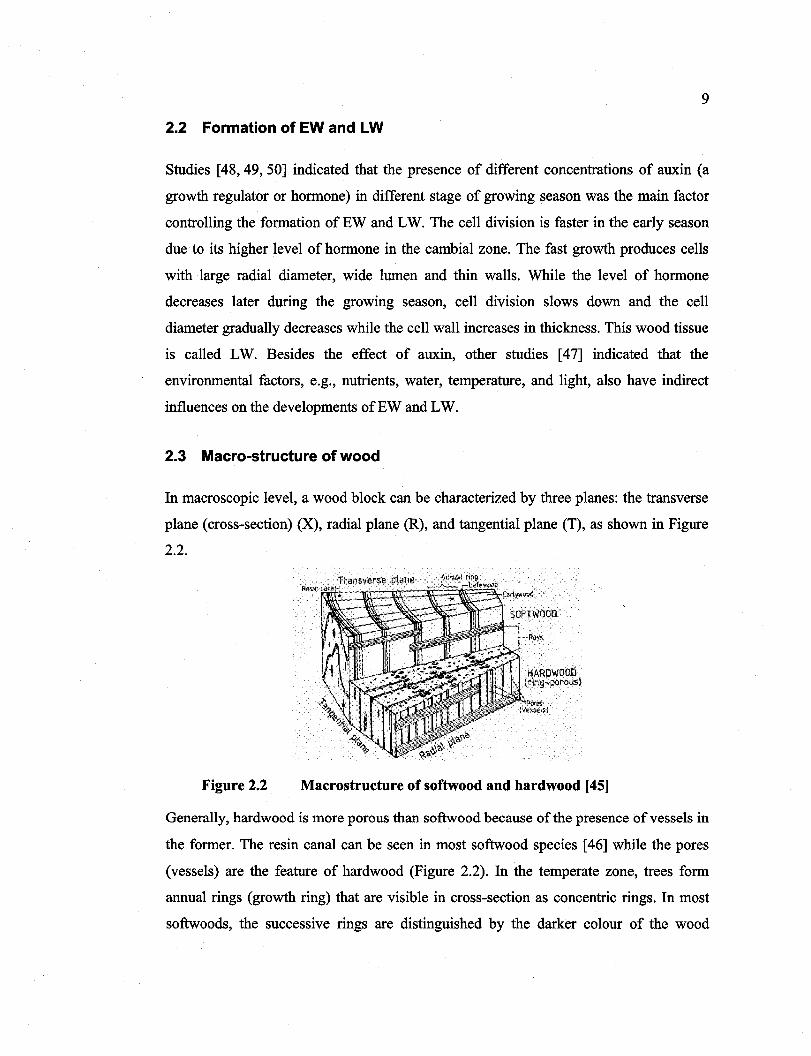
Reproduced with permission of the copyright owner. Further reproduction prohibited without permission.
9
2.2 Formation of EW and LW
Studies [48,49,50] indicated that the presence of different concentrations of auxin (a
growth regulator or hormone) in different stage of growing season was the main factor
controlling the formation of EW and LW. The cell division is faster in the early season
due to its higher level of hormone in the cambial zone. The fast growth produces cells
with large radial diameter, wide lumen and thin walls. While the leve1 of hormone
decreases later during the growing season, cell division slows down and the cell
diameter gradually decreases while the cell wall increases in thickness. This wood tissue
is called LW. Besides the effect of auxin, other studies [47] indicated that the
environmental factors, e.g., nutrients, water, temperature, and light, also have indirect
influences on the developments ofEWand LW.
2.3 Macro-structure of wood
In macroscopic level, a wood block can be characterized by three planes: the transverse
plane (cross-section) (X), radial plane (R), and tangential plane (T), as shown in Figure
2.2.
Figure 2.2
HARO'WOOQ (ring-porous!
Macrostructure of softwood and hardwood [45J
Generally, hardwood is more porous than softwood because of the presence ofvessels in
the former. The resin canal can be seen in most softwood species [46] while the pores
(vessels) are the feature of hardwood (Figure 2.2). In the temperate zone, trees form
annual rings (growth ring) that are visible in cross-section as concentric rings. In most
softwoods, the successive rings are distinguished by the darker colour of the wood
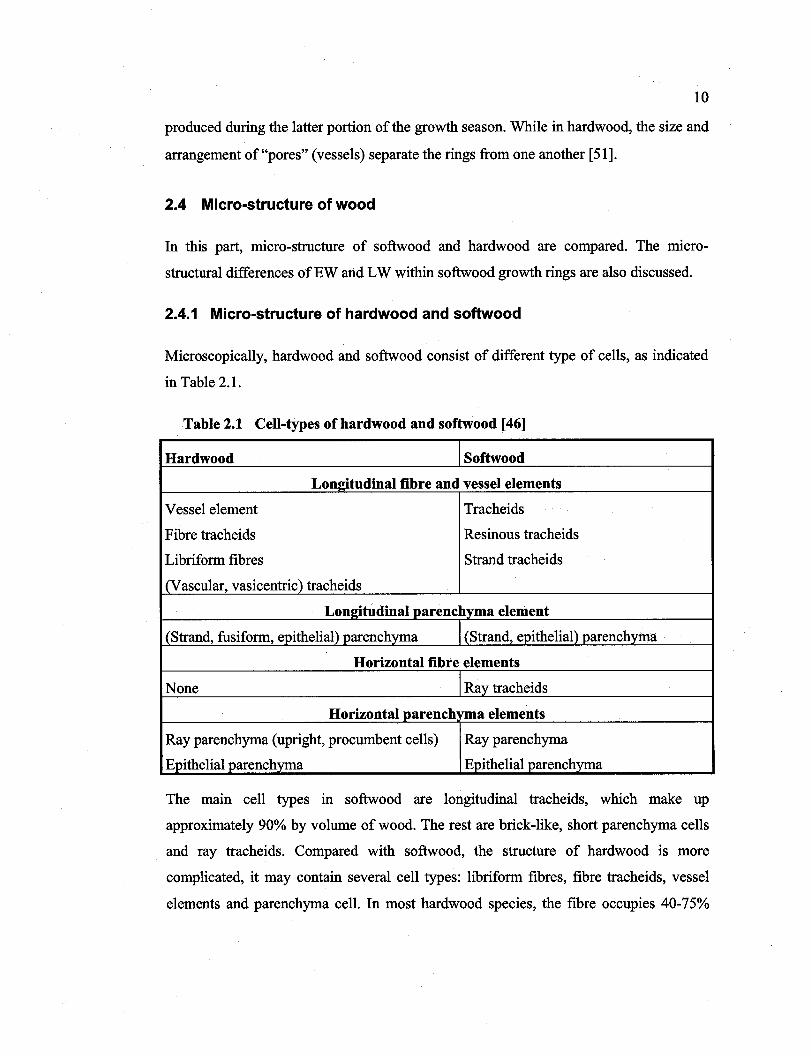
Reproduced with permission of the copyright owner. Further reproduction prohibited without permission.
10
produced during the latter portion of the growth season. Whi1e in hardwood, the size and
arrangement of "pores" (vesse1s) separate the rings from one another [51].
2.4 Micro-structure of wood
In this part, micro-structure of softwood and hardwood are compared. The micro
structural differences of EW and LW within softwood growth rings are also discussed.
2.4.1 Micro-structure of hardwood and softwood
Microscopically, hardwood and softwood consist of different type of cells, as indicated
in Table 2.1.
Table 2.1 Cell-types of hardwood and softwood [46]
Hardwood Softwood
Lon2itudinal fibre and vessel elements
Vesse! element Tracheids
Fibre tracheids Resinous tracheids
Libriform fibres Strand tracheids
1 (Vascular, vasicentric) tracheids
Lon2itudinal varenchyma element
1 (Strand, fusiform, epithelial) parenchyma 1 (Strand, eoithelial) oarenchvma
Horizontal fibre elements
None Ray tracheids
Horizontal parench ma elements
Ray parenchyma (upright, procumbent cells) Ray parenchyma
Epithelial parenchyma Epithelial parenchvma
The main cell types in softwood are longitudinal tracheids, which make up
approximately 90% by volume of wood. The rest are brick-like, short parenchyma cells
and ray tracheids. Compared with softwood, the structure of hardwood is more
complicated, it may contain several cell types: libriform fibres, fibre tracheids, vessel
elements and parenchyma cell. In most hardwood species, the fibre occupies 40-75%
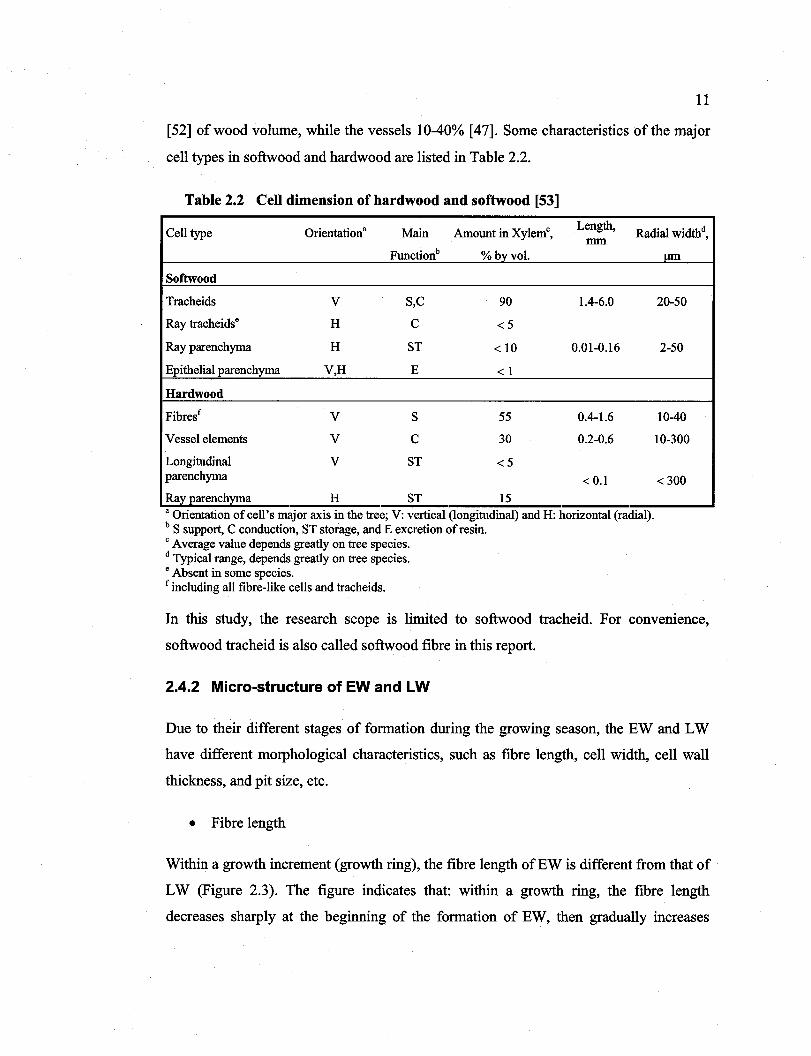
Reproduced with permission of the copyright owner. Further reproduction prohibited without permission.
11
[52] of wood volume, while the vessels 10-40% [47]. Sorne characteristics of the major
cell types in softwood and hardwood are listed in Table 2.2.
Table 2.2 Cell dimension of hardwood and softwood [53]
CeIl type Orientation" Main Amount in XylemC,
Length, Radial widthd,
mm Functionb % byvol.
Softwood
Tracheids V S,C 90 1.4-6.0
Ray tracheidse H C <5
Ray parenchyma H ST < 10 0.01-0.16
Epithelial parenchyma V,H E < 1
Hardwood
Fibresf V S 55 0.4-1.6
Vessel elements V C 30 0.2-0.6
Longitudinal V ST <5 parenchyma < 0.1
Ray parenchyma H ST 15 . . "Onentatlon of ceIl's major aXls ID the tree; V: vertical (longltudinal) and H: honzontal (radial) . b S support, C conduction, ST storage, and E excretion of resin. C Average value depends greatly on tree species. d Typical range, depends greatly on tree species. e Absent in sorne species. f inc1uding aIl fibre-like ceIls and tracheids.
J.Ul1
20-50
2-50
10-40
10-300
<300
In this study, the research scope is limited to softwood tracheid. For convenience,
softwood tracheid is also called softwood fibre in this report.
2.4.2 Micro-structure of EW and LW
Due to their different stages of formation during the growing season, the EW and LW
have different morphological characteristics, such as fibre length, cell width, cell wall
thickness, and pit size, etc.
• Fibre length
Within a growth increment (growth ring), the fibre length of EW is different from that of
LW (Figure 2.3). The figure indicates that: within a growth ring, the fibre length
decreases sharply at the beginning of the formation of EW, then gradually increases
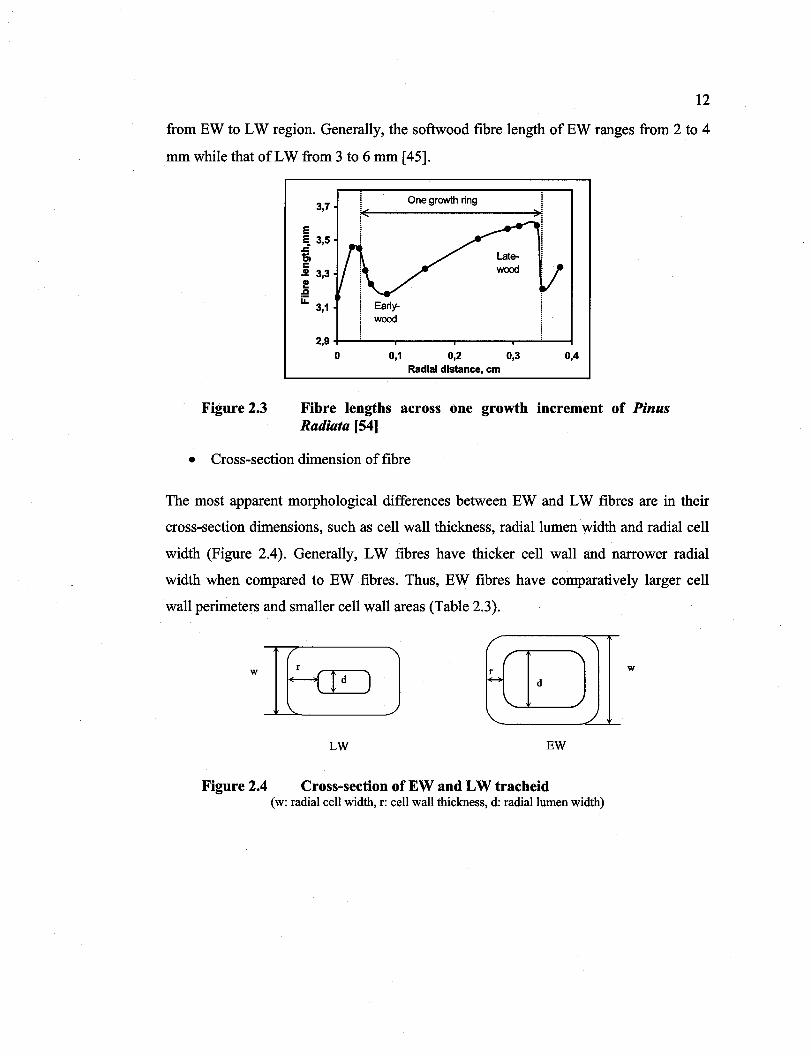
Reproduced with permission of the copyright owner. Further reproduction prohibited without permission.
12
from EW to LW region. Generally, the softwood fibre length ofEW ranges from 2 to 4
mm while that of LW from 3 to 6 mm [45].
Figure 2.3
3,7
E ~ 3,5
i c ..! 3,3 I!! .Q
Li: 3,1 Early-wood
One growth ring
2,9 +-.-...---..---...-----r--'---I o 0,1 0,2 0,3 0,4
Radial distance, cm
Fibre lengths across one growth increment of Pinus Radiata [54]
• Cross-section dimension of fibre
The most apparent morphological differences between EW and LW fibres are in their
cross-section dimensions, such as cell wall thickness, radial lumen width and radial cell
width (Figure 2.4). Generally, LW fibres have thicker cell wall and narrower radial
width when compared to EW ·fibres. Thus, EW fibres have comparatively larger cell
wall perimeters and smaller cell wall areas (Table 2.3).
w {[J w
LW EW
Figure 2.4 Cross-section of EW and LW tracheid (w: radial cell width, r: cell wall thickness, d: radial lumen width)
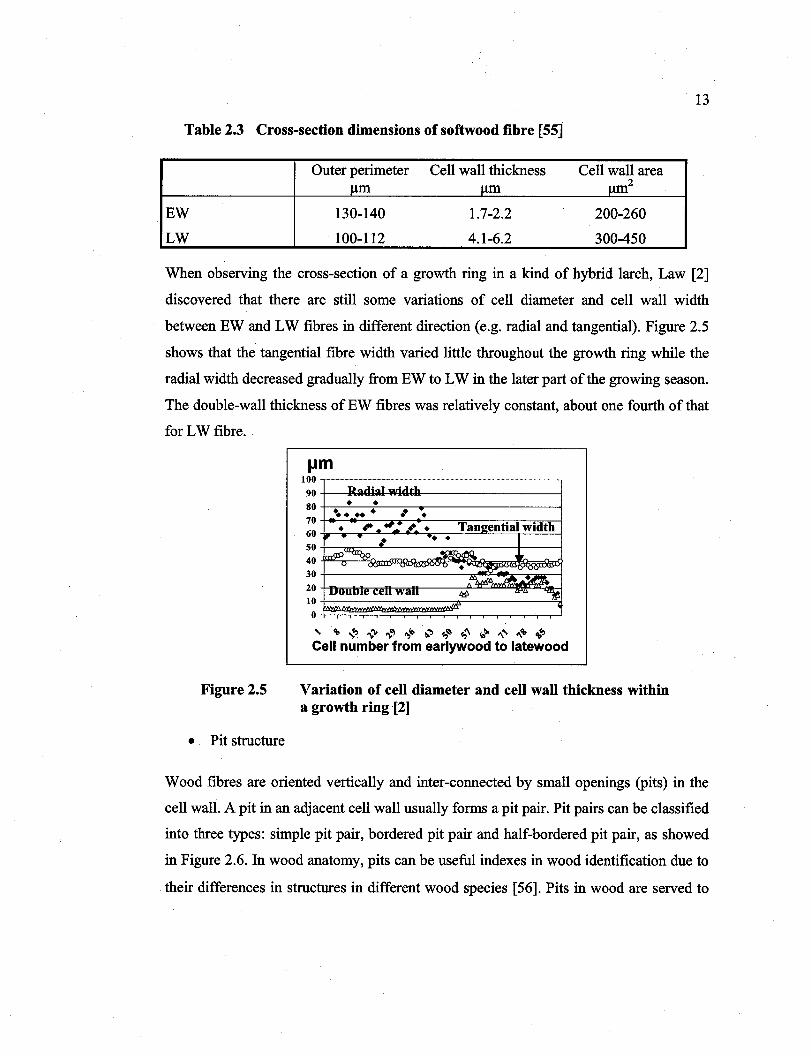
Reproduced with permission of the copyright owner. Further reproduction prohibited without permission.
13
Table 2.3 Cross-section dimensions of softwood fibre [55]
Outer perimeter Cell wall thickness Cell wall area J.lm J.lID J.lID2
EW 130-140 1.7-2.2 200-260
LW 100-112 4.1-6.2 300-450
When observing the cross-section of a growth ring in a kind of hybrid larch, Law [2]
discovered that there are still some variations of cell diameter and cell wall width
between EW and LW fibres in different direction (e.g. radial and tangential). Figure 2.5
shows that the tangential fibre width varied little throughout the growth ring white the
radial width decreased gradually from EW to LW in the later part of the growing season.
The double-wall thickness ofEW fibres was relatively constant, about one fourth ofthat
for LW fibre.
Figure 2.5
• Pit structure
IJm 100 .................................................................................................................. .
90+-~~~W*~--------------~
80+.~·--~·--~~--------------~ ~ ....
70+-~~~.T~~~.--~,-~~ .. ~~ 60~;·~~~~~~·~~~~==~==~
50+-<m=-~------~~-----r--~
40~~~~~~~~~~~~~~ 30+---------------~~~~..m~
20~rnrn~~~~----~~~~~~
1:~~~~~~~~~~~~~~ " . ~ ,," ...... ~ ,.,10 ~ .,~ .," ~ ,," ,,~ ~., Cell number from earlywood to latewood
Variation of cell diameter and cell wall thickness within a growth ring [2]
Wood fibres are oriented vertically and inter-connected by small openings (pits) in the
cell wall. A pit in an adjacent cell wall usually forms a pit pair. Pit pairs can be c1assified
into three types: simple pit pair, bordered pit pair and half-bordered pit pair, as showed
in Figure 2.6. In wood anatomy, pits can be use fuI indexes in wood identification due to
their differences in structures in different wood species [56]. Pits in wood are served to
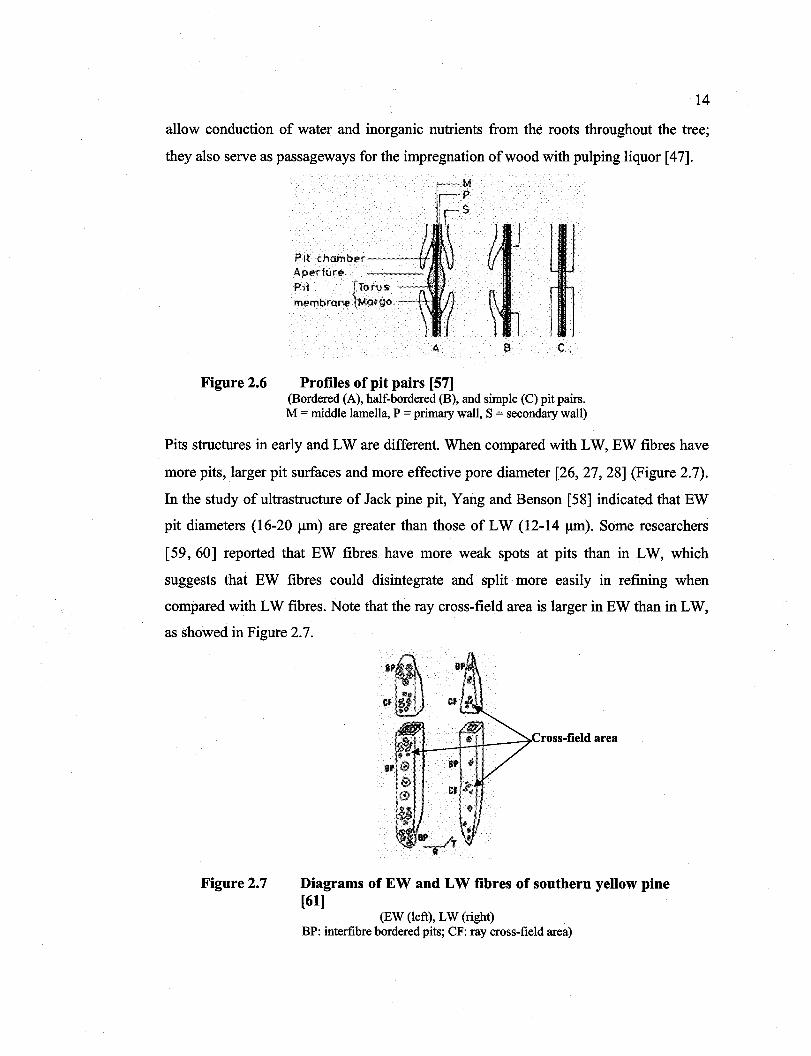
Reproduced with permission of the copyright owner. Further reproduction prohibited without permission.
14
allow conduction of water and inorganic nutrients from the roots throughout the tree;
they also serve as passageways for the impregnation of wood with pulping liquor [47].
M P 5
Pit chambef-~--'11"f Aperture Pit {Torus membraœ Morgo -++1111
B c
Figure 2.6 ProfIles of pit pairs [57] (Bordered (A), half-bordered (B), and simple (C) pit pairs. M = middle lamella, P = primary wall, S = secondary wall)
Pits structures in early and LW are different. When compared with LW, EW fibres have
more pits, larger pit surfaces and more effective pore diameter [26, 27, 28] (Figure 2.7).
In the study ofultrastructure of Jack pine pit, Yang and Benson [58] indicated that EW
pit diameters (16-20 ~m) are greater than those of LW (12-14 ~). Sorne researchers
[59,60] reported that EW fibres have more weak spots at pits than in LW, which
suggests that EW fibres could disintegrate and split more easily in refining when
compared with LW fibres. Note that the ray cross-field area is larger in EW than in LW,
as showed in Figure 2.7.
Figure 2.7
'll_-+-=-+t-_7Cross-field area
Diagrams of EW and LW fibres of southern yellow pine [61]
(EW (left), LW (right) BP: interfibre bordered pits; CF: ray cross-field area)
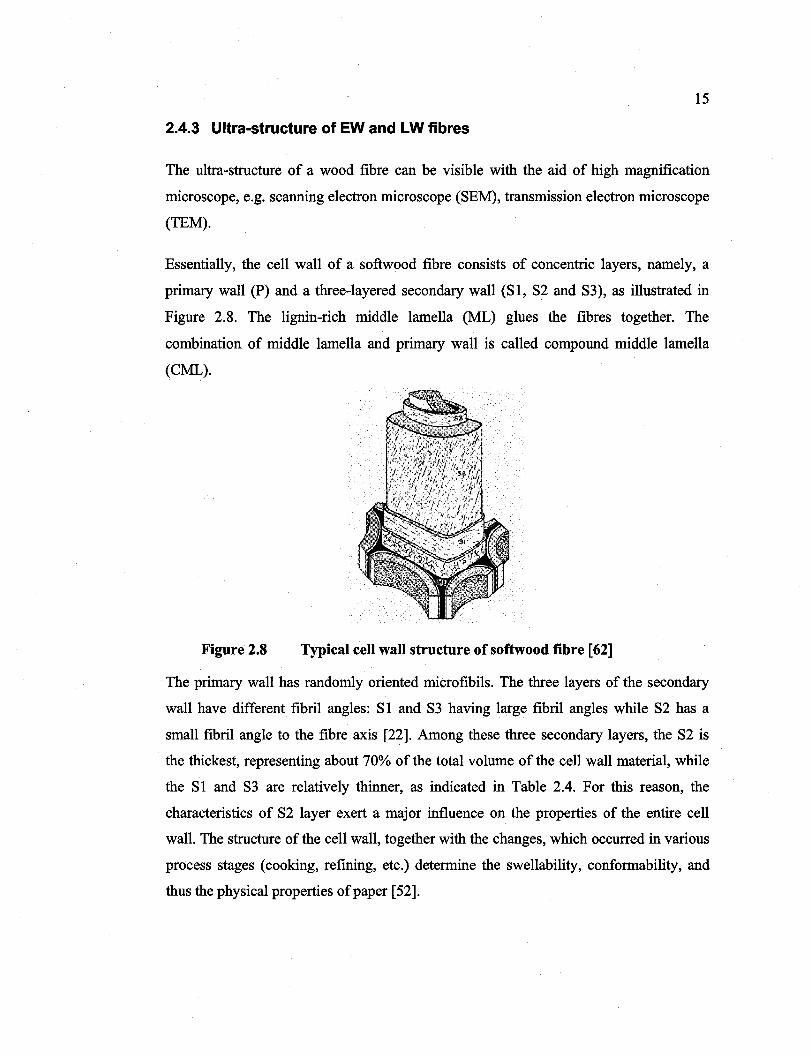
Reproduced with permission of the copyright owner. Further reproduction prohibited without permission.
15
2.4.3 Ultra-structure of EW and LW fibres
The ultra-structure of a wood fibre can be visible with the aid of high magnification
microscope, e.g. scanning electron microscope (8EM), transmission electron microscope
(TEM).
Essentially, the cell wall of a softwood fibre consists of concentric layers, namely, a
primary wall (P) and a three-layered secondary wall (81, 82 and 83), as illustrated in
Figure 2.8. The lignin-rich middle lamella (ML) glues the fibres together. The
combination of middle lamella and primary wall is called compound middle lamella
(CML).
Figure 2.8 Typical cell wall structure of softwood fibre [62]
The primary wall has randomly oriented microfibils. The three layers of the secondary
wall have different fibril angles: 81 and 83 having large fibril angles while 82 has a
small fibril angle to the fibre axis [22]. Among these three secondary layers, the 82 is
the thickest, representing about 70% of the total volume of the cell wall material, while
the 81 and 83 are relative1y thinner, as indicated in Table 2.4. For this reason, the
characteristics of 82 layer exert a major influence on the properties of the entire cell
wall. The structure of the cell wall, together with the changes, which occurred in various
process stages (cooking, refming, etc.) determine the swellability, conformability, and
thus the physical properties ofpaper [52].
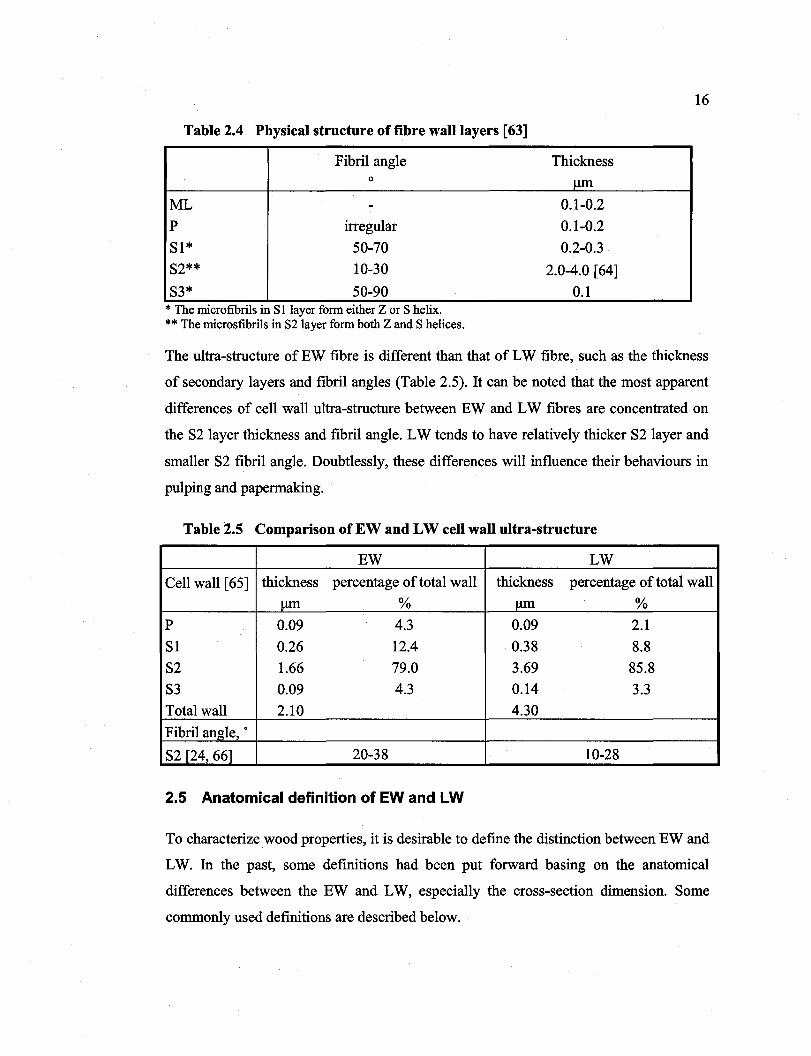
Reproduced with permission of the copyright owner. Further reproduction prohibited without permission.
16
Table 2.4 Physical structure of fibre walllayers [63]
Fibril angle Thickness 0
J..lffi
ML - 0.1-0.2
P irregular 0.1-0.2
81* 50-70 0.2-0.3
82** 10-30 2.0-4.0 [64]
83* 50-90 0.1 * The rrucrofibnls ln 81 layer fOrIn elther Z or 8 hellX. ** The mÏcrosfibrils in 82 layer fOrIn both Z and 8 helices.
The ultra-structure of EW fibre is different than that of LW fibre, such as the thickness
of secondary layers and fibril angles (Table 2.5). It can be noted that the most apparent
differences of cell wall ultra-structure between EW and LW fibres are concentrated on
the 82 layer thickness and fibril angle. LW tends to have relatively thicker 82 layer and
smaller 82 fibril angle. Doubtlessly, these differences will influence their behaviours in
pulping and papermaking.
Table 2.5 Comparison of EW and LW cell wall ultra-structure
EW LW
Cell wall [65] thickness percentage of total wall thickness percentage of total wall
J..lffi % J.Ull. % P 0.09 4.3 0.09 2.1
81 0.26 12.4 0.38 8.8
82 1.66 79.0 3.69 85.8
83 0.09 4.3 0.14 3.3
Total wall 2.10 4.30
Fibril angle, 0
82 [24,661 20-38 10-28
2.5 Anatomical definition of EW and LW
To characterize wood properties, it is desirable to define the distinction between EW and
LW. In the past, sorne definitions had been put forward basing on the anatomical
differences between the EW and LW, especially the cross-section dimension. 80me
commonly used definitions are described below.
Reproduced with permission of the copyright owner. Further reproduction prohibited without permission.
17
• Mork's mIe [67]
A Norwegian wood anatomist, Mork, defmed LW fibres as those that have a double cell
wall thickness equal to or greater than the radial lumen width, as illustrated in Figure
2.4. However, in sorne species the transition from EW to LW is relatively graduaI. In
this case there exists a transition zone where sorne fibres do not meet the requirement of
the Mork's mIe and yet they possess relatively thick cell wall and have LW-like
mechanical properties.
• Parameter Z [68]
Parameter Z is defined as the cross-section fibre wall area divided by the area of a circle
with the same outer perimeter (Eq. 2.1).
Eq.2.l
Aw = cross-sectional fibre wall area
P = fibre outer perimeter
The value of the parameter Z ranges from 0 to 1. A value close to 0 would indicate an
EW fibre; conversely a value near 1 indicates LW fibre. The drawback of the Parameter
Z is that there is no definite value defining distinction between the EW and LW.
• Mohlin's FIL ratio [69]
Mohlin used a ratio of outer cell wall perimeter of fibre (F) and outer lumen perimeter
(L), FIL, to indicate the amount of LW fibres. The larger the ratio indicates the more LW
fibres in the sample. On the contrary, smaller ratio represents more EW fibres. To be
useful it requires knowing the upper value for 1 00% LW fibres and the lower value for
all EW fibres. As in the case of the Parameter Z, there is no clear demarcation between
EW and LW fibres. However, it does give an indication of fibre quality of a pulp
fumish.
In reality, as indicated earlier, in most species there is a transition zone between EW and
LW (Figure 2.1, Figure 2.9) within a growth ring. None of the above definitions has
taken this into account, suggesting the weakness of these definitions. However, the
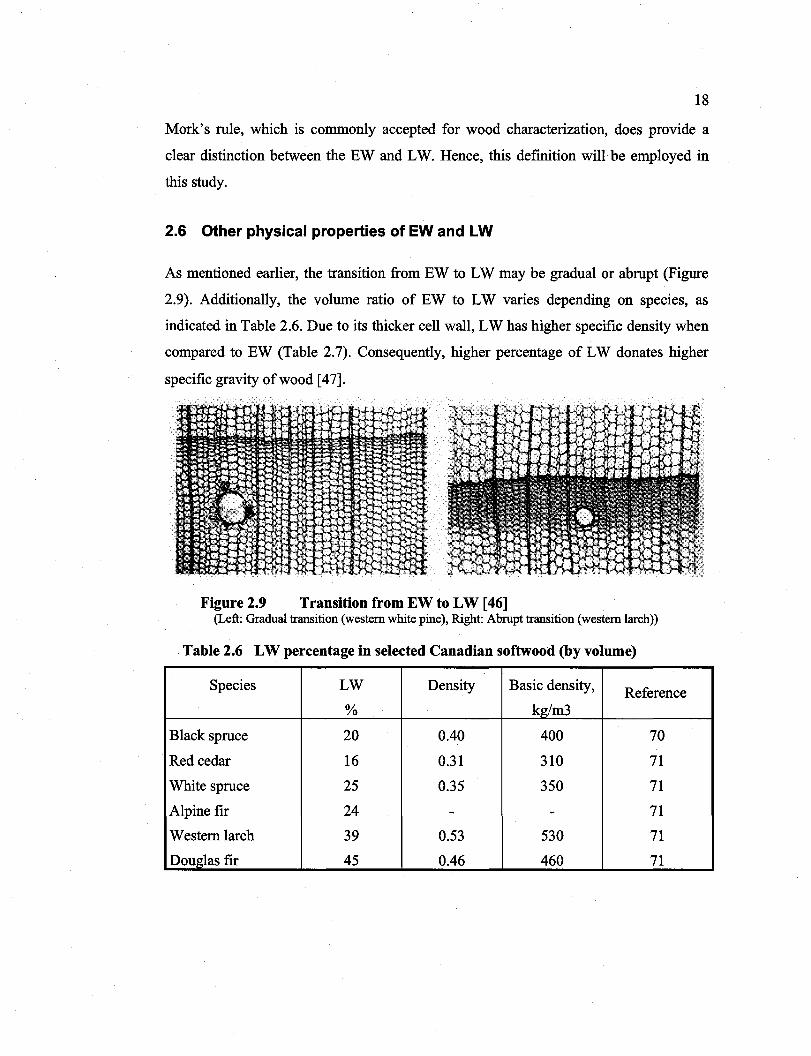
Reproduced with permission of the copyright owner. Further reproduction prohibited without permission.
18
Mork's rule, which is commonly accepted for wood characterization, does provide a
c1ear distinction between the EW and LW. Hence, this definition will be employed in
this study.
2.6 Other physical properties of EW and LW
As mentioned earlier, the transition from EW to LW may be graduaI or abrupt (Figure
2.9). Additionally, the volume ratio of EW to LW varies depending on species, as
indicated in Table 2.6. Due to its thicker cell wall, LW has higher specific density when
compared to EW (Table 2.7). Consequently, higher percentage of LW donates higher
specific gravity of wood [47].
Figure 2.9 Transition from EW to LW [46] (Left: GraduaI transition (western white pine), Right: Abrupt transition (western larch))
Table 2.6 LW percentage in selected Canadian softwood (by volume)
Species LW Density Basic density, Reference % kg/m3
Black spruce 20 0.40 400 70
Red cedar 16 0.31 310 71
White spruce 25 0.35 350 71
Alpine fir 24 - - 71
Western larch 39 0.53 530 71
Douglas fir 45 0.46 460 71
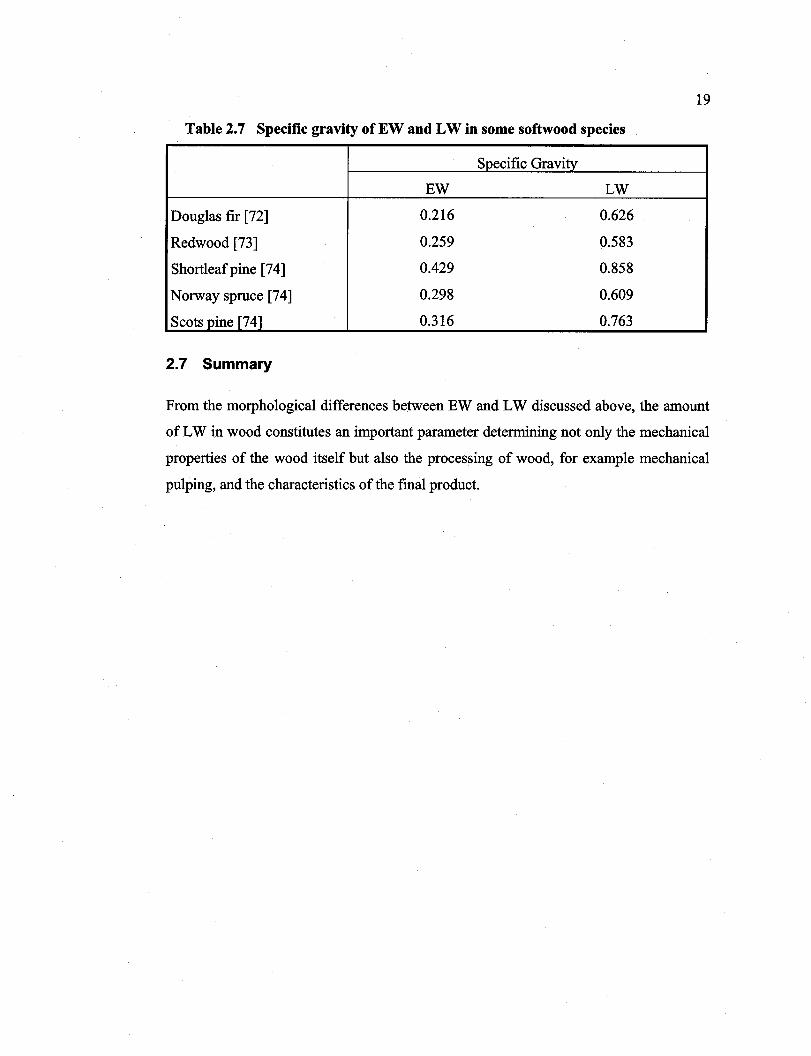
Reproduced with permission of the copyright owner. Further reproduction prohibited without permission.
19
Table 2.7 Specifie gravity of EW and LW in sorne softwood species
Specifie Gravity
EW LW
Douglas fir [72] 0.216 0.626
Redwood [73] 0.259 0.583
Shortleafpine [74] 0.429 0.858
Norway spruee [74] 0.298 0.609
Seots pine [74] 0.316 0.763
2.7 Summary
From the morphologieal differenees between EW and LW diseussed above, the amount
of LW in wood eonstitutes an important parameter determining not only the meehanieal
properties of the wood itself but also the proeessing of wood, for example meehanieal
pulping, and the eharaeteristies of the final produet.
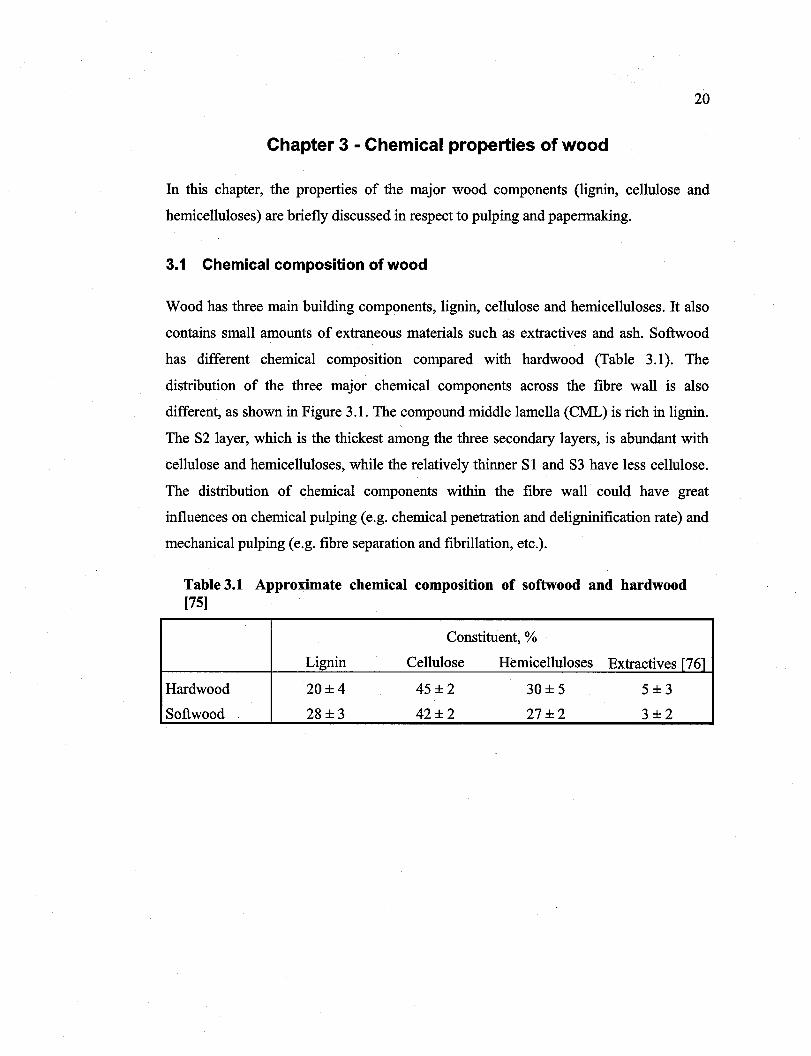
Reproduced with permission of the copyright owner. Further reproduction prohibited without permission.
20
Chapter 3 - Chemical properties of wood
In this chapter, the properties of the major wood components (lignin, cellulose and
hemicelluloses) are briefly discussed in respect to pulping and papermaking.
3.1 Chemical composition of wood
Wood has three main building components, lignin, cellulose and hemicelluloses. It also
contains small amounts of extraneous materials such as extractives and ash. 8oftwood
has different chemical composition compared with hardwood (Table 3.1). The
distribution of the three major chemical components across the fibre wall is also
different, as shown in Figure 3.1. The compound middle lamella (CML) is rich in lignin.
The 82 layer, which is the thickest among the three secondary layers, is abundant with
cellulose and hemicelluloses, while the re1atively thinner 81 and 83 have less cellulose.
The distribution of chemical components within the fibre wall could have great
influences on chemical pulping (e.g. chemical penetration and deligninification rate) and
mechanical pulping (e.g. fibre separation and fibrillation, etc.).
Table 3.1 Approximate chemical composition of softwood and hardwood [75]
Constituent, %
Lignin Cellulose Hemicelluloses Extractives [76]
Hardwood 20±4 45±2 30±5 5±3
8oftwood 28±3 42±2 27±2 3±2
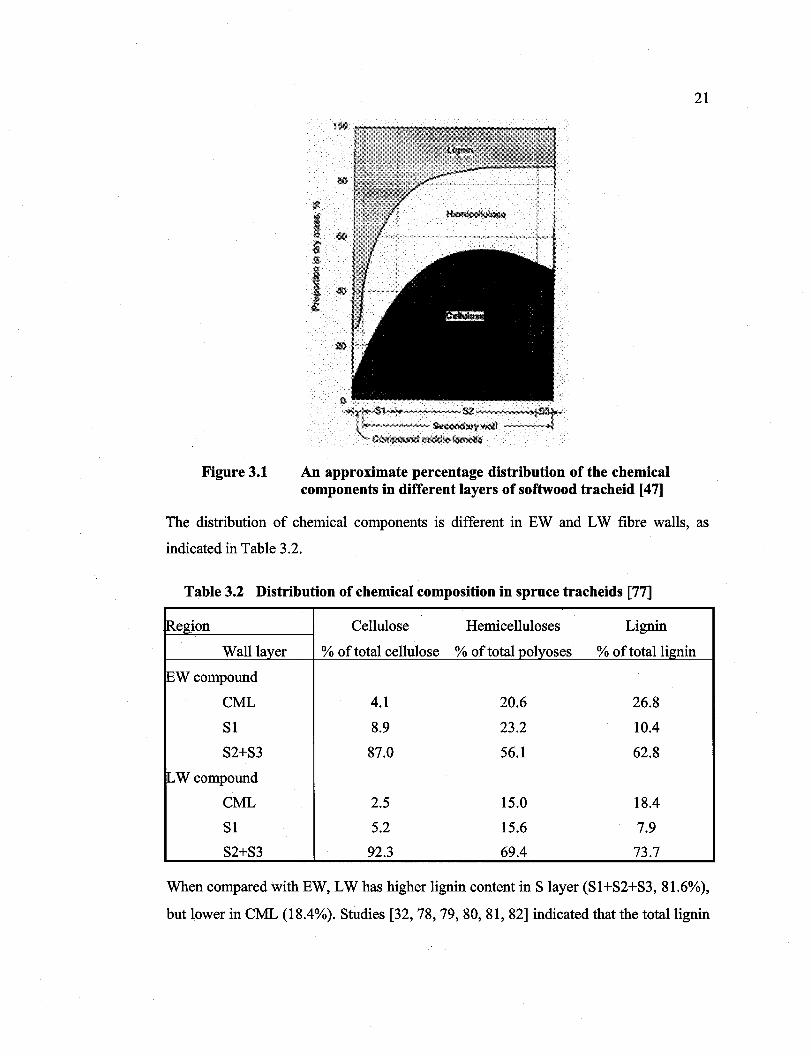
Reproduced with permission of the copyright owner. Further reproduction prohibited without permission.
Figure 3.1 An approximate percentage distribution of the chemical components in different layers of softwood tracheid [47]
21
The distribution of chemical components is different in EW and LW fibre walls, as
indicated in Table 3.2.
Table 3.2 Distribution of chemical composition in spruce tracheids [77]
lRegion Cellulose Hemicelluloses Lignin
Wall layer % of total cellulose % of total polyoses % of totallignin
EWcompound
CML 4.1 20.6 26.8
SI 8.9 23.2 10.4
S2+S3 87.0 56.1 62.8
LW compound
CML 2.5 15.0 18.4
SI 5.2 15.6 7.9
S2+S3 92.3 69.4 73.7
When compared with EW, LW has higher lignin content in S layer (S1+S2+S3, 81.6%),
but lower in CML (18.4%). Studies [32, 78, 79,80,81,82] indicated that the totallignin
Reproduced with permission of the copyright owner. Further reproduction prohibited without permission.
22
content (S+CML) is higher in EW as contrast to LW. LW has higher cellulose content
due to its thicker and cellulose-rich S2 layer [33]. The distribution of hemicelluloses is
uneven either in EW or in LW. According to the calculated results, the hemicelluloses
content is higher in EW than in LW [83].
3.2 Chemical properties of major wood components
The general characteristics of cellulose, hemicelluloses and lignin, are discussed briefly
in the followings.
Cellulose is the main component of wood fibre, located mainly in the S2layer. Cellulose
is a long-chain unbranched polymer composed of ~-D-glucopyranose units linked
together by (1-4)-~-glycosidic bonds. The degree of polymerization (DP) of wood
cellulose is around 500-10000 glucose units, and its molecular weight is in the order of
600,000 [84, 85]. Cellulose molecules have a high tendency to form intra- and
intermolecular hydrogen bonds and thus aggregate together into microfibrils [63].
Highly ordered (crystalline) regions altemate with less ordered (amorphous) regions in
the microfibrils, and the crytallinity is around 60-70% [45]. The softening temperature
of dry cellulose and in water-saturation state are 220·C and 20·C, respectively [35]. As
such, these characteristics of cellulose have a strong influence on the fibre flexibility,
physical strength, swelling and water absorption capacity.
The main softwood hemicelluloses are galactoglucomannan, arabinoglucuronoxylan,
and arabinogalactan [52]. The softening temperature of hemicellulose under dry and
water-saturated state is 180-220·C [86] and 20·C [87], respectively. Hemicelluose and
cellulose are mutually attached by hydrogen bonds and Van Der Waals force. The lignin
and hemicelluloses form a so-called lignin-carbon-hydrogen complex (LCC) [45, 63].
Generally, in refming, most of the hemicelluose is retained, improving pulp yield and
fibre properties. As a hydrophilic polymer [88], hemicelluloses have a high ability to
absorb water and swell. Thus, high hemicelluloses content improves fibre flexibility and
increases the final sheet density [52].
Reproduced with permission of the copyright owner. Further reproduction prohibited without permission.
23
Lignin is an amorphous cross-linked three-dimensional polymer (DP 20,000) with
phenylpropane units [89]. The phenylpropane units are joined together with stable
covalent bonds (ether and C-C linkages) and less stable hydrogen bonds. Lignin also
contains functional groups such as methoxyl, phenolic hydroxyl, benzyl alcohol, and
carbonyl groups. Functional groups are of major influence in the reactivity of lignin in
chemical pulping. The typical softwood lignin is predominately guaiacyl type, whereas
guaiacyl and syringyl groups are present in hardwood [52]. The phenylpropane units
render lignin hydrophobic while its three-dimensional structure makes the cell wall
resistant to external forces. The softening temperature of water-saturated lignin is 80-
90·C. Additional water does not result in considerable further softening of the lignin. In
mechanical pulping, the in situ softening temperature of lignin (as part of the wood fibre
matrix) is in the range of 100-130·C [35]. Thus, refining at temperatures equal or higher
than the softening temperature is beneficial to maintain fibre length.
3.3 Summary
Wood is mainly composed of lignin, cellulose and hemicelluloses. The distribution of
these major components is different in EW and LW. This uneven distribution in EW and
LW would influence their behaviours in pulping and papermaking.
Reproduced with permission of the copyright owner. Further reproduction prohibited without permission.
24
Chapter 4 • Effects of EW and LW on pulping and papermaking
EW and LW fibres could behave differently in pulping and papermaking due to their
considerable differences in physical structure and chemical composition. In this chapter,
the effects of EW and LW on pulping, particularly refming, and their influences on
paper properties are discussed.
4.1 Effects on pulping
There are two main types of pulping: chemical and mechanical pulping. Generally, the
chemical pulping dissolves out the lignin, which binds the cellu10sic fibres together
while the mechanical pulping separates the fibres from wood chips or logs by
mechanical forces with little loss of wood components. Evidently, the fibre
characteristics are different for the chemical and mechanical processes. Due to their low
yield, the chemical fibres are flexible and produce paper with excellent strength
properties. Furthermore, because of the dissolution of lignin in chemical pulping, the
process requires little mechanical forces to separate the fibres, minimizing fibre
breakage. On the other hand, the mechanical fibres contain practically all the lignin
component, rendering them stiff and yielding bulky paper with good optical properties
[34]. Additionally, the mechanical fibres suffer severe fibre breakage, shortening the
average fibre length. The behaviour of EW and LW in both mechanical and chemical
pulping is discussed respectively in the followings.
4.1.1 Effects on mechanical pulping
Mechanical pulping can be classified into two processes: stone grinding (SG) and
refming. In SG, debarked wood logs are forced against a revolving abrasive stone which
grinds the fibres off the logs and release them from the matrix. The process is harsh and
energy efficient [40]. In refining, wood chips are fed between two metal discs with at
least one of them rotating. The wood fibres are separated by the action of grooves and
bars on the surfaces of the two discs [34]. These two types of mechanical pulp have
different properties: the SG pulp has a higher content of fines due to the abrasive action,
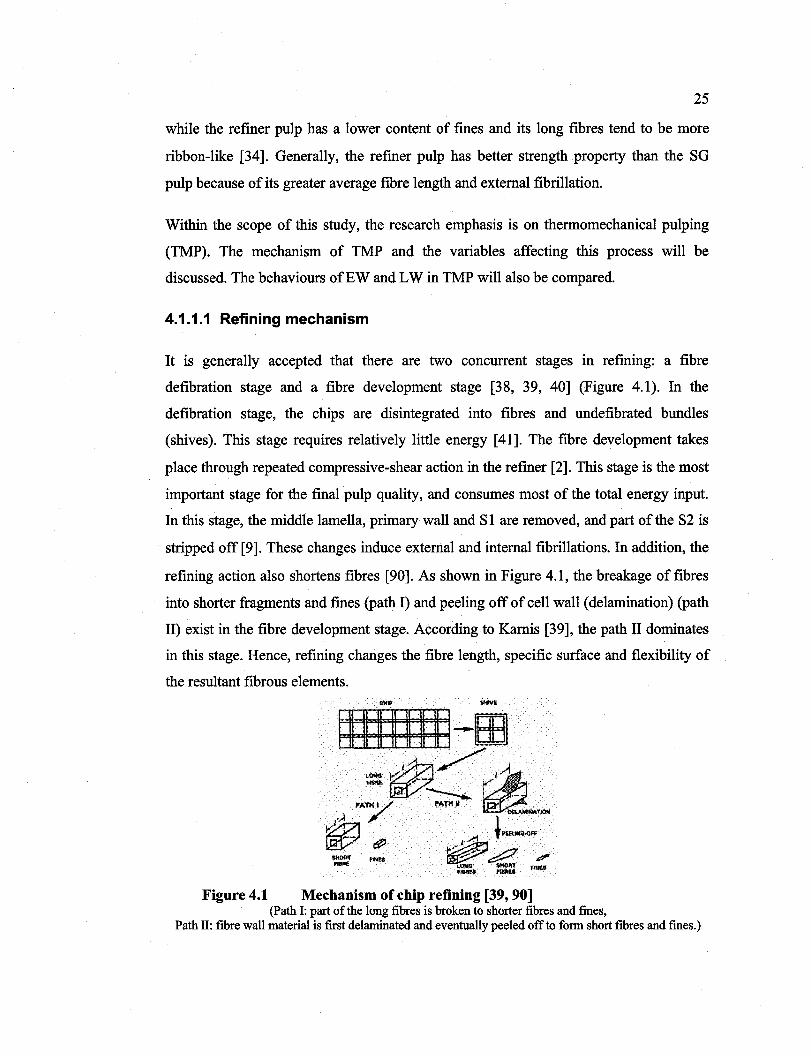
Reproduced with permission of the copyright owner. Further reproduction prohibited without permission.
25
while the refiner pulp has a lower content of fines and its long fibres tend to be more
ribbon-like [34]. Generally, the refmer pulp has better strength property than the SG
pulp because of its greater average fibre length and external fibrillation.
Within the scope of this study, the research emphasis is on thermomechanical pulping
(TMP). The mechanism of TMP and the variables affecting this process will be
discussed. The behaviours ofEW and LW in TMP will also be compared.
4.1.1.1 Refining mechanism
It is generally accepted that there are two concurrent stages in refming: a fibre
defibration stage and a fibre development stage [38, 39, 40] (Figure 4.1). In the
defibration stage, the chips are disintegrated into fibres and undefibrated bundles
(shives). This stage requires relatively little energy [41]. The fibre development takes
place through repeated compressive-shear action in the refiner [2]. This stage is the most
important stage for the final pulp quality, and consumes most of the total energy input.
In this stage, the middle lamella, primary wall and SI are removed, and part of the S2 is
stripped off [9]. These changes induce external and internaI fibrillations. In addition, the
refining action also shortens fibres [90]. As shown in Figure 4.1, the breakage of fibres
into shorter fragments and fines (path 1) and peeling off of cell wall (delamination) (path
II) exist in the fibre deve10pment stage. According to Kamis [39], the path II dominates
in this stage. Hence, refining changes the fibre length, specifie surface and flexibility of
the resultant fibrous elements.
Figure 4.1 Mechanism of chip refining [39, 90] (Path 1: part of the long fibres is broken to shorter fibres and fines,
Path II: fibre wall material is fust delaminated and eventually peeled offto form short fibres and fines.)
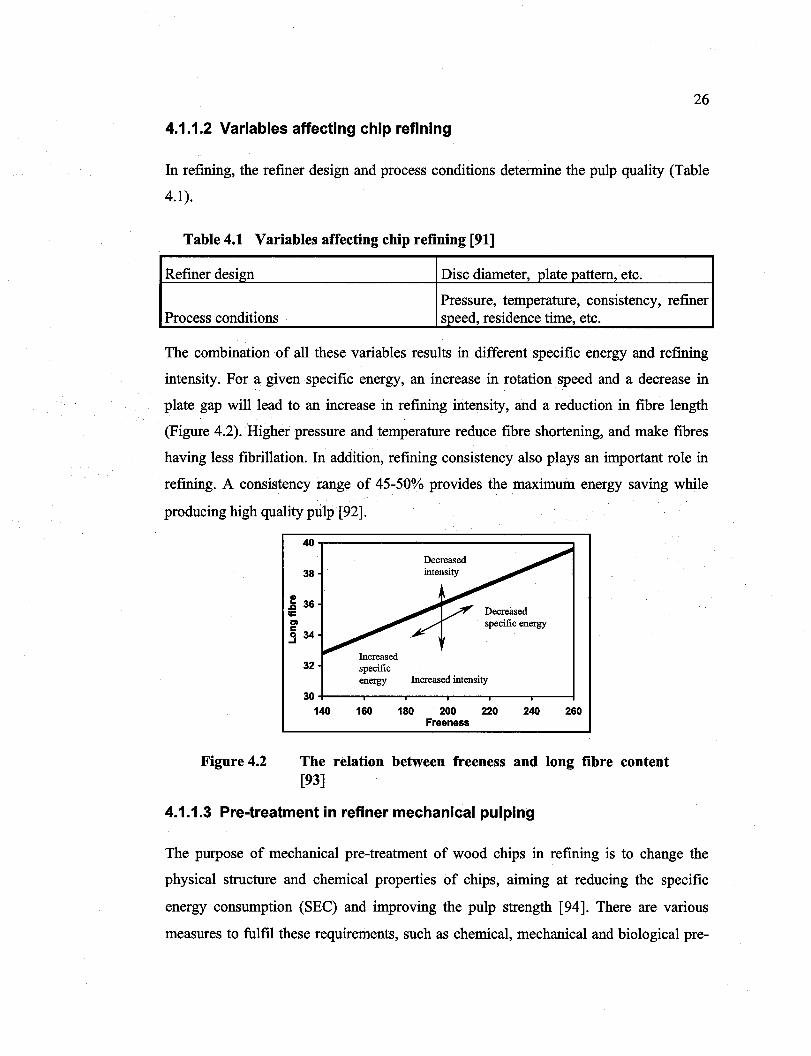
Reproduced with permission of the copyright owner. Further reproduction prohibited without permission.
26
4.1.1.2 Variables affecting chip refining
In refining, the refiner design and process conditions determine the pulp quality (Table
4.1).
Table 4.1 Variables affecting chip refining [91]
Refmer design Disc diameter, plate pattern, etc.
Pressure, temperature, consistency, refiner Process conditions speed, residence time, etc.
The combination of all these variables results in different specific energy and refming
intensity. For a given specific energy, an increase in rotation speed and a decrease in
plate gap wi11lead to an increase in refining intensity, and a reduction in fibre length
(Figure 4.2). 'Higher pressure and temperature reduce fibre shortening, and make fibres
having less fibrillation. In addition, refining consistency also plays an important role in
refining. A consistency range of 45-50% provides the maximum energy saving while
producing high quality ptilp [92].
Figure 4.2
40
38 Decreased Ùltensity
~ 36 Decreased specifie energy
1;: CI
5 34 ...J
32 energy Increased Ùltensity
30+---~----~--~----,----,--~
140 160 180 200 220 Freeness
240 260
The relation between freeness and long fibre content [93]
4.1.1.3 Pre-treatment in refiner mechanical pulping
The purpose of mechanical pre-treatment of wood chips in refining is to change the
physical structure and chemical properties of chips, aiming at reducing the specific
energy consumption (SEC) and improving the pulp strength [94]. There are various
measures to fulfi1 these requirements, such as chemical, mechanical and biological pre-
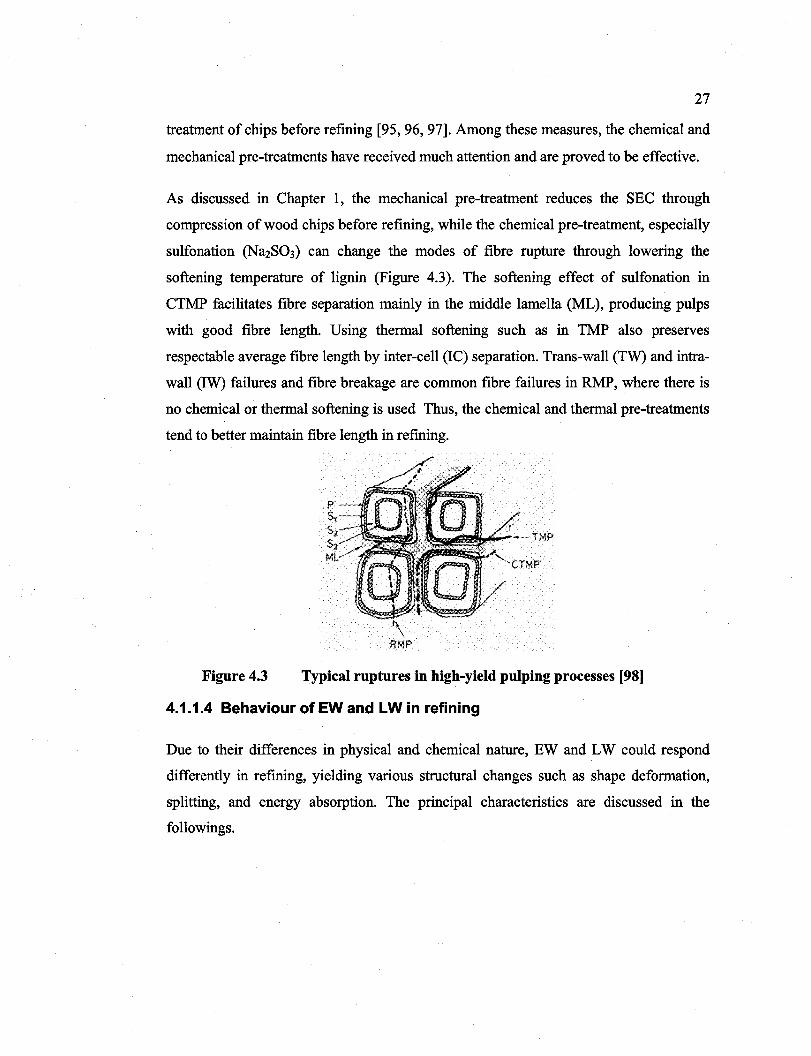
Reproduced with permission of the copyright owner. Further reproduction prohibited without permission.
27
treatment of chips before refining [95,96,97]. Among these measures, the chemical and
mechanical pre-treatments have received much attention and are proved to be effective.
As discussed in Chapter l, the mechanical pre-treatment reduces the SEC through
compression of wood chips before refining, while the chemical pre-treatment, especially
sulfonation (Na2Sû3) can change the modes of fibre rupture through lowering the
softening temperature of lignin (Figure 4.3). The softening effect of sulfonation in
CTMP facilitates fibre separation mainly in the midd1e lamella (ML), producing pulps
with good fibre length. U sing thermal softening such as in TMP also preserves
respectable average fibre length by inter-cell (lC) separation. Trans-wall (TW) and intra
wall (IW) failures and fibre breakage are common fibre failures in RMP, where there is
no chemical or thermal softening is used Thus, the chemical and thermal pre-treatments
tend to better maintain fibre length in refming.
'\ \
RMP
Figure 4.3 Typical ruptures in high-yield pulping processes [98]
4.1.1.4 Behaviour ofEWand LW in refining
Due to their differences in physical and chemical nature, EW and LW could respond
differently in refining, yielding various structural changes such as shape deformation,
splitting, and energy absorption. The principal characteristics are discussed in the
followings.
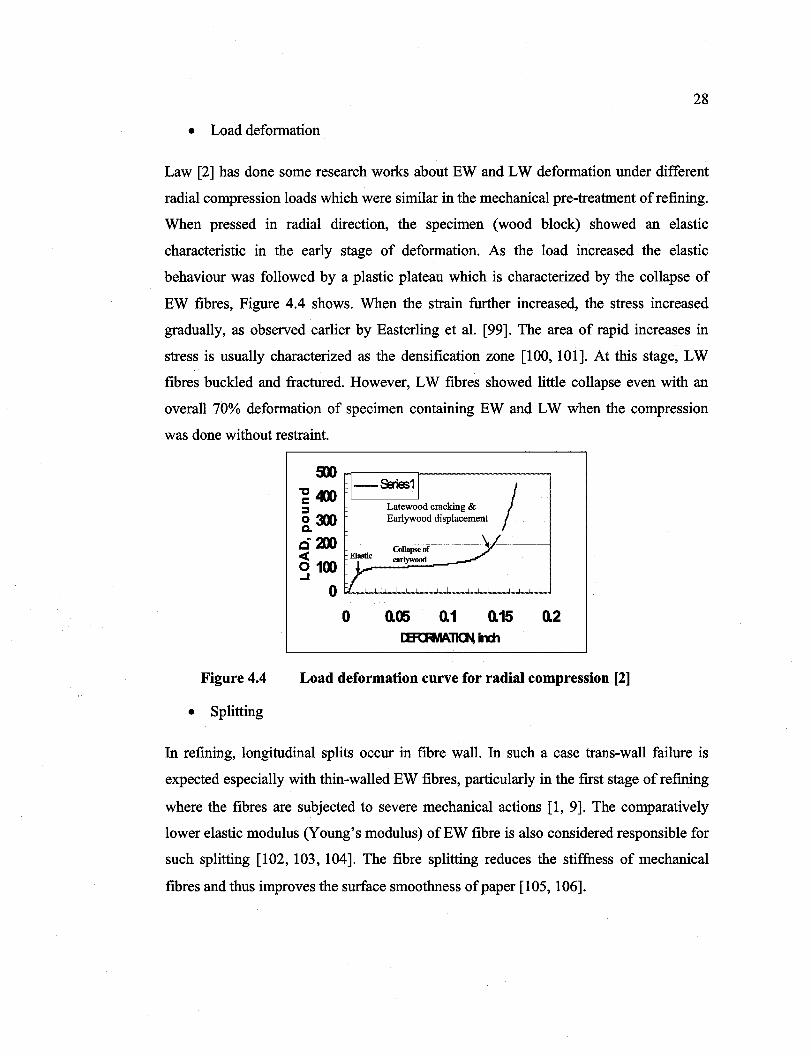
Reproduced with permission of the copyright owner. Further reproduction prohibited without permission.
28
• Load deformation
Law [2] has done sorne research works about EW and LW deformation under different
radial compression loads which were similar in the mechanical pre-treatment of refining.
When pressed in radial direction, the specimen (wood block) showed an elastic
characteristic in the early stage of deformation. As the load increased the elastic
behaviour was followed by a plastic plateau which is characterized by the collapse of
EW fibres, Figure 4.4 shows. When the strain further increased, the stress increased
gradually, as observed earlier by Easterling et al. [99]. The area of rapid increases in
stress is usually characterized as the densification zone [100, 101]. At this stage, LW
fibres buckled and fractured. However, LW fibres showed little collapse even with an
overall 70% deformation of specimen containing EW and LW when the compression
was done without restraint.
Figure 4.4
• Splitting
9X)
~400 :::s 03(1) c. ciD <C 0100 ...1
o
J-Serie:;1 1 J Latewood cracking & / Earlywood displacement
\/ Eljtic
Collapseof
~ earlywood
/': o 0.05 0.1 0.15 0.2
Load deformation curve for radial compression [2]
In refining, longitudinal splits occur in fibre wall. In such a case trans-wall failure is
expected especially with thin-walled EW fibres, particularly in the frrst stage of refining
where the fibres are subjected to severe mechanical actions [1, 9]. The comparatively
lower elastic modulus (Young's modulus) ofEW fibre is also considered responsible for
such splitting [102, 103, 104]. The fibre splitting reduces the stiffness of mechanical
fibres and thus improves the surface smoothness of paper [105, 106].
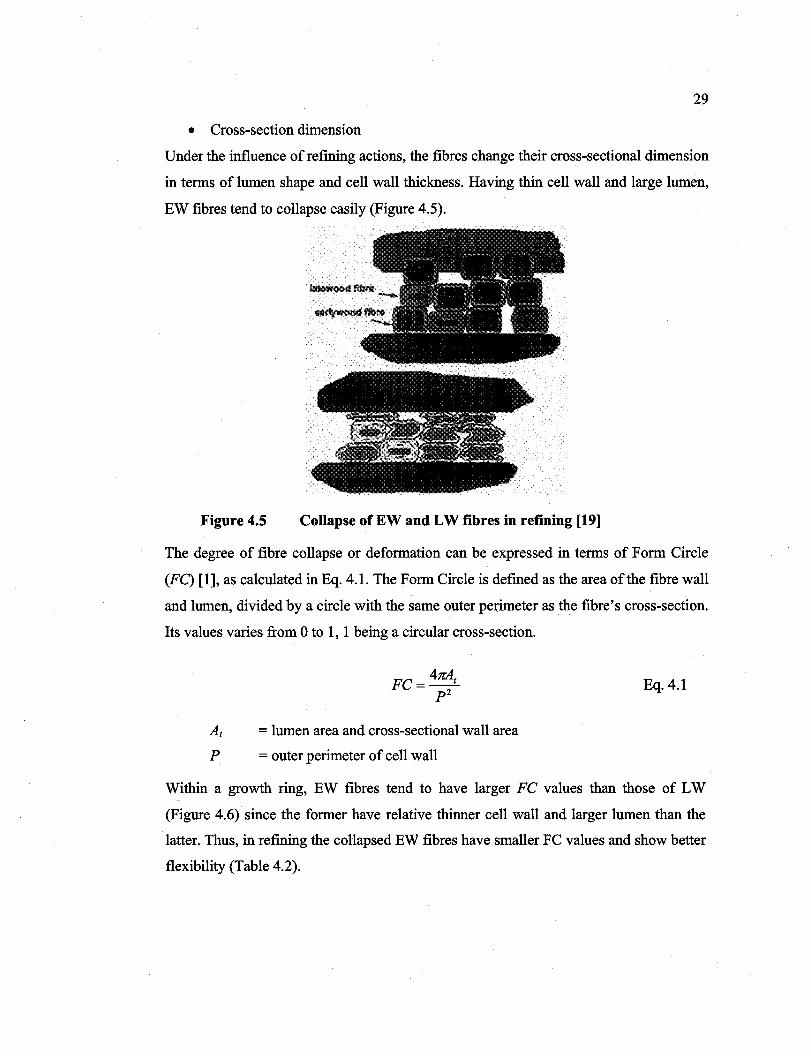
Reproduced with permission of the copyright owner. Further reproduction prohibited without permission.
29
• Cross-section dimension
Under the influence of refining actions, the fibres change their cross-sectional dimension
in terms of lumen shape and cell wall thickness. Having thin cell wall and large lumen,
EW fibres tend to collapse easily (Figure 4.5).
Figure 4.5 Collapse of EW and LW fibres in refining [19]
The degree of fibre collapse or deformation can be expressed in terms of Form Circ1e
(FC) [1], as calculated in Eq. 4.1. The Form Circ1e is defined as the area of the fibre wall
and lumen, divided by a circ1e with the same outer perimeter as the fibre's cross-section.
Its values varies from 0 to 1, 1 being a circular cross-section.
FC = 47Zi4t
p2
At = lumen area and cross-sectional wall area
p = outer perimeter of cell wall
Eq.4.1
Within a growth ring, EW fibres tend to have larger FC values than those of LW
(Figure 4.6) since the former have relative thinner cell wall and larger lumen than the
latter. Thus, in refming the collapsed EW fibres have smaller FC values and show better
flexibility (Table 4.2).
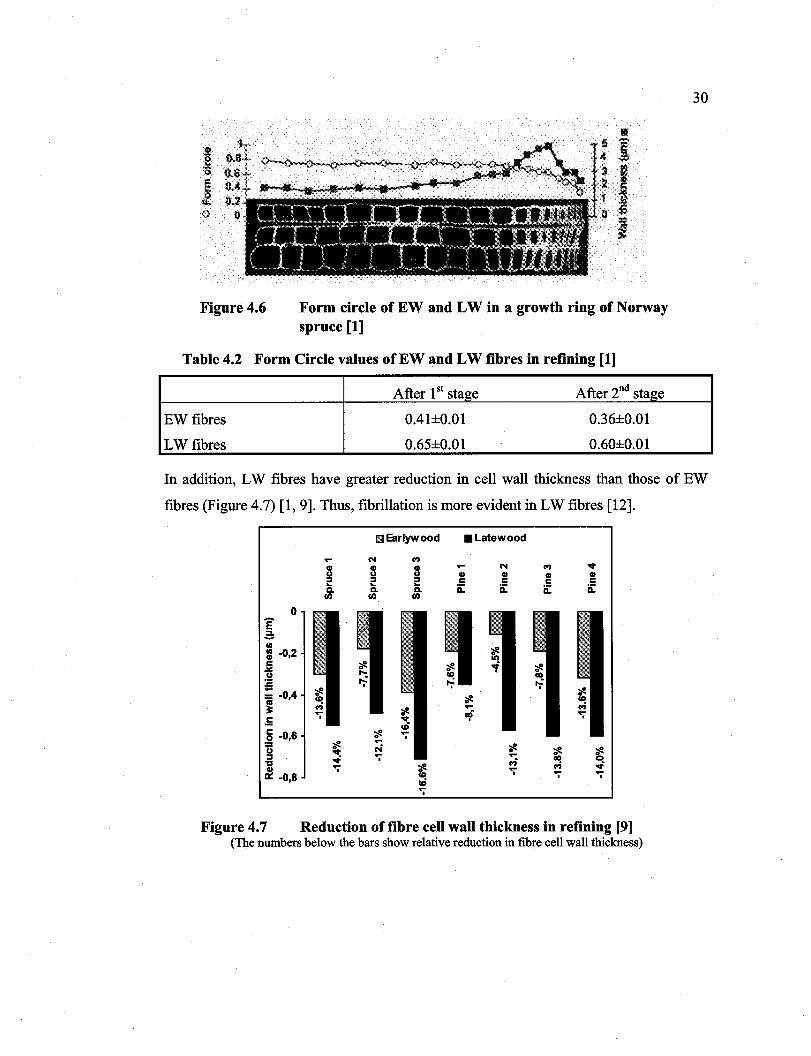
Reproduced with permission of the copyright owner. Further reproduction prohibited without permission.
CI
! Q
! <>
Figure 4.6
.. 5 ): 4 3 1 2 '1 (l s 1
Form circle ofEW and LW in a growth ring of Norway spruce [1]
Table 4.2 Form Circle values of EW and LW fibres in refining [1 J
After 1 st stage After 2nd staf,Ze
EWfibres 0.41±0.01 0.36±0.01
LW fibres 0.65±0.01 0.60±0.01
30
In addition, LW fibres have greater reduction in cell wall thickness than those of EW
fibres (Figure 4.7) [1,9]. Thus, fibrillation is more evident in LW fibres [12].
IlIIEarlywood • Latewood
.... N CO')
al al al .... N CO') ..,. u u U al al al al 2 :::1 :::1 C C C C ... ... a:: a:: a:: a:: CL CL CL
UJ UJ UJ
° Ê a 1/1
~ i -0,2 ~ c te 'f te ~ u ~ CIO :c 1';- toi
;;;; -0,4 ~ te 0 te IQ IQ ; toi ~ .... toi
.5 '";" \ f1j '";"
5 -0,6 te IQ '";"
1; te .... te ..,. coi te te :::1 ..; '";" .... CIO ~ "C ..; toi al '";" te .... ..,.
II!: -0,8 IQ 1 '";" '";" iii '";"
Figure 4.7 Reduction of fibre cell wall thickness in refining [9J (The numbers below the bars show relative reduction in fibre cell wall thickness)
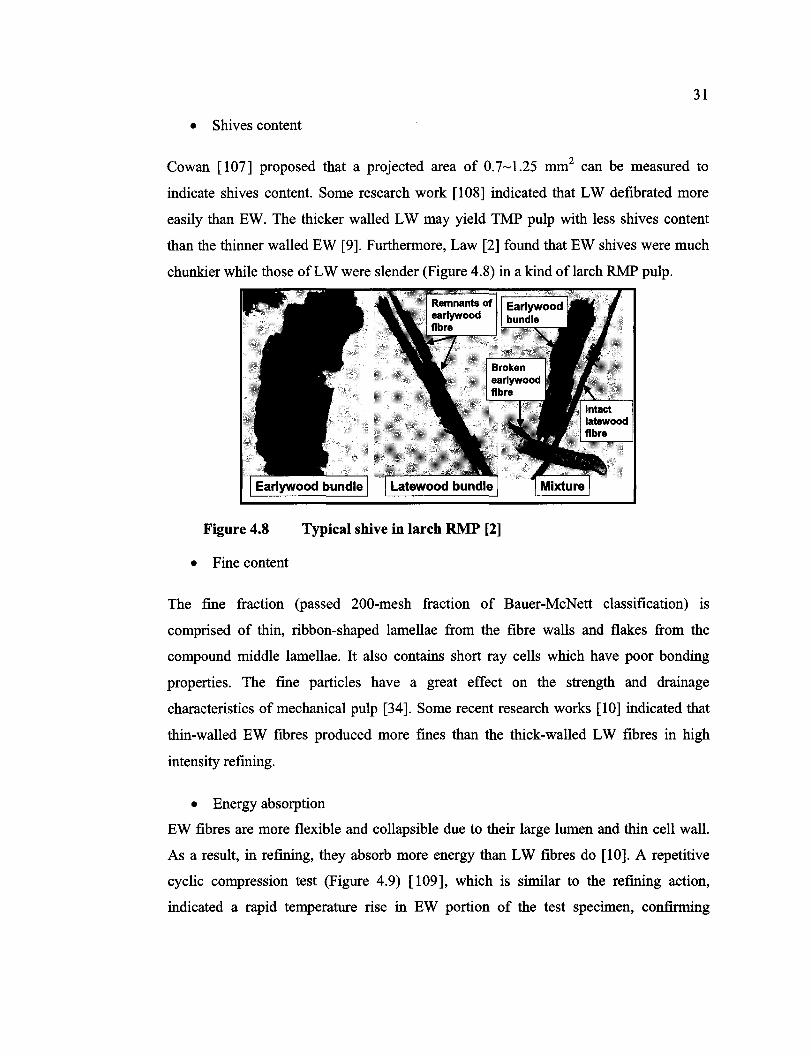
Reproduced with permission of the copyright owner. Further reproduction prohibited without permission.
31
• Shives content
Cowan [107] proposed that a projected area of 0.7~1.25 mm2 can be measured to
indicate shives content. Sorne research work [108] indicated that LW defibrated more
easily than EW. The thicker walled LW may yield TMP pulp with less shives content
than the thinner walled EW [9]. Furthermore, Law [2] found that EW shives were much
chunkier while those of LW were slender (Figure 4.8) in a kind of larch RMP pulp.
Figure 4.8 Typical shive in larch RMP [2]
• Fine content
The fine fraction (passed 200-mesh fraction of Bauer-McNett classification) is
comprised of thin, ribbon-shaped lamellae from the fibre walls and flakes from the
compound middle lamellae. It also contains short ray cells which have poor bonding
properties. The fine particles have a great effect on the strength and drainage
characteristics of mechanical pulp [34]. Sorne recent research works [10] indicated that
thin-walled EW fibres produced more fines than the thick-walled LW fibres in high
intensity refining.
• Energy absorption
EW fibres are more flexible and collapsible due to their large lumen and thin cell wall.
As a result, in refining, they absorb more energy than LW fibres do [10]. A repetitive
cyclic compression test (Figure 4.9) [109], which is similar to the refming action,
indicated a rapid temperature rise in EW portion of the test specimen, confirming
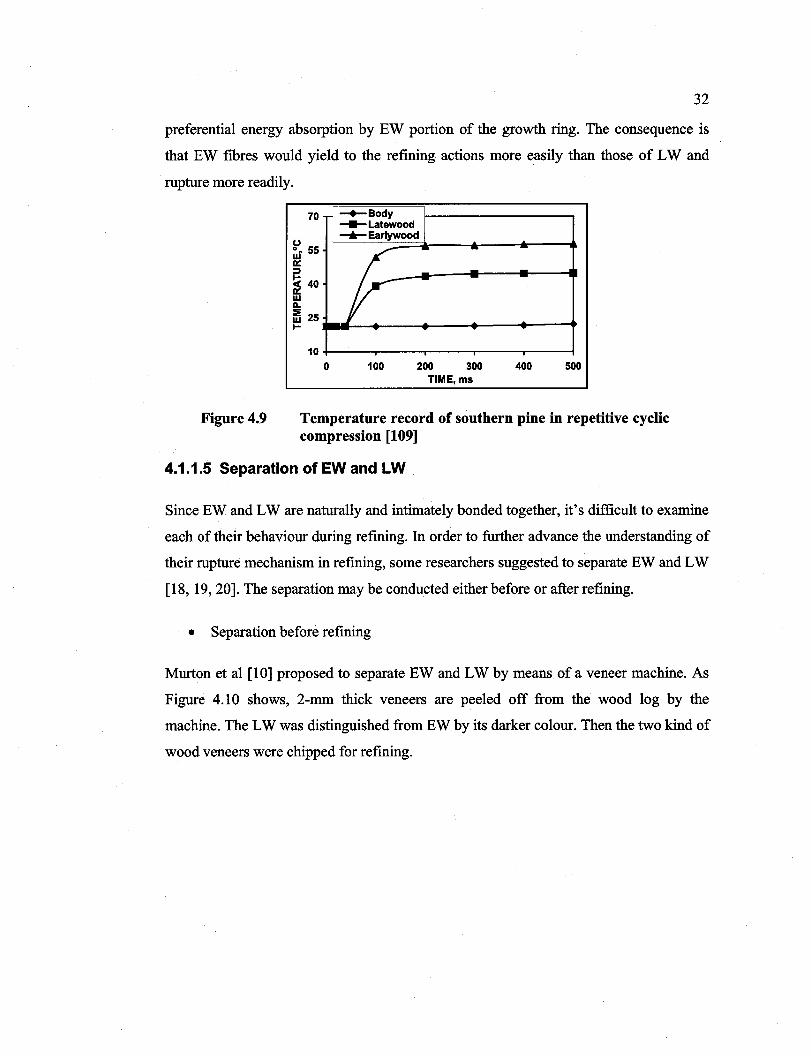
Reproduced with permission of the copyright owner. Further reproduction prohibited without permission.
32
preferential energy absorption by EW portion of the growth ring. The consequence is
that EW fibres would yield to the refining actions more easily than those of LW and
rupture more readily.
70 --'-Body _Latewood
~ 55 -+-Earlywood
_1 -w
0:: ;:) i 40
-w a.. 15 25 1-
10 0 100 200 300 400 500
TIME,ms
Figure 4.9 Temperature record of southern pine in repetitive cyclic compression [109]
4.1.1.5 Separation of EW and LW
Since EW and LW are naturally and intimately bonded together, it's difficult to examine
each of their behaviour during refining. In order to further advance the understanding of
their rupture mechanism in refining, sorne researchers suggested to separate EW and LW
[18, 19,20]. The separation may be conducted either before or after refining.
• Separation before refining
Murton et al [10] proposed to separate EW and LW by means of a veneer machine. As
Figure 4.10 shows, 2-mm thick veneers are peeled off from the wood log by the
machine. The LW was distinguished from EW by its darker colour. Then the two kind of
wood veneers were chipped for refining.
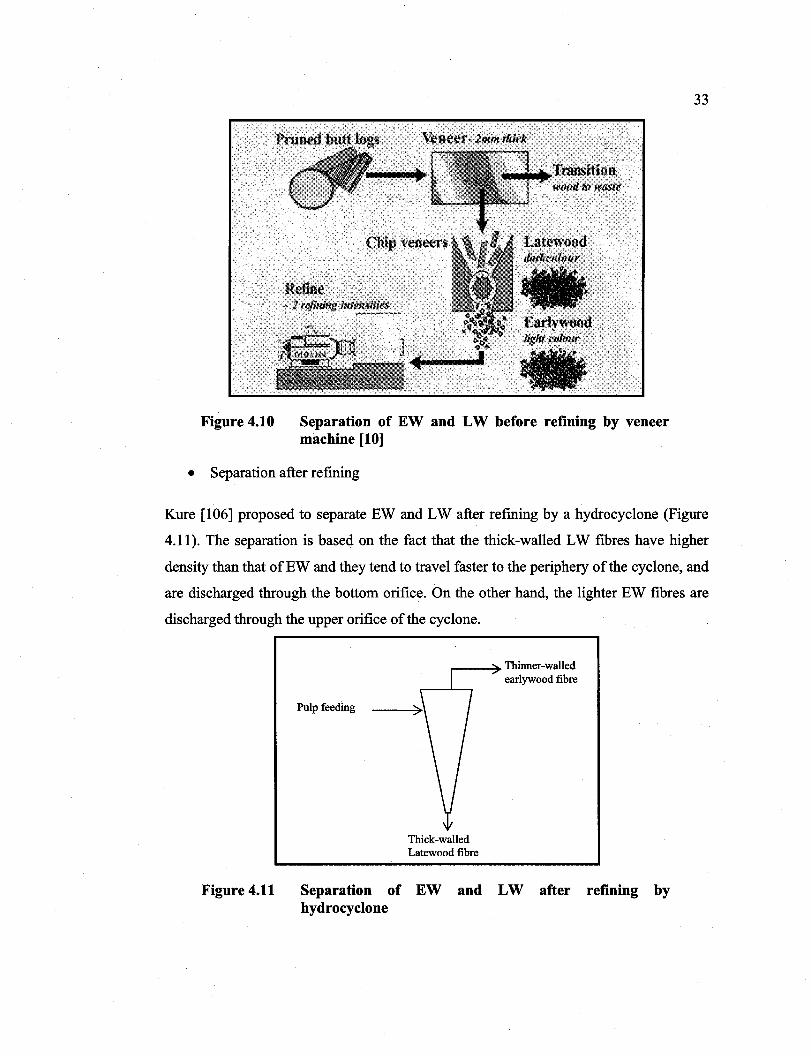
Reproduced with permission of the copyright owner. Further reproduction prohibited without permission.
Figure 4.10 Separation of EW and LW before refining by veneer machine [10]
• Separation after refining
33
Kure [106] proposed to separate EW and LW after refining by a hydrocyclone (Figure
4.11). The separation is based on the fact that the thick-walled LW fibres have higher
density than that ofEW and they tend to trave! faster to the periphery of the cyclone, and
are discharged through the bottom orifice. On the other hand, the lighter EW fibres are
discharged through the upper orifice of the cyclone .
Figure 4.11
Pulp feeding
.---_~ Thinner-walled
Thick-walled Latewood fibre
earlywood fibre
Separation of EW and LW after refining by hydrocyclone
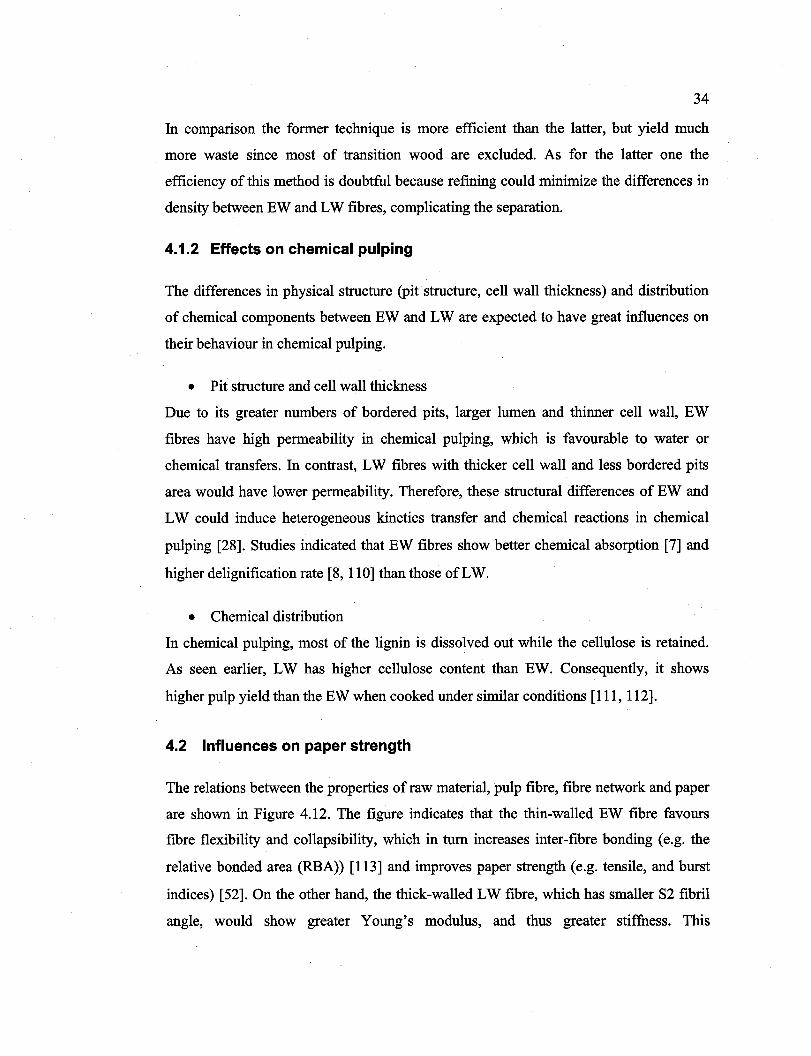
Reproduced with permission of the copyright owner. Further reproduction prohibited without permission.
34
In comparison the former technique is more efficient than the latter, but yield much
more waste since most of transition wood are excluded. As for the latter one the
efficiency of this method is doubtful because refining could minimize the differences in
density between EW and LW fibres, complicating the separation.
4.1.2 Effects on chemical pulping
The differences in physical structure (pit structure, cell wall thickness) and distribution
of chemical components between EW and LW are expected to have great influences on
their behaviour in chemical pulping.
• Pit structure and cell wall thickness
Due to its greater numbers of bordered pits, larger lumen and thinner cell wall, EW
fibres have high permeability in chemical pulping, which is favourable to water or
chemical transfers. In contrast, LW fibres with thicker cell wall and less bordered pits
area would have lower permeability. Therefore, these structural differences of EW and
LW could induce heterogeneous kinetics transfer and chemical reactions in chemical
pulping [28]. 8tudies indicated that EW fibres show better chemical absorption [7] and
higher delignification rate [8, 110] than those of LW.
• Chemical distribution
In chemical pulping, most of the lignin is dissolved out while the cellulose is retained.
As seen earlier, LW has higher cellulose content than EW. Consequently, it shows
higher pulp yield than the EW when cooked under similar conditions [111, 112].
4.2 Influences on paper strength
The relations between the properties of raw material, pulp fibre, fibre network and paper
are shown in Figure 4.12. The figure indicates that the thin-walled EW fibre favours
fibre flexibility and collapsibility, which in tum increases inter-fibre bonding (e.g. the
relative bonded area (RBA» [113] and improves paper strength (e.g. tensile, and burst
indices) [52]. On the other hand, the thick-walled LW fibre, which has smaller 82 fibril
angle, would show greater Young's modulus, and thus greater stiffness. This
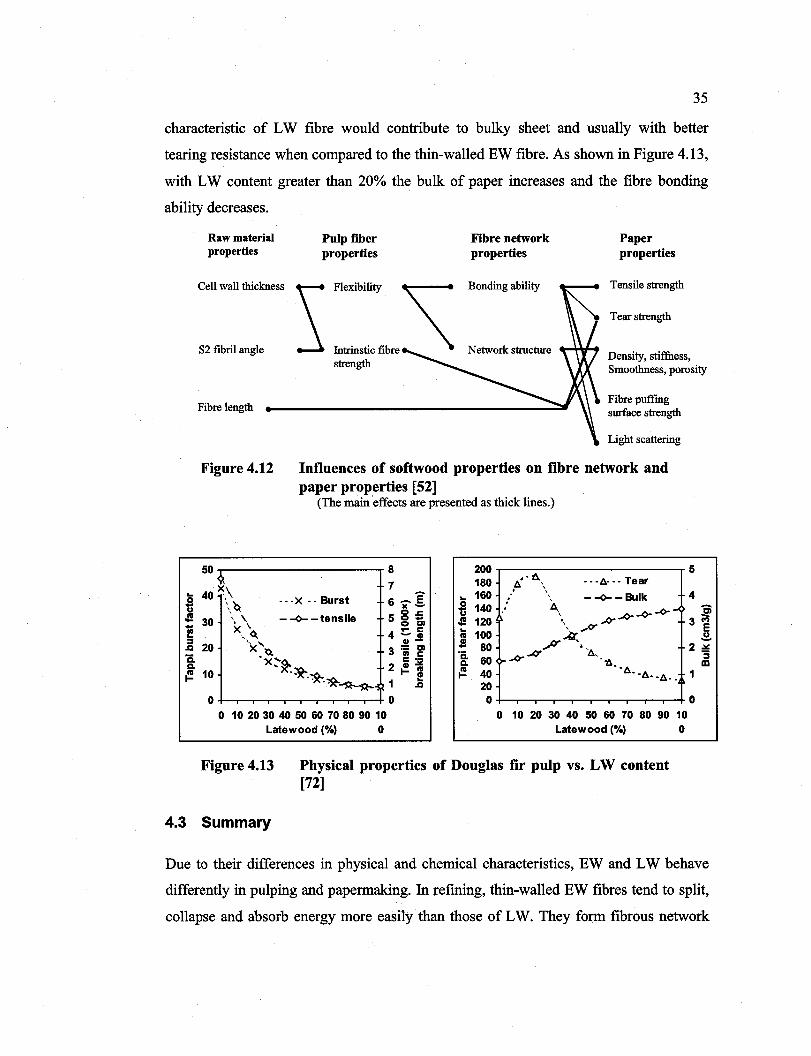
Reproduced with permission of the copyright owner. Further reproduction prohibited without permission.
35
characteristic of LW fibre would contribute to bulky sheet and usually with better
tearing resistance when compared to the thin-walled EW fibre. As shown in Figure 4.13,
with LW content greater than 20% the bulk of paper increases and the fibre bonding
ability decreases.
.. ~ J! -I!! ::1
..Q 'iS. a. ~
Raw material properties
Cell wall thickness
Pulp fiber properties
Flexibility
Fibre network properties
Bonding ability
Paper properties
Tensile strength
Tear strength
S2 fibril angle strength
N etwork structure ---"\-Yo .. Density, stiffiless, Smoothness, porosity
Fibre length
Figure 4.12
50 ~
40 ~.\ \~ ' , 30 . \ x, ~
20 'x'
Fibre puffmg surface strength
Light scattering
Influences of softwood properties on fibre network and paper properties [52]
(The main effects are presented as thick lines.)
8 200 180 .. ~ •• -D.- _. Tear 7 D. \
6- Ê 160 . \ ---x -- Burst .. . , - -<>- -Bulk
~ .
A" IC - 140 . h- -<>- -<>- ..... - -<>- -tensile 585 o CI J! 120 \ ,q-h
4::':ii .. 100 l'II ..a. ClI- S p-3 == CI 80 .~, III C ,~ ii 60 ).....<yh
'X ... ~ C .- ''6 2 CIl "" a. ' .~-~ l'II " D. 10 t- l'II 40 CIl t- ' -D., 'D. •• .. ~~ 1 15 20
0 0 0 0 10 20 30 40 50 60 70 80 90 10 0 10 20 30 40 50 60 70 80 90 10
Latewood (%) 0 Latewood (%) 0
Figure 4.13 Physical properties of Douglas fir pulp vs. LW content [72]
5
4 -~ 3 '" E ~
2 ::!!: ::1
ŒI 1
0
4.3 Summary
Due to their differences in physical and chemical characteristics, EW and LW behave
differently in pulping and papermaking. In refining, thin-walled EW fibres tend to split,
collapse and absorb energy more easily than those of LW. They form fibrous network

Reproduced with permission of the copyright owner. Further reproduction prohibited without permission.
36
with good strength properties. In contrast, the thick-walled LW fibres show greater
reduction in cell wall thickness in refining, producing sheets with high bulk and tearing
resistance.
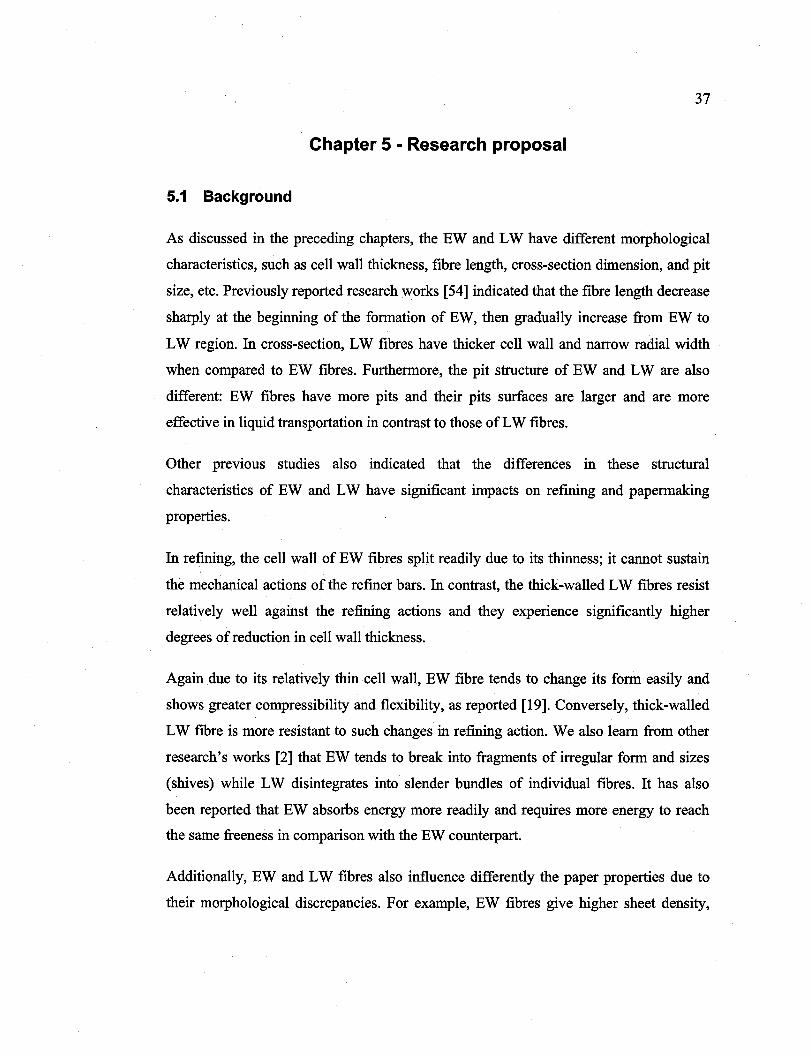
Reproduced with permission of the copyright owner. Further reproduction prohibited without permission.
37
Chapter 5 - Research proposai
5.1 Background
As discussed in the preceding chapters, the EW and LW have different morphological
characteristics, such as cell wall thickness, fibre length, cross-section dimension, and pit
size, etc. Previously reported research works [54] indicated that the fibre length decrease
sharply at the beginning of the formation of EW, then gradually increase from EW to
LW region. In cross-section, LW fibres have thicker cell wall and narrow radial width
when compared to EW fibres. Furthermore, the pit structure of EW and LW are also
different: EW fibres have more pits and their pits surfaces are larger and are more
effective in liquid transportation in contrast to those of LW fibres.
Other previous studies also indicated that the differences in these structural
characteristics of EW and LW have significant impacts on refining and papermaking
properties.
In refming, the cell wall of EW fibres split readily due to its thinness; it cannot sustain
the mechanical actions of the refiner bars. In contrast, the thick-walled LW fibres resist
relatively well against the refining actions and they experience significantly higher
degrees of reduction in cell wall thickness.
Again due to its relatively thincell wall, EW fibre tends to change its form easily and
shows greater compressibility and flexibility, as reported [19]. Conversely, thick-walled
LW fibre is more resistant to such changes in refining action. We also learn from other
research's works [2] that EW tends to break into fragments of irregular form and sizes
(shives) while LW disintegrates into slender bundles of individual fibres. It has also
been reported that EW absorbs energy more readily and requires more energy to reach
the same freeness in comparison with the EW counterpart.
Additionally, EW and LW fibres also influence differently the paper properties due to
their morphological discrepancies. For example, EW fibres give higher sheet density,
Reproduced with permission of the copyright owner. Further reproduction prohibited without permission.
38
tensile and burst strengths, while the stiffer LW fibres produce bulky sheet with high
surface roughness. However, LW fibres yield greater tearing resistances.
In spite of these findings, it remains unc1ear how these two types of wood tissue are
transformed from solid wood into individual fibrous elements and in what manner they
contribute to the sheet characteristics. We hope to shed sorne light on these aspects in
the present investigation. In fact, although sorne progresses have been made in the
understanding of the refining mechanism, there is little published information regarding
the breakdown mechanism of EW and LW in refining, especially in thermomechanical
refining. Their responses to various refining temperature, modes of rupture (inter-cell,
trans-wall and intra-wall), energy consumption, etc. are yet to be elucidated. Up to date,
little is known about the relations between the morphological changes of EW and LW in
refming and their influences on paper properties. In this study, systematic research
procedures are proposed, inc1uding the separation of EW and LW, thermomechanical
refming at various temperatures, and handsheet characterization. A series of physical
and chemical analyses are conducted in each experimental step. Evidently, with the
results obtained from this research, we could gain better understanding of the
mechanical failures of these two types of wood tissue and will also certainly help
improve the quality of the pulps produced from jack pine, an under-exploited and less
desirable species among the Canadian forest resources. The expected results would also
help us ameliorate the refming efficiency.
5.2 Objective and approaches
The principal objective of this research project is to study the breakdown mechanism of
EW and LW in thermomechanical pulping (TMP) by means of microscopic
observations. Characteristics such as fibre splitting, shortening, delamination (internaI
fibrillation) and external fibrillation will be evaluated. Physical changes in EW and LW
fibres will be qualified and quantified by means of light microscopy as well as scanning
electron microscopy. The impacts of the observed changes on pulp and paper properties
will be assessed to establish possible interrelation between the fibre characteristics and
paper properties.
Reproduced with permission of the copyright owner. Further reproduction prohibited without permission.
39
The main points of the study are as follows:
1. Identification of EW and LW pulp fibres according to their morphological
differences (cell wall thickness, pit size and pit distribution, lumen size, etc.);
2. Determination of chemical composition of EW and LW (e.g. cellulose,
hemicelluloses and lignin, etc.);
3. Evaluation of physical changes of EW and LW fibres in refining (e.g. fibre
splitting, cell wall delamination, length reduction, fines and shives contents,
etc.);
4. Measurements of sheet properties of EW and LW fibres (e.g. optical and
physical properties).
Several analyses are employed to characterize the physical properties of fibres and the
subsequent changes of fibre structure as a result of refining. The analyses inc1ude the
following aspects:
1) Morphological modifications: fibre separation modes, changes in fibre length,
width, pit structure, lumen area and cell wall thickness, cell wall splitting, fibre
collapsibility, and external fibrillation, etc.
2) Handsheet characteristics: density, tensile, burst, tear, TEA, stretch, light
scattering coefficient, roughness, porosity, etc. The results of these analyses will
be related to those of the microscopic analyses to establish possible interrelations
between the fibre characteristics and paper properties.
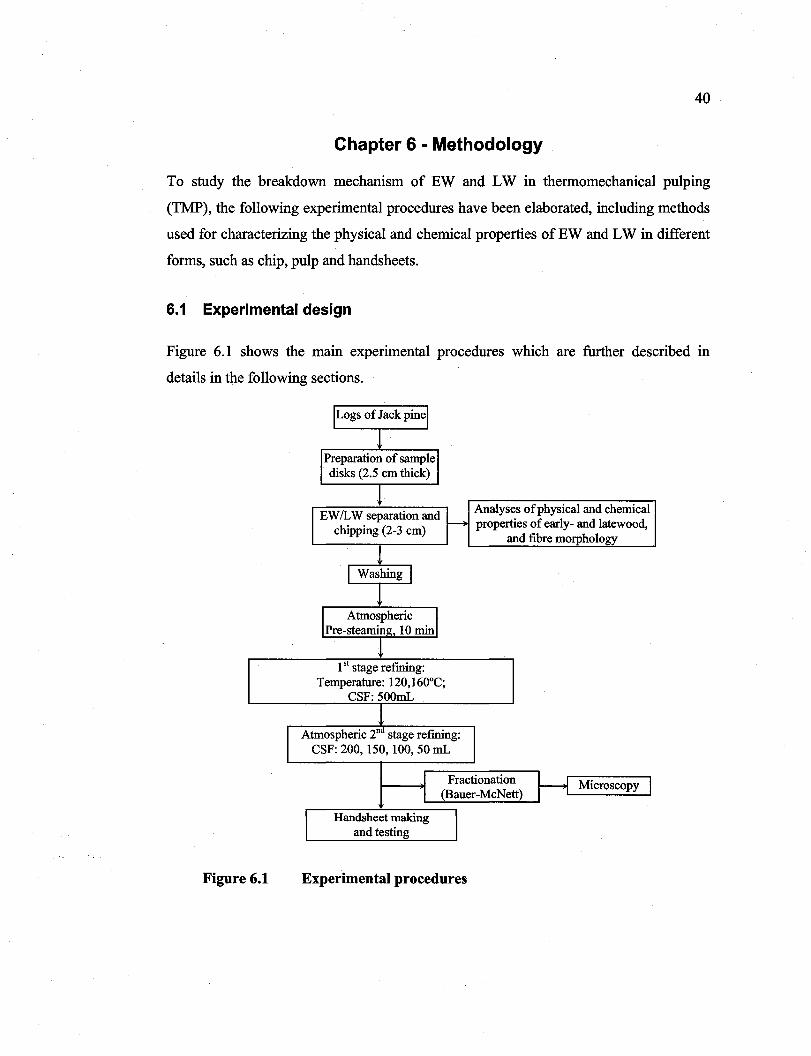
Reproduced with permission of the copyright owner. Further reproduction prohibited without permission.
40
Chapter 6 - Methodology
To study the break:down mechanism of EW and LW in thermomechanical pulping
(TMP), the following experimental procedures have been elaborated, inc1uding methods
used for characterizing the physical and chemical properties of EW and LW in different
forms, such as chip, pulp and handsheets.
6.1 Experimental design
Figure 6.1 shows the main experimental procedures which are further described in
details in the following sections.
Figure 6.1
1 st stage refming: Temperature: 120,160°C;
CSF: 500mL
Atmospheric 2n stage refming: CSF: 200, 150, 100,50 mL
Handsheet making and testing
Experimental procedures
Analyses of physical and chemical properties of early- and latewood,
and fibre morphology
Microscopy
Reproduced with permission of the copyright owner. Further reproduction prohibited without permission.
41
6.2 Material and preparation
Logs of freshly felled jack pine (Pinus banksiana Lam.) were used in this work. The
jack pine trees were taken from a 30-years old plantation in St. Maurice region of
Quebec. The logs were sawn into disks of about 2.5 cm thick in longitudinal direction.
The disks were then debarked manually by means of a chisel. Chips were prepared from
the sapwood portion, exc1uding the heartwood to minimize the possible effects of its
high extractives content on pulp properties. The chips of EW and LW, approximately 2-
3 cm in width and length, were also prepared manually using a chisel. The thickness of
the chips varied depending on the width of the growth rings and the proportion of EW
and LW in the growth increment. The separation of EW from LW was based on the
difference in colour: LW in jack pine was relatively broad and much darker than the EW
counterpart.
6.3 Physical and chemical characterization of raw material
Sorne optical, physical and chemical analyses were conducted for EW and LW chips,
inc1uding basic density, lignin, holocelluloses, extractives and ash content.
6.3.1 Basic density
As discussed in the previous chapter, generally, LW has higher basic density in contrast
to EW due to its thicker fibre cell wall. In this study, the basic density (weight
o.d./volume) of the chips was measured following the Tappi method T258 om-02. In this
method, the volume of the water-saturated samples is determined by water displacement
technique and the weight is oven-dry weight of samples. Basic density can be expressed
in the same terms as bulk density (TAPPI UM 23 "Bulk density of wood chips").
6.3.2 Chemical analysis
In this study, the chemical composition (e.g. lignin, holocelluloses, 1% NaOH solubility,
dichloromethane extractives and ash) of EW and LW chips were determined following
the Tappi test methods (Table 6.1)
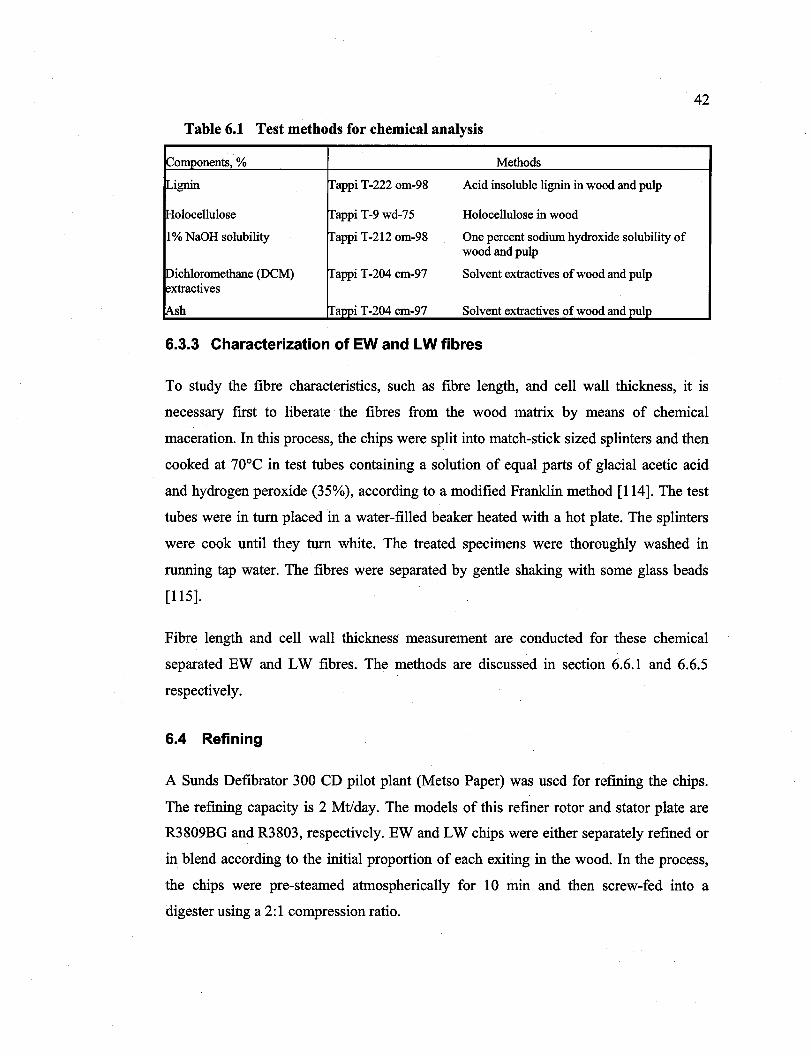
Reproduced with permission of the copyright owner. Further reproduction prohibited without permission.
42
Table 6.1 Test methods for chemical analysis
~omponents, % Methods
fLignin Tappi T -222 om-98 Acid insoluble lignin in wood and pulp
~olocellulose Tappi T-9 wd-75 Holocellulose in wood
1% NaOH solubility Tappi T-212 om-98 One percent sodium hydroxide solubility of wood and pulp
Pichloromethane (DCM) ~appi T -204 cm-97 Solvent extractives of wood and pulp ~xtractives
Ash ~appi T-204 cm-97 Solvent extractives of wood and pulp
6.3.3 Characterization of EW and LW fibres
To study the fibre characteristics, such as fibre length, and cell wall thickness, it is
necessary frrst to liberate the fibres from the wood matrix by means of chemical
maceration. In this process, the chips were split into match-stick sized splinters and then
cooked at 70°C in test tubes containing a solution of equal parts of glacial acetic acid
and hydrogen peroxide (35%), according to a modified Franklin method [114]. The test
tubes were in turn placed in a water-filled beaker heated with a hot plate. The splinters
were cook until they turn white. The treated specimens were thoroughly washed in
running tap water. The fibres were separated by gentle shaking with sorne glass beads
[115].
Fibre length and cell wall thickness measurement are conducted for these chemical
separated EW and LW fibres. The methods are discussed in section 6.6.1 and 6.6.5
respectively.
6.4 Refining
A Sunds Defibrator 300 CD pilot plant (Metso Paper) was used for refining the chips.
The refining capacity is 2 Mt/day. The models of this refiner rotor and stator plate are
R3809BG and R3803, respectively. EW and LW chips were either separately refined or
in blend according to the initial proportion of each exiting in the wood. In the process,
the chips were pre-steamed atmospherically for 10 min and then screw-fed into a
digester using a 2: 1 compression ratio.
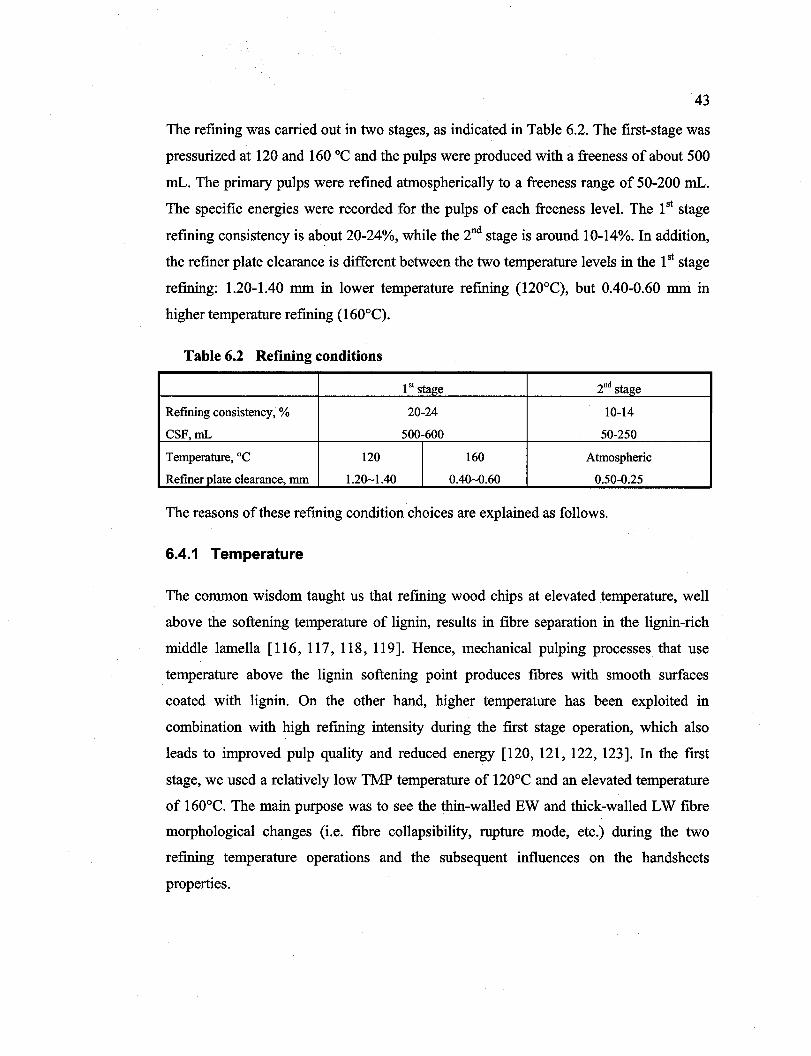
Reproduced with permission of the copyright owner. Further reproduction prohibited without permission.
43
The refining was carried out in two stages, as indicated in Table 6.2. The first-stage was
pressurized at 120 and 160 oC and the pulps were produced with a freeness of about 500
mL. The primary pulps were refmed atmospherically to a freeness range of 50-200 mL.
The specifie energies were recorded for the pulps of each freeness level. The 1 st stage
refming consistency is about 20-24%, while the 2nd stage is around 10-14%. In addition,
the refiner plate clearance is different between the two temperature levels in the 1 st stage
refining: 1.20-1.40 mm in lower temperature refming (120°C), but 0.40-0.60 mm in
higher temperature refining (160°C).
Table 6.2 Refining conditions
1 st stage 2nd stage
Refining consistency, % 20-24 10-14
CSF,mL 500-600 50-250
Temperature, oC 120 160 Atmospheric
Refiner plate clearance, mm l.20~1.40 0.40~.60 0.50-0.25
The reasons of these refining condition choices are explained as follows.
6.4.1 Temperature
The common wisdom taught us that refining wood chips at elevated temperature, well
above the softening temperature of lignin, results in fibre separation in the lignin-rich
middle lamella [116, 117, 118, 119]. Hence, mechanical pulping processes that use
temperature above the lignin softening point pro duces fibres with smooth surfaces
coated with lignin. On the other hand, higher temperature has been exploited in
combination with high refming intensity during the first stage operation, which also
leads to improved pulp quality and reduced energy [120, 121, 122, 123]. In the first
stage, we used a relatively low TMP temperature of 120°C and an elevated temperature
of 160°C. The main purpose was to see the thin-walled EW and thick-walled LW fibre
morphological changes (i.e. fibre collapsibility, rupture mode, etc.) during the two
refming temperature operations and the subsequent influences on the handsheets
properties.
Reproduced with permission of the copyright owner. Further reproduction prohibited without permission.
44
6.4.2 Consistency
Alami et al [92] showed that, ideally, a refining system should operate within a
consistency range of 45-50%. This condition will provide the maximum energy saving
while producing high quality pulp with minimum dependence on consistency variations.
It is reported [92, 124] that using high consistency in the fist refming stage could
efficiently break down the material and separate the fibres. In this study, due to the
restrictions of operation, the refming consistency is much higher in 1 st stage (20-24%) to
facilitate the fibre separation. In the 2nd refming stage, the consistency is relatively lower
(10-14%).
6.4.3 Refiner plate gap clearance
It has to be noted that in the fIfSt stage, the refmer plate gap clearance in the high
temperature (1600 e, 0.40~0.60 mm) operation is reduced to more than 1/2 ofthat in the
low temperature operation (1200 e, 1.20~ 1.40 mm). During the high temperature
operation, due to the high refining pressure, the fibres are more flexible and collapsible
when compared with those in low temperature operation. In order to get the same
freeness as that in low temperature operation, it is necessary to reduce the refiner plate
clearance during the high temperature operation.
The reduced refiner plate gap clearance will bring sorne changes on the refining actions.
As discovered by Law [125], there are two major forces in refining: shear and
compression. Illustratively, when two refiner bars cross each other, the wood matrix or
fibre mass is subjected to a major shear force and minor compression force, as indicated
in Figure 6.2. These two mechanical actions occur simultaneously, as shown in Figure
6.3, the refining action of shear increase with increasing compression. Evidently, the
reduced refmer plate gap increases both shear and compression forces.

Reproduced with permission of the copyright owner. Further reproduction prohibited without permission.
Figure 6.2
Figure 6.3
Rotor bar
~Shear
Stator bar
'41 Compression
;t\
Refinin actions on wood matrix
Shear
Refining action
Compression
Combined action of shear and compression
6.5 Fractionation of pulps
45
The experimental second-stage pulps were fractionated in a Bauer-McNett classifier to
obtain 6 fractions denoted as R14, R28, R48, RIOO, R200 and P200 (fmes).
The Bauer-McNett fibre classification is a commonly used method to characterize the
fibre length distribution of mechanical pulps. The fibres in different Bauer-McNett
fraction are morphologically different and have different effects on the paper properties.
For example, the Rl4 fraction contains long and stiff fibres which have poor bonding
characteristics. The fmes (P200) fraction comprises flak:e-like particles and fibrils, which
would strengthen the fibre network. Based on these reasons, it is necessary to fractionate
the pulps before the characterization.
Reproduced with permission of the copyright owner. Further reproduction prohibited without permission.
46
6.6 Pulp characterization
Each fibre fraction was characterized in terms of cell wall rupture modes (e.g. inter-cell,
trans-wall, and intra-wall failures), cell wall peeling, fibre breakage, fibre wall splitting,
external fibrillation and collapsibility. These analyses were conducted by means of
microscopic analysis, including optical and electronic microscopic analysis.
Meanwhile, specific volume (SV) and water retention value (WRV) of pulp fibres were
determined as described in sections 6.6.3 and 6.6.4 respectively.
The fibre length and coarseness, curl index, kink index were measured by means of a
FQA (Optest Equipment).
Shives content was determined using aPulmac shive analyzer (Pulmac II, MasterScreen)
while the fines content was obtained from the Bauer-McNett classifier.
6.6.1 FQA analysis
The Fibre Quality Analyzer (FQA, OpTest Equipment Inc.) employed in this study is an
optical device used to measure the fibre length, fibre coarseness, fibre curl and kink
index, etc. It uses circular polarized light to project images of the fibres in the sample to
gain information on fibre length and contour. As the fibre joins the water sheaths and
passes through the optics box, a digital camera takes pictures of the fibre projections, as
showed in Figure 6.4.
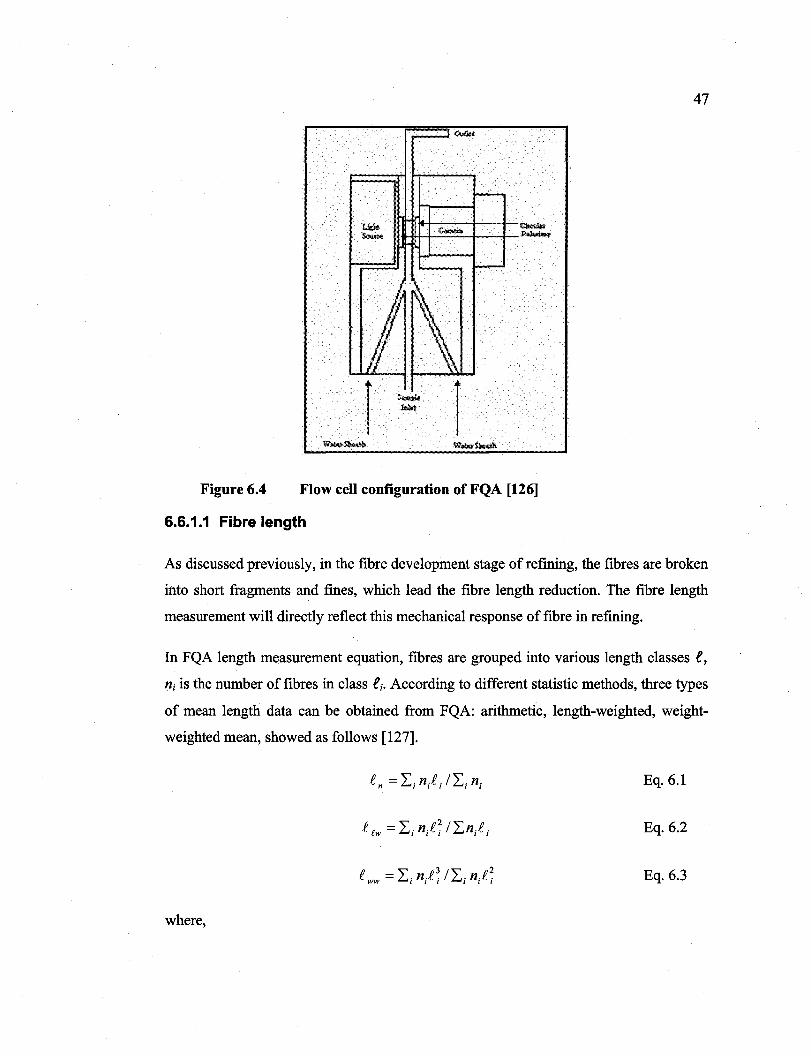
Reproduced with permission of the copyright owner. Further reproduction prohibited without permission.
i'f-t--:-----ct---t--ç ...... +-+--'---'-+--I-~.
Figure 6.4 Flow cell configuration of FQA [126J
6.6.1.1 Fibre length
47
As discussed previously, in the fibre development stage of refining, the fibres are broken
into short fragments and fines, which lead the fibre length reduction. The fibre length
measurement will directly reflect this mechanical response of fibre in refining.
In FQA length measurement equation, fibres are grouped into various length classes l,
ni is the number of fibres in class li. According to different statistic methods, three types
of mean length data can be obtained from FQA: arithmetic, length-weighted, weight
weighted mean, showed as follows [127].
Eq.6.1
Eq.6.2
Eq.6.3
where,
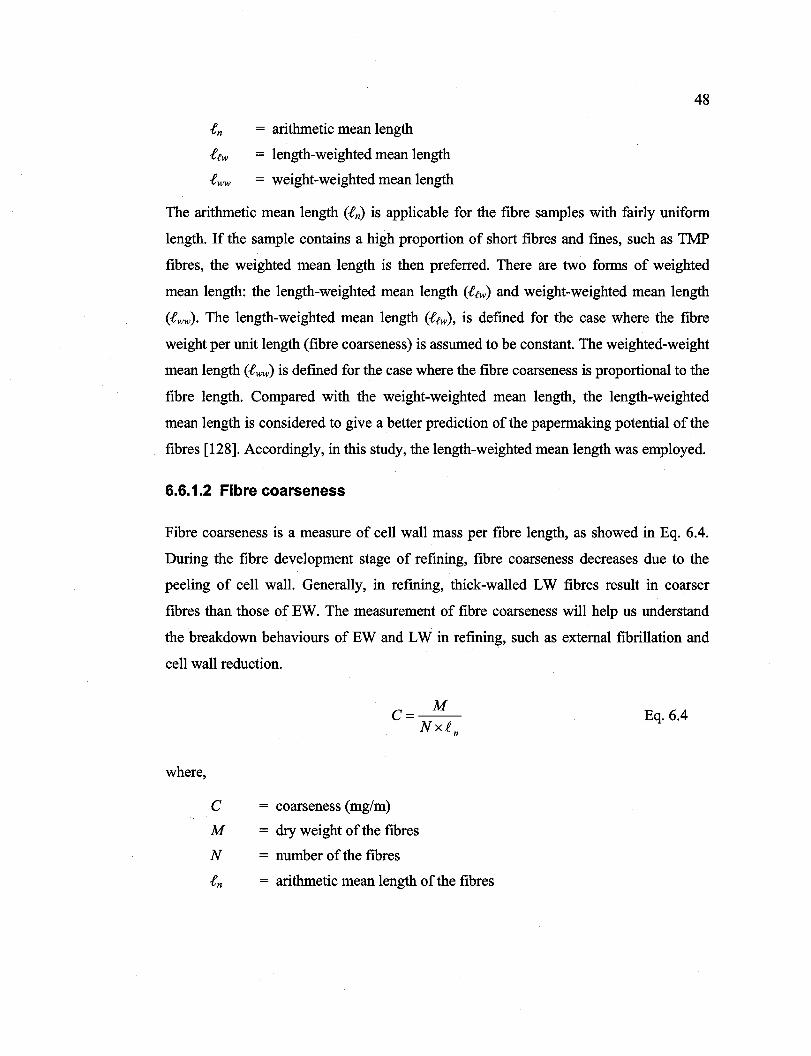
Reproduced with permission of the copyright owner. Further reproduction prohibited without permission.
48
ln = arithmetic mean length
ltw = length-weighted mean length
lww = weight-weighted mean length
The arithmetic mean length (ln) is applicable for the fibre samples with fairly uniform
length. If the sample contains a high proportion of short fibres and fmes, such as TMP
fibres, the weighted mean length is then preferred. There are two forms of weighted
mean length: the length-weighted mean length (lew) and weight-weighted mean length
(lww). The length-weighted mean length (ltw) , is detined for the case where the fibre
weight per unit length (fibre coarseness) is assumed to be constant. The weighted-weight
mean length (lww) is defmed for the case where the fibre coarseness is proportional to the
fibre length. Compared with the weight-weighted mean length, the length-weighted
mean length is considered to give a better prediction of the papermaking potential of the
fibres [128]. Accordingly, in this study, the length-weighted mean length was employed.
6.6.1.2 Fibre coarseness
Fibre coarseness is a measure of cell wall mass per fibre length, as showed in Eq. 6.4.
During the fibre development stage of refming, fibre coarseness decreases due to the
peeling of cell wall. Generally, in refining, thick-walled LW fibres result in coarser
fibres than those of EW. The measurement of fibre coarseness will help us understand
the breakdown behaviours of EW and LW in refining, such as external fibrillation and
cell wall reduction.
Eq.6.4
where,
C = coarseness (mg/m)
M = dry weight of the fibres
N = number of the fibres
ln = arithmetic mean length of the fibres
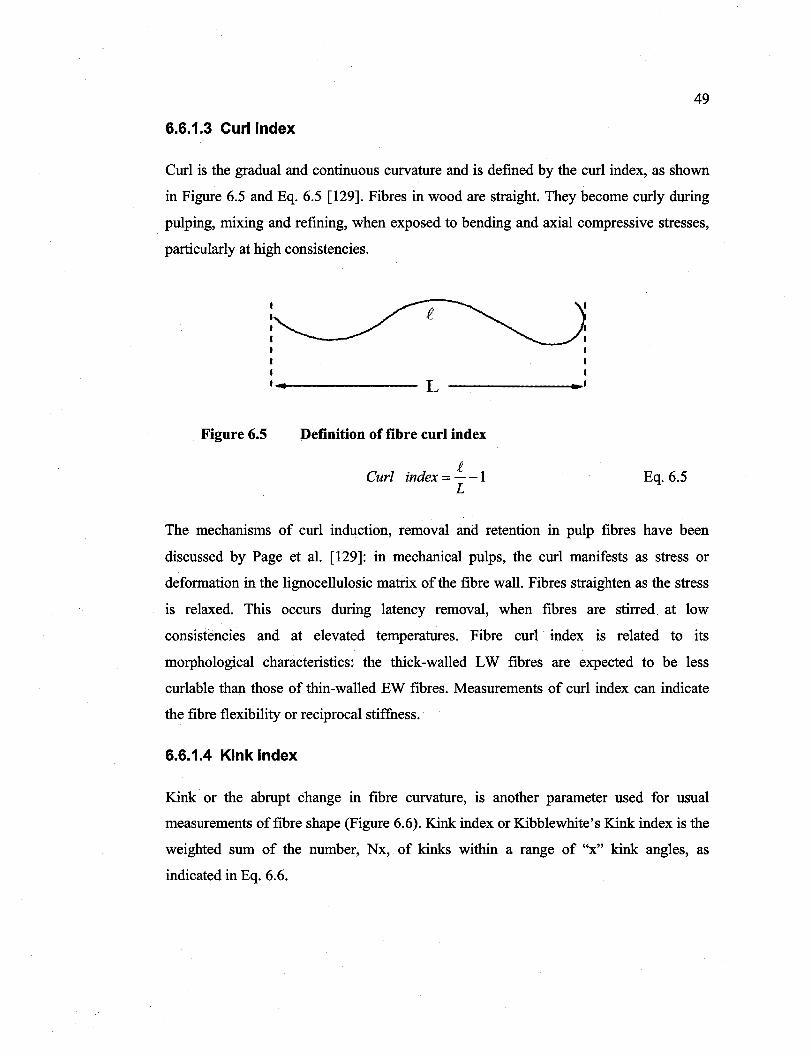
Reproduced with permission of the copyright owner. Further reproduction prohibited without permission.
49
6.6.1.3 Curl index
Curl is the graduaI and continuous curvature and is defined by the curl index, as shown
in Figure 6.5 and Eq. 6.5 [129]. Fibres in wood are straight. They become curly during
pulping, mixing and refining, when exposed to bending and axial compressive stresses,
particularly at high consistencies.
Figure 6.5
,~.~------------- L
Definition of fibre curl index
Curt index = i-l L
.'
Eq.6.5
The mechanisms of curl induction, removal and retention in pulp fibres have been
discussed by Page et al. [129]: in mechanical pulps, the curl manifests as stress or
deformation in the lignocellulosic matrix of the fibre wall. Fibres straighten as the stress
is relaxed. This occurs during latency removal, when fibres are stirred at low
consistencies and at elevated temperatures. Fibre curl index is related to its
morphological characteristics: the thick-walled LW fibres are expected to be less
curlable than those of thin-walled EW fibres. Measurements of curl index can indicate
the fibre flexibility or reciprocal stiffuess.
6.6.1.4 Kink index
Kink or the abrupt change in fibre curvature, is another parameter used for usual
measurements offibre shape (Figure 6.6). Kink index or Kibblewhite's Kink index is the
weighted sum of the number, Nx, of kinks within a range of "x" kink angles, as
indicated in Eq. 6.6.
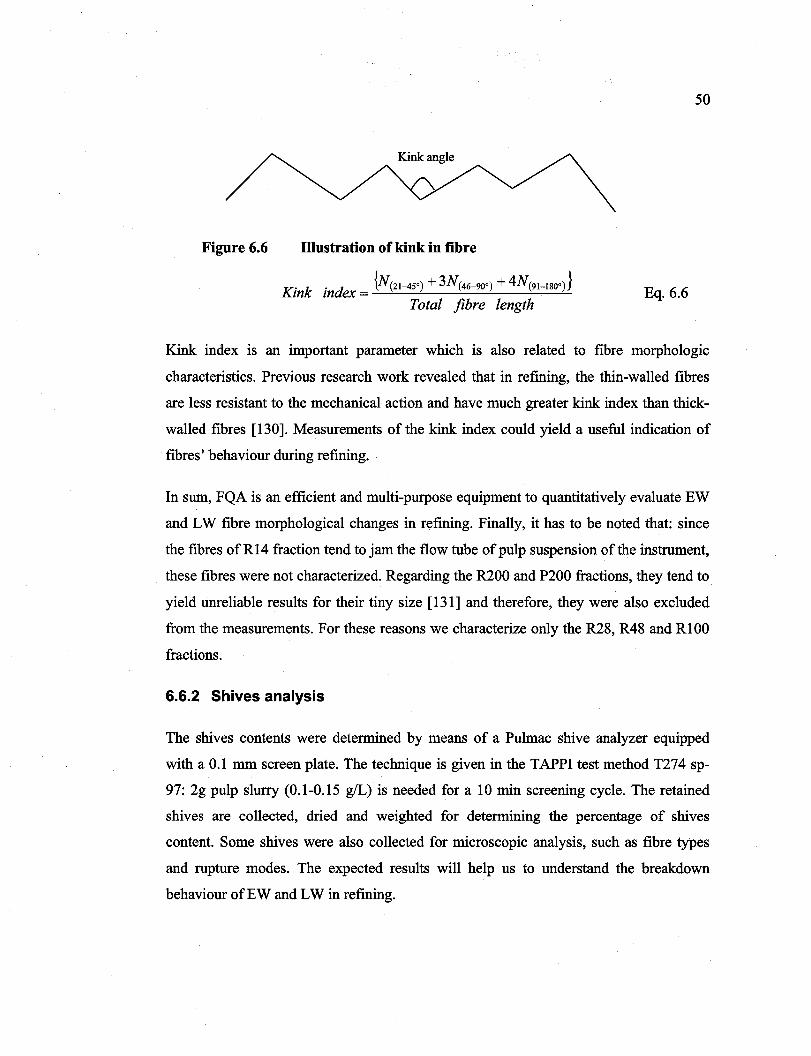
Reproduced with permission of the copyright owner. Further reproduction prohibited without permission.
50
Figure 6.6 Illustration of kink in fibre
.. {N(21_450 ) + 3N(46_900 ) + 4N(91_1800 )} Kmk mdex = --'---'------'----'------'----'---'""'-Total fibre length
Eq.6.6
Kink index is an important parameter which is also related to fibre morphologic
characteristics. Previous research work revealed that in refining, the thin-walled fibres
are less resistant to the mechanical action and have much greater kink index than thick
walled fibres [130]. Measurements of the kink index could yield a useful indication of
fibres' behaviour during refining.
In sum, FQA is an efficient and multi-purpose equipment to quantitative1y evaluate EW
and LW fibre morphological changes in refining. Finally, it has to be noted that: since
the fibres ofR14 fraction tend to jam the flow tube ofpulp suspension of the instrument,
these fibres were not characterized. Regarding the R200 and P200 fractions, they tend to
yield unreliable results for their tiny size [131] and therefore, they were also excluded
from the measurements. For these reasons we characterize only the R28, R48and RIOO
fractions.
6.6.2 Shives analysis
The shives contents were determined by means of a Pulmac shive analyzer equipped
with a 0.1 mm screen plate. The technique is given in the TAPPI test method T274 sp-
97: 2g pulp slurry (0.1-0.15 g/L) is needed for a 10 min screening cycle. The retained
shives are cOllected, dried and weighted for determining the percentage of shives
content. Sorne shives were also collected for microscopic analysis, such as fibre types
and rupture modes. The expected results will help us to understand the breakdown
behaviour ofEW and LW in refming.
Reproduced with permission of the copyright owner. Further reproduction prohibited without permission.
51
6.6.3 Specifie volume (SV) analysis of fines by sedimentation
The quality of the fines is an important characteristic and it can be qualified by the SV of
these partic1es. The mechanical pulp fines consist of three types of partic1es: fibril and
flake-like elements, and ray cells. The fibrils consist of cellulose-rich material with a
high specific surface area (volume), while the flakes are lignin-rich cell outer layer of
cell (e.g. the compound middle lamella) with low surface area [132, 133]. EW and LW
are morphologically different, thus under refming actions, they could produce different
sizes of partic1es in the fmes and yield different SV values. The SV analysis of fines will
provide information of EW and LW breakdown in refming, especially in the
morphological changes in the fines fraction. As described by Marton et al. [133] and
Luukko [134], the SV analysis of fines could be divided into two steps: fmes collection
and SV measurement, as showed in Figure 6.7.
6.6.3.1 Fines collection
The fines were collected by passing the pulp suspension (0.2-0.3 %) through a 200-mesh
wire in a 2-litre Dynamic Draining Jar (DDJ). The pulp suspension was preparèd as
following: 10 g pulp was disintegrated at 1.2% consistency in hot (90°C) demineralised
water for 5 min (about 3530 rev.) in a British disintegrator to remove latency. The pulp
was then diluted to 0.2-0.3% consistency with demineralised water. Due to the volume
limit of DDJ, the 10 g diluted pulp was divided into several batches for the fines
collection; each batch consisted of 1500 mL of pulp suspension. During the separation,
the pulps are firstly agitated (1000 rpm) in DDJ for 2 min with the bottom valve c1osed.
After that, the bottom valve was opened to let pass the fines which was collected from
the filtrate. The filtrate was then placed in a graduated cylinder and kept still for 24
hours, after which the supematant was decanted by siphoning. The concentrated fines
suspension was then centrifuged (6000 rpm) for 5 min to increase its consistency to 0.4-
0.5 %. The condensed fmes suspension was for SV measurement.
Reproduced with permission of the copyright owner. Further reproduction prohibited without permission.
52
6.6.3.2 SV measurement
Since the fmes suspension is colloidal, sorne effect of possible flocculation could take
place in the suspension, influencing the settling. To prevent the occurrence of
flocculation, the metal ions and pH of the suspensions should be strictly controlled
[133]. In this work, 50 mL of fines suspension was firstly mixed with a solution
containing Na2S04 120 mg/L and CaCh 30 mglL (mixing volume ratio: 1 :2) to
equilibrate the ions content and then pH was adjusted to 6-6.5. A 1 glL NaOH and 1 g/L
HCl were employed for the pH adjustment. After that, the treated fibre (or fines)
suspension was transferred to a 100 mL graduated glass cylinder, and the surplus was
discharged. Before the settling test, the air in the suspension was removed by a vacuum
pump for 10 min. After the air removal stage, the cylinder was sealed by a parafilm and
manually well shaken to disperse the suspension. After that, this suspension was kept
still for 24 hours, after which the volume of the settled fines was read (accuracy ±1 mL).
And then, this suspension was filtered to recovery the fines. The mass of fines was
obtained by drying at 105 oC; the weight of the recovered fmes is needed to determine
the SV value. The SV was calculated as shown in Eq. 6.7. Three replieates were taken
for determining the average value of SV.
where
sv = specifie volume
V SV(cm 3
/ g) =-W
V = volume of fine suspension
W = oven dry weight of recovered fmes
Eq.6.7
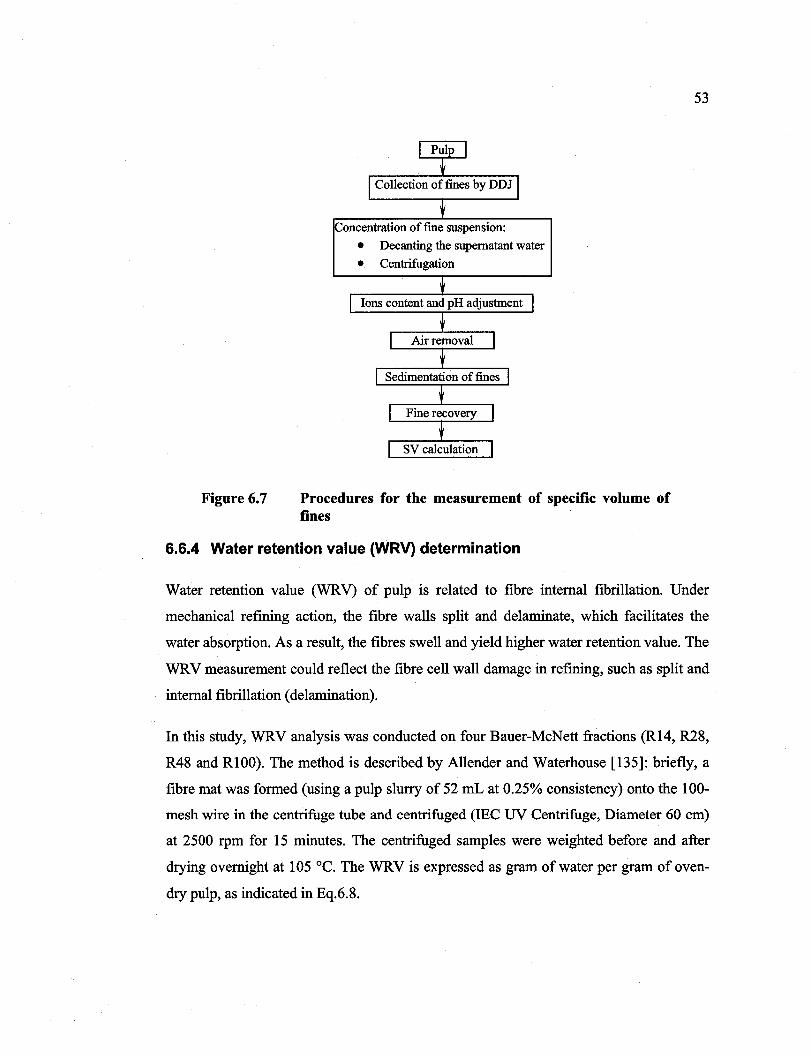
Reproduced with permission of the copyright owner. Further reproduction prohibited without permission.
Figure 6.7
oncentration of fme suspension:
• Decanting the supernatant water
• CennifUgation
Ions content and pH adjustment
Procedures for the measurement of specifie volume of fines
6.6.4 Water retention value (WRV) determination
53
Water retenti on value (WRV) of pulp is related to fibre internaI fibrillation. Under
mechanical refining action, the fibre walls split and delaminate, which facilitates the
water absorption. As a result, the fibres swell and yield higher water retention value. The
WRV measurement could reflect the fibre cell wall damage in refining, such as split and
internaI fibrillation (delamination).
In this study, WRV analysis was conducted on four Bauer-McNett fractions (RI4, R28,
R48 and RIOO). The method is described by Allender and Waterhouse [135]: briefly, a
fibre mat was formed (using a pulp slurry of 52 mL at 0.25% consistency) onto the 100-
mesh wire in the centrifuge tube and centrifuged (IEC UV Centrifuge, Diameter 60 cm)
at 2500 rpm for 15 minutes. The centrifuged samples were weighted before and after
drying overnight at 105 oC. The WRV is expressed as gram of water per gram of oven
dry pulp, as indicated in Eq.6.8.
Reproduced with permission of the copyright owner. Further reproduction prohibited without permission.
Water retention value = _W_l_-_W_2
where,
Wl = sample weight before drying
W2 = sample weight after drying
6.6.5 Cell wall thickness measurement
W2
54
Eq.6.8
Cell wall thickness is an important morphological characteristic which is related to the
fibre's stiffness or its ability of inter-fibre bonding. The measurement of cell wall
thickness also provides us with the information on the mechanical response of fibres in
refming. In this study, the cell wall thickness was measured by means of a MorFi cell
wall thickness analyzer (Techpap, France) [136]. This instrument, an independent table
unit, has two major parts: hydraulic part and e1ectrical part. The hydraulic component
inc1udes a pulp sampling system, a pump, circuits and valves, a measuring cell and a
camera equipped with a microscope having a resolution of 0.5 /Jm. The electric
component integrates mainly the electrical supplies, relays and a PC (Figure 6.8).
In the process of the measurement, a sample of 0.01 g/L was poured into a sample
beaker of 500 mL and the fibres are dispersed mechanically by an agitator. The
dispersed fibre suspension was then pumped through a measuring cell where a camera
grabs the fibre's microscopic image. Image analysis software calculates the average cell
wall thickness and pro duces a thickness distribution chart.
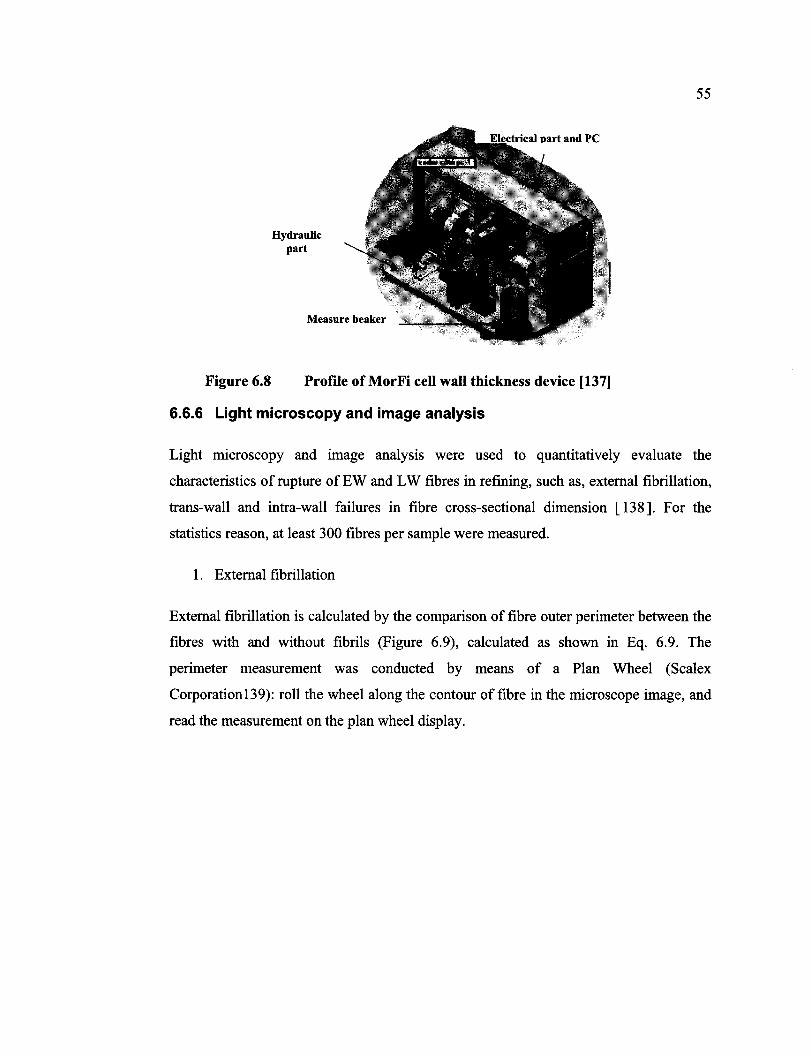
Reproduced with permission of the copyright owner. Further reproduction prohibited without permission.
Figure 6.8
Hydraulic part
Measure beaker
Profile of MorFi cell wall thickness device [137J
6.6.6 Light microscopy and image analysis
55
Light microscopy and image analysis were used to quantitatively evaluate the
characteristics of rupture of EW and LW fibres in refming, such as, external fibrillation,
trans-wall and intra-wall failures in fibre cross-sectional dimension [138]. For the
statistics reason, at least 300 fibres per sample were measured.
1. External fibrillation
External fibrillation is calculated by the comparison of fibre outer perimeter between the
fibres with and without fibrils (Figure 6.9), calculated as shown in Eq. 6.9. The
perimeter measurement was conducted by means of a Plan Whee1 (Scalex
Corporation 139): roll the wheel along the contour of fibre in the microscope image, and
read the measurement on the plan wheel display.
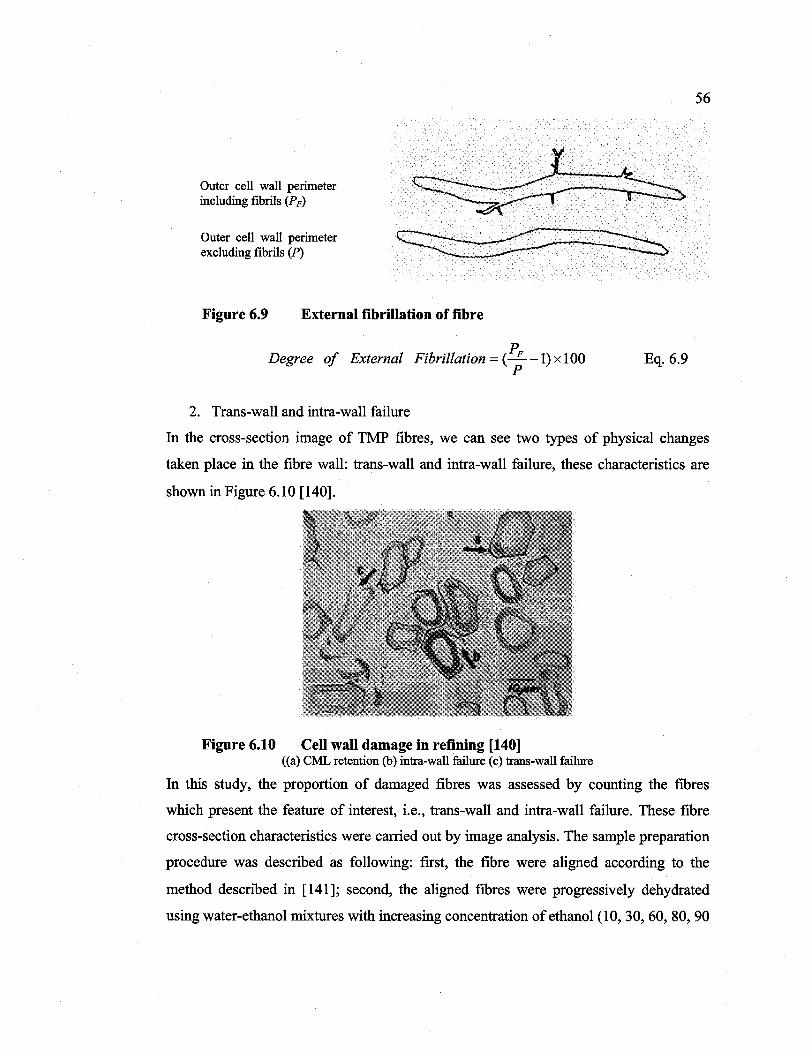
Reproduced with permission of the copyright owner. Further reproduction prohibited without permission.
Outer cell wall perimeter inciuding fibriis (PF)
Outer cell wall perimeter exciuding fibriis (P)
Figure 6.9 External fibrillation of fibre
p Degree of Externat Fibrillation = (-L -1) x 100
P
2. Trans-wall and intra-wall failure
56
Eq.6.9
In the cross-section image of TMP fibres, we can see two types of physical changes
taken place in the fibre wall: trans-wall and intra-wall failure, these characteristics are
shown in Figure 6.10 [140].
Figure 6.10 Cell wall damage in refining [140] «a) CML retention (b) intra-wall failure (c) trans-wall failure
In this study, the proportion of damaged fibres was assessed by counting the fibres
which present the feature of interest, i.e., trans-wall and intra-wall failure. These fibre
cross-section characteristics were carried out by image analysis. The sample preparation
procedure was described as following: frrst, the fibre were aligned according to the
method described in [141]; second, the aligned fibres were progressively dehydrated
using water-ethanol mixtures with increasing concentration of ethanol (10, 30, 60, 80, 90
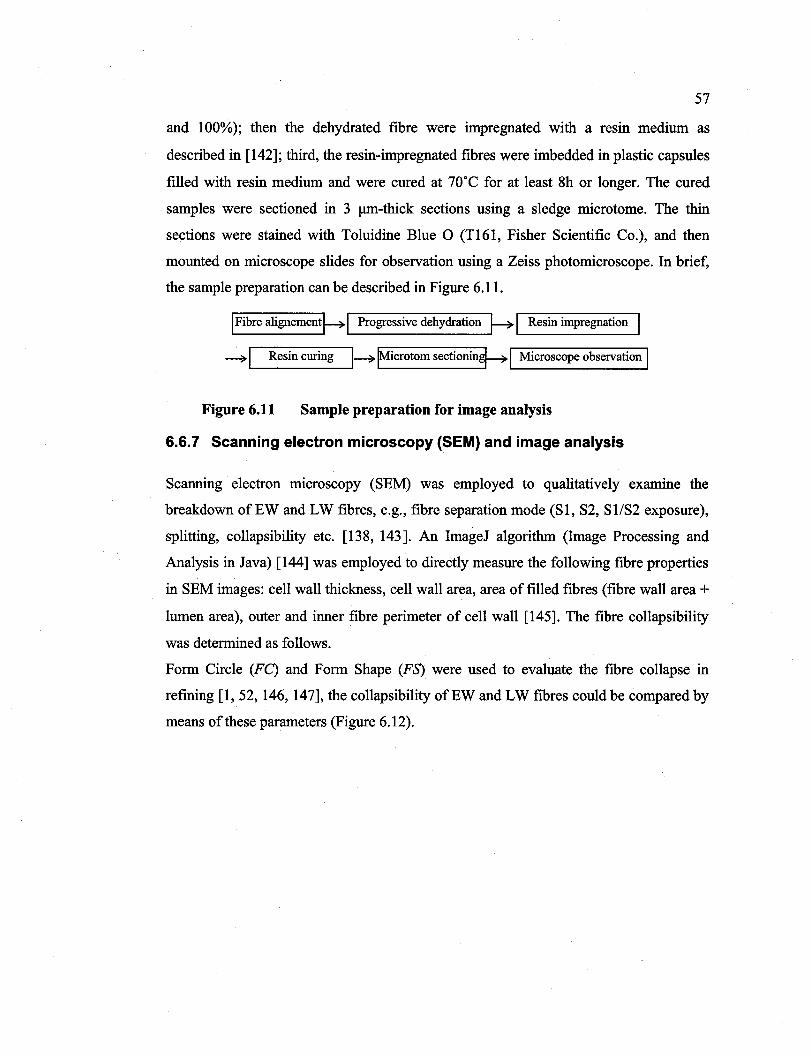
Reproduced with permission of the copyright owner. Further reproduction prohibited without permission.
57
and 100%); then the dehydrated fibre were impregnated with a resin medium as
described in [142]; third, the resin-impregnated fibres were imbedded in plastic capsules
filled with resin medium and were cured at 70°C for at least 8h or longer. The cured
samples were sectioned in 3 J.Ull-thick sections using a sledge microtome. The thin
sections were stained with Toluidine Blue 0 (TI61, Fisher Scientific Co.), and then
mounted on microscope slides for observation using a Zeiss photomicroscope. In brief,
the sample preparation can be described in Figure 6.11.
1 Fibre alignement~1 Progressive dehydration j-?I Resin impregnation
~I Resin curing I~ IMicrotom sectionin~ 1 Microscope observation 1
Figure 6.11 Sample preparation for image analysis
6.6.7 Scanning electron microscopy (SEM) and image analysis
Scanning electron microscopy (SEM) was employed to qualitatively examine the
breakdown ofEW and LW fibres, e.g., fibre separation mode (SI, S2, Sl/S2 exposure),
splitting, collapsibility etc. [138, 143]. An ImageJ algorithm (Image Processing and
Analysis in Java) [144] was employed to directly measure the following fibre properties
in SEM images: cell wall thickness, cell wall area, area of filled fibres (fibre wall area + lumen area), outer and inner fibre perimeter of cell wall [145]. The fibre collapsibility
was determined as follows.
Form Cirele (FC) and Form Shape (FS) were used to evaluate the fibre collapse in
refining [1, 52, 146, 147], the collapsibility ofEW and LW fibres could be compared by
means ofthese parameters (Figure 6.12).
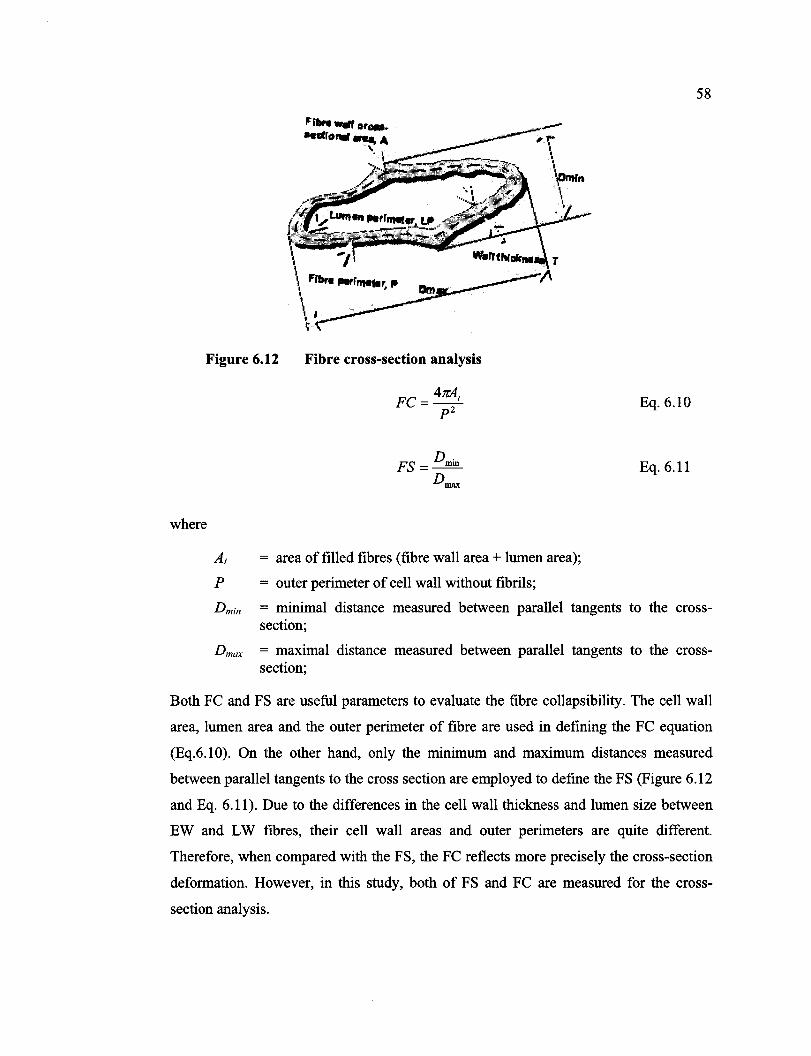
Reproduced with permission of the copyright owner. Further reproduction prohibited without permission.
\ \ f'''' PIIri"..., " 1 1
\ 1 't
.....-'.\"" ,
\ \, 'pntin
\ ,
58
Figure 6.12 Fibre cross-section analysis
where
Fe = 4JZAr p2
At = area offilled fibres (fibre wall area + lumen area);
p = outer perimeter of cell wall without fibrils;
Eq.6.10
Eq.6.11
Dmin = minimal distance measured between parallel tangents to the crosssection;
Dmax = maximal distance measured between parallel tangents to the crosssection;
Both Fe and FS are useful parameters to evaluate the fibre collapsibility. The cell wall
area, lumen area and the outer perimeter of fibre are used in defining the Fe equation
(Eq.6.10). On the other hand, only the minimum and maximum distances measured
between parallel tangents to the cross section are employed to define the FS (Figure 6.12
and Eq. 6.11). Due to the differences in the cell wall thickness and lumen size between
EW and LW fibres, their cell wall areas and outer perimeters are quite different.
Therefore, when compared with the FS, the Fe reflects more precisely the cross-section
deformation. However, in this study, both of FS and Fe are measured for the cross
section analysis.
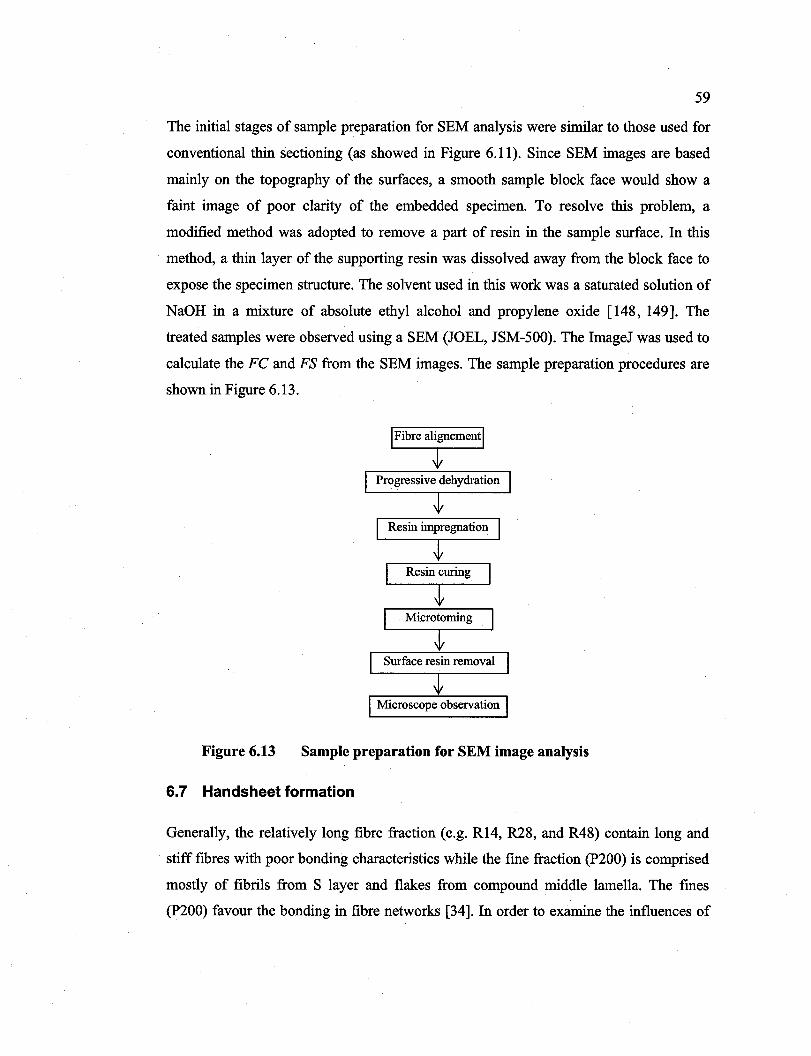
Reproduced with permission of the copyright owner. Further reproduction prohibited without permission.
59
The initial stages of sample preparation for SEM analysis were similar to those used for
conventional thin sectioning (as showed in Figure 6.11). Since SEM images are based
mainly on the topography of the surfaces, a smooth sample block face would show a
faint image of poor c1arity of the embedded specimen. To resolve this problem, a
modified method was adopted to remove a part of resin in the sample surface. In this
method, a thin layer of the supporting resin was dissolved away from the block face to
expose the specimen structure. The solvent used in this work was a saturated solution of
NaOH in a mixture of absolute ethyl alcohol and propylene oxide [148, 149]. The
treated samples were observed using a SEM (JOEL, JSM-500). The ImageJ was used to
calculate the Fe and FS from the SEM images. The sample preparation procedures are
shown in Figure 6.13.
Resin curing
Microtoming
1 Microscope observation 1
Figure 6.13 Sample preparation for SEM image analysis
6.7 Handsheet formation
Generally, the relatively long fibre fraction (e.g. R14, R28, and R48) contain long and
stiff fibres with poor bonding characteristics while the fine fraction (P200) is comprised
mostly of fibrils from S layer and flakes from compound middle lamella. The fines
(P200) favour the bonding in fibre networks [34]. In order to examine the influences of
Reproduced with permission of the copyright owner. Further reproduction prohibited without permission.
60
fibre characteristics on paper properties, standard handsheets of 60 glm2 (Tappi method
T205 sp-02) were made from different Bauer-McNett fractions of EW, LW and the
mixture of EW and LW. The handsheets inc1uded:
• Whole pulp;
• Pulp without fmes (P200);
• Combined long fibre fractions (RI4+R28+R48);
• Combined short fibre fraction (RIOO+R200+P200);
• Individual fractions ofRI4, R28, R48 and RIOO;
• Blends of EW and LW pulps after refining. This pulp mixture has the same
weight proportion of EW and LW as in the chip mixture. The results were
compared with those ofmixture ofEW and LW refmed together.
6.7.1 Characterization of handsheets
Sorne physical, chemical, and optical properties and microscopic structures were
measured for these handsheets of the second-stage refining pulp, hoping to establish
sorne possible interrelations between the fibre characteristics and paper properties.
1. Physical properties: tensile, tear, burst, stretch, TEA, density, porosity,
roughness, inter-fibre bonding (Scott bond);
2. Chemical properties: Oxygen/carbon atomic ratio of fibre surface (X-ray
photoelectron spectroscopy) [150, 151];
3. Optical properties: brightness, light scattering coefficient, light absorption
coefficient, opacity;
4. Structural properties, such as the twist angle of EW and LW fibres in handsheets
(SEM);
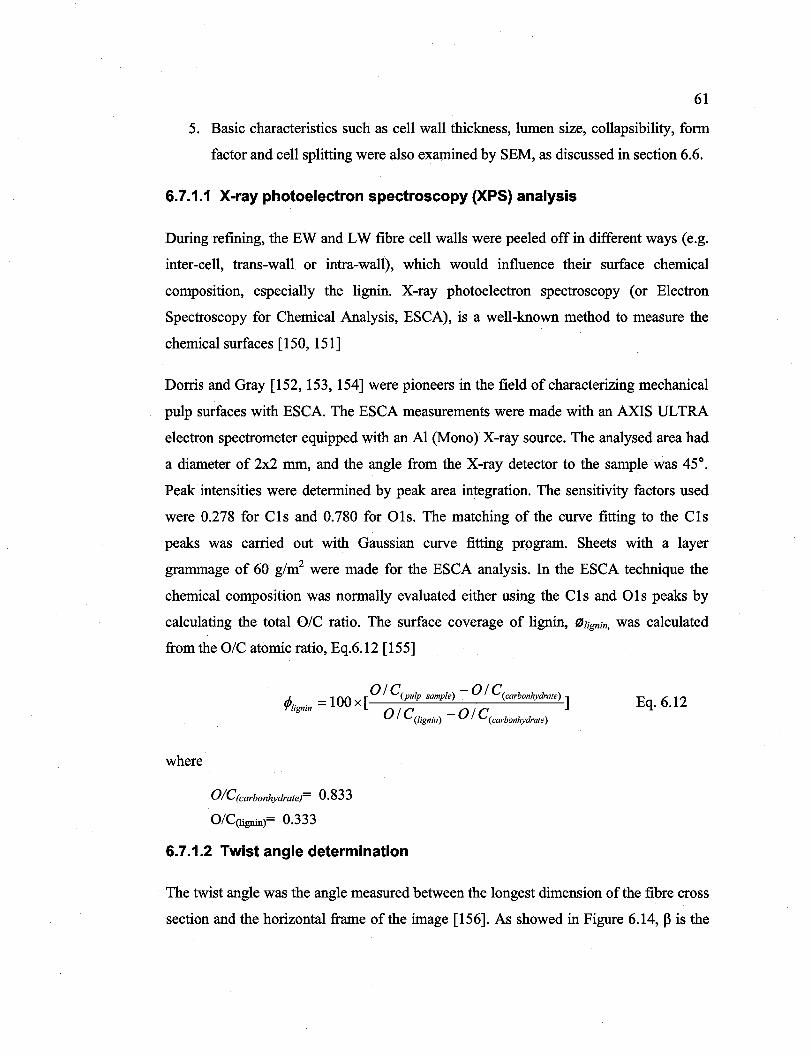
Reproduced with permission of the copyright owner. Further reproduction prohibited without permission.
61
5. Basic characteristics such as cell wall thickness, lumen size, collapsibility, form
factor and cell splitting were also examined by SEM, as discussed in section 6.6.
6.7.1.1 X-ray photoelectron spectroscopy (XPS) analysis
During refining, the EW and LW fibre cell walls were peeled off in different ways (e.g.
inter-celI, trans-wall or intra-walI), which would influence their surface chemical
composition, especially the lignin. X-ray photoelectron spectroscopy (or Electron
Spectroscopy for Chemical Analysis, ESCA), is a well-known method to measure the
chemical surfaces [150, 151]
Dorris and Gray [152, 153, 154] were pioneers in the field of characterizing mechanical
pulp surfaces with ESCA. The ESCA measurements were made with an AXIS ULTRA
electron spectrometer equipped with an Al (Mono) X-ray source. The analysed area had
a diameter of 2x2 mm, and the angle from the X-ray detector to the sample was 45°.
Peak intensities were determined by peak area integration. The sensitivity factors used
were 0.278 for Cls and 0.780 for Ols. The matching of the curve fitting to the Cls
peaks was carried out with Gaussian curve fitting pro gram. Sheets with a layer
grammage of 60 g/m2 were made for the ESCA analysis. In the ESCA technique the
chemical composition was normally evaluated either using the CI sand Ols peaks by
calculating the total O/C ratio. The surface coverage of lignin, (lJlignin, was calculated
from the O/C atomic ratio, Eq.6.12 [155]
where
rp. . = 100 x [ 0 1 C(pulp sam pIe) - 01 C(carbonhydrate) ]
llgmn 01 CUignin) - 01 C(carbonhydrate)
O/C(carbonhydrate)= 0.833
O/C(lignin)= 0.333
6.7.1.2 Twist angle determination
Eq.6.12
The twist angle was the angle measured between the longe st dimension of the fibre cross
section and the horizontal frame of the image [156]. As showed in Figure 6.14, pis the
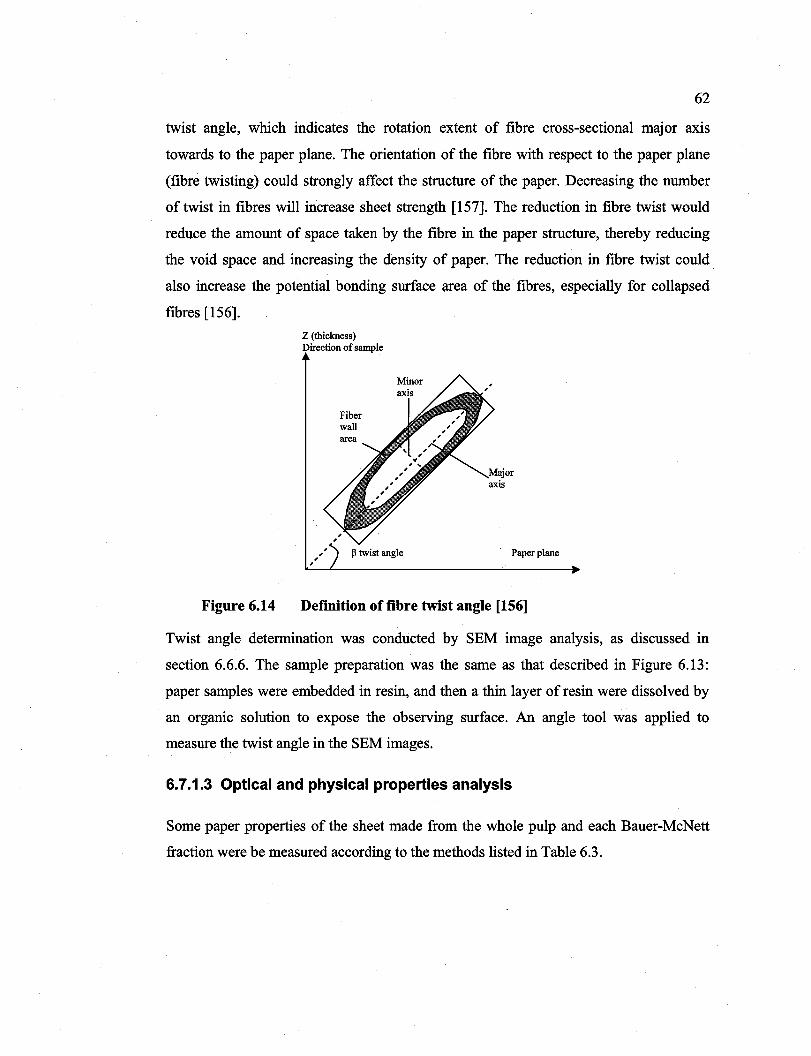
Reproduced with permission of the copyright owner. Further reproduction prohibited without permission.
62
twist angle, which indicates the rotation extent of fibre cross-sectional major axis
towards to the paper plane. The orientation of the fibre with respect to the paper plane
(fibre twisting) could strongly affect the structure of the paper. Decreasing the number
of twist in fibres will increase sheet strength [157]. The reduction in fibre twist would
reduce the amount of space taken by the fibre in the paper structure, thereby reducing
the void space and increasing the density of paper. The reduction in fibre twist could
also increase the potential bonding surface area of the fibres, especially for collapsed
fibres [156].
Figure 6.14
Z (thickness) Direction of sample
" , ~ twist angle , Paperplane
Definition of fibre twist angle [156J
Twist angle determination was conducted by SEM image analysis, as discussed in
section 6.6.6. The sample preparation was the same as that described in Figure 6.13:
paper samples were embedded in resin, and then a thin layer of resin were dissolved by
an organic solution to expose the observing surface. An angle tool was applied to
measure the twist angle in the SEM images.
6.7.1.3 Optical and physical properties analysis
Some paper properties of the sheet made from the whole pulp and each Bauer-McNett
fraction were be measured according to the methods listed in Table 6.3.
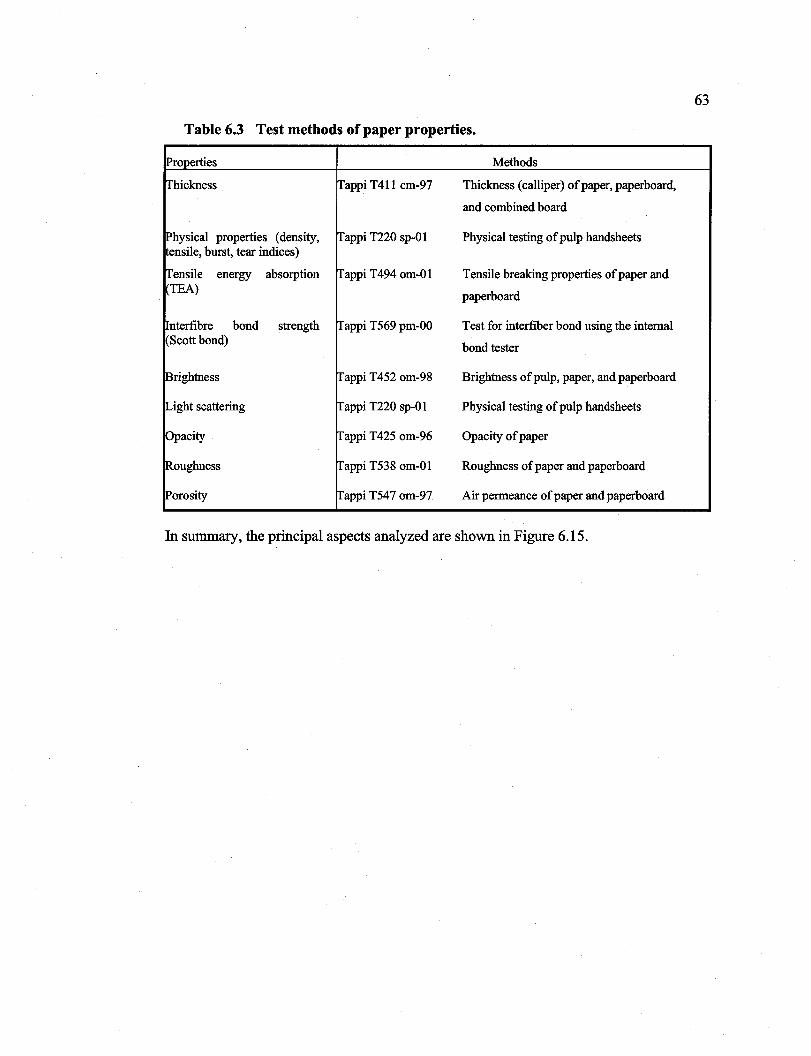
Reproduced with permission of the copyright owner. Further reproduction prohibited without permission.
63
Table 6.3 Test methods of paper properties.
IProperties Methods
Irhickness Tappi T411 cm-97 Thickness (calliper) ofpaper, paperboard,
and combined board
Physical properties ( density, Irappi T220 sp-OI Physical testing of pulp handsheets ensile, burst, tear indices)
ITensile energy absorption ITappi T494 om-OI Tensile breaking properties ofpaper and TEA)
paperboard
nterfibre bond strength Irappi T569 pm-OO Test for interfiber bond using the internaI Scott bond)
bond tester
Brightness Irappi T452 om-98 Brightness ofpulp, paper, and paperboard
Light scattering Irappi T220 sp-OI Physical testing of pulp handsheets
Opacity ITappi T425 om-96 Opacity of paper
Roughness ITappi T538 om-OI Roughness of paper and paperboard
Porosity Irappi T547 om-97 Air permeance of paper and paperboard
In summary, the principal aspects analyzed are shown in Figure 6.15.
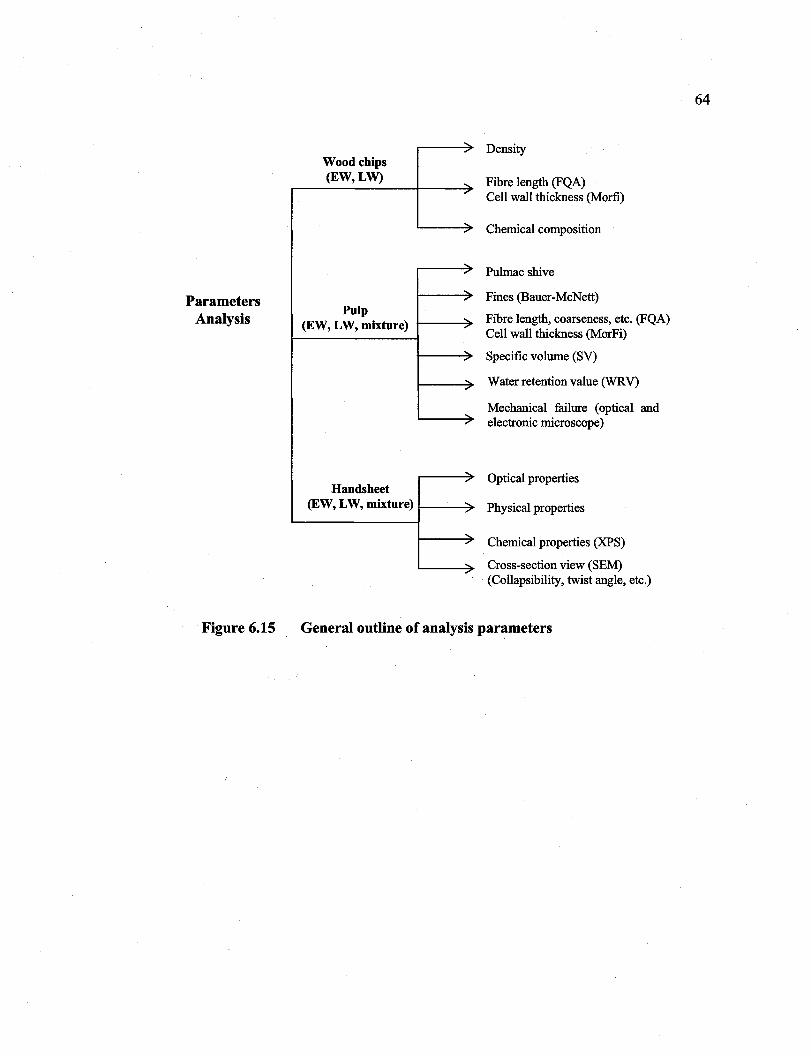
Reproduced with permission of the copyright owner. Further reproduction prohibited without permission.
Parameters Analysis
Figure 6.15
.....
.".
Wood chips (EW,LW) ... ,
.....
.".
.....
.".
...... .".
Pulp (EW, LW, mixture) ,
...
., .".
,
.....
.".
Handsheet (EW, LW, mixture) .....
.".
...
.".
.....
.".
Density
Fibre length (FQA) Cell wall thickness (Morfi)
Chemical composition
Pulmac shive
Fines (Bauer-McNett)
Fibre length, coarseness, etc. (FQA) Cell wall thickness (MorFi)
Specific volume (SV)
Water retention value (WRV)
Mechanical failure (optical and electronic microscope)
Optical properties
Physical properties
Chemical properties (XPS)
Cross-section view (SEM) (Collapsibility, twist angle, etc.)
General outline of analysis parameters
64
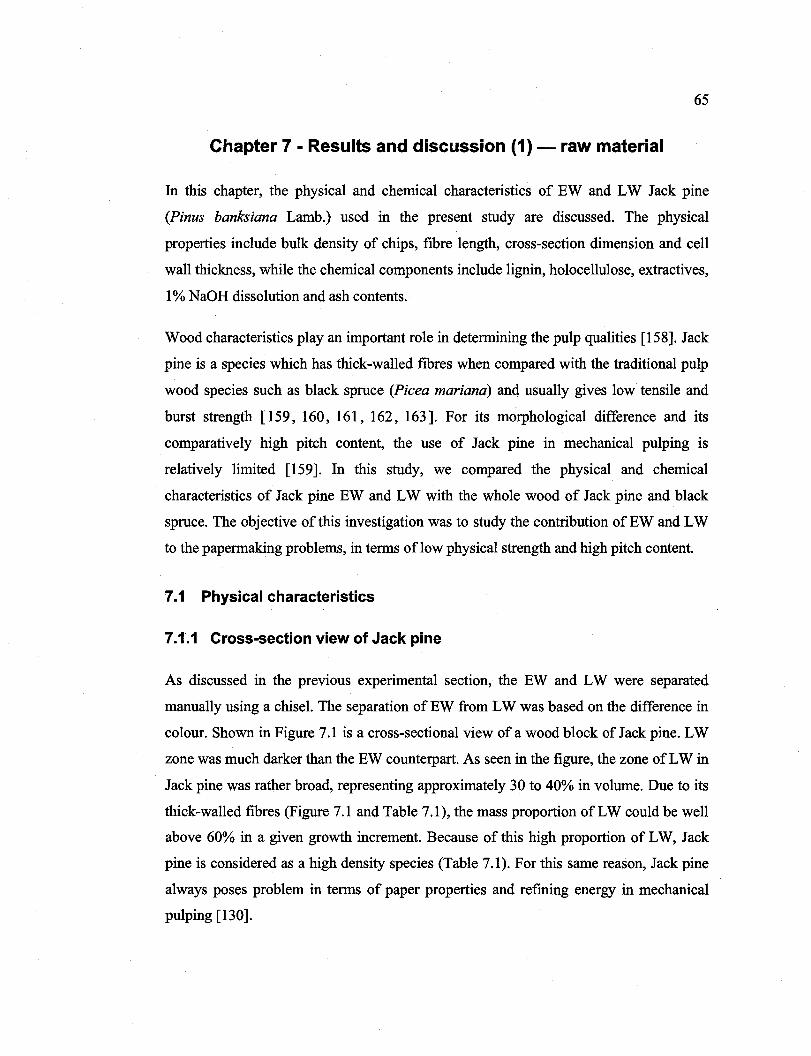
Reproduced with permission of the copyright owner. Further reproduction prohibited without permission.
65
Chapter 7 - Results and discussion (1) - raw material
In this chapter, the physical and chemical characteristics of EW and LW Jack pine
(Pinus banksiana Lamb.) used in the present study are discussed. The physical
properties inc1ude bulk density of chips, fibre length, cross-section dimension and cell
wall thickness, while the chemical components inc1ude lignin, holocellulose, extractives,
1 % NaOH dissolution and ash contents.
Wood characteristics play an important role in determining the pulp qualities [158]. Jack
pine is a species which has thick-walled fibres when compared with the traditional pulp
wood species such as black spruce (Picea mariana) and usually gives low tensile and
burst strength [159,160,161,162,163]. For its morphological difference and its
comparatively high pitch content, the use of Jack pine in mechanical pulping is
relatively limited [159]. In this study, we compared the physical and chemical
characteristics of Jack pine EW and LW with the whole wood of Jack pine and black
spruce. The objective of this investigation was to study the contribution of EW and LW
to the papermaking problems, in terms of low physical strength and high pitch content.
7.1 Physical characteristics
7.1.1 Cross-section view of Jack pi ne
As discussed in the previous experimental section, the EW and LW were separated
manually using a chis el. The separation of EW from LW was based on the difference in
colour. Shown in Figure 7.1 is a cross-sectional view of a wood block of Jack pine. LW
zone was much darker than the EW counterpart. As seen in the figure, the zone of LW in
Jack pine was rather broad, representing approximately 30 to 40% in volume. Due to its
thick-walled fibres (Figure 7.1 and Table 7.1), the mass proportion of LW could be well
above 60% in a given growth increment. Because of this high proportion of LW, Jack
pine is considered as a high density species (Table 7.1). For this same reason, Jack pine
always poses problem in terms of paper properties and refming energy in mechanical
pulping [130].
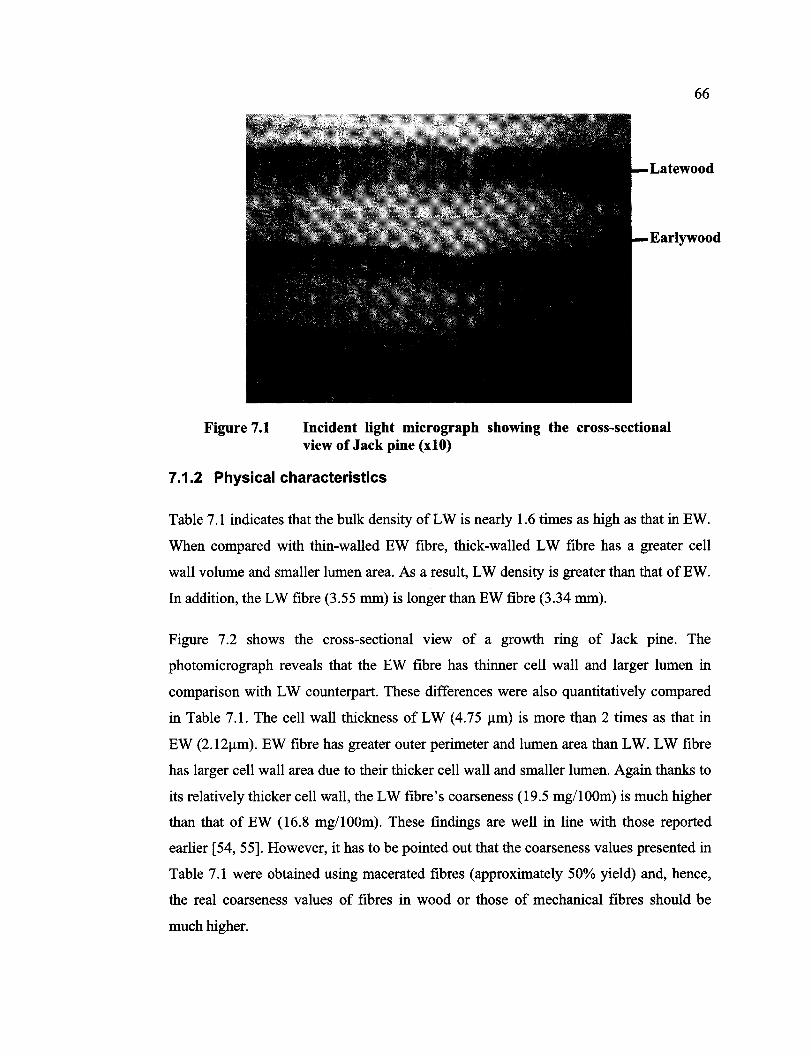
Reproduced with permission of the copyright owner. Further reproduction prohibited without permission.
Figure 7.1
66
Latewood
Earlywood
Incident light micrograph showing the cross-section al view of Jack pine (dO)
7.1.2 Physical characteristics
Table 7.1 indicates that the bulk density of LW is nearly 1.6 times as high as that in EW.
When compared with thin-walled EW fibre, thick-walled LW fibre has a greater cell
wall volume and smaller lumen area. As a result, LW density is greater than that of EW.
In addition, the LW fibre (3.55 mm) is longer than EW fibre (3.34 mm).
Figure 7.2 shows the cross-sectional view of a growth ring of Jack pine. The
photomicrograph reveals that the EW fibre has thinner cell wall and larger lumen in
comparison with LW counterpart. These differences were also quantitatively compared
in Table 7.1. The cell wall thickness of LW (4.75 flm) is more than 2 times as that in
EW (2.12flm). EW fibre has greater outer perimeter and lumen area than LW. LW fibre
has larger cell wall area due to their thicker cell wall and smaller lumen. Again thanks to
its relatively thicker cell wall, the LW fibre's coarseness (19.5 mg/l00m) is much higher
than that of EW (16.8 mg/lOOm). These findings are well in line with those reported
earlier [54,55]. However, it has to be pointed out that the coarseness values presented in
Table 7.1 were obtained using macerated fibres (approximately 50% yield) and, hence,
the real coarseness values of fibres in wood or those of mechanical fibres should be
much higher.
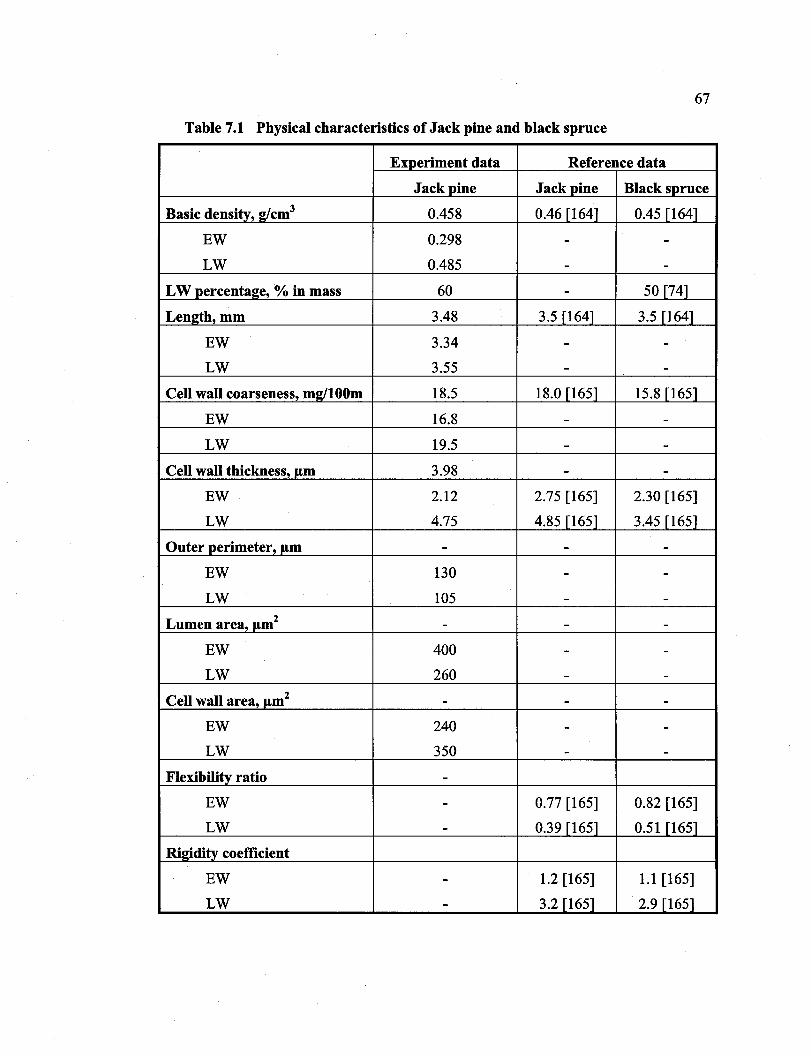
Reproduced with permission of the copyright owner. Further reproduction prohibited without permission.
67
Table 7.1 Physical characteristics of Jack pine and black spruce
Experiment data Reference data
Jack pine Jack pine Black spruce
Basic density, wcm3 0.458 0.46[164] 0.45 [164]
EW 0.298 - -LW 0.485 - -
LW percentage, % in mass 60 - 50 [74]
Length, mm 3.48 3.5 [164] 3.5 [164]
EW 3.34 - -LW 3.55 - -
Cell wall coarseness, mw100m 18.5 18.0 [165] 15.8 [165]
EW 16.8 - -LW 19.5 - -
Cell wall thickness,p,m 3.98 - -EW 2.12 2.75 [165] 2.30 [165]
LW 4.75 4.85 [165] 3.45 [165]
()uterperimeter,~m - - -EW 130 - -LW 105 - -
Lumen area, p,m2 - - -EW 400 - -LW 260 - -
Cell wall area, p,m2 - - -EW 240 - -LW 350 - -
Flexibility ratio -EW - 0.77 [165] 0.82 [165]
LW - 0.39 [165] 0.51 [165]
Rigidity coefficient
EW - 1.2 [165] 1.1 [165]
LW - 3.2 [165] 2.9 [165]
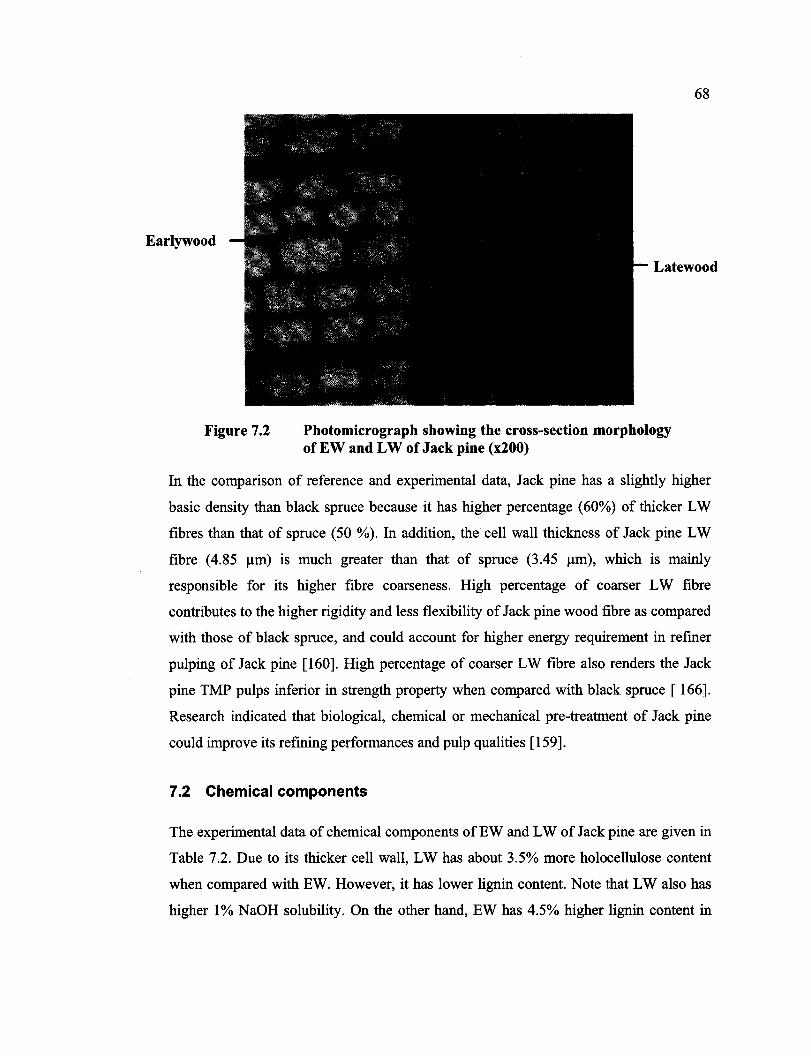
Reproduced with permission of the copyright owner. Further reproduction prohibited without permission.
Earlywood
Figure 7.2
68
Latewood
Photomicrograph showing the cross-section morphology of EW and LW of Jack pine (x200)
In the comparison of reference and experimental data, Jack pine has a slightly higher
basic density than black spruce because it has higher percentage (60%) of thicker LW
fibres than that of spruce (50 %). In addition, the cell wall thickness of Jack pine LW
fibre (4.85 ~m) is much greater than that of spruce (3.45 ~m), which is mainly
responsible for its higher fibre coarseness. High percentage of coarser LW fibre
contributes to the higher rigidity and less flexibility of Jack pine wood fibre as compared
with those of black spruce, and could account for higher energy requirement in refmer
pulping of Jack pine [160]. High percentage of coarser LW fibre also renders the Jack
pine TMP pulps inferior in strength property when compared with black spruce [ 166].
Research indicated that biological, chemical or mechanical pre-treatment of Jack pine
could improve its refining performances and pulp qualities [159].
7.2 Chemical components
The experimental data of chemical components of EW and LW of Jack pine are given in
Table 7.2. Due to its thicker cell wall, LW has about 3.5% more holocellulose content
when compared with EW. However, it has lower lignin content. Note that LW also has
higher 1% NaOH solubility. On the other hand, EW has 4.5% higher lignin content in

Reproduced with permission of the copyright owner. Further reproduction prohibited without permission.
69
comparison with the LW. This is probably attributed to its relatively thicker lignin-rich
CML as explained by Fenge1 [65]. Interestingly, the EW shows 20.4% higher
dichloromethane (DCM) extractives than LW does. This difIerence in DCM extractives
might probably due to the fact that the EW contain more resin-rich canals than LW, as
shown in Figure 7.3. In addition, there are no significant difIerences in the ash content
between EW and LW.
Table 7.2 Chemical components of Jack pine and black spruce
Experimental data Reference data
Jack pine Jack pine Black spruce
Klason li2nin, % 27.50 27.6 [167] 26.9 [167]
EW 28.30 - -LW 27.09 - -
Holocellulose, % 69.77 69.7 [167] 73.3 [167]
EW 68.68 - -LW 71.01 - -
Dichloromethane (DCM) 1.88 2.0 [168] 1.0 [168] extractives, %
EW 1.95
LW 1.62
1 % NaOH solubility, % 12.60 12.7 r1671 13-15 D671
EW 11.64
LW 13.13
Ash, % 0.17 0.16 D671 0.22 D671
EW 0.17
LW 0.17
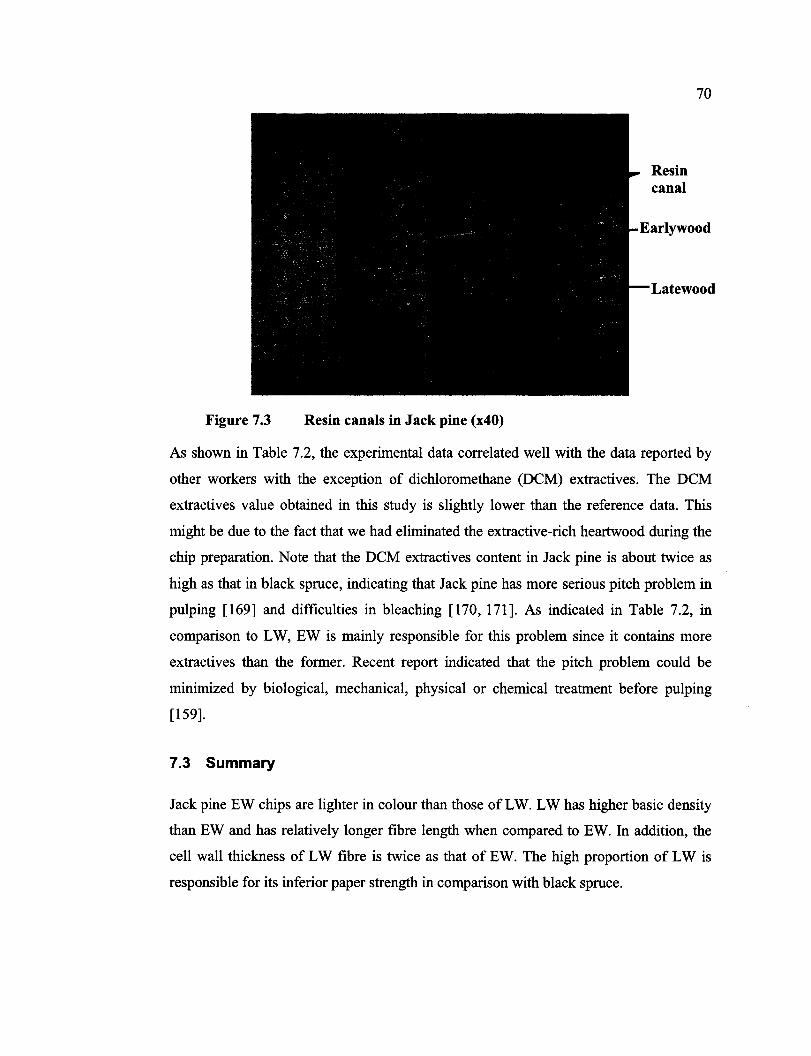
Reproduced with permission of the copyright owner. Further reproduction prohibited without permission.
Figure 7.3 Resin canals in Jack pine (x40)
Resin canal
70
Latewood
As shown in Table 7.2, the experimental data correlated well with the data reported by
other workers with the exception of dichloromethane (DCM) extractives. The DCM
extractives value obtained in this study is slightly lower than the reference data. This
might be due to the fact that we had eliminated the extractive-rich heartwood during the
chip preparation. Note that the DCM extractives content in Jack pine is about twice as
high as that in black spruce, indicating that Jack pine has more serious pitch problem in
pulping [169] and difficulties in bleaching [170, 171]. As indicated in Table 7.2, in
comparison to LW, EW is mainly responsible for this problem since it contains more
extractives than the former. Recent report indicated that the pitch problem could be
minimized by biological, mechanical, physical or chemical treatment before pulping
[159].
7.3 Summary
Jack pine EW chips are lighter in colour than those of LW. LW has higher basic density
than EW and has relatively longer fibre length when compared to EW. In addition, the
cell wall thickness of LW fibre is twice as that of EW. The high proportion of LW is
responsible for its inferior paper strength in comparison with black spruce.
Reproduced with permission of the copyright owner. Further reproduction prohibited without permission.
71
Regarding the chemical compositions, LW has higher content of holocellulose while
EW shows greater lignin content. Furthermore, EW has higher dichloromethane (DCM)
extractives than LW because the former has more resin-rich canals.
Reproduced with permission of the copyright owner. Further reproduction prohibited without permission.
72
Chapter 8 - Results and discussion (2) - pulp characterization
In this chapter, we describe the morphological changes ofEW and LW fibres incurred in
refming. The experimental pulps were classified into various fractions using a Bauer
McNett classifier. The fibres of each fraction were characterized in terms offibre length,
cell wall thickness, fibre coarseness, curl and kink index, water retention values (WRV),
and specific volume (SV) of fmes. In addition, the surface lignin coverage of EW and
LW pulp fibres was analyzed by means of an X-ray photoelectron spectroscope (XPS).
Optical and electron microscopic analyses were also conducted to examine the rupture
characteristics of EW and LW fibres.
8.1 Refining energy
Figure 8.1 clearly shows that refining EW required more energy than refming LW at a
given freeness. As discussed later, the EW was defibrated into pulp fibres with relatively
little fibrillation when compared to the LW. As a result, EW pulp had higher freeness for
a given energy consumption. This finding is in agreement with that reported by other
researchers [10]. It was also observed that the energy consumption of the mixed furnish
containing both EW and LW was found between those ofEW and LW.
Note that the refming temperature had also important influence on refining energy
consumption. In comparison with low temperature refming at 120 oC the high refming
temperature (160°C) decreased the friction between fibre mass and refmer plate surface
due to the fact that the wood matrix is softer at 160°C than at 120°C. For this reason it is
necessary to reduce the plate gap to improve refining efficiency. As a consequence, the
reduced plate clearance had unfortunately increased fibre cutting, producing more fines
and decreasing more rapidly the freeness of the pulp produced.
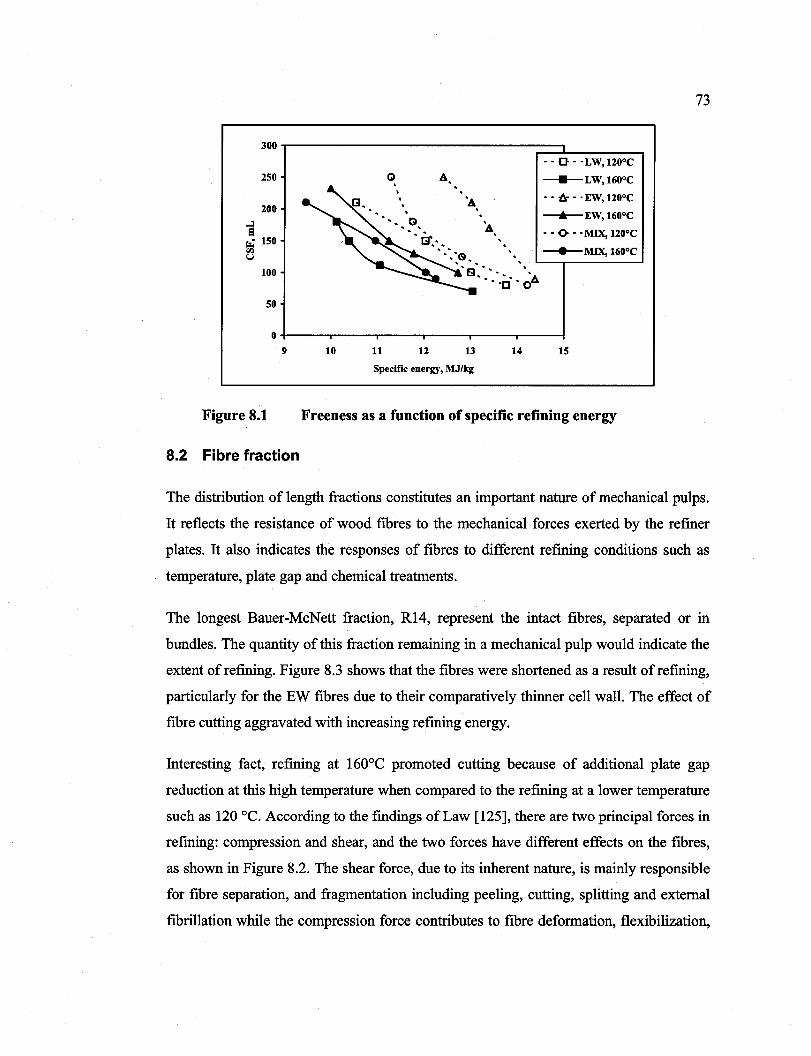
Reproduced with permission of the copyright owner. Further reproduction prohibited without permission.
300
250
200
...:l El
r;.;' 150 <Il U
100
50
0
9
Figure 8.1
8.2 Fibre fraction
10 11 12 13
Specüicenergy,~Jfkg
14
- - 0 - . LW, 120°C
_____ LW, 160°C
•• {)r - • EW, 120°C
~EW,160°C
- - (} - . MIX, 120°C
---+-MIX, 160°C
15
Freeness as a function of specifie refining energy
73
The distribution of length fractions constitutes an important nature of mechanical pulps.
It reflects the resistance of wood fibres to the mechanical forces exerted by the refiner
plates. It also indicates the responses of fibres to different refining conditions such as
temperature, plate gap and chemical treatments.
The longe st Bauer-McNett fraction, R14, represent the intact fibres, separated or in
bundles. The quantity of this fraction remaining in a mechanical pulp would indicate the
extent of refining. Figure 8.3 shows that the fibres were shortened as a result of refming,
particularly for the EW fibres due to their comparatively thinner cell wall. The effect of
fibre cutting aggravated with increasing refming energy.
Interesting fact, refming at 160°C promoted cutting because of additional plate gap
reduction at this high temperature when compared to the refming at a lower temperature
such as 120 oC. According to the fmdings of Law [125], there are two principal forces in
refining: compression and shear, and the two forces have different effects on the fibres,
as shown in Figure 8.2. The shear force, due to its inherent nature, is mainly responsible
for fibre separation, and fragmentation inc1uding peeling, cutting, splitting and external
fibrillation while the compression force contributes to fibre deformation, flexibilization,

Reproduced with permission of the copyright owner. Further reproduction prohibited without permission.
74
de1amination (internaI fibrillation). The latter increases the fibre flexibility. During high
temperature refining, as the refiner plate gap decreases, the shear force increases,
causing more fibre cutting.
Shear
Separation, Fragmentation (peeling utting, splitting, external fibrillation)
eformation, FlexibiIization, elamination (internaI fibrillation)
1oIII!::;;;..-. ______________ ,. Compression
Figure 8.2 Contributions of shear and compression actions in refining
The particular effect of fibre shortening in high temperature refining was also evidenced
in other fractions such as R28 and R48, as shown in Figure 8.4 and 8.5, respectively.
Since the sample MIX consisted ofEW and LW, its curve tended to lie between those of
EWandLW.
While the R14 fraction represents the intact fibres remaining after refining, the short
fibre fractions such as RI00 (Figure 8.6) and R200 (Figure 8.7) correspond to the
accumulated effect of fibre cutting induced by the refining action. Again, as seen in
Figures 8.6 and 8.7, refming at 160°C promoted fibre cutting in comparison with the
refining at 120 oC, and EW suffered more physical destruction as compared to LW.
The fmes, P200, consist of ray cells, flake-like outer layer of cell wall and fibrils
resulted from the cutting and/or peeling effects of refiner plates. Quantitatively, refming
at 160 oC generated more fmes from LW, as shown in Figure 8.8. However, there was
little difference between LW and EW when the refming was carried out at 120°C,
implying that there was less severe fibre cutting or peeling when the refming was
conducted with a large plate clearance at this temperature.
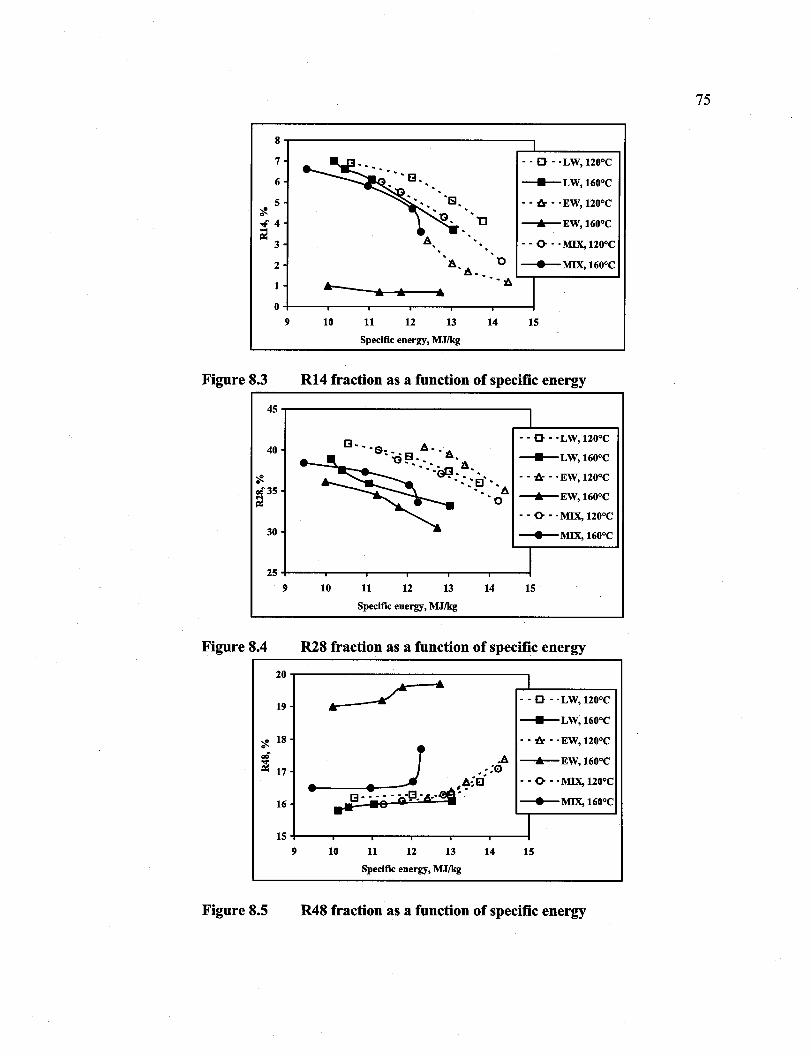
Reproduced with permission of the copyright owner. Further reproduction prohibited without permission.
8
7
6
5 "f-~4 ;:
3
2
1
0
9
Figure 8.3
45
40
"f-Clé 35 &!
30
25
9
Figure 8.4
20
19
"f- 18
Clé a!i 17
16
15
9
Figure 8.5
'" '" 10 11 12 13
Specifie energy, MJ/kg
14
- - 0 - -LW, 120°C
____ LW, 160°C
- - i:r - -EW, 120°C
----.-EW, 160°C
- - 0 - -MIX, 120°C
15
R14 fraction as a function of specifie energy
1
[3, , , A, - - 0 - -LW, 120°C
~ &:"8, '2\. ____ LW, 160°C ... 'G" " ~
~~:::È'" - - i:r - -EW, 120°C ". • A
----.-EW, 160°C '0 - - 0 - -MIX, 120°C
---+-MIX, 160°C
J 10 11 12 13 14 15
Specifie energy, MJ/kg
R28 fraction as a function of specifie energy
r-"--_/-
•
10 11 12 13
Specifie energy, MJ/kg
14
1 , - 0 - -LW, 120°C
____ LW, 160°C
- , i:r - -EW, 120°C
----.-EW, 160°C
- - 0 - -MIX, 120°C
---+-MIX, 160°C
1 15
R48 fraction as a function of specifie energy
75
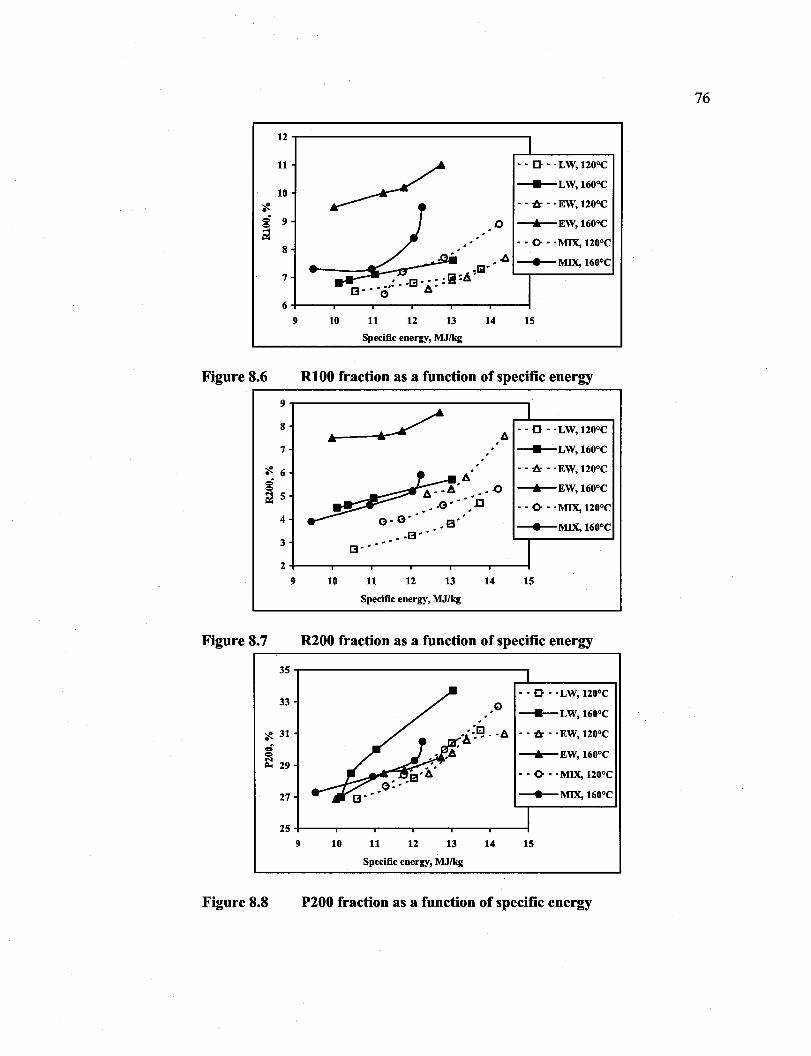
Reproduced with permission of the copyright owner. Further reproduction prohibited without permission.
12
11
10
<!. =- 9 CI ;
8
7
6
9
Figure 8.6
10
• • 0 • "LW, 120°C
_____ LW, 160°C
• • -& • "EW, 120°C
.1iI· . [3 ... ;!à:A·
[3···0···· A'
o --..-EW, 160°C
• • () • "MIX, 120°C
• .t:. --MIX, 160°C
11 12 13 14 15
Specifie energy, MJ/kg
R100 fraction as a function of specifie energy ~--------------------------------------------~
Figure 8.7
9~-----------------------------,
8
7 . '
4
3
. . l!. ·-0- "LW, 120°C
_____ LW, 160°C
• • -& • "EW, 120°C
--..-EW, 160°C
• • () • "MIX, 120°C
--MIX, 160°C
2+---~----~--~~--~----r---~
9 10 11 12 13 14 15
Specifie energy, MJ/kg
R200 fraction as a function of specifie energy ~--------------------------------------------~
35~-------------------------------,
33
<!. 31 g ~ 29
27
· . 0 . "LW, 120°C
_____ LW, 160°C
• • -& • "EW, 120°C
--..-EW, 160°C
• • () • "MIX, 120°C
--MIX, 160°C
25+---~----~--~----~--~--~
9 10 11 12 13 14 15
Specifie energy, MJ/kg
Figure 8.8 P200 fraction as a function of specifie energy
76
Reproduced with permission of the copyright owner. Further reproduction prohibited without permission.
77
8.3 Microscopie study of fibre fraction
Microscopic studies allowed us to gain useful information on the fibre development
during refming. The general major characteristics observed for each Bauer-McNett
fraction of EW and LW are presented by a series of photomicrographs, as represented in
Figures 8.9-8.15. According to the microscopic observation, between the two
temperature refming process (120°C and 160°C), within the EW or the LW fibres, the
characteristics of fibre failure are very similar but different in quantity. For example,
when compared with the low temperature refining (120°C), the high temperature
refming (160°C) produces more fibrillation in LW fibre while more fibre splits for EW
fibres mainly due to the reduced refmer plate gap. For the convenience of comparison in
quality, LW and EW pulps employed in this study were produced at 160°C with a
freeness of 150 mL.
The nature of the R14 fibres of LW (Figure 8.9) ranged from fibre bundles to individual
fibres with a large variation of surfaces properties ranging from a smooth surface to a
completely exposed S2 layer. Sorne fibres have most of their outer layer removed,
exposing the S2 layer while the others remained undisrupted. Peeling of the outer layer
or other types ofrupture never occurred uniformly along the fibre length. For instance, a
fibre could have its outer layer removed over most of its length, while the rest remain
undamaged. Moreover, sorne fibres were compressed and twisted, even completely
fibrillated (so-called "sleeve rolling" effect) by the refiner bar. As seen in the R14
fraction of EW (Figure 8.10): under the refmer forces, thin-walled EW fibres were
readily ruptured, split and broken down in shorter segments. In addition, the fibrillation
ofEW fibres was not as noticeable as in the LW fibres. The diversity of surface structure
of LW and EW TMP fibres render fibre characterization complicated. This also reveals a
fact that the refining action is not uniform.
The R28 fraction of LW (Figure 8.11, A-D) also showed a complex nature of fibre
surface ranging from "sleeve rolling" effect to complete exposure of S2 with intact or
rupture cell wall. Often, two or more of these characteristics occurred over the fibre
length. As for the R28 fraction of EW (Figure 8.11, E-H), splitting of fibre wall and
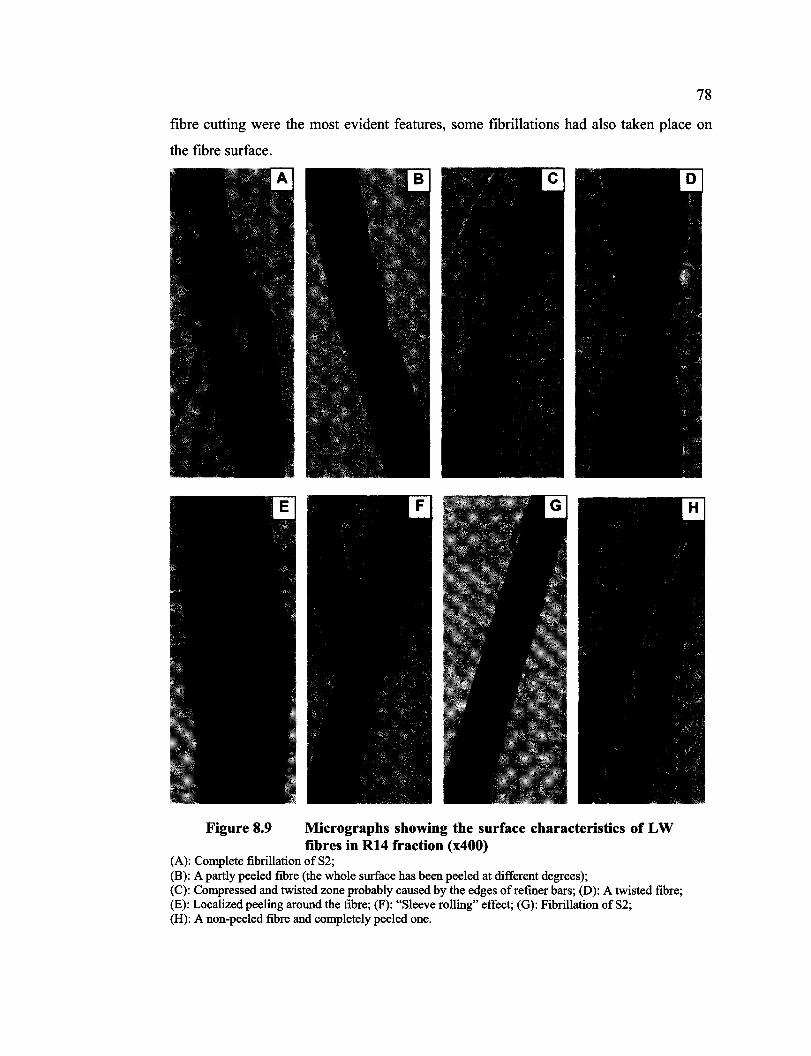
Reproduced with permission of the copyright owner. Further reproduction prohibited without permission.
78
fibre cutting were the most evident features, sorne fibrillations had also taken place on
the fibre surface.
Figure 8.9 Micrographs showing the surface characteristics of LW fibres in R14 fraction (x400)
(A): Complete fibrillation of S2; (B): A partly peeled fibre (the whole surface has been peeled at different degrees); (C): Compressed and twisted zone probably caused by the edges ofrefiner bars; (D): A twisted fibre; (E): Localized peeling around the fibre; (F): "Sleeve rolling" effect; (G): Fibrillation of S2; (H): A non-peeled fibre and completely peeled one.
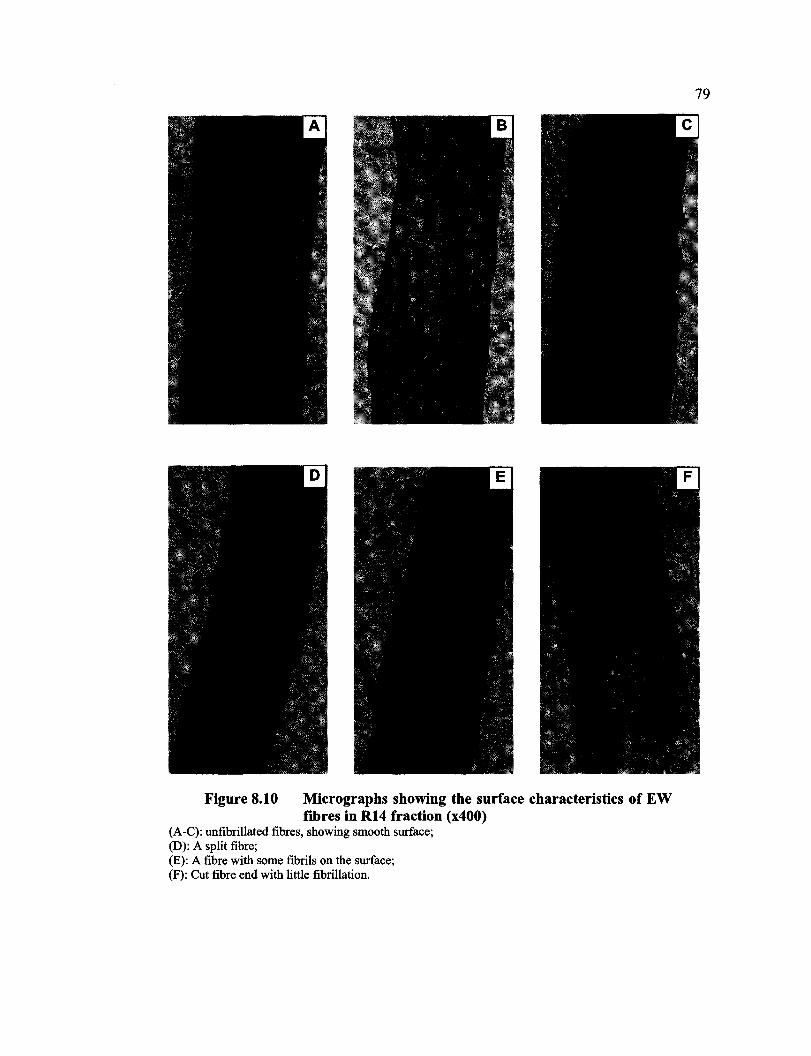
Reproduced with permission of the copyright owner. Further reproduction prohibited without permission.
Figure 8.10 Micrographs showing the surface characteristics of EW fibres in R14 fraction (x400)
(A-C): unfibrillated fibres, showing srnooth surface; (D): A split fibre; (E): A fibre with sorne fibrils on the surface; (F): eut fibre end with little fibrillation.
79
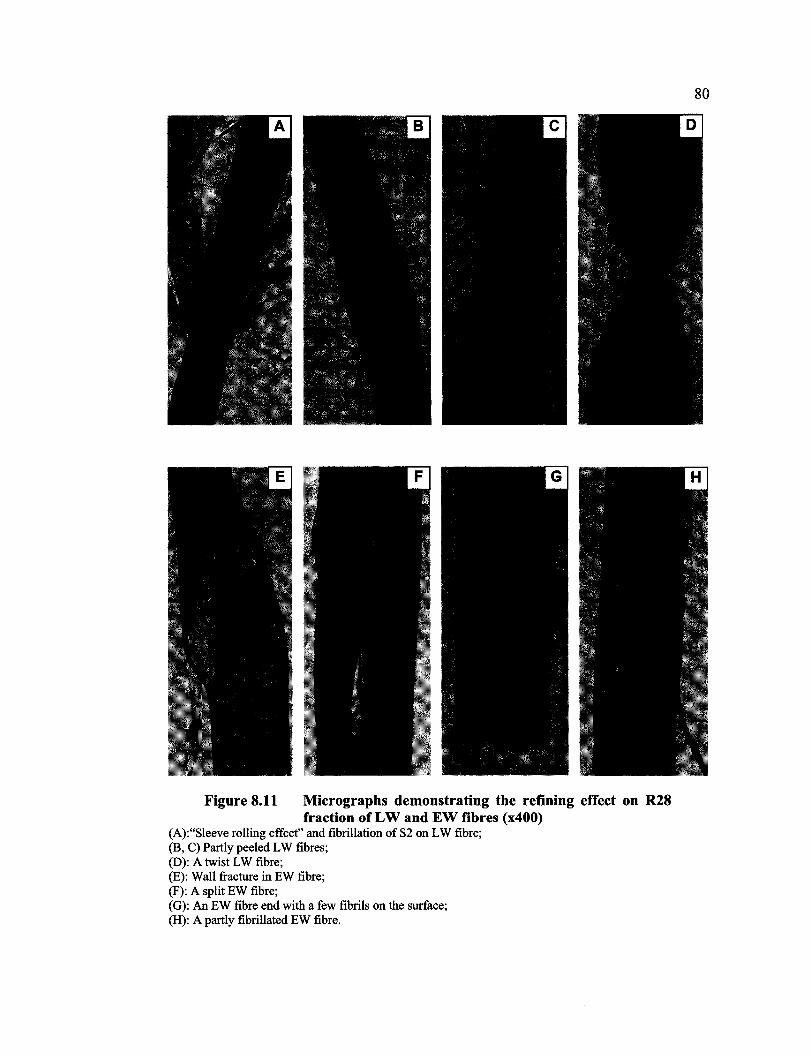
Reproduced with permission of the copyright owner. Further reproduction prohibited without permission.
Figure 8.11 Micrographs demonstrating the refining effect on R28 fraction of LW and EW fibres (x400)
(A):"Sleeve rolling effect" and fibrillation of S2 on LW fibre; (B, C) PartIy peeled LW fibres; (D): A twist LW fibre; (E): Wall fracture in EW fibre; (F): A split EW fibre; (G): An EW fibre end with a few fibriis on the surface; (H): A partIy fibrillated EW fibre.
80
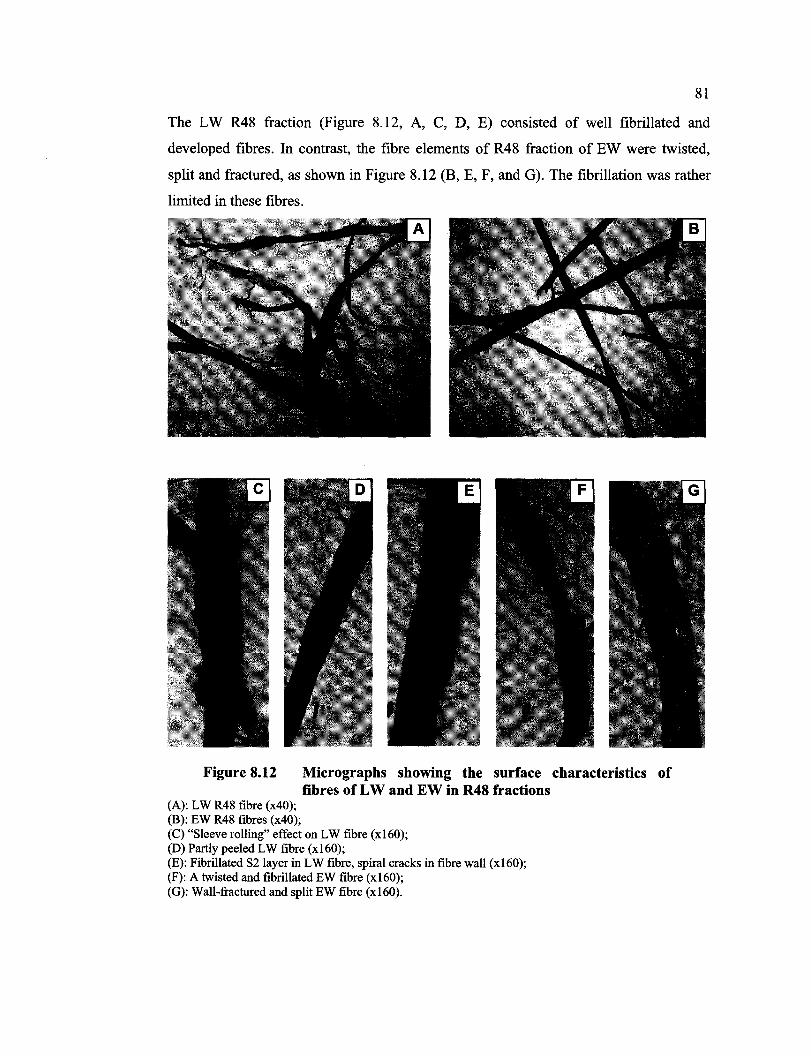
Reproduced with permission of the copyright owner. Further reproduction prohibited without permission.
81
The LW R48 fraction (Figure 8.12, A, C, D, E) consisted of weIl fibrillated and
developed fibres. In contrast, the fibre elements of R48 fraction of EW were twisted,
split and fractured, as shown in Figure 8.12 (B, E, F, and G). The fibrillation was rather
limited in these fibres.
Figure 8.12 Micrographs showing the surface characteristics of fibres of LW and EW in R48 fractions
(A): LW R48 fibre (x40); (B): EW R48 fibres (x40); (C) "Sleeve rolling" effect on LW fibre (x160); (D) Partly peeled LW fibre (x160); (E): Fibrillated S21ayer in LW fibre, spiral cracks in fibre wall (x160); (F): A twisted and fibrillated EW fibre (x160); (G): Wall-fractured and split EW fibre (x160).
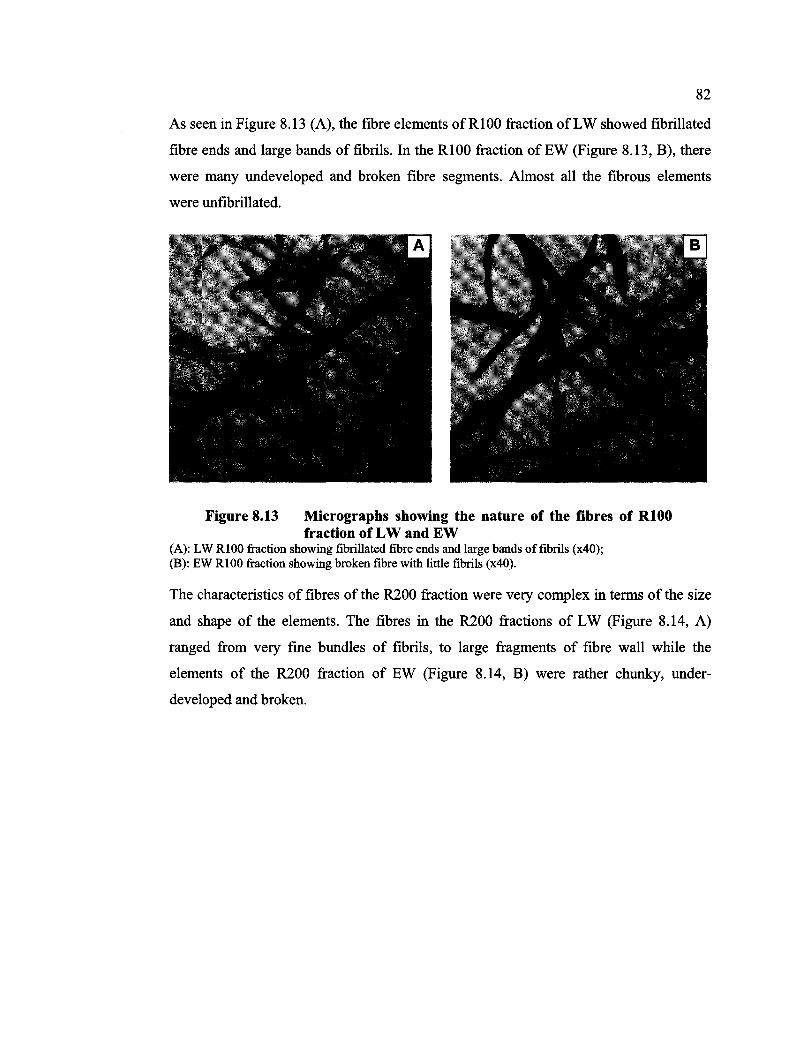
Reproduced with permission of the copyright owner. Further reproduction prohibited without permission.
82
As seen in Figure 8.13 (A), the fibre elements ofRlOO fraction of LW showed fibrillated
fibre ends and large bands offibrils. In the RI00 fraction ofEW (Figure 8.13, B), there
were many undeveloped and broken fibre segments. Almost all the fibrous elements
were unfibrillated.
Figure 8.13 Micrographs showing the nature of the fibres of RI00 fraction of LW and EW
(A): LW RIOO fraction showing fibrillated fibre ends and large bands offibrils (x40); (B): EW RlOO fraction showing broken fibre with little fibrils (x40).
The characteristics of fibres of the R200 fraction were very complex in terms of the size
and shape of the elements. The fibres in the R200 fractions of LW (Figure 8.14, A)
ranged from very fme bundles of fibrils, to large fragments of fibre wall while the
elements of the R200 fraction of EW (Figure 8.14, B) were rather chunky, under
developed and broken.
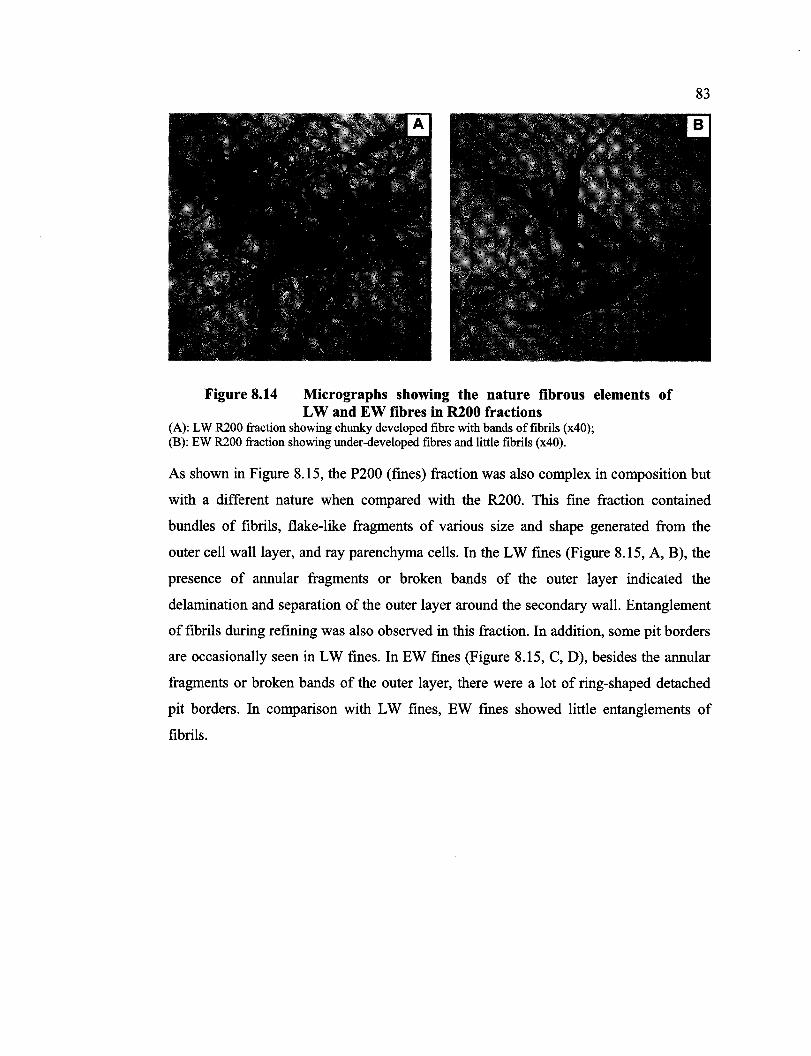
Reproduced with permission of the copyright owner. Further reproduction prohibited without permission.
Figure 8.14 Micrographs showing the nature fibrous elements of LW and EW fibres in R200 fractions
(A): LW R200 fraction showing chunky developed fibre with bands offibrils (x40); (B): EW R200 fraction showing under-developed fibres and little fibrils (x40).
83
As shown in Figure 8.15, the P200 (fines) fraction was also complex in composition but
with a different nature when compared with the R200. This fme fraction contained
bundles of fibrils, flake-like fragments of various size and shape generated from the
outer cell wall layer, and ray parenchyma cells. In the LW fines (Figure 8.15, A, B), the
presence of annular fragments or broken bands of the outer layer indicated the
delamination and separation of the outer layer around the secondary wall. Entanglement
of fibrils during refining was also observed in this fraction. In addition, sorne pit borders
are occasionally seen in LW fines. In EW fmes (Figure 8.15, C, D), besides the annular
fragments or broken bands of the outer layer, there were a lot of ring-shaped detached
pit borders. In comparison with LW fines, EW fines showed little entanglements of
fibrils.
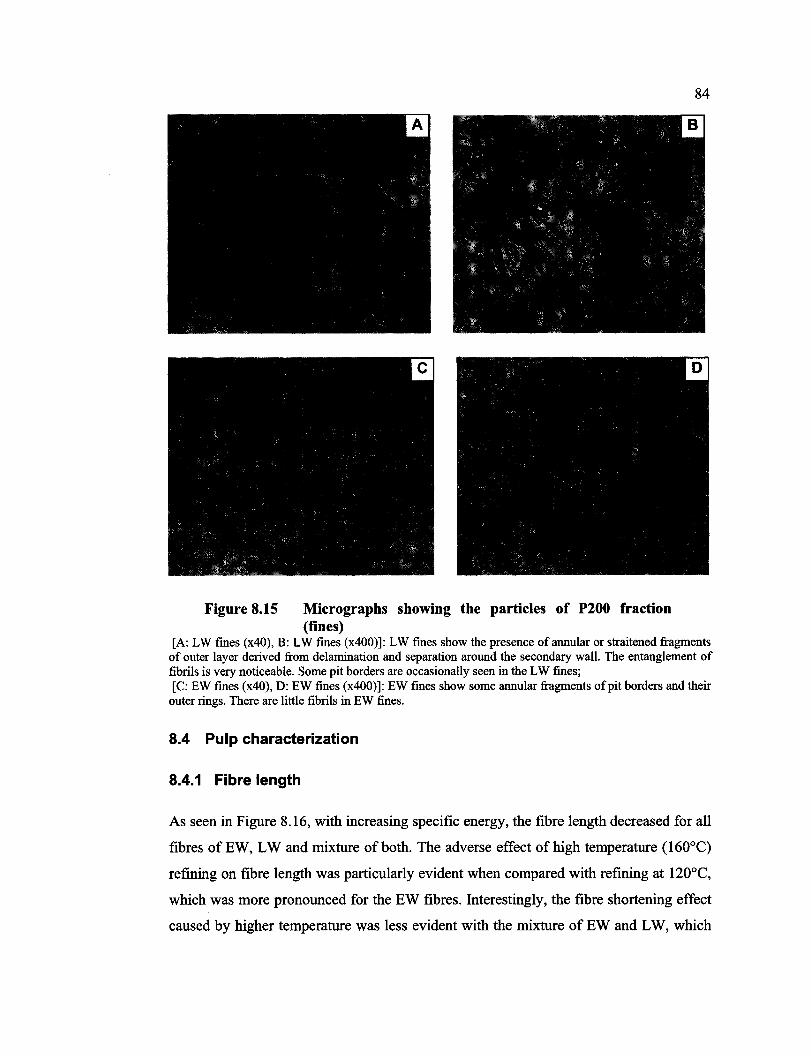
Reproduced with permission of the copyright owner. Further reproduction prohibited without permission.
84
Figure 8.15 Micrographs showing the particles of P200 fraction (fines)
[A: LW fines (x40), B: LW fines (x400)]: LW fmes show the presence ofannular or straitened fragments of outer layer derived from delamination and separation around the secondary wall. The entanglement of fibrils is very noticeable. Sorne pit borders are occasionally seen in the LW fmes; [C: EW fines (x40), D: EW fines (x400)]: EW fmes show sorne annular fragments ofpit borders and their
outer rings. There are little fibrils in EW fines.
8.4 Pulp characterization
8.4.1 Fibre length
As seen in Figure 8.16, with inereasing specifie energy, the fibre length deereased for aU
fibres ofEW, LW and mixture ofboth. The adverse effeet ofhigh temperature (160°C)
refming on fibre length was partieularly evident when eompared with refming at 120°C,
whieh was more pronouneed for the EW fibres. Interestingly, the fibre shortening effeet
caused by higher temperature was less evident with the mixture of EW and LW, whieh
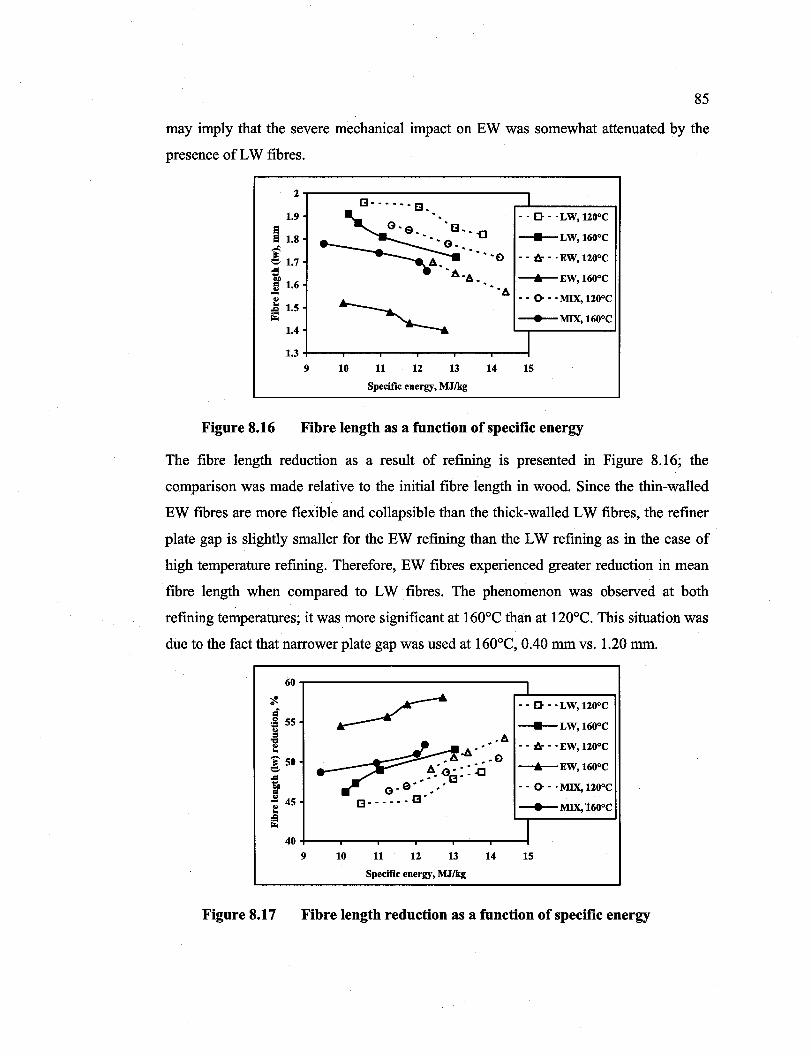
Reproduced with permission of the copyright owner. Further reproduction prohibited without permission.
85
may imply that the severe mechanical impact on EW was somewhat attenuated by the
presence of LW fibres.
2
S;: 1 1.9 • - 0 - . LW, 1200e
a ~"G~:'<l ____ LW, 1600e a 1.8
~ 1.7 - - - -e - - i:Jr - ·EW, 1200e A.
~ • A-A __ ----""-EW, 1600 e 011 J 1.6 --A ..
~ - - ()o - • MIX, 1200 e
li: 1.5 rs --e-MIX, 1600 e 1.4
J 1.3
9 10 11 12 13 14 15
Specifie energy, MJ/kg
Figure 8.16 Fibre length as a function of specifie energy
The fibre length reduction as a result of refining is presented in Figure 8.16; the
comparison was made relative to the initial fibre length in wood. Since the thin-walled
EW fibres are more flexible and collapsible than the thick-walled LW fibres, the refiner
plate gap is slightly smaller for the EW refining than the LW refining as in the case of
high temperature refining. Therefore, EW fibres experienced greater reduction in mean
fibre length when compared to LW fibres. The phenomenon was observed at both
refming temperatures; it was more significant at 160°C than at 120°C. This situation was
due to the fact that narrower plate gap was used at 160°C, 0.40 mmvs. 1.20 mm.
60
~ ..r ~ 55
~ ::: i' 50 e ~ CI .; 45 .. ~
40
Figure 8.17
9 10 11 12 13
Specifie energy, MJ/kg
14
- - 0 - . LW, 1200 e ____ LW, 1600 e
----....-EW, 1600e - - ()o - • MIX, 1200e --e-MIX, 1600e
15
Fibre length reduction as a function of specifie energy
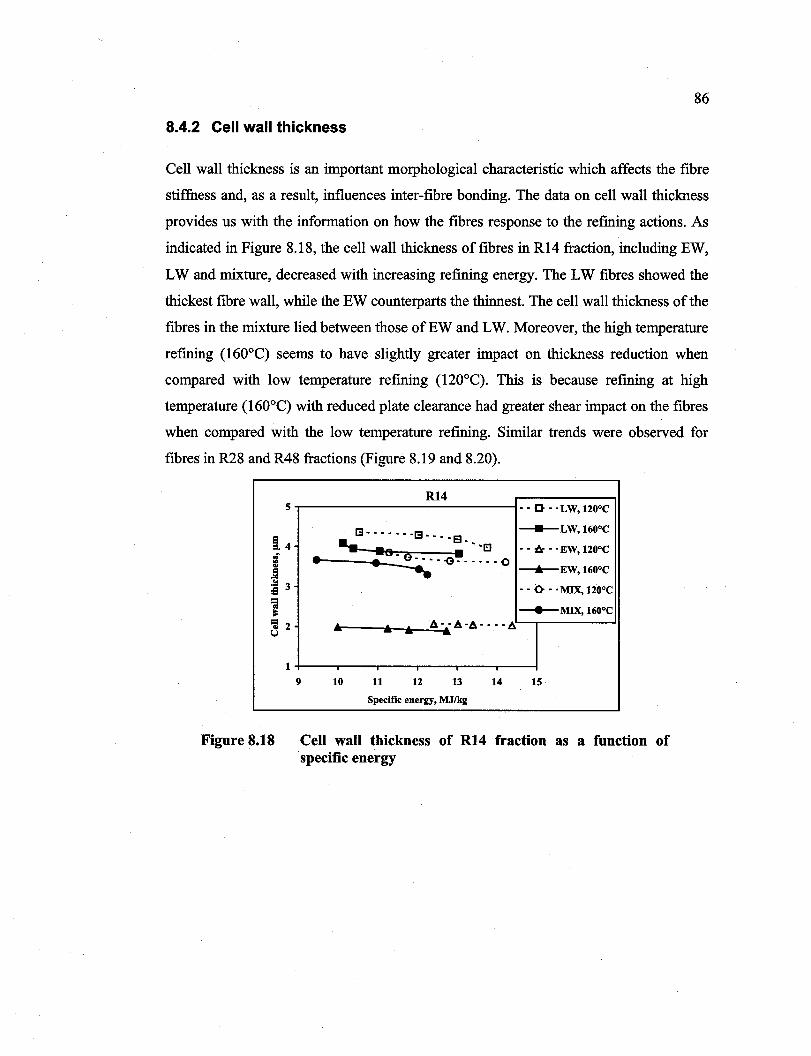
Reproduced with permission of the copyright owner. Further reproduction prohibited without permission.
86
8.4.2 Cell wall thickness
Cell wall thickness is an important morphological characteristic which affects the fibre
stiffness and, as a result, influences inter-fibre bonding. The data on cell wall thickness
provides us with the information on how the fibres response to the refming actions. As
indicated in Figure 8.18, the cell wall thickness of fibres in R14 fraction, including EW,
LW and mixture, decreased with increasing refining energy. The LW fibres showed the
thickest fibre wall, while the EW counterparts the thinnest. The cell wall thickness of the
fibres in the mixture lied between those ofEW and LW. Moreover, the high temperature
refming (160°C) seems to have slightly greater impact on thickness reduction when
compared with low temperature refining (120°C). This is because refining at high
temperature (160°C) with reduced plate clearance had greater shear impact on the fibres
when compared with the low temperature refining. Similar trends were observed for
fibres in R28 and R48 fractions (Figure 8.19 and 8.20).
S
i4 .;; '" .. ~ j 3
~ ~ 2
1
Figure 8.18
R14 - - 0 - . LW, 1200e
13 - - - - - - -[3 - - - - 8 __+__LW, 1600e
..... 6_ ." ""EJ - - {:z - • EW, 1200e • • 0-----0------0 --.. ---....-EW, 1600e
- - 0. - .MIX, 1200 e -+--MIX, 1600 e .. • • I!J.--A,-A,----ti. •
9 10 11 12 13 14 lS
Specifie energy, MJ/kg
Cell wall thickness of R14 fraction as a function of specifie energy
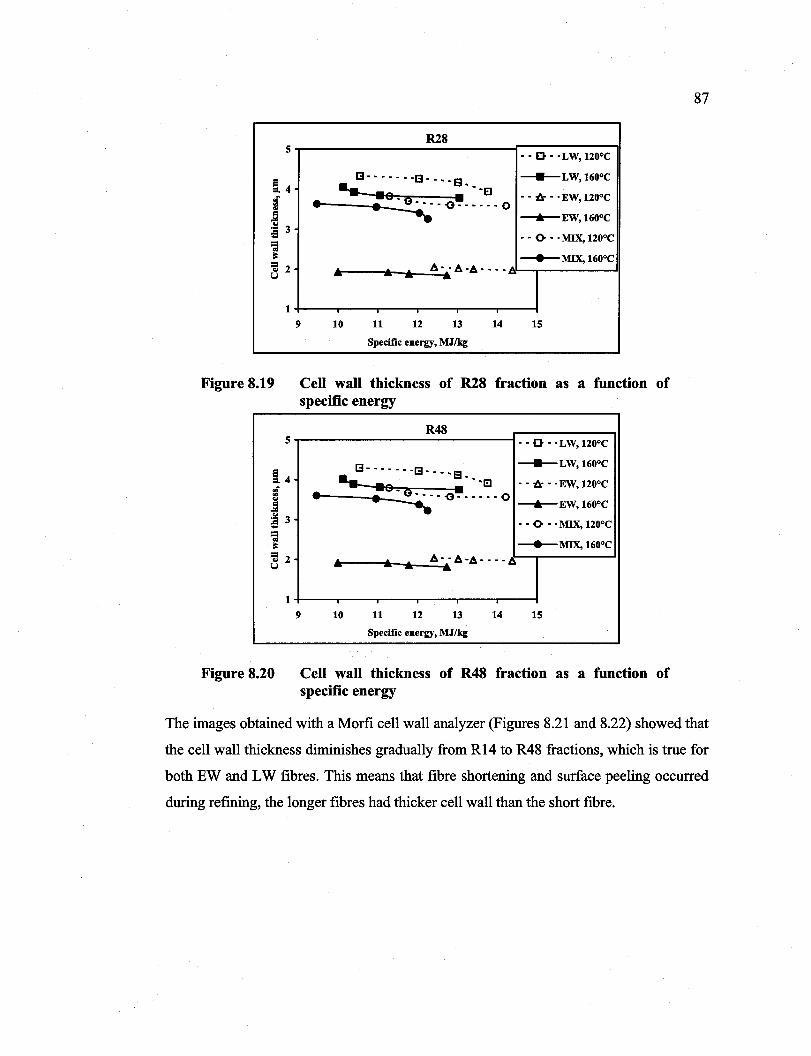
Reproduced with permission of the copyright owner. Further reproduction prohibited without permission.
S
14 ,;; .. .. lâ a 3
~ ::;! 2 u
1
Figure 8.19
S
14 ,;; .. .. lâ :a 3 .... = ~
::;! 2 u
1
Figure 8.20
R28 · . 0 .. LW, 120°C
[3·······13····8 ~LW,160oC
...... 9. • .•• 1:] • • -& •. EW, 120°C • • 0····-0- .... ·0 ---.. ----..-EW, 160°C
• • 0- •. MIX, 120°C
~MIX,160oC
~ • A •• A·A ••.. •
9 10 11 12 13 14 IS
Specifie energy, MJ/kg
Cell wall thickness of R28 fraction as a function of specifie energy
R48 · . 0 .. LW, 120°C
[3 ...... '13 ...• 8 ~LW,160oC
...... 9. • ..• 1:] • • -& •• EW, 120°C
• • 0····-0······0 --.. ----..-EW, 160°C
· . 0- .. MIX, 120°C
~MIX,160oC
~ • • A·'A·A·",E. •
9 10 11 12 13 14 IS
Specifie energy, MJ/kg
Cell wall thickness of R48 fraction as a function of specifie energy
87
The images obtained with a Morfi cell wall analyzer (Figures 8.21 and 8.22) showed that
the cell wall thickness diminishes gradually from R14 to R48 fractions, which is true for
both EW and LW fibres. This means that fibre shortening and surface peeling occurred
during refming, the longer fibres had thicker cell wall than the short fibre.
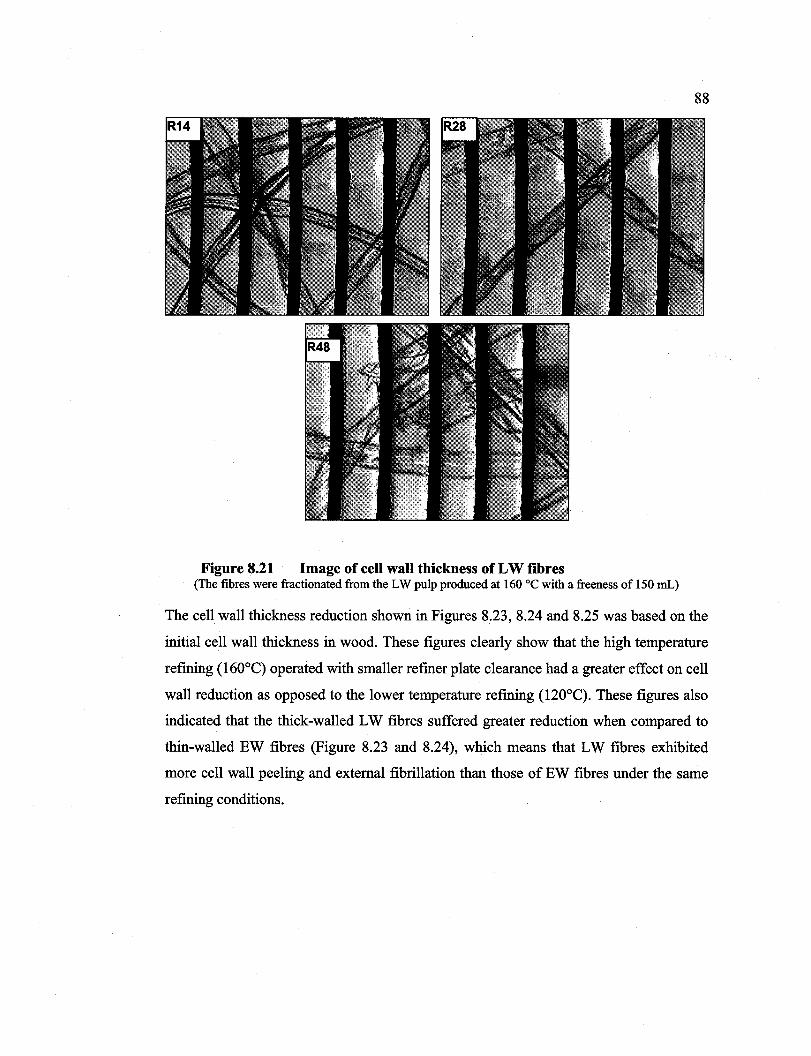
Reproduced with permission of the copyright owner. Further reproduction prohibited without permission.
88
Figure 8.21 Image of cell wall thickness of LW fibres (The fibres were fractionated from the LW pulp produced at 160 oC with a freeness of 150 mL)
The cell wall thickness reduction shown in Figures 8.23, 8.24 and 8.25 was based on the
initial cell wall thickness in wood. These figures clearly show that the high temperature
refining (160°C) operated with smaller refmer plate clearance had a greater effect on cell
wall reduction as opposed to the lower temperature refming (120°C). These figures also
indicated that the thick-walled LW fibres suffered greater reduction when compared to
thin-walled EW fibres (Figure 8.23 and 8.24), which means that LW fibres exhibited
more cell wall peeling and external fibrillation than those of EW fibres under the same
refming conditions.
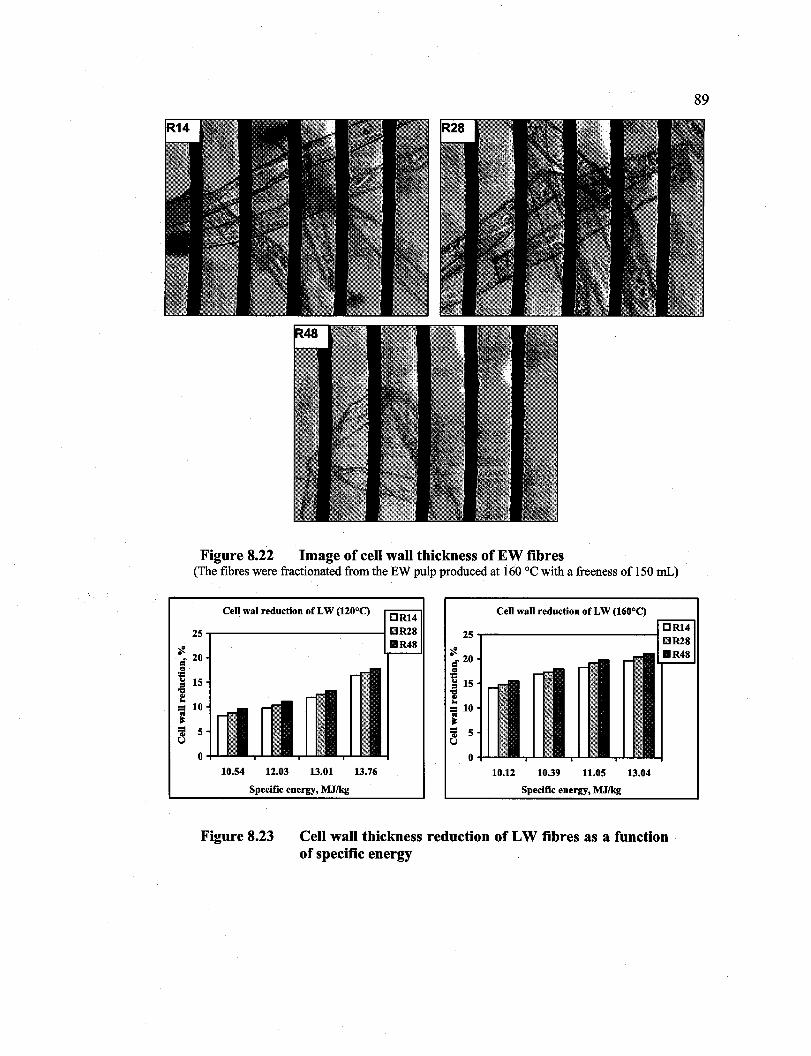
Reproduced with permission of the copyright owner. Further reproduction prohibited without permission.
Figure 8.22 Image of eell wall thiekness of EW fibres (The fibres were fractionated from the EW pulp produced at 160 oC with a freeness of 150 mL)
~
Cell wal reduction of LW (120°C) DR14
25 "T"""-------------., DlR28 IIR48
.. 20
i ... 15
i = 10 ~ ~ 5
o 10.54 12.03 13.01 13.76
Specifie energy, MJ/kg
Cell wall reduction of LW (160°C)
25"T"""----------~ DR14
o 10.12 10.39 11.05 13.04
Specificenergy,MJIkg
Figure 8.23 Cell wall thiekness reduetion of LW fibres as a function of specifie energy
89
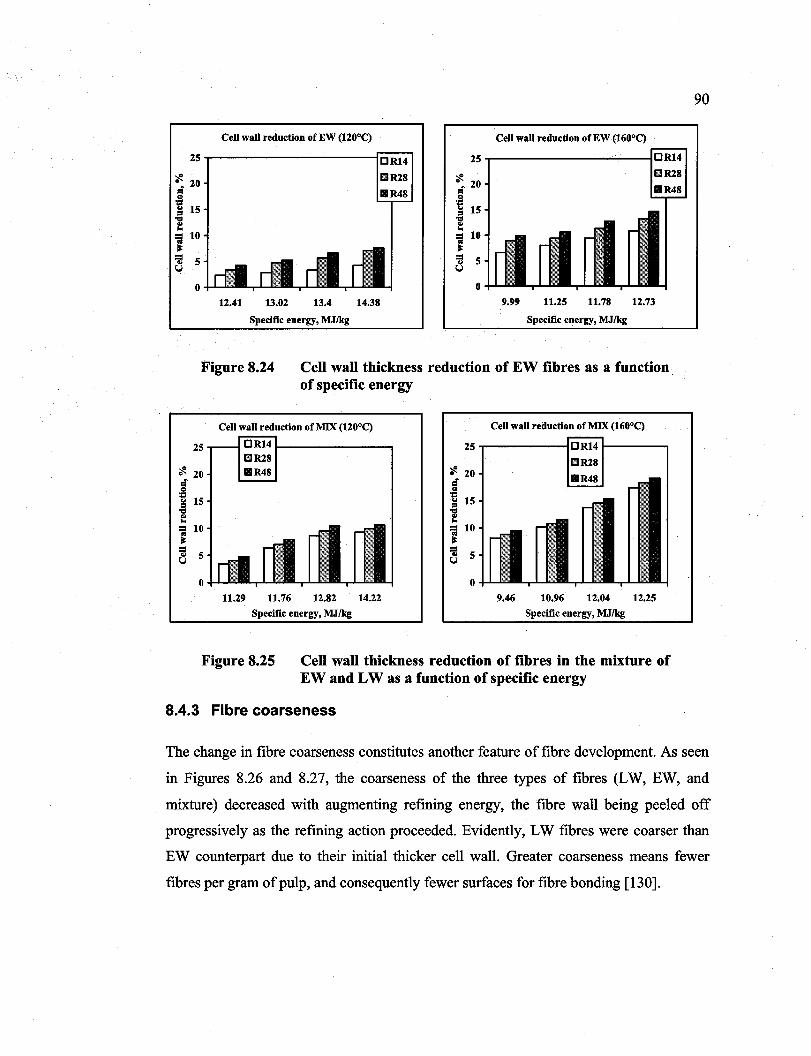
Reproduced with permission of the copyright owner. Further reproduction prohibited without permission.
Cell wall reduetion of EW (120°C)
25~--------------------~C~R~1~4
o 12.41 13.02 13.4
Specifie energy, MJIkg
14.38
tmlR28 IIR48
Cell wall reduetion of EW (160°C)
25~----------~------~
~ 20 = ..
'1:1 .. 15
~ = 10 ~ ~ 5
o 9.99 11.25 11.78 12.73
Specifie energy, MJIkg
Figure 8.24 Cell wall thickness reduction of EW fibres as a function. of specifie energy
25
~ 20
] .. 15
~ = 10 ~ ~ 5
o
Cell wall reduetion of MIX (120°C)
CR14 1-------------...., 81R28 IIR48
11.29 11.76 12.82 14.22
Specifie energy, MJIkg
Cell wall reduetion of MIX (160°C)
25 .,.------ICR14 1-------,
mR28
o 9.46 10.96 12.04 12.25
Specifie energy, MJIkg
Figure 8.25 Cell wall thickness reduction of fibres in the mixture of EW and LW as a function of specifie energy
8.4.3 Fibre coarseness
90
The change in fibre coarseness constitutes another feature of fibre development. As seen
in Figures 8.26 and 8.27, the coarseness of the three types of fibres (LW, EW, and
mixture) decreased with augmenting refming energy, the fibre wall being pee1ed off
progressively as the refming action proceeded. Evidently, LW fibres were coarser than
EW counterpart due to their initial thicker cell wall. Greater coarseness means fewer
fibres per gram ofpulp, and consequently fewer surfaces for fibre bonding [130].
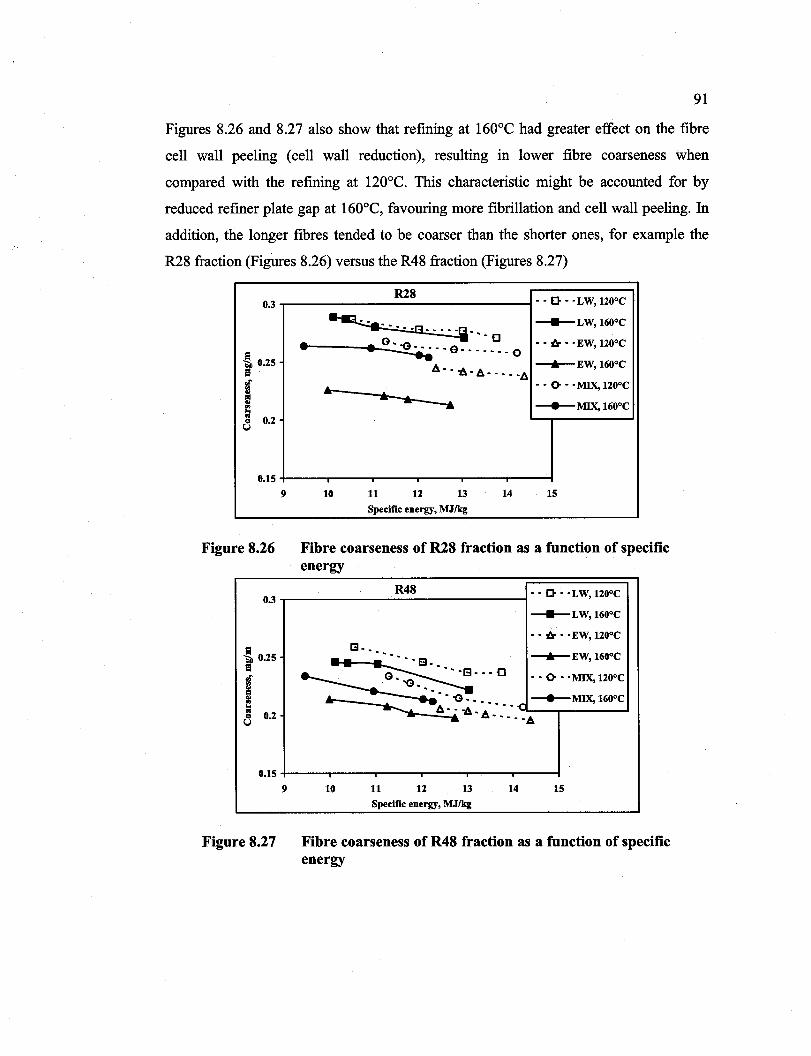
Reproduced with permission of the copyright owner. Further reproduction prohibited without permission.
91
Figures 8.26 and 8.27 also show that refining at 160°C had greater effect on the fibre
cell wall peeling (cell wall reduction), resulting in lower fibre coarseness when
compared with the refining at 120°C. This characteristic might be accounted for by
reduced refiner plate gap at 160°C, favouring more fibrillation and cell wall peeling. In
addition, the longer fibres tended to be coarser than the shorter ones, for example the
R28 fraction (Figures 8.26) versus the R48 fraction (Figures 8.27)
0.3
~ 0.25 El .;; '" .. = .. C ou
0.2 ~ U
0.15
9
Figure 8.26
0.3
~ 0.25 El .;; '" al .. C ou
0.2 ~
U
0.15
9
Figure 8.27
R28 - - 0 - . LW, 1200e
~ ___ LW, 1600e - - - - -13 - - - - -=i-
- - 0 - - {Jr - • EW, 1200e • • G~--o _______ o ---tk---EW, 1600e A- - -t.. A-- - - - - -A - - 0- - .MIX, 1200 e
Â-.~- -...... ___ MIX, 1600 e
10 11 12 13 14 15
Specüicenergy,~J/kg
Fibre coarseness of R28 fraction as a function of specifie energy
R48 - - 0 - . LW, 1200 e ___ LW, 1600e
- - {Jr - • EW, 1200e [3 - _
~ ---tk---EW, 1600e
~""I3"'C - - 0- - .MIX, 1200 e - -G_ ___ MIX, 1600e ..... ............ ----"G---- ___ -t
A- --A --. - A-- - - --A
10 11 12 13 14 15
Specifie energy, ~Ikg
Fibre coarseness of R48 fraction as a function of specifie energy
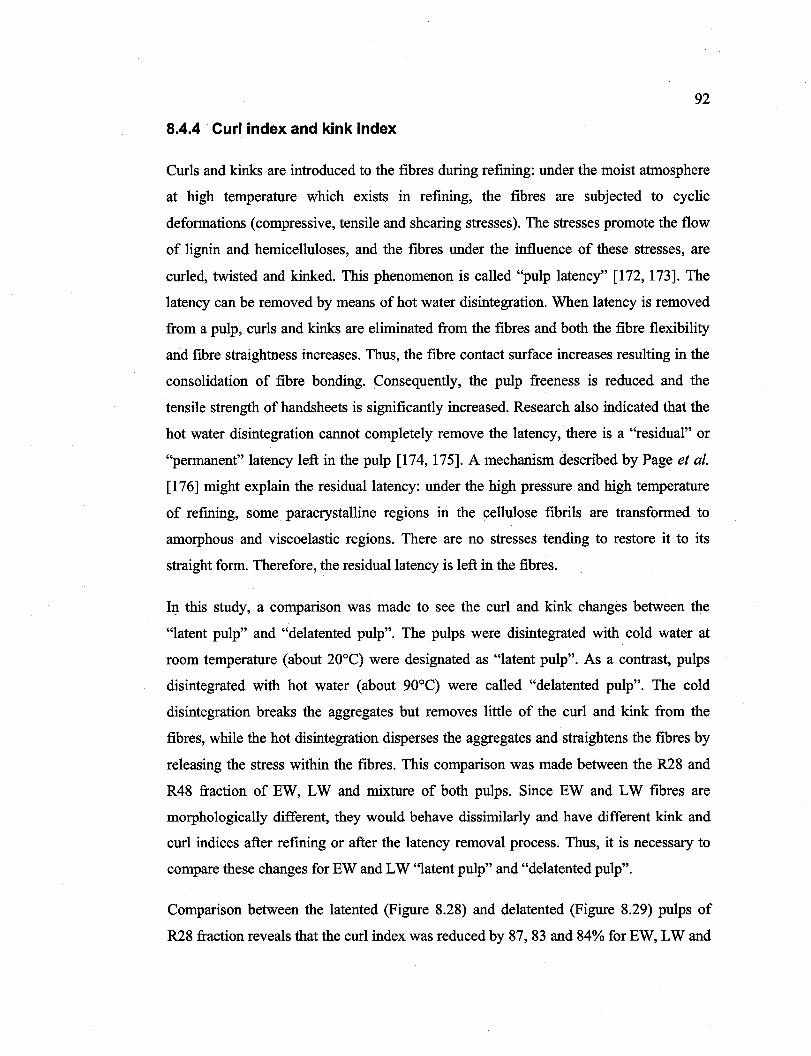
Reproduced with permission of the copyright owner. Further reproduction prohibited without permission.
92
8.4.4 Curl index and kink index
CurIs and kinks are introduced to the fibres during refming: under the moist atmosphere
at high temperature which exists in refining, the fibres are subjected to cyclic
deformations (compressive, tensile and shearing stresses). The stresses promote the flow
of lignin and hemicelluloses, and the fibres under the influence of these stresses, are
curIe d, twisted and kinked. This phenomenon is called "pulp latency" [172, 173]. The
latency can be removed by means of hot water disintegration. When latency is removed
from a pulp, curIs and kinks are eliminated from the fibres and both the fibre flexibility
and fibre straightness increases. Thus, the fibre contact surface increases resulting in the
consolidation of fibre bonding. Consequently, the pulp freeness is reduced and the
tensile strength of handsheets is significantly increased. Research also indicated that the
hot water disintegration cannot completely remove the latency, there is a "residual" or
"permanent" latency left in the pulp [174, 175]. A mechanism described by Page et al.
[176] might explain the residuallatency: under the high pressure and high temperature
of refming, sorne paracrystalline regions in the cellulose fibrils are transformed to
amorphous and viscoelastic regions. There are no stresses tending to restore it to its
straight form. Therefore, the residuallatency is left in the fibres.
In this study, a comparison was made to see the curl and kink changes between the
"latent pulp" and "delatented pulp". The pulps were disintegrated with cold water at
room temperature (about 20°C) were designated as "latent pulp". As a contrast, pulps
disintegrated with hot water (about 90°C) were called "delatented pulp". The cold
disintegration breaks the aggregates but removes little of the curl and kink from the
fibres, while the hot disintegration disperses the aggregates and straightens the fibres by
releasing the stress within the fibres. This comparison was made between the R28 and
R48 fraction of EW, LW and mixture of both pulps. Since EW and LW fibres are
morphologically different, they would behave dissimilarly and have different kink and
curI indices after refining or after the latency removal process. Thus, it is necessary to
compare these changes for EW and LW "latent pulp" and "delatented pulp".
Comparison between the latented (Figure 8.28) and delatented (Figure 8.29) pulps of
R28 fraction reveals that the curI index was reduced by 87,83 and 84% for EW, LW and
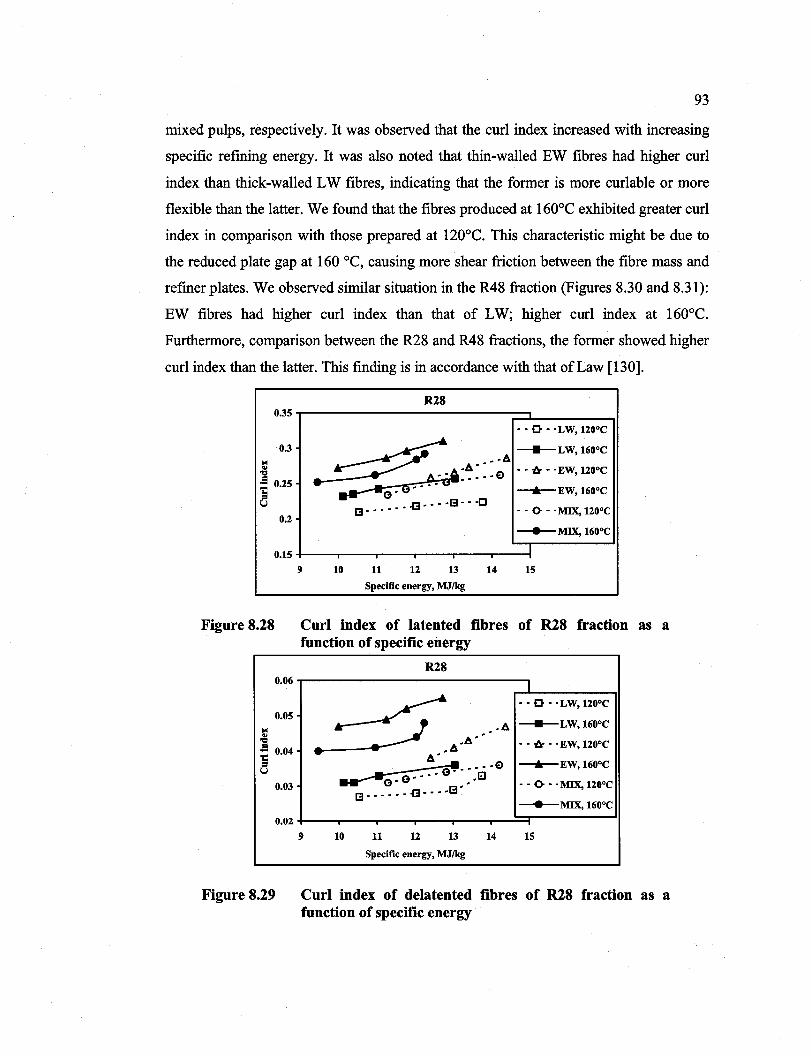
Reproduced with permission of the copyright owner. Further reproduction prohibited without permission.
93
mixed pulps, respective1y. It was observed that the curl index increased with increasing
specific refining energy. It was also noted that thin-walled EW fibres had higher curl
index than thick-walled LW fibres, indicating that the former is more curlable or more
flexible than the latter. We found that the fibres produced at 160°C exhibited greater curl
index in comparison with those prepared at 120°C. This characteristic might be due to
the reduced plate gap at 160 oC, causing more shear friction between the fibre mass and
refmer plates. We observed similar situation in the R48 fraction (Figures 8.30 and 8.31):
EW fibres had higher curl index than that of LW; higher curl index at 160°C.
Furthermore, comparison between the R28 and R48 fractions, the former showed higher
curl index than the latter. This finding is in accordance with that of Law [130].
0.35
0.3
'" .. ..., ::! 0.25 .. := U
0.2
0.15
Figure 8.28
0.06
0.05
'" ~ ::! 0.04 ~ U
0.03
0.02
Figure 8.29
R28
· . 0 .. LW, 120°C
__+__LW,160oc ~~ •• A A' • • • iJr •• EW, 120°C ?o:a': .. ' .E)
"'---G,G" --..-EW, 160°C .f3 ••• ·13 ••• []
[3' ••••• · . <> .. MIX, 120°C
--MlX, 160°C
1
9 10 11 12 13 14 15
Specifie energy, MJIkg
Curl index of latented fibres of R28 fraction as a function of specifie energy
R28
1
~ · . 0 .. LW, 120°C
~ ,A,A' , ,b. __+__LW,160oc
, • • iJr •• EW, 120°C
A' --"-EW,160°c ~ •••• E) o .. ·· o·' El
G' " · . <> .. MIX, 120°C [3 •••••• .[3 •••• 13'
--MIX, 160°C
9 10 11 12 13 14 15
Specifie energy, MJ/kg
Curl index of delatented fibres of R28 fraction as a function of specifie energy
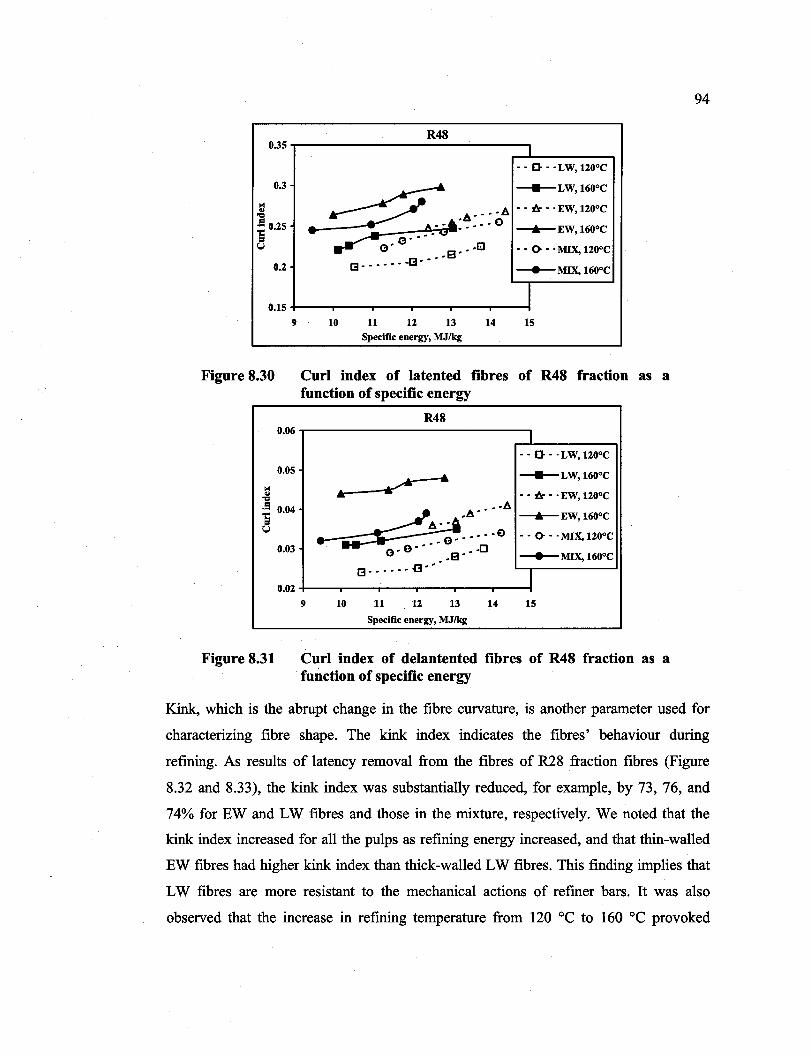
Reproduced with permission of the copyright owner. Further reproduction prohibited without permission.
0.35
0.3
I0OI
~ :! 0.25 la u
0.2
0.15
9
Figure 8.30
0.06
0.05
I0OI
~ :! 0.04 .. ::1 U
0.03
0.02
Figure 8.31
R48 1
· . 0 .. LW, 120°C
~o':~:::ôA __+__LW, 160°C
• • iJr •. EW, 120°C
• ---.-EW, 160°C
~ •• _8.··El • . 0- .. MIX, 120°C [3 ••••••• [3
--MIX, 160°C
1
10 11 12 13 14 15 Specifie energy, MJIkg
Curl index of latented fibres of R48 fraction as a function of specifie energy
R48
1 · . 0 .. LW, 120°C
__+__LW, 160°C
~ ...
 • • iJr •• EW, 120°C
-u::~:~::;~;t ... ·A ---.-EW, 160°C
•••• E> · . 0- .. MIX, 120°C G- e- _ .. e·· _.[J
__ MIX,160oC .. 8· [3 •••••• .[3 - -
1
9 10 11 12 13 14 15
Specifie energy, MJIkg
Curl index of delantented fibres of R48 fraction as a function of specifie energy
94
Kink, which is the abrupt change in the fibre curvature, is another parameter used for
characterizing fibre shape. The kink index indicates the fibres' behaviour during
refming. As results of latency removal from the fibres of R28 fraction fibres (Figure
8.32 and 8.33), the kink index was substantially reduced, for example, by 73, 76, and
74% for EW and LW fibres and those in the mixture, respectively. We noted that the
kink index increased for all the pulps as refining energy increased, and that thin-walled
EW fibres had higher kink index than thick-walled LW fibres. This finding implies that
LW fibres are more resistant to the mechanical actions of refmer bars. It was also
observed that the increase in refming temperature from 120 oC to 160 oC provoked

Reproduced with permission of the copyright owner. Further reproduction prohibited without permission.
95
higher kink index, which is probably due to the greater shear action caused by the
reduced refiner plate gap. Similar tendencies were also observed for the fibres of the
R48 fraction (Figures 8.34 and 8.35): EW fibres had higher kink index than LW fibres;
high refining temperature incurred more kink fibres. In comparison with the fibres of
R48 fraction, those of R28 fraction had greater kink index, i.e. the longer fibre (R28)
exhibited higher kink index than the shorter ones (R48), which is similar to the
tendencies described for the curl index.
R28 2.4..,.-----------,r---------,
2.2
1.8
··0· 'LW 1200 e .t:J. '
/1" ~LW,160oe .. ' .,.0
A.· g .' •• iJr • 'EW, 1200 e .• .o" .,C1 0' . • 8' --.--EW, 1600 e
• • l3'" G •••• • • () •. MIX, 1200 e
___ MIX, 1600 e
1.6 +--.....,.-----,--"T"'""---,----,r----1
9
Figure 8.32
10 11 12 13 14 15
Specifie energy, MJ/kg
Kink index of latented fibres of R28 fraction as a function of specifie energy
R28 0.8 ...-----------------.1 0.7
~ 0.6 ~ ~ 0.5
~ 0.4
0.3
· . 0 .. LW, 1200 e
~LW,160oe
• • iJr •. EW, 1200 e
--.--EW, 1600 e
• • () •. MIX, 1200 e
---MIX, 1600e
1 0.2 +----,----,r--..,.----r--r----I 9
Figure 8.33
10 11 12 13 14 15
Specificenergy,MJfkg
Kink index of delatented fibres of R28 fraction as a function specifie energy
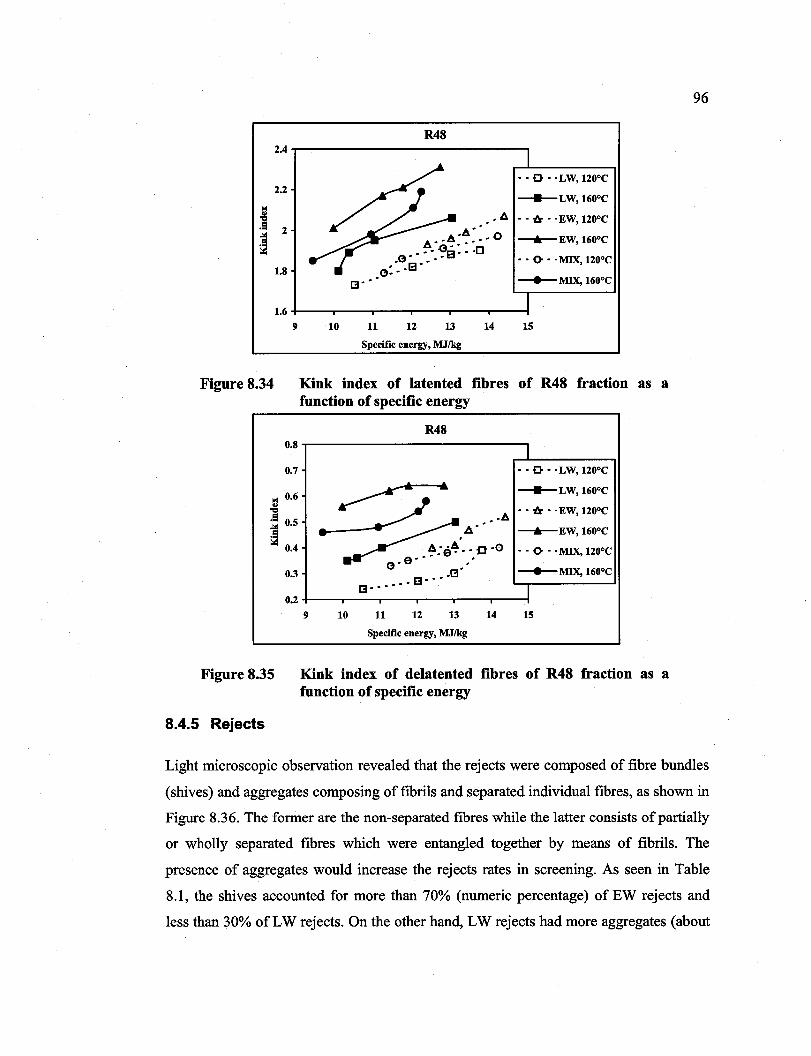
Reproduced with permission of the copyright owner. Further reproduction prohibited without permission.
R48 2.4 T"""----------------,
2.2
1.8
A' •
• • 0 •. LW, 120°C
____ LW, 160°C
• Il. •• l!r •• EW, 120°C
A.·A· •••• O --Â-EW, 160°C .' 6 S·:··D
G" .' .' 13 • • • • 0- • . MIX, 120°C G·· •
[3'" ~MIX, 160°C
1.6 +--"""'T"----,,.---...---"""'T"----,,.-----! 9
Figure 8.34
0.8
0.7
~ 0.6 ~ ~ 0.5
~ 0.4
0.3
0.2
Figure 8.35
8.4.5 Rejects
10 11 12 13 14 15
Specifie energy, MJIkg
Kink index of latented fibres of R48 fraction as a function of specifie energy
R48
1 ··0· . LW, 120°C
~ ____ LW, 160°C
• • l!r •• EW, 120°C ~ ••• 6 ~. --Â-EW, 160°C
'f:é~'" 0.0 · . 0- .. MIX, 120°C e' . . G' .'
~MIX,160oc E3 •••• [3 [3' ••••• T
9 10 11 12 13 14 15
Specifie energy, MJ/kg
Kink index of delatented fibres of R48 fraction as a function of specifie energy
96
Light microscopie observation revealed that the rejects were composed of fibre bundles
(shives) and aggregates composing offibrils and separated individual fibres, as shown in
Figure 8.36. The former are the non-separated fibres while the latter consists of partially
or wholly separated fibres which were entangled together by means of fibrils. The
presence of aggregates would increase the rejects rates in screening. As seen in Table
8.1, the shives accounted for more than 70% (numeric percentage) of EW rejects and
less than 30% of LW rejects. On the other hand, LW rejects had more aggregates (about
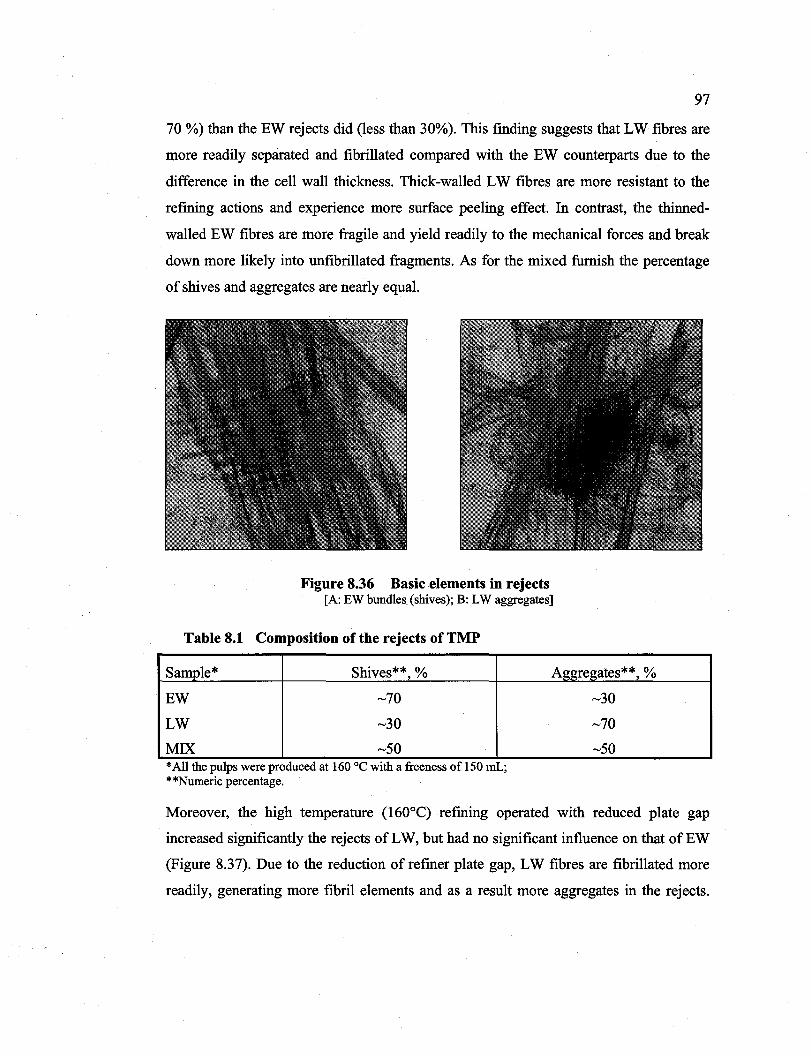
Reproduced with permission of the copyright owner. Further reproduction prohibited without permission.
97
70 %) than the EW rejects did (less than 30%). This finding suggests that LW fibres are
more readily separated and fibrillated compared with the EW counterparts due to the
difference in the cell wall thickness. Thick-walled LW fibres are more resistant to the
refming actions and experience more surface peeling effect. In contrast, the thinned
walled EW fibres are more fragile and yield readily to the mechanical forces and break
down more likely into unfibrillated fragments. As for the mixed furnish the percentage
of shives and aggregates are nearly equal.
Figure 8.36 Basic elements in rejects [A: EWbundles(shives); B: LW aggregates]
Table 8.1 Composition of the rejects of TMP
Sample* Shives**, % Aggregates**, %
EW ~70
LW ~30
MIX ~50
* AH the pulps were produced at 160 oC wlth a freeness of 150 mL; **Numeric percentage.
~30
~70
~50
Moreover, the high temperature (160°C) refining operated with reduced plate gap
increased significantly the rejects of LW, but had no significant influence on that ofEW
(Figure 8.37). Due to the reduction of refmer plate gap, LW fibres are fibrillated more
readily, generating more fibril e1ements and as a result more aggregates in the rejects.
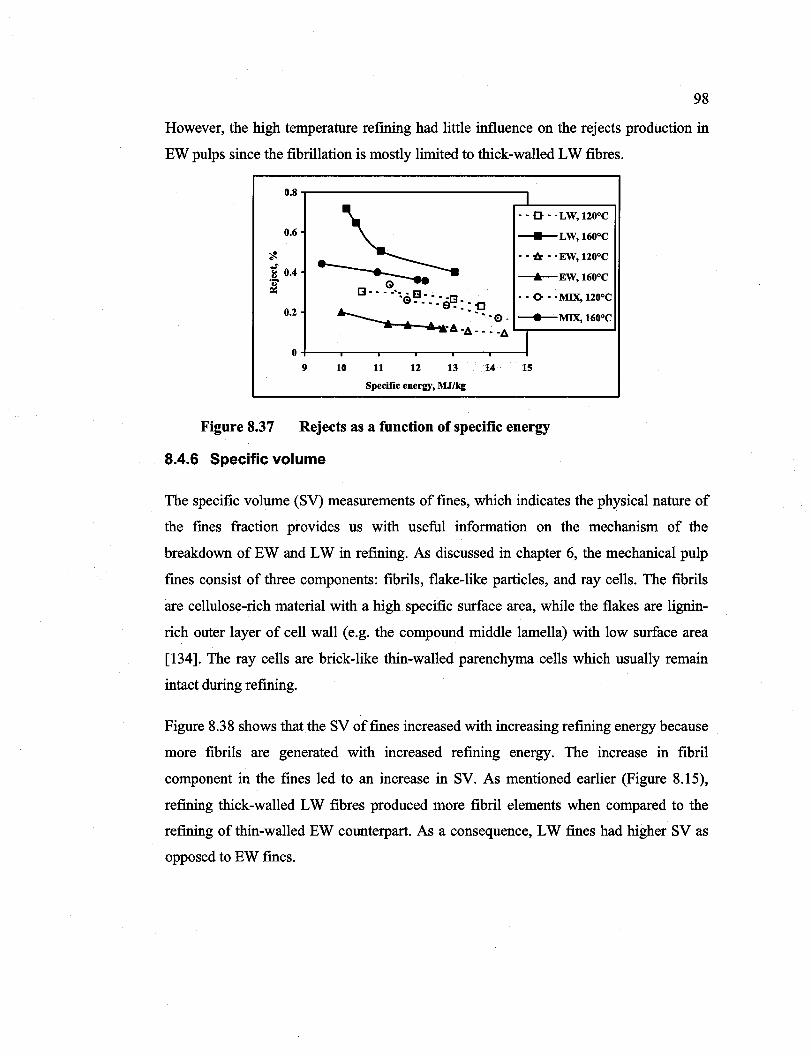
Reproduced with permission of the copyright owner. Further reproduction prohibited without permission.
98
However, the high temperature refining had little influence on the rejects production in
EW pulps since the fibrillation is mostly limited to thick-walled LW fibres.
0.8 1
· . 0 .. LW, 1200 e
0.6 ~LW,160oe
~
~ · . tr .. EW, 1200 e
~ 0.4 ----'-EW, 1600 e ~ [3 •••• '~ • E3 ••• • • () •. MIX, 1200 e G····ë~:·,o
0.2 ~ ····a, ---+--MIX, 1600 e ·A·A· ••• A
1 0
9 10 11 12 13 14 15
Specifie energy, MJIkg
Figure 8.37 Rejects as a function of specifie energy
8.4.6 Specifie volume
The specifie volume (SV) measurements of fines, which indicates the physical nature of
the fmes fraction provides us with useful information on the mechanism of the
breakdown of EW and LW in refining. As discussed in chapter 6, the mechanical pulp
fmes consist of three components: fibrils, flake-like partic1es, and ray cells. The fibrils
are cellulose-rich material with a high specifie surface area, while the flakes are lignin
rich outer layer of cell wall (e.g. the compound middIe lamella) with low surface area
[134]. The ray cells are brick-like thin-walled parenchyma cells which usually remain
intact during refining.
Figure 8.38 shows that the SV of fines increased with increasing refining energy because
more fibrils are generated with increased refining energy. The increase in fibril
component in the fines led to an increase in SV. As mentioned earlier (Figure 8.15),
refining thick-walled LW fibres produced more fibril elements when compared to the
refining of thin-walled EW counterpart. As a consequence, LW fines had higher SV as
opposed to EW fines.
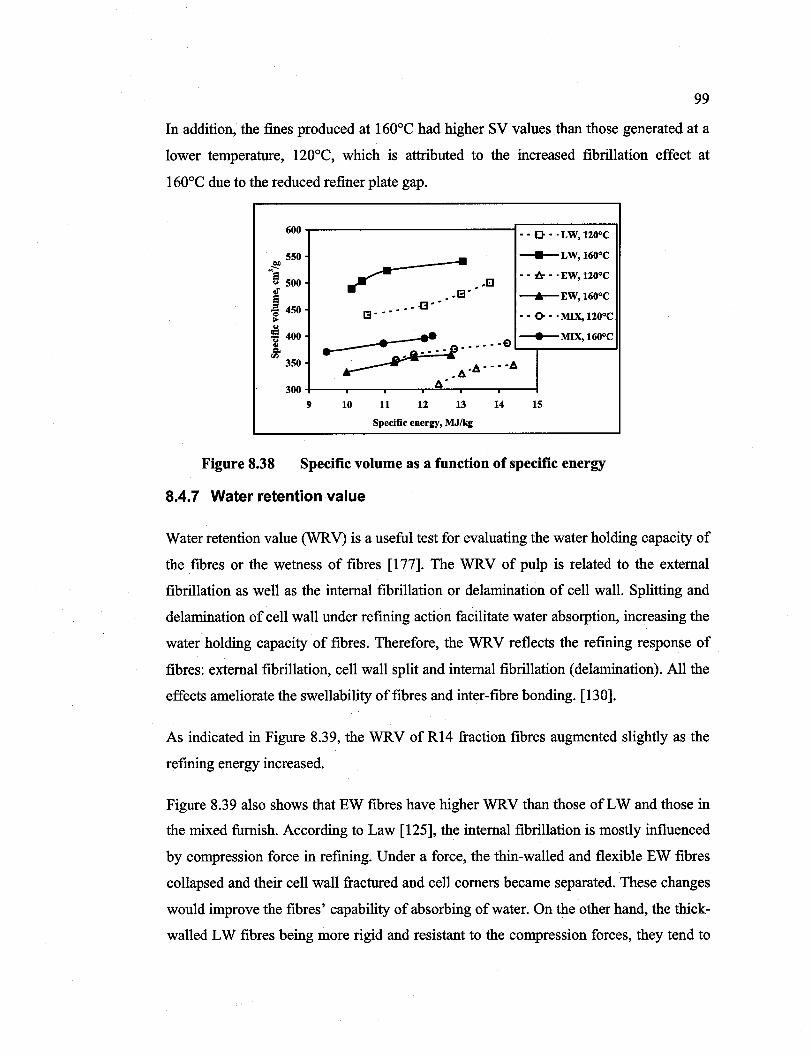
Reproduced with permission of the copyright owner. Further reproduction prohibited without permission.
99
In addition, the fmes produced at 1600 e had higher SV values than those generated at a
lower temperature, 120oe, which is attributed to the increased fibrillation effect at
1600 e due to the reduced refiner plate gap.
600 .. o· 'LW,nooe
550 .... __ LW, 1600 e ... ~
? ~ 500 ,B •• -b: •. EW, nooe
.; ,13 ' ,
~ 450 .[3' '
, -.--EW, 1600 e
;. [3 , ' • ' •• • • () •. MIX, nooe .. !5 400 ~ • • ••••• E> ----MIX, 160
0
e .. =-fil ~A,A""A 350
300 A'
9 10 11 n 13 14 15
Specifie energy, MJ/kg
Figure 8.38 Specifie volume as a function of specifie energy
8.4.7 Water retention value
Water retention value (WRV) is a useful test for evaluating the water holding capacity of
the fibres or the wetness of fibres [177]. The WRV of pulp is related to the external
fibrillation as well as the internaI fibrillation or delamination of cell wall. Splitting and
delamination of cell wall under refining action facilitate water absorption, increasing the
water holding capacity of fibres. Therefore, the WRV reflects the refining response of
fibres: external fibrillation, cell wall split and internaI fibrillation (delamination). AlI the
effects ameliorate the swellability of fibres and inter-fibre bonding. [130].
As indicated in Figure 8.39, the WRV of R14 fraction fibres augmented slightly as the
refming energy increased.
Figure 8.39 also shows that EW fibres have higher WRV than those of LW and those in
the mixed furnish. According to Law [125], the internaI fibrillation is mostly influenced
by compression force in refining. Under a force, the thin-walled and flexible EW fibres
collapsed and their cell wall fractured and cell corners became separated. These changes
would improve the fibres' capability of absorbing ofwater. On the other hand, the thick
walled LW fibres being more rigid and resistant to the compression forces, they tend to
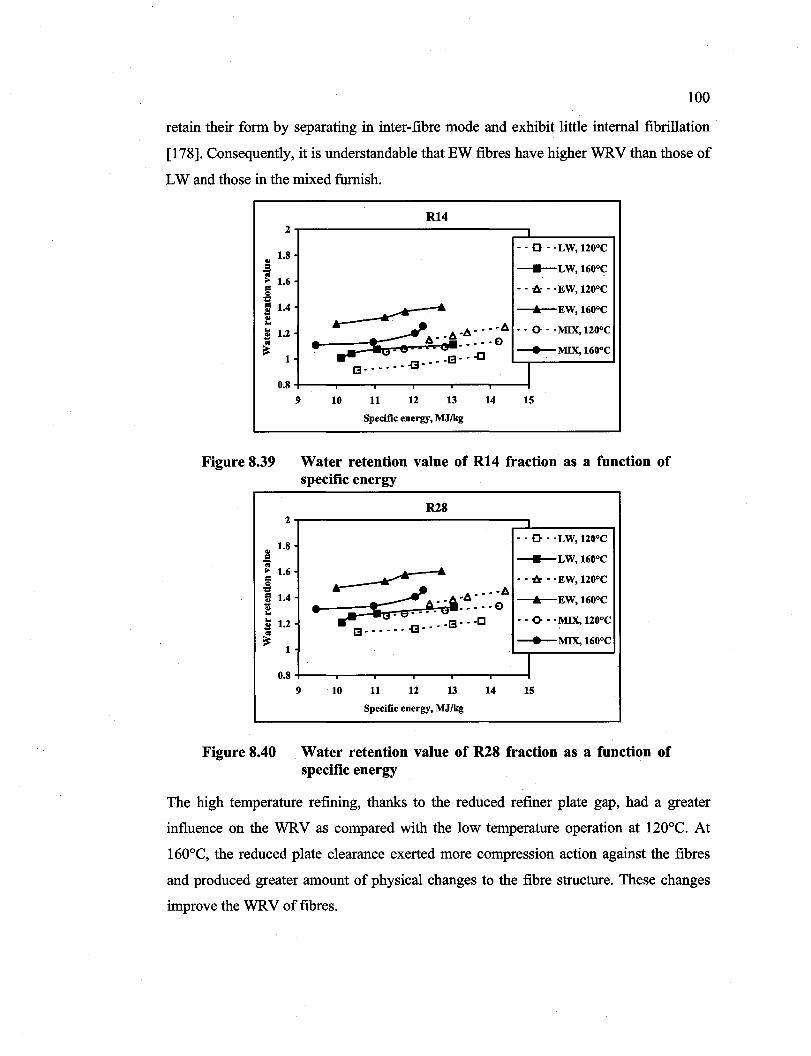
Reproduced with permission of the copyright owner. Further reproduction prohibited without permission.
100
retain their form by separating in inter-fibre mode and exhibit little internaI fibrillation
[178]. Consequently, it is understandable that EW fibres have higher WRV than those of
LW and those in the mixed furnish.
2
... 1.8 = -: 1.6 1:1 ,g e 1.4 t $ 1.2
~ 1
0.8
Figure 8.39
R14
- - 0 - "LW, 1200 e
_____ LW, 1600 e
- - -& - "EW, 1200 e
~ ....... ----.-EW, 1600 e
.- ~ -A - - - -1:. •• 0- - "MIX, 1200 e
• A··I:. __ .E) ..-- ,- . GII· - ___ MIX, 1600 e
13 - •• [J [3_ ••••• .(3 •• _. 1
9 10 11 12 13 14 15
Specifie energy, MJIkg
Water retention value of R14 fraction as a function of specifie energy
R28 2r-----------------~1-----~
... 1.8
i 1.6
~ e 1.4 t • $ 1.2 01
~ 1
. " 0 .. LW, 1200 e _____ LW, 1600e
~ ... _ _. {)o. "EW 1200e k------ , ~~: aQ:~: : : ~I:. ----'-EW, 160
0e .... ~ _13-.·[J .. 0-. "MIX,120oe
[3 •••••• .(3... , ___ MIX, 1600e
1 0.8 +--"""T""----r---r---,----,.----1
Figure 8.40
9 10 11 12 13 14 15
Specifie energy, MJ/kg
Water retention value of R28 fraction as a function of specifie energy
The high temperature refining, thanks to the reduced refiner plate gap, had a greater
influence on the WRV as compared with the low temperature operation at 120°C. At
160°C, the reduced plate clearance exerted more compression action against the fibres
and produced greater amount of physical changes to the fibre structure. These changes
improve the WRV of fibres.
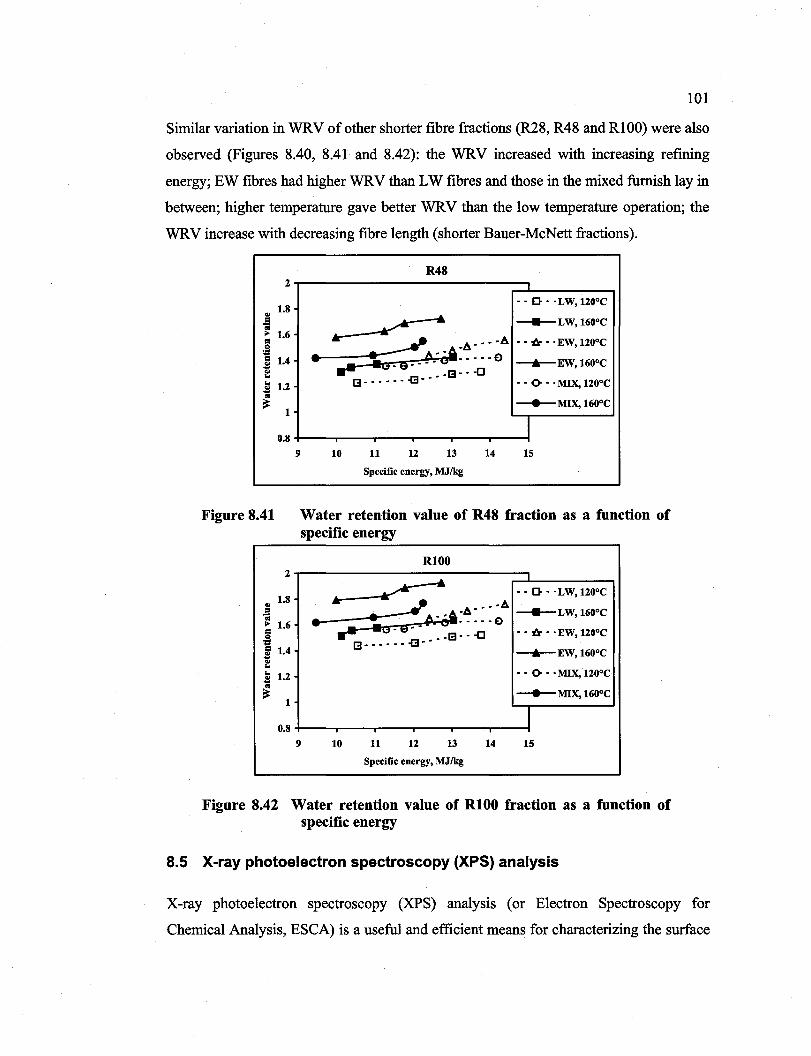
Reproduced with permission of the copyright owner. Further reproduction prohibited without permission.
101
Similar variation in WRV of other shorter fibre fractions (R28, R48 and RlOO) were a1so
observed (Figures 8.40, 8.41 and 8.42): the WRV increased with increasing refming
energy; EW fibres had higher WRV than LW fibres and those in the mixed fumish lay in
between; higher temperature gave better WRV than the low temperature operation; the
WRV increase with decreasing fibre length (shorter Bauer-McNett fractions).
2
.. 1.8
i ~ 1.6 = ,g ;ï 1.4 ... ::: l! 1.2 .. ~
1
0.8
Figure 8.41
R48
- - 0 - -LW, 120°C
~ _A----A
__+__LW,160°C
- - {z - -EW, 120°C
• \;.:7, (': 0'- ----E) ---"'-EW,160oC .... - _-8---0
[3------.[3-- - - <> - -MIX, 120°C
---+-MIX, 160°C
1 9 10 11 12 13 14 15
Specifie energy, MJ/kg
Water retention value of R48 fraction as a function of specifie energy
RIOO
2r-------~~~----~------~ ~ --O--LW,120oC
.. 1.8
i j 1.6
;ï 1.4
~ _-A
.~ -;;; Â _ :A -A - - --+--LW, 160°C .-e------0 ...G~' -_ -8- --0 -- {z --EW,120°C
[3------.[3--
ë ~ 1.2
~ 1
- - <> - . MIX, 120°C
---+-MIX, 160°C
1 0.8 +--""'T"'--..---r---r----r---!
9 10 11 12 13 14 15
Specifie energy, MJ/kg
Figure 8.42 Water retention value of RI00 fraction as a function of specifie energy
8.5 X-ray photoelectron spectroscopy (XPS) analysis
X-ray photoelectron spectroscopy (XPS) analysis (or Electron Spectroscopy for
Chemical Analysis, ESCA) is a useful and efficient means for characterizing the surface
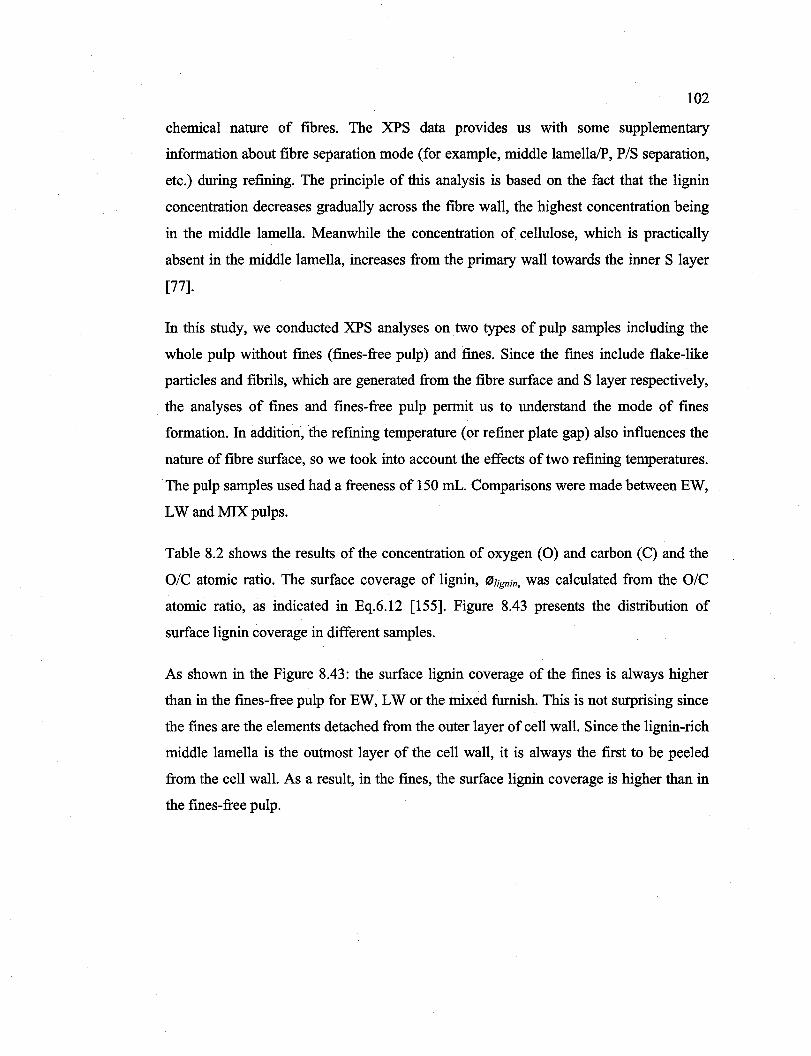
Reproduced with permission of the copyright owner. Further reproduction prohibited without permission.
102
chemical nature of fibres. The XPS data provides us with sorne supplementary
information about fibre separation mode (for example, middle lamellaIP, PIS separation,
etc.) during refming. The principle of this analysis is based on the fact that the lignin
concentration decreases gradually across the fibre wall, the highest concentration being
in the middle lamella. Meanwhile the concentration of cellulose, which is practically
absent in the middle lamella, increases from the primary wall towards the inner S layer
[77].
In this study, we conducted XPS analyses on two types of pulp samples inc1uding the
whole pulp without fmes (fmes-free pulp) and fines. Since the fmes inc1ude flake-like
particles and fibrils, which are generated from the fibre surface and S layer respectively,
the analyses of fines and fines-free pulp permit us to understand the mode of fines
formation. In addition, the refming temperature (or refiner plate gap) also influences the
nature of fibre surface, so we took into account the effects of two refining temperatures.
The pulp samples used had a freeness of 150 mL. Comparisons were made between EW,
LW and MIX pulps.
Table 8.2 shows the results of the concentration of oxygen (0) and carbon (C) and the
O/C atomic ratio. The surface coverage of lignin, (ZJUgnin, was calculated from the O/C
atomic ratio, as indicated in Eq.6.12 [155]. Figure 8.43 presents the distribution of
surface lignin coverage in different samples.
As shown in the Figure 8.43: the surface lignin coverage of the fines is always higher
than in the fines-free pulp for EW, LW or the mixed furnish. This is not surprising since
the fines are the elements detached from the outer layer of cell wall. Since the lignin-rich
middle lamella is the outmost layer of the cell wall, it is always the tirst to be peeled
from the cell wall. As a result, in the fines, the surface lignin coverage is higher than in
the fines-free pulp.
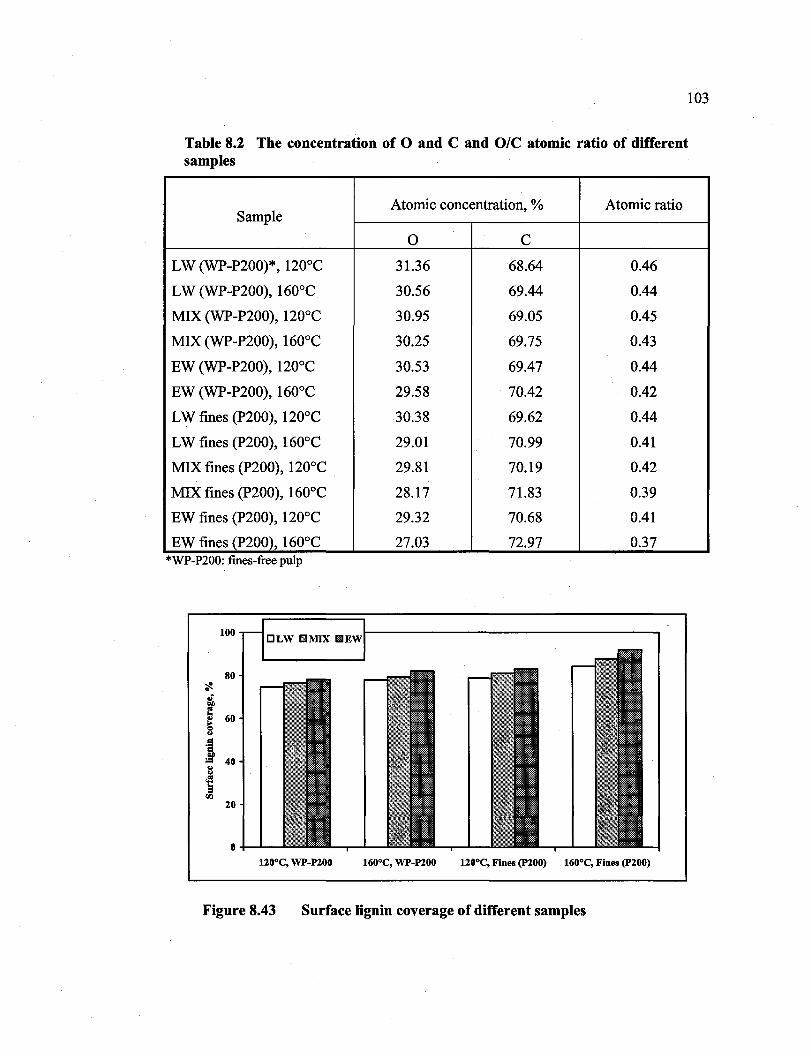
Reproduced with permission of the copyright owner. Further reproduction prohibited without permission.
Table 8.2 The concentration of 0 and C and O/C atomic ratio of different samples
Atomic concentration, % Atomic ratio Sample
0 e LVV(VVP-P200)*, 1200 e 31.36 68.64 0.46
L VV (VVP-P200), 1600 e 30.56 69.44 0.44
MIX (VVP-P200), 1200 e 30.95 69.05 0.45
MIX (VVP-P200), 1600 e 30.25 69.75 0.43
EVV (VVP-P200), 1200 e 30.53 69.47 0.44
EVV (VVP-P200), 1600 e 29.58 70.42 0.42
L VV fines (P200), 1200 e 30.38 69.62 0.44
LVV fmes (P200), 1600 e 29.01 70.99 0.41
MIX fines (P200), 1200 e 29.81 70.19 0.42
MIX fines (P200), 1600 e 28.17 71.83 0.39
EVV fines (P200), 1200 e 29.32 70.68 0.41
EVV fines (P200), 1600 e 27.03 72.97 0.37 *WP-P200: fmes-free pulp
100 []LW BMIX Il
80
.~ ;! 40 .. 1
20
nooe, WP-P200 160oe, WP-P200 nooe, Fines (P200) 160oe, Fines (P200)
Figure 8.43 Surface lignin coverage of different samples
103
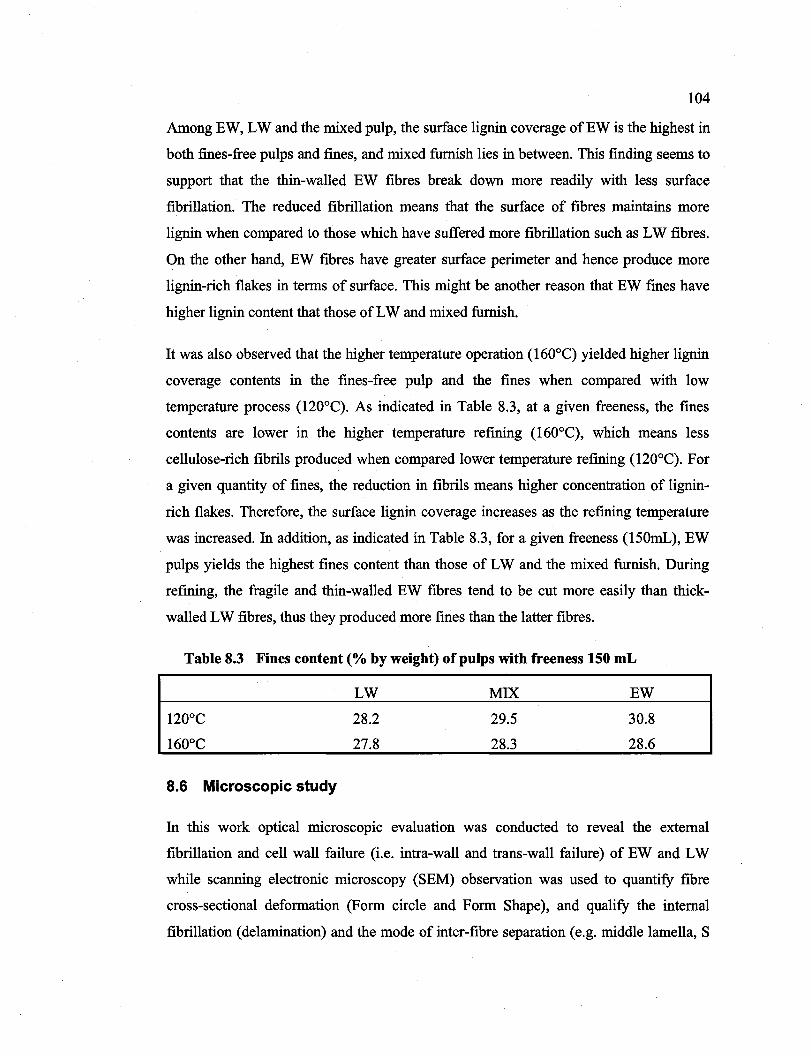
Reproduced with permission of the copyright owner. Further reproduction prohibited without permission.
104
Among EW, LW and the mixed pulp, the surface lignin coverage ofEW is the highest in
both fines-free pulps and fines, and mixed furnish lies in between. This finding seems to
support that the thin-walled EW fibres break down more readily with less surface
fibrillation. The reduced fibrillation means that the surface of fibres maintains more
lignin when compared to those which have suffered more fibrillation such as LW fibres.
On the other hand, EW fibres have greater surface perimeter and hence produce more
lignin-rich flakes in terms of surface. This might be another reason that EW fmes have
higher lignin content that those of LW and mixed furnish.
It was also observed that the higher temperature operation (160°C) yielded higher lignin
coverage contents in the fines-free pulp and the fines when compared with low
temperature process (120°C). As indicated in Table 8.3, at a given freeness, the fines
contents are lower in the higher temperature refining (160°C), which means less
cellulose-rich fibrils produced when compared lower temperature refining (120°C). For
a given quantity of fines, the reduction in fibrils means higher concentration of lignin
rich flakes. Therefore, the surface lignin coverage increases as the refming temperature
was inereased. In addition, as indieated in Table 8.3, for a given freeness (150mL), EW
pulps yields the highest fines content than those of LW and the mixed furnish. During
refining, the fragile and thin-walled EW fibres tend to be eut more easily than thiek
walled LW fibres, thus they produeed more fines than the latter fibres.
Table 8.3 Fines content (% by weight) of pulps with freeness 150 mL
8.6 Microscopie study
LW
28.2
27.8
MIX
29.5
28.3
EW
30.8
28.6
In this work optical microscopie evaluation was eonducted to reveal the external
fibrillation and cell wall failure (i.e. intra-wall and trans-wall failure) of EW and LW
while scanning eleetronie mieroscopy (SEM) observation was used to quantify fibre
eross-seetional deformation (Form eirc1e and Form Shape), and qualify the internaI
fibrillation (delamination) and the mode of inter-fibre separation (e.g. middle lamella, S
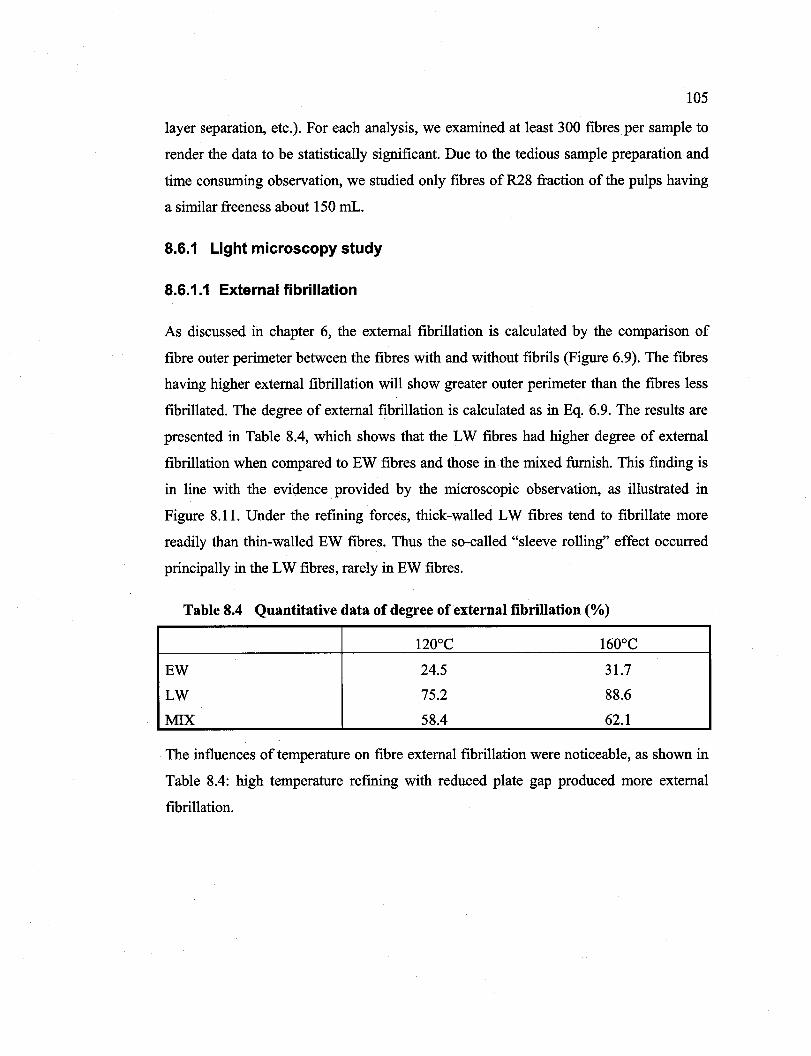
Reproduced with permission of the copyright owner. Further reproduction prohibited without permission.
105
layer separation, etc.). For each analysis, we examined at least 300 fibres per sample to
render the data to be statistically significant. Due to the tedious sample preparation and
time consuming observation, we studied only fibres of R28 fraction of the pulps having
a similar freeness about 150 mL.
8.6.1 Light microscopy study
8.6.1.1 External fibrillation
As discussed in chapter 6, the external fibrillation is calculated by the comparison of
fibre outer perimeter between the fibres with and without fibrils (Figure 6.9). The fibres
having higher external fibrillation will show greater outer perimeter than the fibres less
fibrillated. The degree of external fibrillation is calculated as in Eq. 6.9. The results are
presented in Table 8.4, which shows that the LW fibres had higher degree of external
fibrillation when compared to EW fibres and those in the mixed furnish. This finding is
in line with the evidence provided by the microscopic observation, as illustrated in
Figure 8.11. Under the refming forces, thick-walled LW fibres tend to fibrillate more
readily than thin-walled EW fibres. Thus the so-called "sleeve rolling" effect occurred
principally in the LW fibres, rarely in EW fibres.
Table 8.4 Quantitative data of degree of external fibrillation (%)
120°C 160°C
EW 24.5 31.7
LW 75.2 88.6
MIX 58.4 62.1
The influences of temperature on fibre external fibrillation were noticeable, as shown in
Table 8.4: high temperature refining with reduced plate gap produced more external
fibrillation.
Reproduced with permission of the copyright owner. Further reproduction prohibited without permission.
106
8.6.1.2 Fibre wall failure
As shown in Figure 8.44, the fibre failure could be of two types: trans-wall and intra
wall failure. In this study, the numeric percentage of each types of failure was assessed
using a light microscope.
Figure 8.44 Cell wall fallure of EW and LW fibres in refining (A: Intra-wall failure in LW fibre; B: Trans-wall failure in EW fibre)
As seen in Table 8.5, most of the trans-wall failures occurred in EW fibres, while the
intra-wall failures took place uniquely in LW fibres. The mixed fumish contains the two
types of failure. This means that the cell wall failures are strongly influenced by the
original morphological characteristics of fibre. Under the shear and compression actions,
the thin-walled and flexible EW fibres tend to collapse (as shown in Figure 8.44) and
split, resulting in the trans-wall failure. On the contrary, the thick-walled and rigid LW
fibres, which are more resistant to the mechanical forces, retain their form and yield
intra-wall failure.
Table 8.5 Numeric percentage of fibre wall fallures in refining
l200e 1600e
Intra-wall failure Trans-wall failure Intra-wall failure Trans-wall failure
EW 0.3 26.3 0.3 30.6
LW 15.3 0.6 18.3 0.6
MIX 8.0 15.3 10.3 19.6
Reproduced with permission of the copyright owner. Further reproduction prohibited without permission.
107
Table 8.5 also reveals that refining at high temperature with reduced refiner plate gap,
thin-walled EW fibres experienced more trans-wall failure and thick-walled LW fibres
showed more intra-walled failures. As explained earlier at high temperature refining
(160°C) the plate gap had to be reduced to decrease the pulp freeness, resulting in
increased shear force. As such, the mechanically weaker EW fibres split more easily and
yielded higher trans-wall failure. However, the stronger LW fibres resist to the splitting
action and tend to be fibrillated more and showed intra-wall failure.
8.6.2 Scanning electronic microscopy (SEM) study
8.6.2.1 Internai fibrillation (delamination)
Figure 8.45 shows the internaI fibrillation of an EW fibre where the inner layer
presumably the S3 layer of the secondary cell wall, was completely detached from the
S2 layer. AIso, sorne minor cracks are visible, indicating the presence of delamination.
Interestingly, the nature of internaI fibrillation is quite different for LW fibres where the
S3 layer remained attached to the S2 layer (Figure 8.46). However, the bulk of S2layer
was fractured to a great extent. The distribution of cracks (delamination) in the S2 layer
was uneven. Theses fmdings reveal that thin-walled EW fibres are much more fragile
under the mechanîcal forces than the rigid and thick-walled LW. Therefore, EW fibres
produce greater de1aminations than LW fibres.
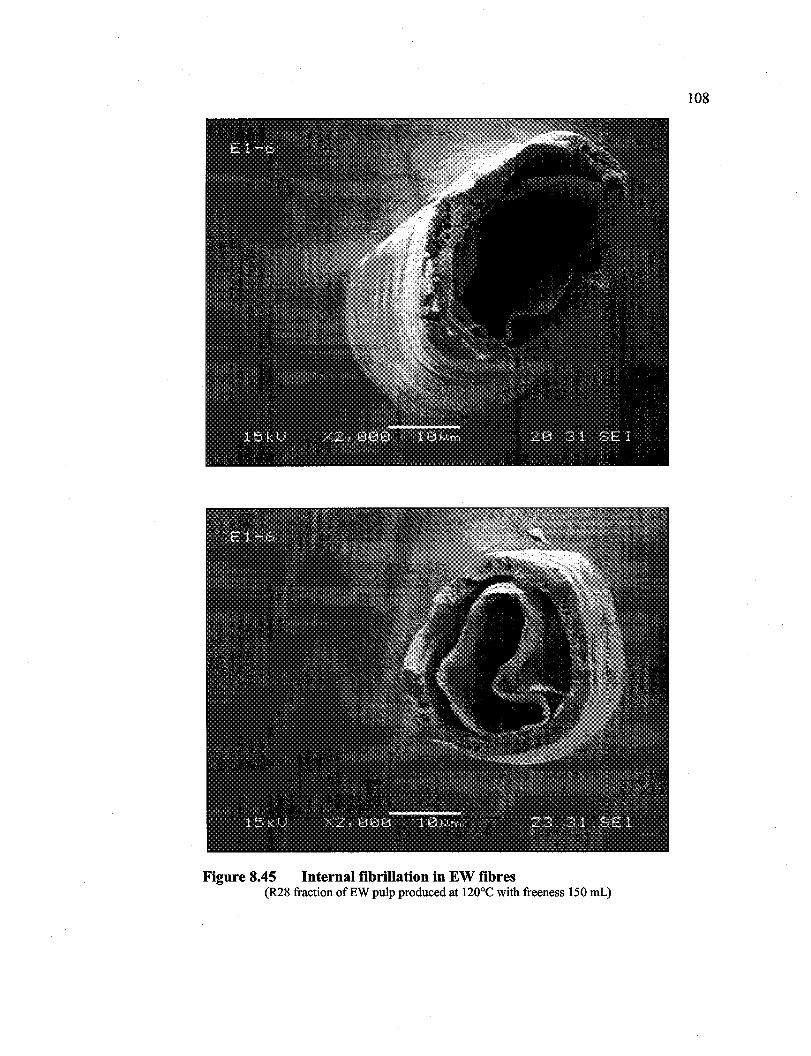
Reproduced with permission of the copyright owner. Further reproduction prohibited without permission.
108
Figure 8.45 InternaI fibrillation in EW fibres (R28 fraction ofEW pulp produced at 1200 e with freeness 150 mL)
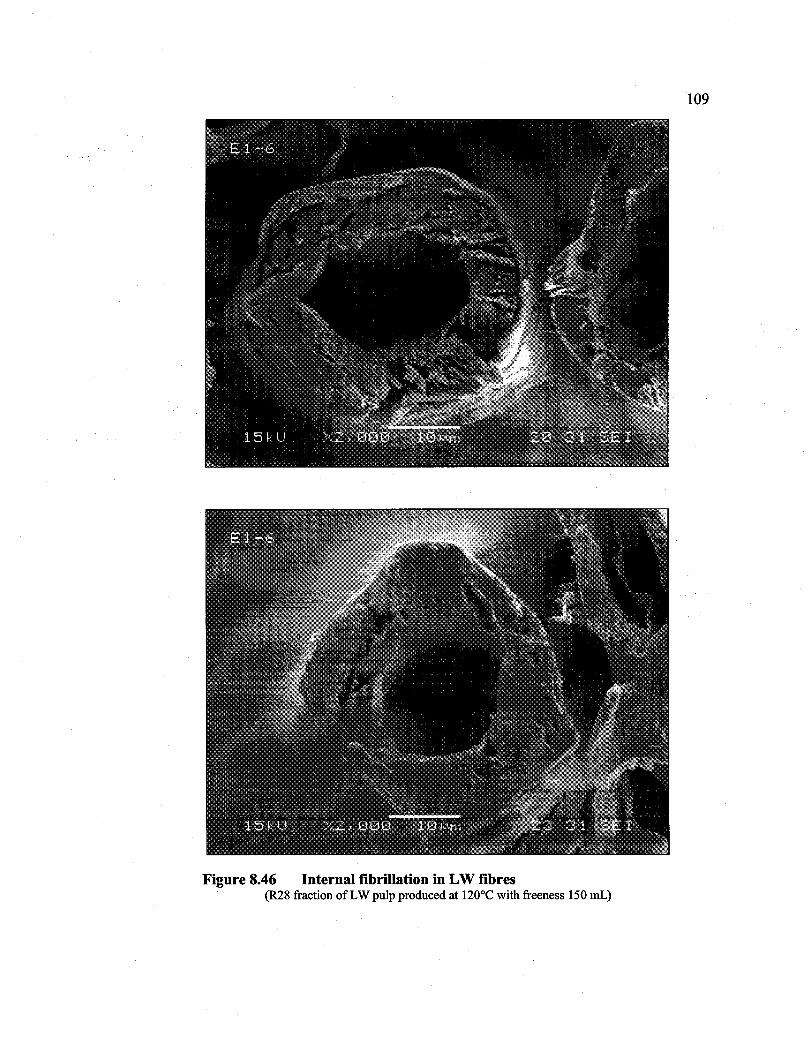
Reproduced with permission of the copyright owner. Further reproduction prohibited without permission.
109
Figure 8.46 Internai fibrillation in LW fibres (R28 fraction of LW pulp produced at 120°C with freeness 150 mL)
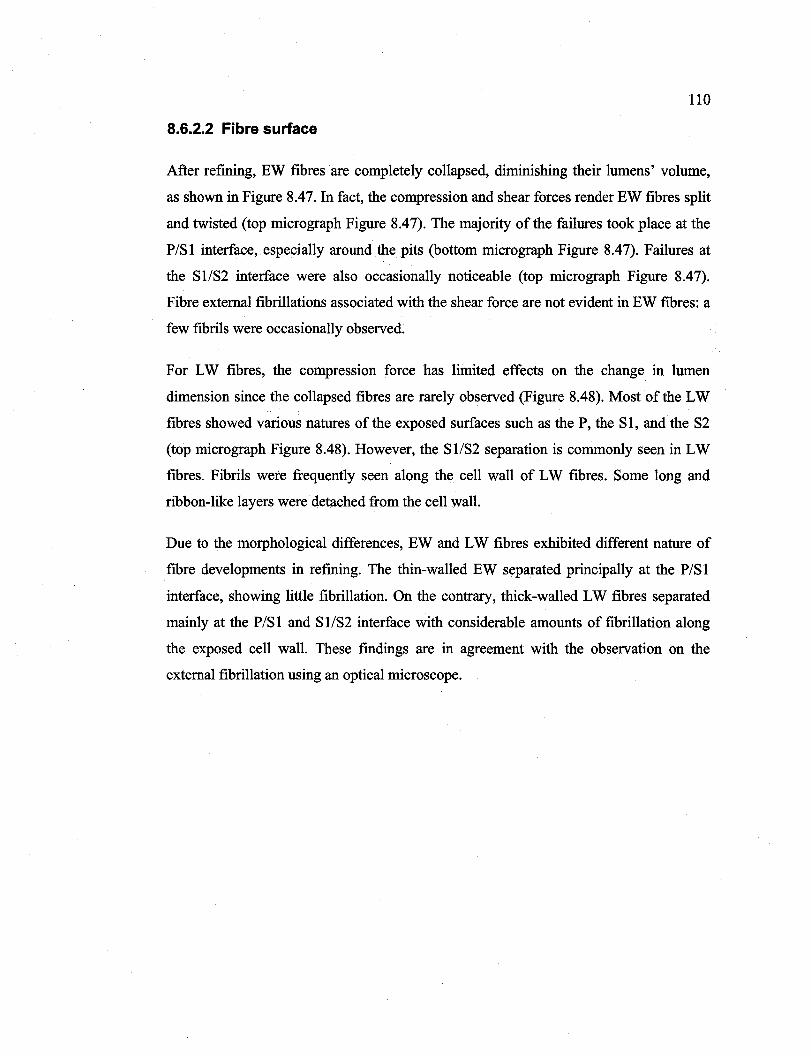
Reproduced with permission of the copyright owner. Further reproduction prohibited without permission.
110
8.6.2.2 Fibre surface
After refining, EW fibres are completely collapsed, diminishing their lumens' volume,
as shown in Figure 8,47. In fact, the compression and shear forces render EW fibres split
and twisted (top micrograph Figure 8,47). The majority of the failures took place at the
P/Sl interface, especially around the pits (bottom micrograph Figure 8,47). Failures at
the S1/S2 interface were also occasionally noticeable (top micrograph Figure 8,47).
Fibre external fibrillations associated with the shear force are not evident in EW fibres: a
few fibrils were occasionally observed.
For LW fibres, the compression force has limited effects on the change in lumen
dimension since the collapsed fibres are rarely observed (Figure 8,48). Most of the LW
fibres showed various natures of the exposedsurfaces such as the P, the SI, and the S2
(top micrograph Figure 8,48). However, the S1/S2 separation is commonly seen in LW
fibres. Fibrils were frequently seen along the cell wall of LW fibres. Sorne long and
ribbon-like layers were detached from the cell walL
Due to the morphological differences, EW and LW fibres exhibited different nature of
fibre developments in refining. The thin-walled EW separated principally at the P/SI
interface, showing little fibrillation. On the contrary, thick-walled LW fibres separated
mainly at the P/SI and S1/S2 interface with considerable amounts of fibrillation along
the exposed cell wall. These fmdings are in agreement with the observation on the
external fibrillation using an optical microscope.
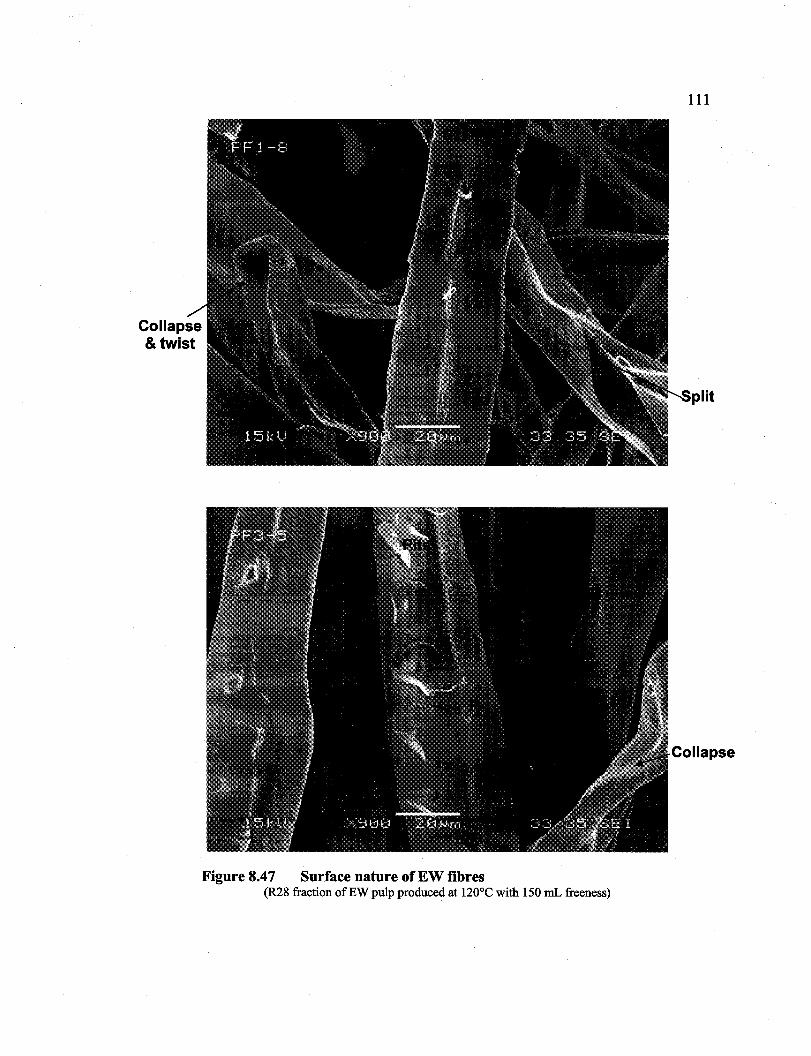
Reproduced with permission of the copyright owner. Further reproduction prohibited without permission.
111
plit
Collapse
Figure 8.47 Surface nature ofEW fibres (R28 fraction ofEW pulp produced at 1200 e with 150 mL freeness)
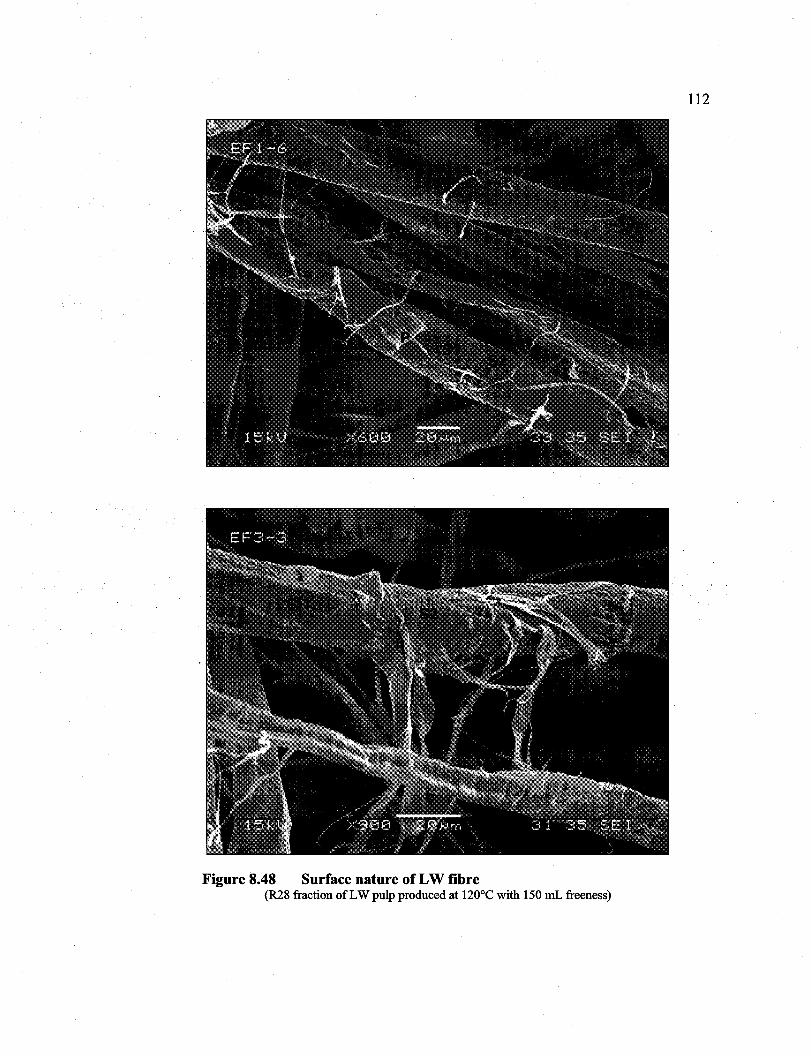
Reproduced with permission of the copyright owner. Further reproduction prohibited without permission.
112
Figure 8.48 Surface nature of LW fibre (R28 fraction of LW pulp produced at 1200 e with 150 mL freeness)
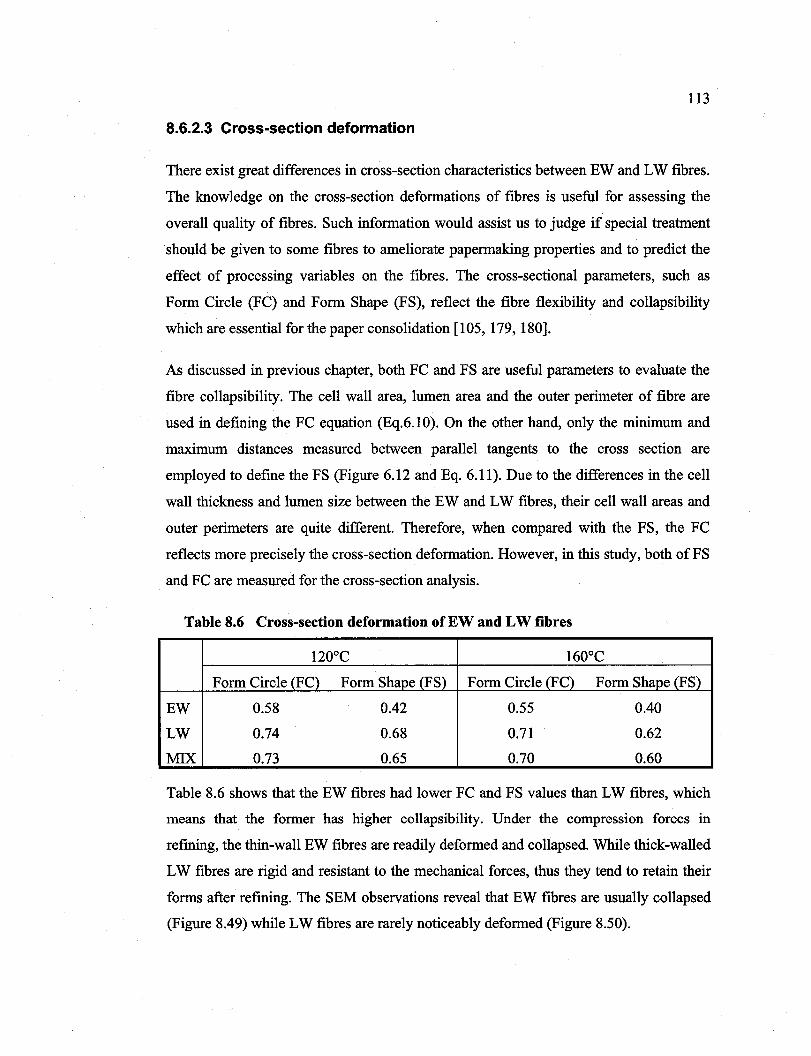
Reproduced with permission of the copyright owner. Further reproduction prohibited without permission.
113
8.6.2.3 Cross-section deformation
There exist great differences in cross-section characteristics between EW and LW fibres.
The knowledge on the cross-section deformations of fibres is useful for assessing the
overall quality of fibres. Such information would assist us to judge if special treatment
should be given to sorne fibres to ameliorate papermaking properties and to predict the
effect of processing variables on the fibres. The cross-sectional parameters, such as
Form Cirele (FC) and Form Shape (FS), reflect the fibre flexibility and collapsibility
which are essential for the paper consolidation [105, 179, 180].
As discussed in previous chapter, both FC and FS are useful parameters to evaluate the
fibre collapsibility. The cell wall area, lumen area and the outer perimeter of fibre are
used in defining the FC equation (Eq.6.1O). On the other hand, only the minimum and
maximum distances measured between parallel tangents to the cross section are
employed to defme the FS (Figure 6.12 and Eq. 6.11). Due to the differences in the cell
wall thickness and lumen size between the EW and LW fibres, their cell wall areas and
outer perimeters are quite different. Therefore, when compared with the FS, the FC
reflects more precise1y the cross-section deformation. However, in this study, both ofFS
and FC are measured for the cross-section analysis.
Table 8.6 Cross-section deformation of EW and LW fibres
120°C 160°C
F orm Cirele (FC) Form Shape (FS) Form Cirele (FC) Form Shape (FS)
EW 0.58 0.42 0.55 0.40
LW 0.74 0.68 0.71 0.62
MIX 0.73 0.65 0.70 0.60
Table 8.6 shows that the EW fibres had lower FC and FS values than LW fibres, which
means that the former has higher collapsibility. Under the compression forces in
refming, the thin-wall EW fibres are readily deformed and collapsed. While thick-walled
LW fibres are rigid and resistant to the mechanical forces, thus they tend to retain their
forms after refining. The SEM observations reveal that EW fibres are usually collapsed
(Figure 8.49) while LW fibres are rarely noticeably deformed (Figure 8.50).
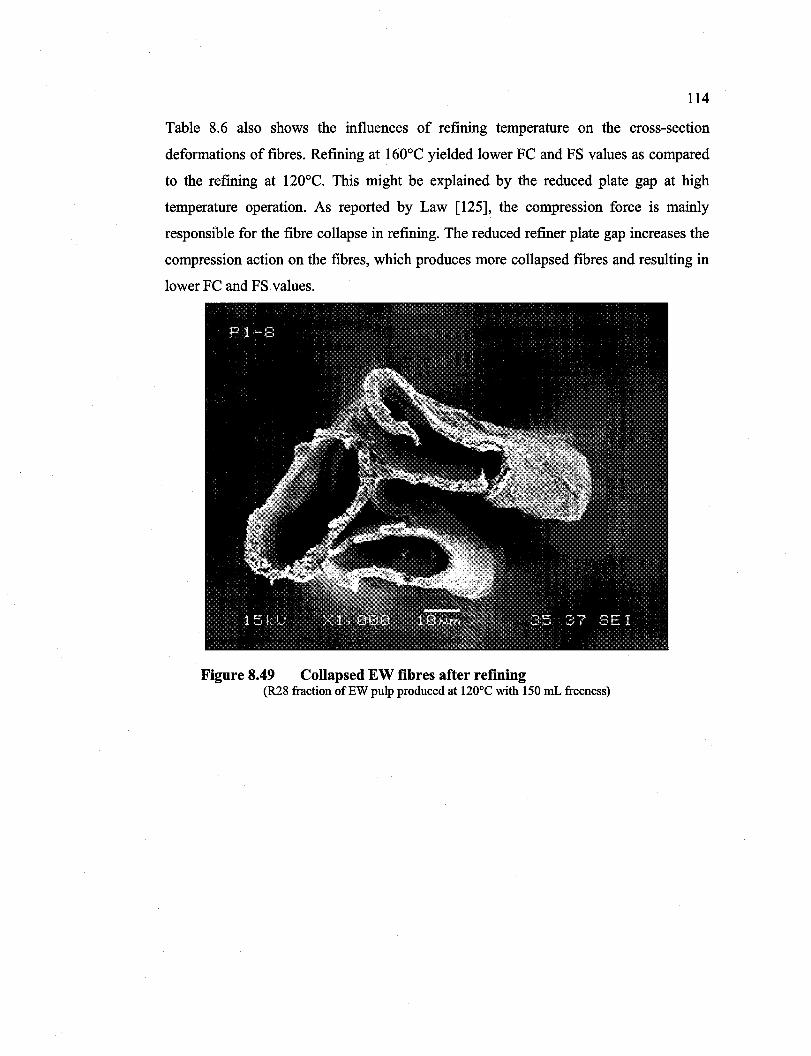
Reproduced with permission of the copyright owner. Further reproduction prohibited without permission.
114
Table 8.6 also shows the influences of refming temperature on the cross-section
deformations of fibres. Refining at 160°C yielded lower FC and FS values as compared
to the refming at 120°e. This might be explained by the reduced plate gap at high
temperature operation. As reported by Law [125], the compression force is mainly
responsible for the fibre collapse in refining. The reduced refiner plate gap increases the
compression action on the fibres, which produces more collapsed fibres and resulting in
lower FC and FS values.
Figure 8.49 Collapsed EW fibres after refining (R28 fraction ofEW pulp produced at 1200 e with 150 mL freeness)
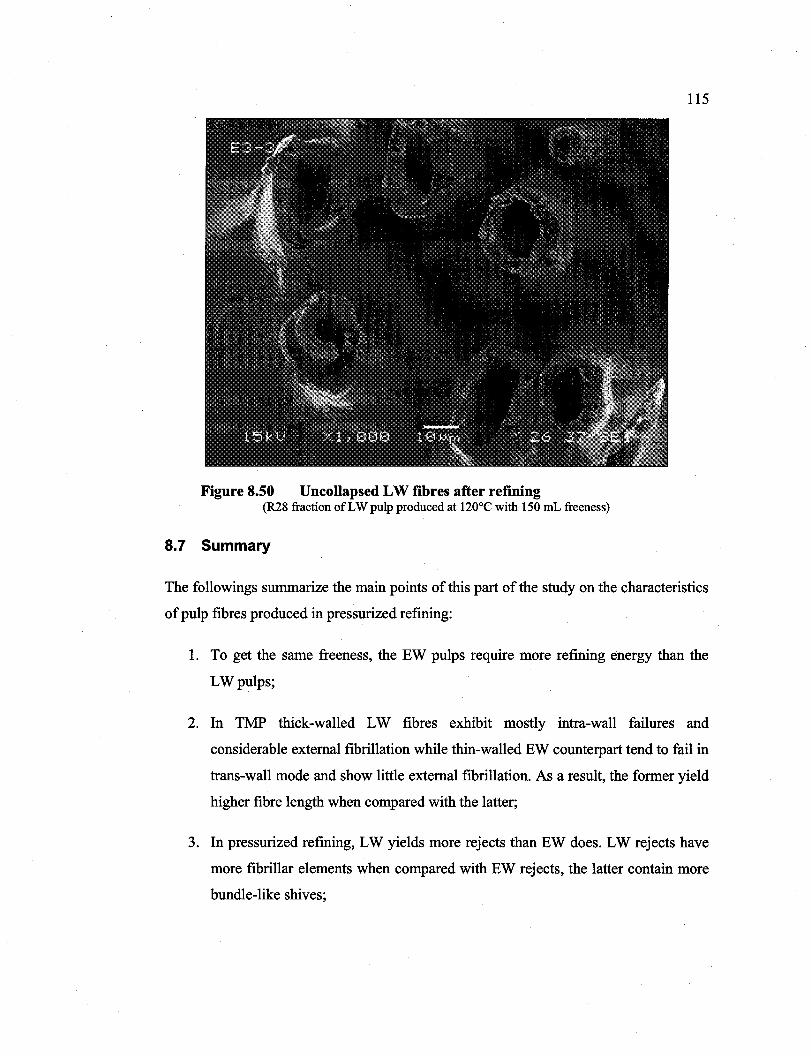
Reproduced with permission of the copyright owner. Further reproduction prohibited without permission.
115
Figure 8.50 Uncollapsed LW fibres after refining (R28 fraction of LW pulp produced at 1200 e with 150 mL freeness)
8.7 Summary
The followings summarize the main points of this part of the study on the characteristics
of pulp fibres produced in pressurized refining:
1. To get the same freeness, the EW pulps require more refining energy than the
LWpulps;
2. In TMP thick-walled LW fibres exhibit mostly intra-wall failures and
considerable external fibrillation while thin-walled EW counterpart tend to fail in
trans-wall mode and show little external fibrillation. As a result, the former yield
higher fibre length when compared with the latter;
3. In pressurized refining, LW yields more rejects than EW does. LW rejects have
more fibrillar elements when compared with EW rejects, the latter contain more
bundle-like shives;
Reproduced with permission of the copyright owner. Further reproduction prohibited without permission.
116
4. Thick-walled LW fibres show lower curl and kink indices in comparison with
thin-walled EW counterparts;
5. LW fines, which contain more fibrillar component than EW fines, give higher
specifie volume bysedimentation (SV);
6. EW pulps have higher water retention value (WRV) than LW pulps;
7. Refming at 160°C, which operates with reduced plate gap, pro duces more rejects
and generates more fibrillation from LW than from EW when compared with
refming at 120 oC;
8. EW fmes-free pulps or fines has higher surface lignin coverage than those from
LW;
9. The separation ofthin-walled EW fibres take place mainly in the PISI interface
while that of LW fibres occur commonly in the PISl, S1IS2 regions;
10. In TMP, EW fibres show higher collapsibility and have lower FC and FS values
than LW fibres.
Reproduced with permission of the copyright owner. Further reproduction prohibited without permission.
Chapter 9 - Results and discussions (3) - handsheet
characterization
117
Due to their morphological discrepancies, the properties of EW and LW fibres are
deve10ped differently in thermomechanical refining. These properties inc1ude fines
formation, external and internaI fibrillation of cell wall, and collapsibility of fibre, etc.
Doubtlessly, the differences in these characteristics between EW and LW fibres would
have dissimilar impacts on handsheet properties.
In this chapter, we frrstly examine the physical and optical properties of handsheets
prepared with EW and LW pulps, and the mixed fumish. Secondly, we discuss the
characteristics ofpaper made with individual Bauer-McNett fraction or in combinations
of 2-3 fractions, relative to EW and LW pulps. Thirdly, we also compare the properties
of handsheets made from mixed fumish which was produced by co-refining both EW
and LW chips with those prepared from EW and LW pulps produced in separated
refining. With the information we hope to establish sorne possible interrelations between
the fibre characteristics and paper properties.
9.1 Handsheet properties of whole pulp
The physical and optical properties ofhandsheets inc1uding density, roughness, porosity,
tensile index, burst index, tear index, internaI strength (Scott bond), brightness, opacity,
light scattering and light absorption coefficient are discussed in detail in this part.
9.1.1 Physical properties
9.1.1.1 Density
Due to the superior collapsibility and conformability of EW fibres as compared to LW
counterparts, the handsheets prepared from EW pulps were denser than those made of
LW pulp, as Figure 9.1 shows. The refming temperature influenced also the handsheet
density, which is particularly apparent when the sheet density is plotted against freeness.
We learn that refming at high temperature (160°C) with reduced plate gap favoured
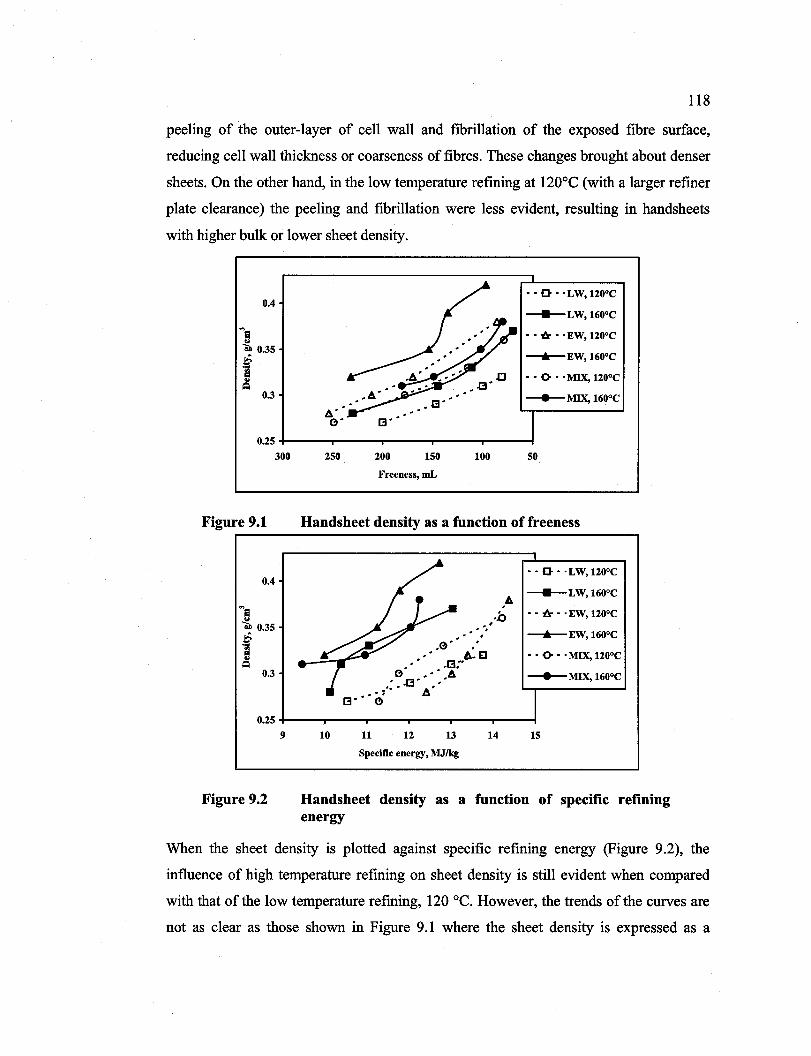
Reproduced with permission of the copyright owner. Further reproduction prohibited without permission.
118
peeling of the outer-layer of cell wall and fibrillation of the exposed fibre surface,
reducing cell wall thickness or coarseness of fibres. These changes brought about denser
sheets. On the other hand, in the low temperature refming at 120°C (with a larger refiner
plate clearance) the peeling and fibrillation were less evident, resulting in handsheets
with higher bulk or lower sheet density.
0.4
"'~ Iiil 0.35
f 0.3
0.25
300
Figure 9.1
A" 0" 13"
250 200 150
Freeness, mL
100
"" 0 - . LW, 120°C
___ LW, 160°C
- - à - 'EW, 120°C
-j.--EW, 160°C
- " 0- - 'MIX, 120°C
---+--MIX, 160°C
50
Handsheet density as a function of freeness ~--------------------------------------------~
"'s ...
0.4
Iiil 0.35
f 0.3
" , "" , .,." # #
,0' • ,,' .. 1>- El
0" ," "~. ,' .. .[3"" .. , ,.
_ - f" A 13" 0
,Iii. . .0
- - 0 - . LW, 120°C
___ LW, 160°C
- - à - 'EW, 120°C
-j.--EW, 160°C
- - 0- - 'MIX, 120°C
---+--MIX, 160°C
0.25 +---~-----r------r-----r------,-----i
9
Figure 9.2
10 11 12 13 14 15
Specifie energy, MJIkg
Handsheet density as a function of specifie refining energy
When the sheet density is plotted against specifie refining energy (Figure 9.2), the
influence of high temperature refming on sheet density is still evident when compared
with that of the low temperature refming, 120 oC. However, the trends of the curves are
not as c1ear as those shown in Figure 9.1 where the sheet density is expressed as a
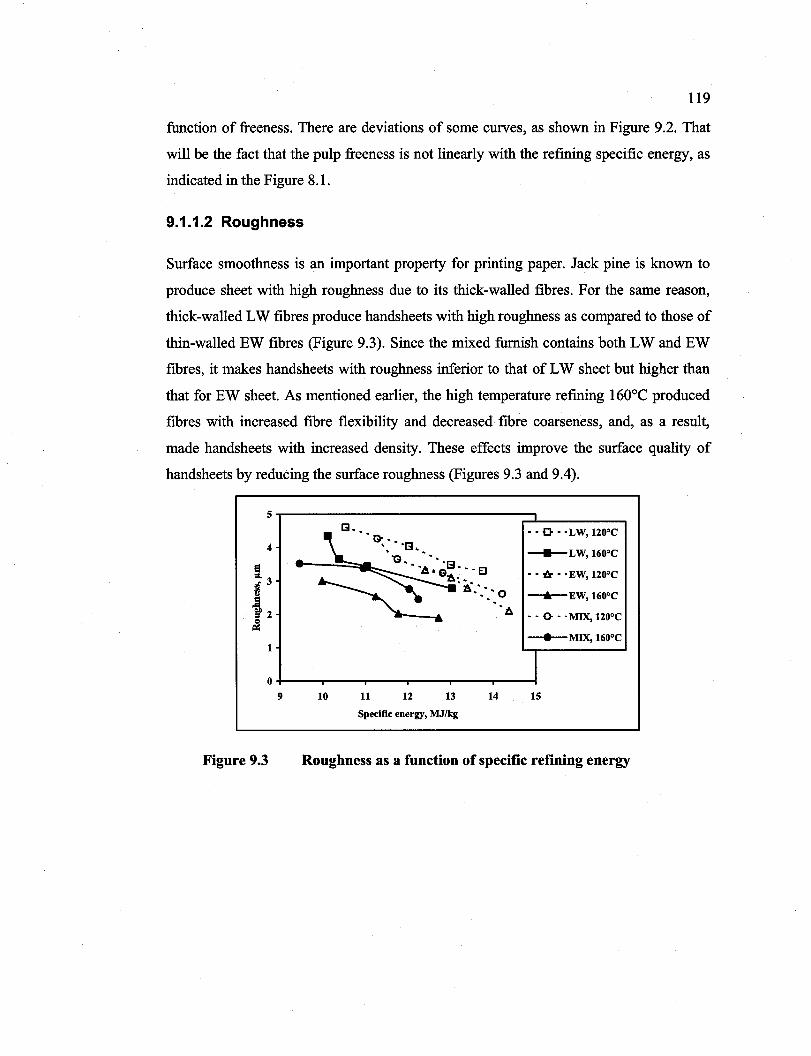
Reproduced with permission of the copyright owner. Further reproduction prohibited without permission.
119
function of freeness. There are deviations of sorne curves, as shown in Figure 9.2. That
will be the fact that the pulp freeness is not linearly with the refming specifie energy, as
indicated in the Figure 8.1.
9.1.1.2 Roughness
Surface smoothness is an important property for printing paper. Jack pine is known to
pro duce sheet with high roughness due to its thick-walled fibres. For the same reason,
thick-walled LW fibres produce handsheets with high roughness as compared to those of
thin-walled EW fibres (Figure 9.3). Since the mixed furnish contains both LW and EW
fibres, it makes handsheets with roughness inferior to that of LW sheet but higher than
that for EW sheet. As mentioned earlier, the high temperature refming 160°C produced
fibres with increased fibre flexibility and decreased fibre coarseness, and, as a result,
made handsheets with increased density. These effects improve the surface quality of
handsheets by reducing the surface roughness (Figures 9.3 and 9.4).
S
4
a ~3 :l 1:1
.CI ~2 &!
1
0
9
Figure 9.3
10 11 12 13
Specifie energy, MJIkg
14
- - 0 - . LW, 120°C
__+__LW,160oC
- - -& - ·EW, 120°C
-"-EW,160oC
- - 0- - ·MIX, 120°C
__ MIX, 160°C
lS
Roughness as a function of specifie refining energy
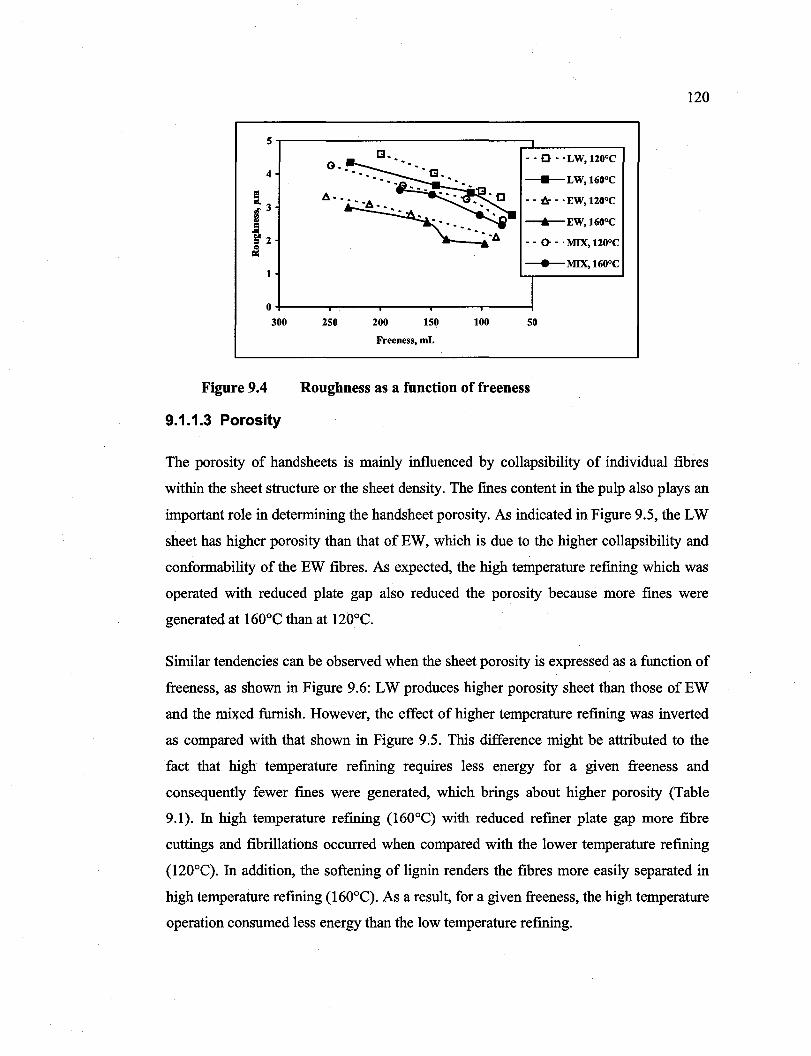
Reproduced with permission of the copyright owner. Further reproduction prohibited without permission.
5~------~~----------~ ______ ~ 4
1
··0· . LW, 120°C
__+__LW,160oc
•• tJr •. EW, 120°C
-+--EW,160oc
.. 0- .. MIX, 120°C
---+--MIX, 160°C
O+-----~----r-----r_--~r_--~
300 250 200 150 100 50
Freeness, mL
Figure 9.4 Roughness as a function of freeness
9.1.1.3 Porosity
120
The porosity of handsheets is mainly influenced by collapsibility of individual fibres
within the sheet structure or the sheet density. The fines content in the pulp also plays an
important role in determining the handsheet porosity. As indicated in Figure 9.5, the LW
sheet has higher porosity than that of EW, which is due to the higher collapsibility and
conformability of the EW fibres. As expected, the high temperature refming which was
operated with reduced plate gap also reduced the porosity because more fines were
generated at 160°C than at 120oe.
Similar tendencies can be observed when the sheet porosity is expressed as a function of
freeness, as shown in Figure 9.6: LW produces higher porosity sheet than those ofEW
and the mixed furnish. However, the effect of higher temperature refming was inverted
as compared with that shown in Figure 9.5. This difference might be attributed to the
fact that high temperature refming requires less energy for a given freeness and
consequently fewer fines were generated, which brings about higher porosity (Table
9.1). In high temperature refining (160°C) with reduced refiner plate gap more fibre
cuttings and fibrillations occurred when compared with the lower temperature refining
(120°C). In addition, the softening of lignin renders the fibres more easily separated in
high temperature refining (160°C). As a result, for a given freeness, the high temperature
operation consumed less energy than the low temperature refining.
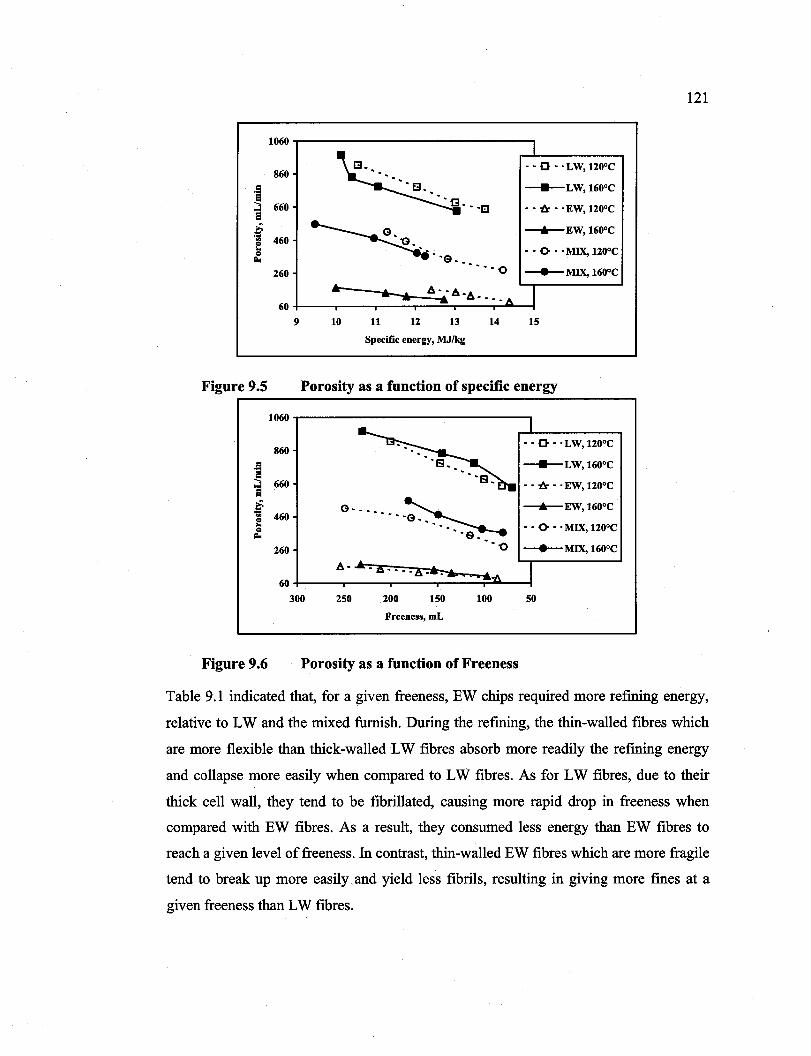
Reproduced with permission of the copyright owner. Further reproduction prohibited without permission.
1060
860
·i ~ 660 a t 460 e c j:I.,
260
60
9
_______ Go_
~ ° -s 0 - - - _ • 0
Ir----..... il-L .. A· - A _ À .---........ "". 10 11 12 13
Specifie energy, MJ/kg
14
· . 0 .. LW, 120°C
____ LW, 160°C
· . à . "EW, 120°C
--.-EW, 160°C
· . 0- . "MIX, 1200c
----MIX, 1600c
15
Figure 9.5 Porosity as a function of specifie energy r-------------------------------------------,
·i ~ ~ .. e ~
Figure 9.6
1060.,.-----------------,
860
660
460
260
60
300
G· ••• ~ ..• ·S ••••• 0 • e ..
'0
A· ..... à ........ ~ . ... -.... --. ..... -......... 250 200 150 100
Freeness, mL
Porosity as a function of Freeness
· . 0 . "LW, 120°C
____ LW, 160°C
· . à . "EW, 120°C
--.-EW,160oc
• • 0- • "MIX, 120°C
----MIX, 160°C
50
121
Table 9.1 indicated that, for a given freeness, EW chips required more refining energy,
relative to LW and the mixed furnish. During the refining, the thin-walled fibres which
are more flexible than thick-walled LW fibres absorb more readily the refming energy
and collapse more easily when compared to LW fibres. As for LW fibres, due to their
thick cell wall, they tend to be fibrillated, causing more rapid drop in freeness when
compared with EW fibres. As a result, they consumed less energy than EW fibres to
reach a given level of freeness. In contrast, thin-walled EW fibres which are more fragile
tend to break up more easily and yield less fibrils, resulting in giving more fmes at a
given freeness than LW fibres.
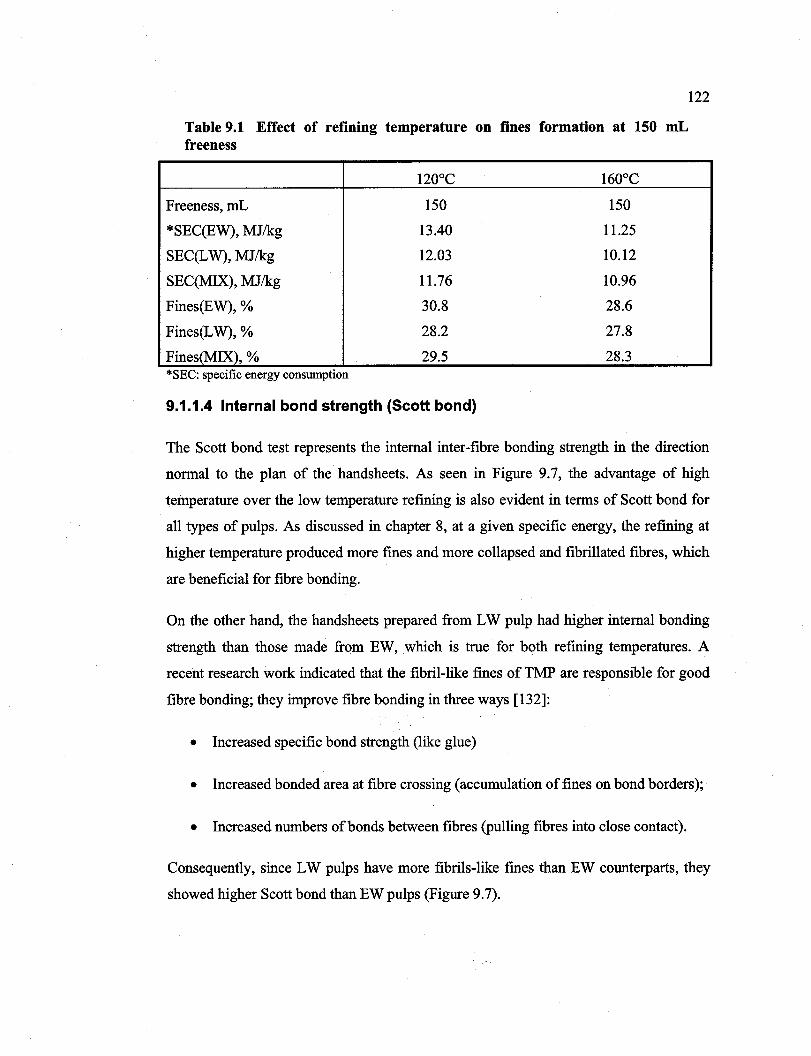
Reproduced with permission of the copyright owner. Further reproduction prohibited without permission.
Table 9.1 Effeet of refining temperature on fines formation at 150 mL freeness
120°C 160°C
Freeness, mL 150 150
*SEC(EW), MJ/kg 13.40 II.25
SEC(LW), MJ/kg 12.03 10.12
SEC(MIX), MJ/kg 11.76 10.96
Fines(EW), % 30.8 28.6
Fines(L W), % 28.2 27.8
Fines(MIX), % 29.5 28.3 *SEC: specIfic energy consumptlOn
9.1.1.4 Internai bond strength (Scott bond)
122
The Scott bond test represents the internaI inter-fibre bonding strength in the direction
normal to the plan of the handsheets. As seen in Figure 9.7, the advantage of high
temperature over the low temperature refining is also evident in terms of Scott bond for
all types of pulps. As discussed in chapter 8, at a given specific energy, the refining at
higher temperature produced more fines and more collapsed and fibrillated fibres, which
are beneficial for fibre bonding.
On the other hand, the handsheets prepared from LW pulp had higher internaI bonding
strength than those made from EW, which is true for both refining temperatures. A
recent research work indicated that the fibril-like fines of TMP are responsible for good
fibre bonding; they improve fibre bonding in three ways [132]:
• Increased specifie bond strength (like glue)
• Increased bonded area at fibre crossing (accumulation of fines on bond borders);
• Increased numbers ofbonds between fibres (pulling fibres into close contact).
Consequently, since LW pulps have more fibrils-like fmes than EW counterparts, they
showed higher Scott bond than EW pulps (Figure 9.7).

Reproduced with permission of the copyright owner. Further reproduction prohibited without permission.
140 r---------------;::::L------.
120
".ê ... 100
i oC 1: 80 ~
60
- - 0 - • LW, 120°C
__+__LW, 160°C
.Q - - {z - 'EW, 120°C , ,.0' Il. . ,13:.' .' -"'-EW, 1600C
_ (3 - .:. 0' ,A" - - <> - . MIX, 120°C ....... ...... A'
.C) ---+-MIX, 160°C IJ.' .
C)
40+----T----~--_r----r_--~--~
9
Figure 9.7
10 11 12 13 14 15
Specilicenergy,~Jfkg
InternaI bonding strength as a funetion of specifie refining energy
123
The advantages of high temperature refining are evident only when the Scott bond of
pulp is expressed as a function of refining energy; they are not apparent when the Scott
bond is expressed in terms of freeness (Figure 9.8), which reveals the inadequacy of
freeness for characterizing this refining effect.
140r-------------------------;~ ________ ~
120
"'El ;::; 100
l 1: 80 ~
60 IJ. ' -C)-
- - 0 - . LW, 120·C
__+__LW, 160·C
- - (z - 'EW, 120·C
-"'-EW, 160·C
- - <> - . MIX, 120°C
---+-MIX, 160°C
40+-----~----r_----~--~~--~
300 250 200 150 100 50
Freeness, mL
Figure 9.8 InternaI bonding strength as a funetion of freeness
9.1.1.5 Tensile and burst indices
As a consequence of the increase in specifie volume of fines (Figure 8.38) and sheet
density (Figure 9.2) in high temperature refining at 160°C, the tensile (Figure 9.9) and
burst (Figure 9.10) indices are significantly improved in comparison with the low
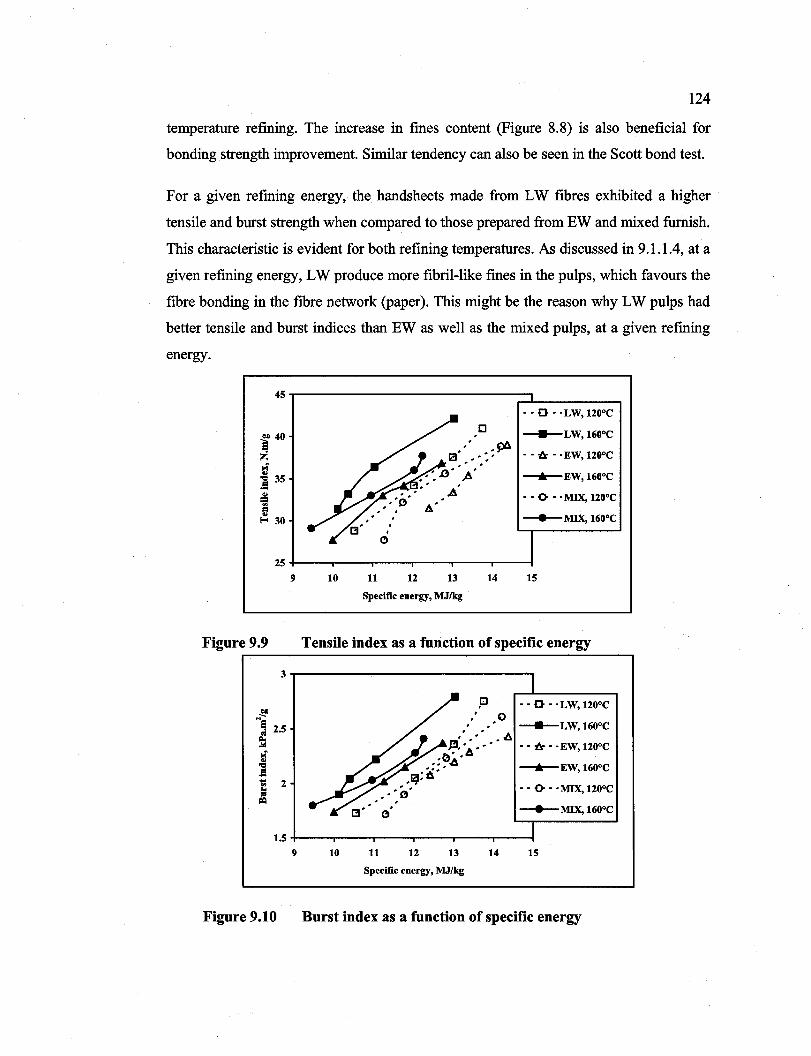
Reproduced with permission of the copyright owner. Further reproduction prohibited without permission.
124
temperature refming. The increase in fines content (Figure 8.8) is also beneficial for
bonding strength improvement. Similar tendency can also be seen in the Scott bond test.
For a given refming energy, the handsheets made from LW fibres exhibited a higher
tensile and burst strength when compared to those prepared from EW and mixed furnish.
This characteristic is evident for both refining temperatures. As discussed in 9.1.1.4, at a
given refining energy, LW produce more fibril-like fines in the pulps, which favours the
fibre bonding in the fibre network (paper). This might be the reason why LW pulps had
better tensile and burst indices than EW as well as the mixed pulps, at a given refming
energy.
45r---------------------~~------~ • • 0 •. LW, 120°C
_____ LW, 160°C
• • -& •• EW, 120°C
---+--EW, 160°C
· . 0- .. MIX, 120°C
~MIX,160°C
25+----r----r---,----,----~--~
9 10 11 12 13 14 15
Specifie energy, MJIkg
Figure 9.9 Tensile index as a function of specifie energy ~--------------------------------------------~
3
~ Ne " 2.5 ~
~ .$ "il 2 .. = =
1.5 9
Figure 9.10
10 11
p ··0· . LW, 120°C • ,0
.' " _____ LW, 160°C .' ..6.
~, .~ , , • • • • -& •• EW, 120°C ,. ;c,,â"
121= â" ---+--EW, 160°C , .
,.,.""0" ,
12 13 14
. . 0- .. MIX, 120°C
~MIX,160oC
15
Specifie energy, MJIkg
Burst index as a function of specifie energy
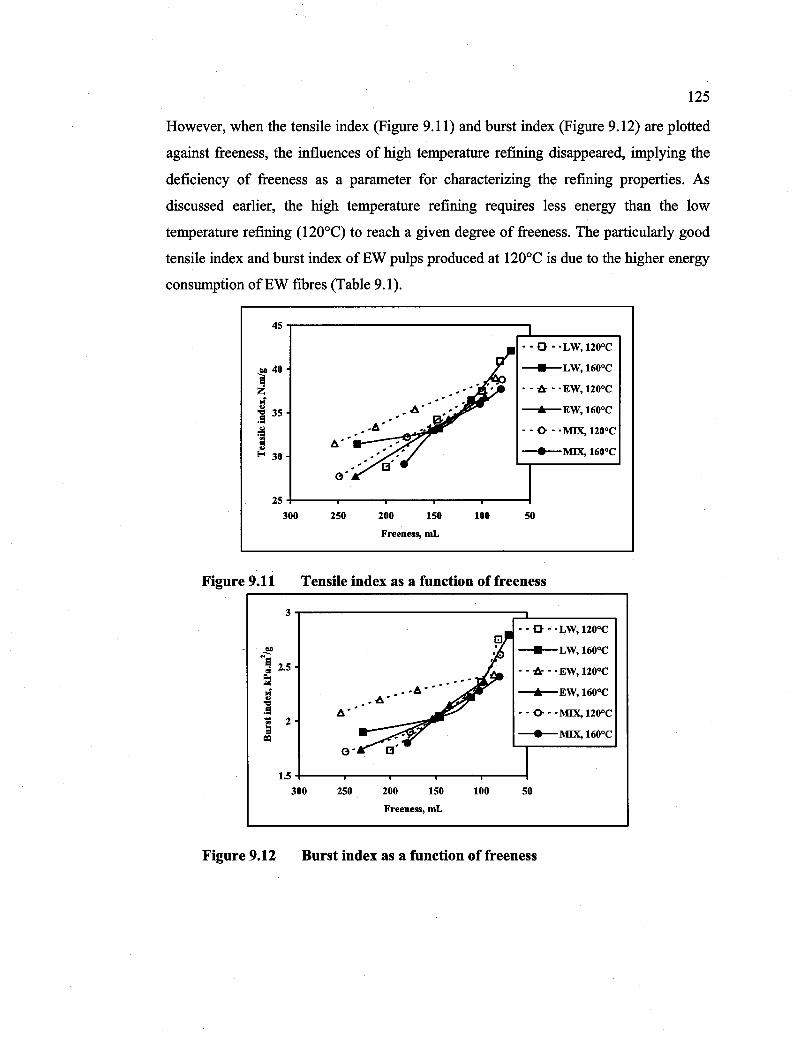
Reproduced with permission of the copyright owner. Further reproduction prohibited without permission.
125
However, when the tensile index (Figure 9.11) and burst index (Figure 9.12) are plotted
against freeness, the influences of high temperature refming disappeared, implying the
deficiency of freeness as a parameter for characterizing the refining properties. As
discussed earlier, the high temperature refining requires less energy than the low
temperature refining (120°C) to reach a given degree of freeness. The particularly good
tensile index and burst index of EW pulps produced at 120°C is due to the higher energy
consumption ofEW fibres (Table 9.1).
45~---------------------------,
• • 0 • -LW, 1200 e __+__LW, 1600e • • i::r •• EW, 1200e
---+--EW, 1600e · . 0- . -MIX, 1200e
--MIX, 1600e
25+-----r---~~--_,----~----_i
300 250 200 150 100 50
Freeness, mL
Figure 9.11 Tensile index as a function of freeness ~-------------------------------------------,
3r-------------------~~------~
~ Me oi 2.5
· . 0 . -LW, 1200e
__+__ LW, 1600e • • i::r • -EW, 1200e ---+--EW, 1600e • • <> • -MIX, 1200 e
--MIX, 1600 e
~
~ .S
~ 2
1.5 +---~~--__r----_r_----_r__--__t
300 250 200 150 100 50
Freeness, mL
Figure 9.12 Burst index as a function of freeness
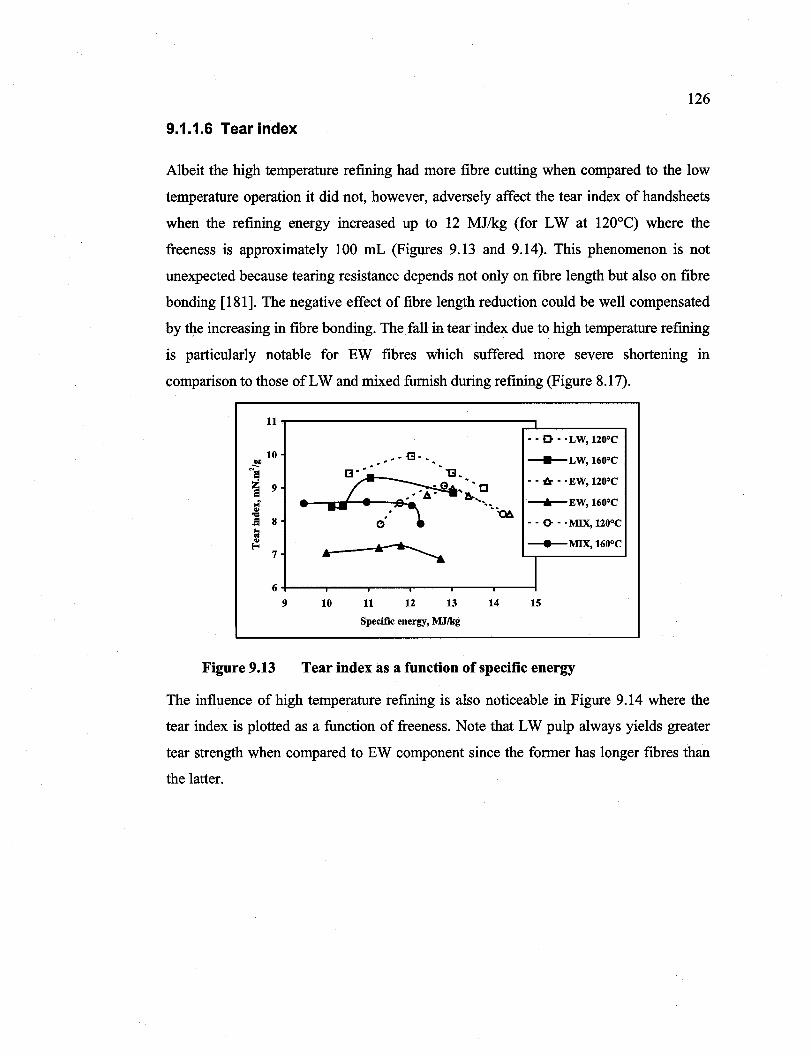
Reproduced with permission of the copyright owner. Further reproduction prohibited without permission.
126
9.1.1.6 Tear index
Albeit the high temperature refining had more fibre cutting when compared to the low
temperature operation it did not, however, adversely affect the tear index of handsheets
when the refining energy increased up to 12 MJ/kg (for LW at 120°C) where the
freeness is approximately 100 mL (Figures 9.13 and 9.14). This phenomenon is not
unexpected because tearing resistance depends not only on fibre length but also on fibre
bonding [181]. The negative effect of fibre length reduction could be well compensated
by the increasing in fibre bonding. The fall in tear index due to high temperature refming
is particularly notable for EW fibres which suffered more severe shortening in
comparison to those of LW and mixed furnish during refining (Figure 8.17).
llr-----------------------~------~
10
•
7
- - 0 - "LW, 120°C
__+__LW, 160°C
- - t:r - "EW, 120°C
-""-EW, 160°C
- - () - "MIX, 120°C
___ MIX, 160°C
~ 6~~--~~--~~~1
9 10 11 12 13 14 15
Specifie energy, MJ/kg
Figure 9.13 Tear index as a funetion of specifie energy
The influence of high temperature refining is also noticeable in Figure 9.14 where the
tear index is plotted as a function of freeness. Note that LW pulp always yields greater
tear strength when compared to EW component since the former has longer fibres than
the latter.
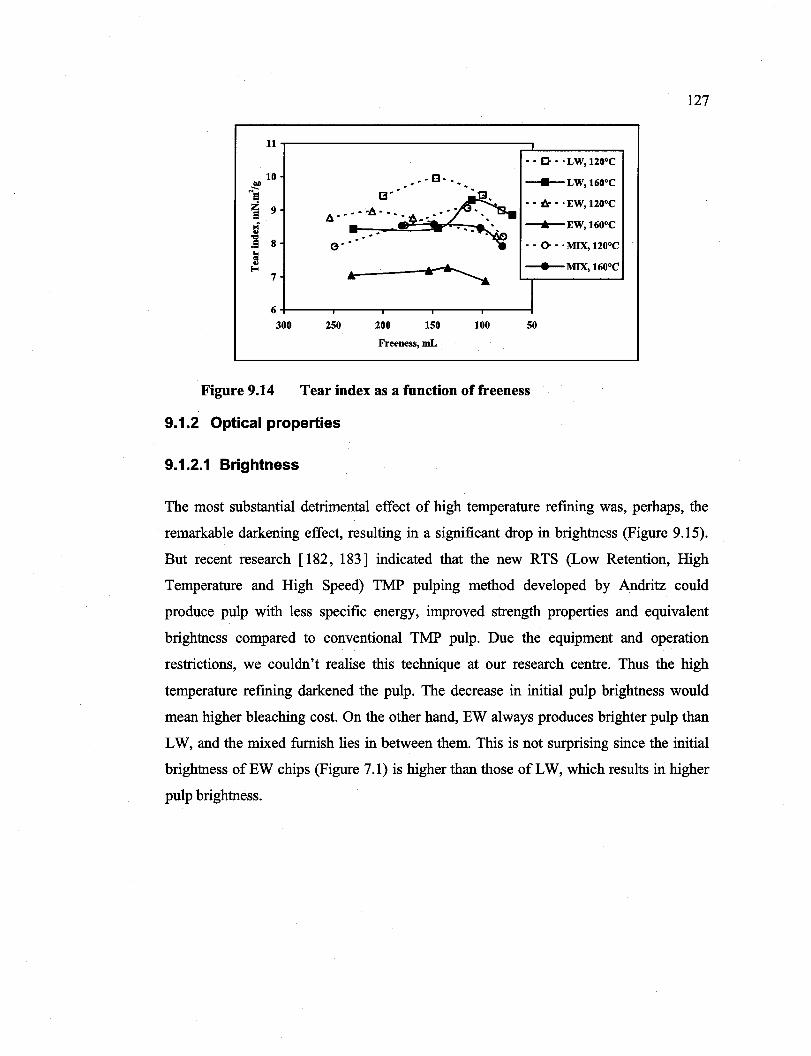
Reproduced with permission of the copyright owner. Further reproduction prohibited without permission.
llr-----------------------~------~
10 ~
.... EI
~ 9
i .s 8
~ ~
7
••• El· '.
.. A~·· - .t.:;".f3' â' . - ~ ". ~~ - -' :-.
• av ...... ~ .. . - . G- - --
··0· . LW, 120°C
__ LW, 160°C
.. tr .. EW, 120°C
-Jr--EW,160oc
.. 0- .. MIX, 120°C
--MIX, 160°C ~ 6r-~--~--~--~~1 300 250 200 150 100 50
Freeness, mL
Figure 9.14 Tear index as a function of freeness
9.1.2 Optical properties
9.1.2.1 Brightness
127
The most substantial detrimental effect of high temperature refming was, perhaps, the
remarkable darkening effect, resulting in a significant drop in brightness (Figure 9.15).
But recent research [182, 183] indicated that the new RTS (Low Retention, High
Temperature and High Speed) TMP pulping method developed by Andritz could
produce pulp with less specifie energy, improved strength properties and equivalent
brightness compared to conventional TMP pulp. Due the equipment and operation
restrictions, we couldn't realise this technique at our research centre. Thus the high
temperature refining darkened the pulp. The decrease in initial pulp brightness would
mean higher bleaching cost. On the other hand, EW always produces brighter pulp than
LW, and the mixed fumish lies in between them. This is not surprising since the initial
brightness ofEW chips (Figure 7.1) is higher than those of LW, which results in higher
pulp brightness.
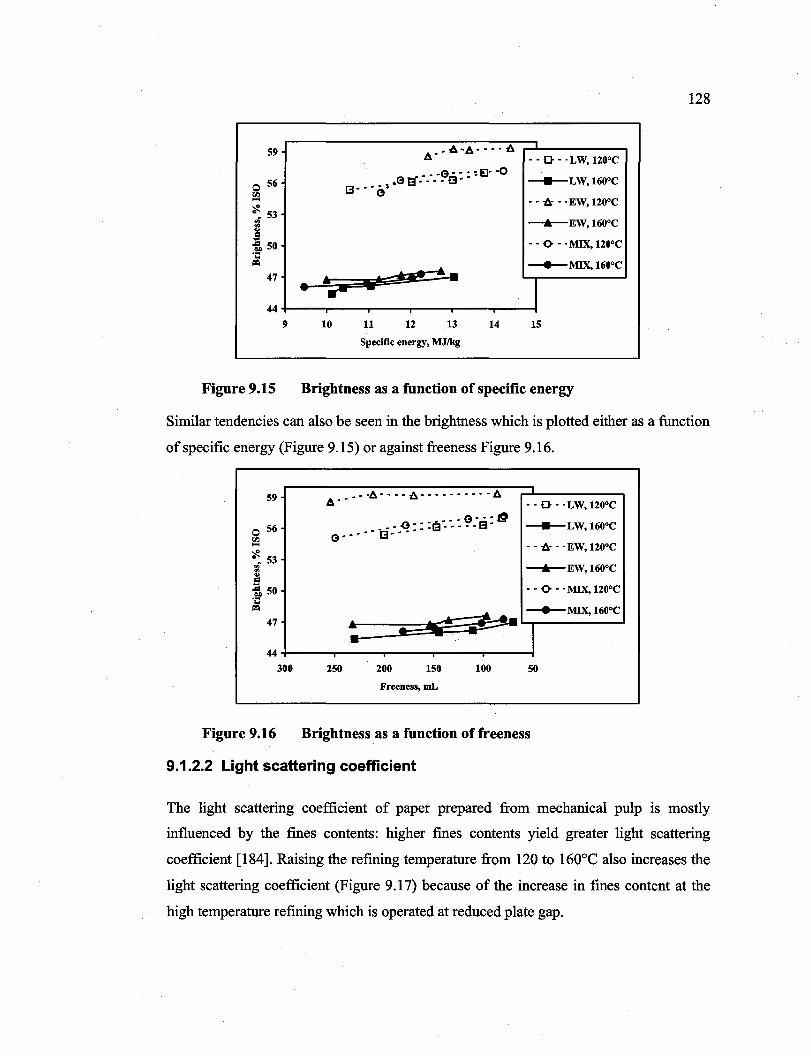
Reproduced with permission of the copyright owner. Further reproduction prohibited without permission.
59 r----------------A-.~·A~.AA7.~·-~-~A~~--------~ - - 0 - . LW, 120°C
o 56 r!l ~ 53
j fm 50 'C =
47
__ -G - - - : [J- -0 _.G [3"- - - - B - - ____ LW, 160°C
[3 - - - G# - - -& - • EW, 120°C
--'--EW, 160°C
- - 0- - . MIX, 120°C
---.-MIX, 160°C . .. • 1 44+---~----~--~----~--~--~
9 10 11 12 13 14 15
Specifie energy, MJ/kg
Figure 9.15 Brightness as a function of specifie energy
128
Similar tendencies can also be seen in the brightness which is plotted either as a function
ofspecific energy (Figure 9.15) or against freeness Figure 9.16.
59 r----~~_~--~-~~à7-~--~-~â~-~-~-~-~-~--~-~-~-~A~~L---------, Q - - 0 - 'LW,120oc
o 56 rI.l ... ~ 53
j fm 50 ;i
47
G __ - - - -13: -~: : :s-- -- -- ~:ËI: § ____ LW, 160°C
- - -& - . EW, 120°C
--.--EW, 160°C
- - 0- - . MIX, 120°C
:0 .- ~~ ~=E~==:j!?-e- ---'-1 MIX, 160°C
44+-----~----~----~----~--~
300 250 200 150 100 50
Freeness, mL
Figure 9.16 Brightness as a function of freeness
9.1.2.2 Light scattering coefficient
The light scattering coefficient of paper prepared from mechanical pulp is mostly
influenced by the fmes contents: higher fmes contents yield greater light scattering
coefficient [184]. Raising the refining temperature from 120 to 160°C also increases the
light scattering coefficient (Figure 9.17) because of the increase in fines content at the
high temperature refining which is operated at reduced plate gap.
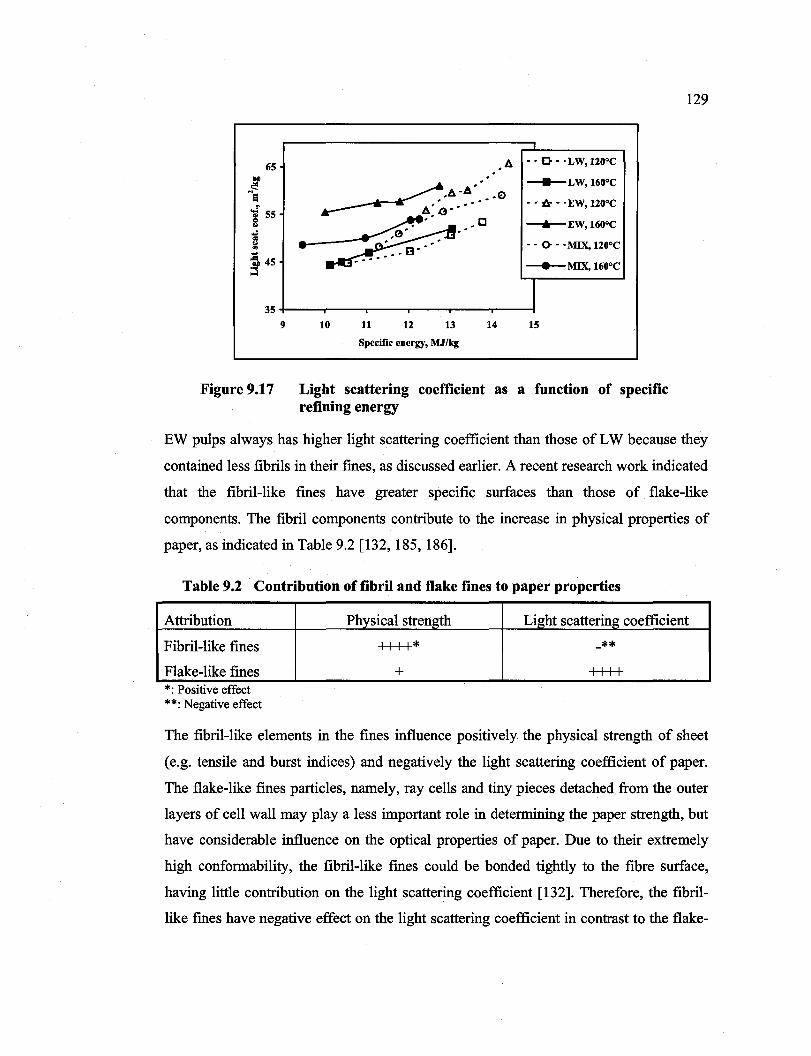
Reproduced with permission of the copyright owner. Further reproduction prohibited without permission.
65
!! Ne "of 55 = .. ..; .. '" li 45 !
35
9 10 11 12 13 14
Specifie energy, MJIkg
A - - 0 - . LW, 120°C
__+__LW,160oc
- - l!r - . EW, 120°C
----.-EW, 160°C
- - 0- - .MIX, 120°C
-----MIX, 160°C
1
15
Figure 9.17 Light scattering coefficient as a function of specifie refining energy
129
EW pulps always has higher light scattering coefficient than those of LW because they
contained less fibrils in their fmes, as discussed earlier. A recent research work indicated
that the fibril-like fmes have greater specific surfaces than those of flake-like
components. The fibril components contribute to the increase in physical properties of
paper, as indicated in Table 9.2 [132, 185, 186].
Table 9.2 Contribution of fibril and Dake fines to paper properties
Attribution
Fibril-like fines
Flake-like fines .. *: PosItive effect **: Negative effect
Physical strength Light scattering coefficient
++++* -** + ++++
The fibril-like elements in the fines influence positively the physical strength of sheet
(e.g. tensile and burst indices) and negatively the light scattering coefficient of paper.
The flake-like fines partic1es, namely, ray cells and tiny pieces detached from the outer
layers of cell wall may play a less important role in determining the paper strength, but
have considerable influence on the optical properties of paper. Due to their extremely
high conformability, the fibril-like fmes could be bonded tightly to the fibre surface,
having little contribution on the light scattering coefficient [132]. Therefore, the fibril
like fmes have negative effect on the light scattering coefficient in contrast to the flake-
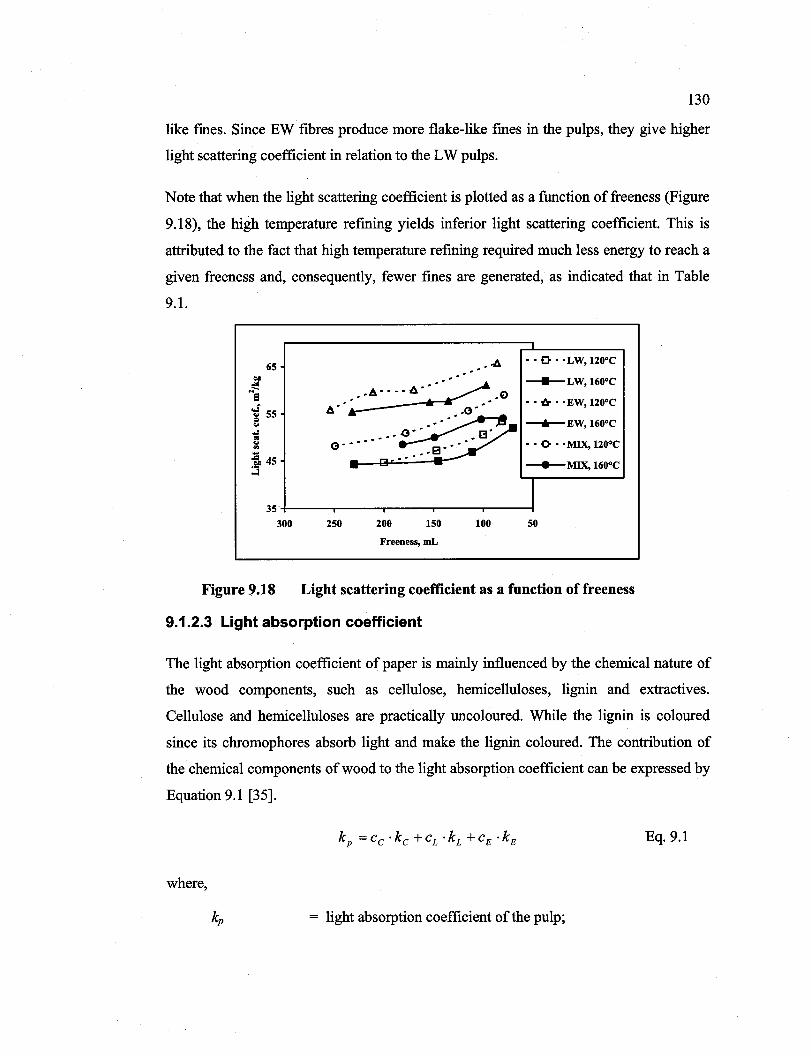
Reproduced with permission of the copyright owner. Further reproduction prohibited without permission.
130
like fines. Since EW fibres produce more flake-like fmes in the pulps, they give higher
light scattering coefficient in relation to the LW pulps.
Note that when the light scattering coefficient is plotted as a function offreeness (Figure
9.18), the high temperature refming yields inferior light scattering coefficient. This is
attributed to the fact that high temperature refining required much less energy to reach a
given freeness and, consequently, fewer fines are generated, as indicated that in Table
9.1.
.4 •• o· . LW, 120°C
.' '/:" __+__LW,160oC .A· ... ll' 0
, ' • ......, " • -- â- .. EW 120°C A" r .G" ,
~ •• ".' ,_ ---'--EW,160oC
,-G' G' ,. G • ' • • • • • , ' • • • • • 0- • . MIX, 120°C
. ,8 - ~.,., ---- --+--MIX, 160°C
35+-____ ~----~--~----~----~1 300 250 200 150 100 50
Freeness, mL
Figure 9.18 Light scattering coefficient as a function of freeness
9.1.2.3 Light absorption coefficient
The light absorption coefficient of paper is mainly influenced by the chemical nature of
the wood components, such as cellulose, hemicelluloses, lignin and extractives.
Cellulose and hemicelluloses are practically uncoloured. While the lignin is coloured
since its chromophores absorb light and make the lignin coloured. The contribution of
the chemical components of wood to the light absorption coefficient can be expressed by
Equation 9.1 [35].
Eq.9.1
where,
= light absorption coefficient of the pulp;

Reproduced with permission of the copyright owner. Further reproduction prohibited without permission.
131
Cc, CL and CE = relative amounts of carbohydrates, lignin, and extractives, respective1y in the pulp;
kc, kL and kE = light absorption coefficients of carbohydrates, lignin, and extractives.
Based on this equation, the contribution of the various chemical components on the light
absorption coefficient can be estimated as shown in Table 9.3. The example shows that
more than 90% of the coloured matter in Norway spruce (Picea abies) originates from
the lignin. The light absorption coefficient of the extractives is also relatively high, but
the contribution to the light absorption coefficient of the pulp is limited because of the
low content of extractives in wood.
Table 9.3 Contribution of the various components of Norway spruce (Picea abies) to the light absorption coefficient [187J
Relative amount, Light absorption coefficient, Contribution to the light absorption
coefficient of the pulp, cx kx, m2fkg
cxk" m2fkg
Carbohydrates 0.70 0.35 0.25
Lignin 0.28 20 5.6
Extractives 0.02 7.5 0.15
Wholepulp 1.0 6.0
As discussed in Table 7.2, the Jack pine EW contains more lignin (28.30%), than the LW
(27.09%). This might be the reason that EW sheet has higher light absorption coefficient
thân that of LW (Figure 9.19). Note that: the high temperature refming (160°C)
produced pulps having higher light absorption coefficient than the low temperature
refining (120°C). This is because of the darkening of high temperature refining, that is
more chromophores are produced at higher temperature since they are sensitive to the
heat. As a result, their light absorption coefficient increased with increasing temperature.
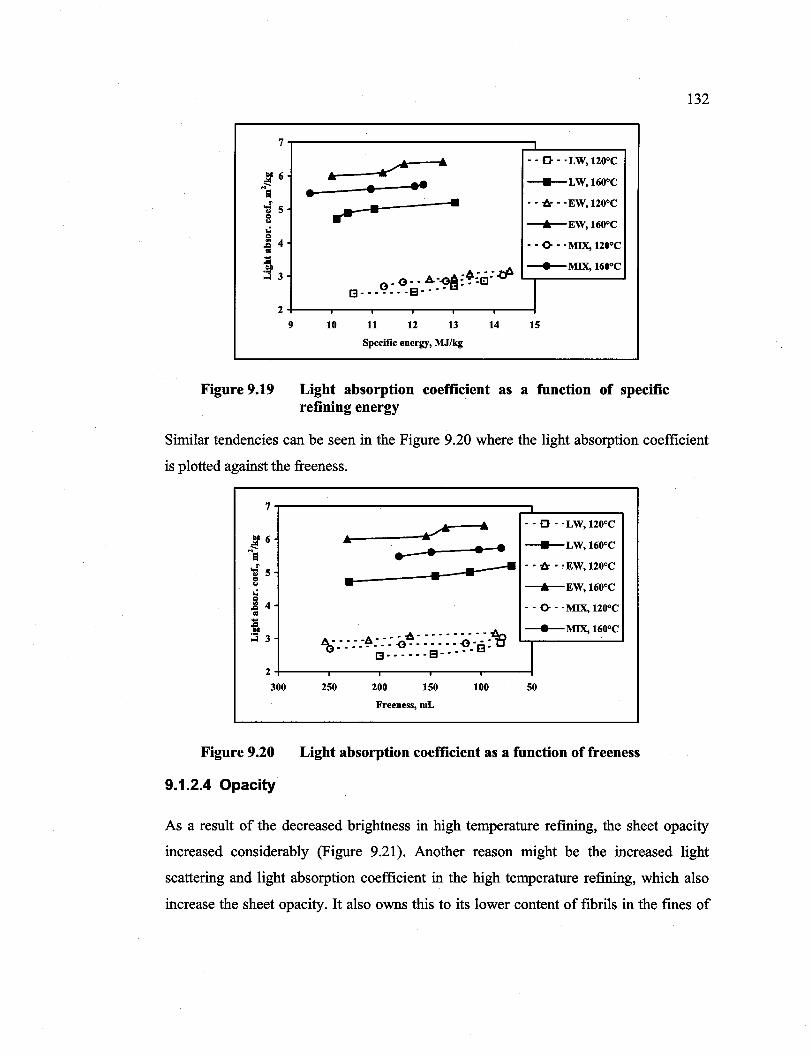
Reproduced with permission of the copyright owner. Further reproduction prohibited without permission.
Figure 9.19
7r-------------------~L-----~
• .. ~--~ . .. ......
13- - - - - - -13--
•
A---~
- - 0 - . LW, 120°C
____ LW, 160°C
- - {jr - • EW, 120°C
---+--EW, 160°C
- - 0- - . MIX, 120°C
---.-MIX, 160°C
0- 0- - .L\.:~~:: :El- L....,-I--------' 2+---~----~--_r----r_--_r--~
9 10 11 12 13 14 15
Specifie energy, MJ/kg
Light absorption coefficient as a function of specifie refining energy
132
Similar tendencies can be seen in the Figure 9.20 where the light absorption coefficient
is plotted against the freeness.
7
N6 "'s -; 5 ~ .. ..: j 4 .. li ~
;::3 3
2
300
Figure 9.20
9.1.2.4 Opacity
...,. ... .. • • .. ... • ...----
•
____ -A - - - - â - - - - - - - - -.- .4-. ~ __ • - - • - - -G - - - - - - - -G 'B • tr
13 - - - - - - 8 - - - - -
250 200 150 100
Freeness, mL
- - 0 - ·LW,120oC
____ LW, 160°C
- - {jr - , EW, 120°C
---+--EW, 160°C
- - 0- - . MIX, 120°C
---'-MIX, 160°C
1
50
Light absorption coefficient as a function of freeness
As a result of the decreased brightness in high temperature refining, the sheet opacity
increased considerably (Figure 9.21). Another reason might be the increased light
scattering and light absorption coefficient in the high temperature refining, which also
increase the sheet opacity. It also owns this to its lower content of fibrils in the fines of
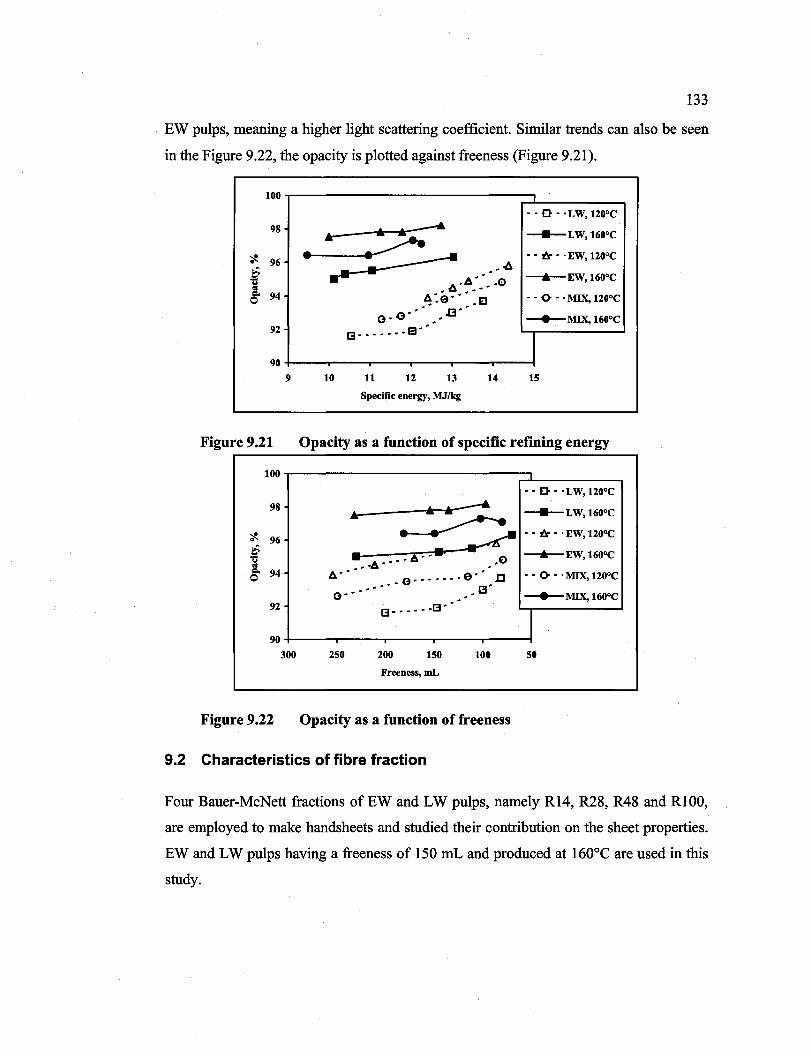
Reproduced with permission of the copyright owner. Further reproduction prohibited without permission.
133
EW pulps, meaning a higher light scattering coefficient. Similar trends can also be seen
in the Figure 9.22, the opacity is plotted against freeness (Figure 9.21).
100
98
~ 96
~ ... ! 94 0
92
90
9
Figure 9.21
10 11 12 13
Specifie energy, MJIkg
14
- - 0 - • LW, 120°C
____ LW, 160°C
- - à - 'EW, 120°C
---.-EW, 160°C
- - 0 - 'MIX, 120°C
--+--MIX, 160°C
15
Opacity as a function of specifie refining energy
100,-------------;::::l....-___ ----,
98
~ 96 ~ . ., ! 94 0
92 13 - - - - - -13 ••
90
300 250 200 150 100
Freeness, mL
Figure 9.22 Opacity as a function of freeness
9.2 Characteristics of fibre fraction
- - 0 - . LW, 120°C
____ LW, 160°C
- - à - . EW, 120°C
---'-EW, 160°C
- - 0 - . MIX, 120°C
--+--MIX, 160°C
1
50
Four Bauer-McNett fractions of EW and LW pulps, namely R14, R28, R48 and RI00,
are employed to make handsheets and studied their contribution on the sheet properties.
EW and LW pulps having a freeness of 150 mL and produced at 160°C are used in this
study.
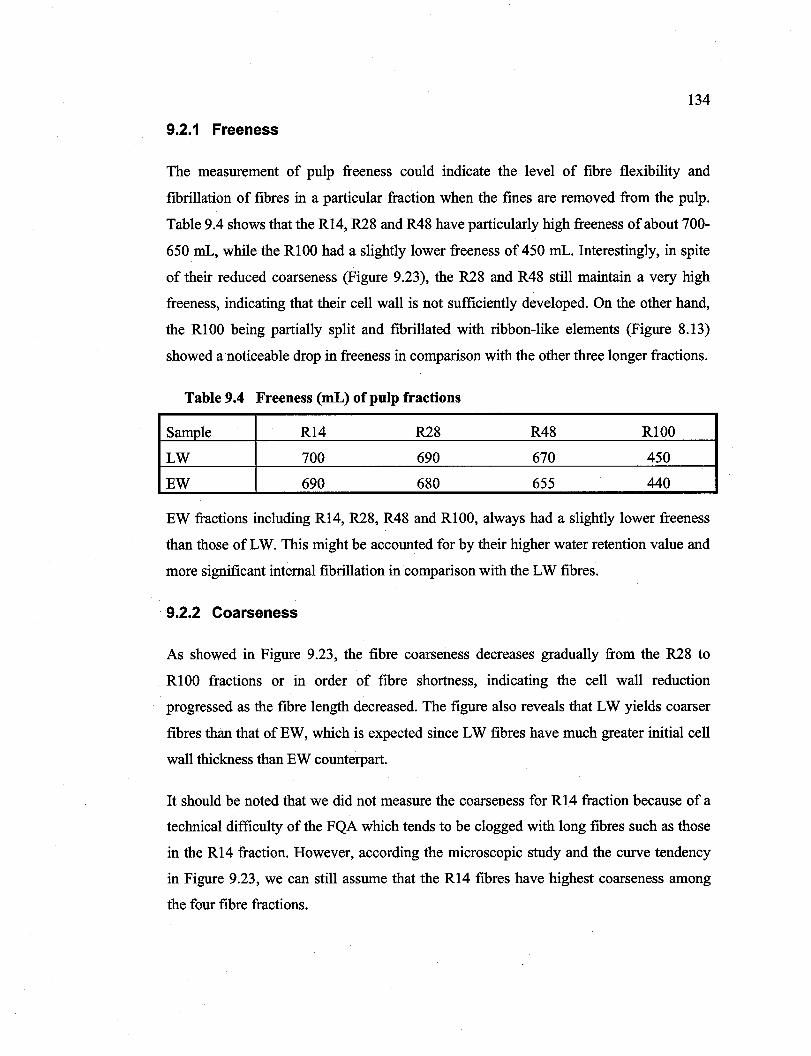
Reproduced with permission of the copyright owner. Further reproduction prohibited without permission.
134
9.2.1 Freeness
The measurement of pulp freeness could indicate the level of fibre flexibility and
fibrillation of fibres in a particular fraction when the fmes are removed from the pulp.
Table 9.4 shows that the R14, R28 and R48 have particularly high freeness of about 700-
650 mL, while the RIOO had a slightly lower freeness of 450 mL. Interestingly, in spite
of their reduced coarseness (Figure 9.23), the R28 and R48 still maintain a very high
freeness, indicating that their cell wall is not sufficiently developed. On the other hand,
the RIOO being partially split and fibrillated with ribbon-like elements (Figure 8.13)
showed a notice able drop in freeness in comparison with the other three longer fractions.
Table 9.4 Freeness (mL) ofpulp fractions
Sample Rl4 R28 R48 RlOO
LW 700 690 670 450
EW 690 680 655 440
EW fractions inc1uding R14, R28, R48 and RIOO, always had a slightly lower freeness
than those of LW. This might be accounted for by their higher water retention value and
more significant internaI fibrillation in comparison with the LW fibres.
9.2.2 Coarseness
As showed in Figure 9.23, the fibre coarseness decreases gradually from the R28 to
RIOO fractions or in order of fibre shortness, indicating the cell wall reduction
progressed as the fibre length decreased. The figure also reveals that LW yields coarser
fibres than that ofEW, which is expected since LW fibres have much greater initial cell
wall thickness than EW counterpart.
It should be noted that we did not measure the coarseness for Rl4 fraction because of a
technical difficulty of the FQA which tends to be c10gged with long fibres such as those
in the Rl4 fraction. However, according the microscopic study and the curve tendency
in Figure 9.23, we can still assume that the Rl4 fibres have highest coarseness among
the four fibre fractions.
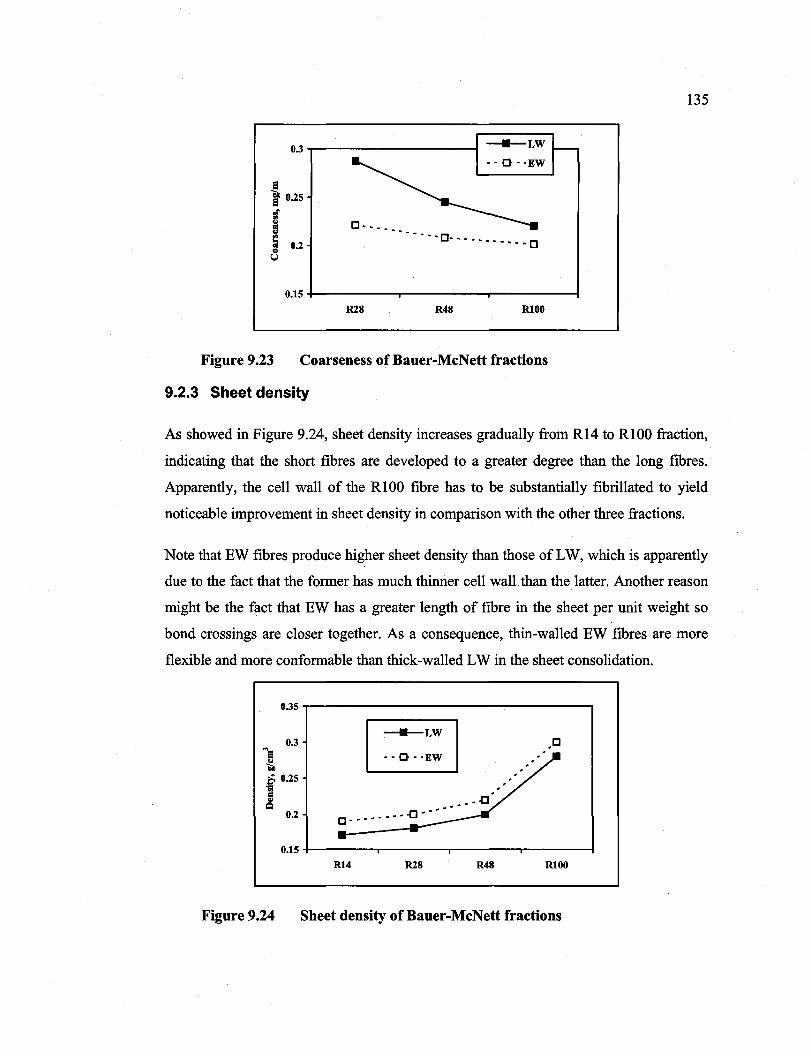
Reproduced with permission of the copyright owner. Further reproduction prohibited without permission.
0.3 -r-----------1
9
__ LW
- - 0 - 'EW
} 0.25
r 0.2 8
[J- _________ _
[J- - - - - - - - - - _ [J
0.15 +------r-----....,-------1 R28 R48 RIOO
Figure 9.23 Coarseness of Bauer-McNett fractions
9.2.3 Sheet density
135
As showed in Figure 9.24, sheet density increases gradually from Rl4 to RIOO fraction,
indicating that the short fibres are developed to a greater degree than the long fibres.
Apparently, the cell wall of the RIOO fibre has to be substantially fibrillated to yield
noticeable improvement in sheet density in comparison with the other three fractions.
Note that EW fibres produce higher sheet density than those of LW, which is apparently
due to the fact that the former has much thinner cell wall than the latter. Another reason
might be the fact that EW has a greater length of fibre in the sheet per unit weight so
bond crossings are c10ser together. As a consequence, thin-walled EW fibres are more
flexible and more conformable than thick-walled LW in the sheet consolidation.
035~-----------------,
0.3 "'9 ~ ~ 0.25 '/il
! 0.2
~ ~
c--------{] _-------.[J'
,[J
0.15 +-----r-----r----....,-------1 R14 R28 R48 RIOO
Figure 9.24 Sheet density of Bauer-McNett fractions

Reproduced with permission of the copyright owner. Further reproduction prohibited without permission.
136
9.2.4 Physical properties
As discussed earlier, the fibre coarseness decreased in order of the length fraction, which
is from R14 to RIOO fraction, indicating that the shorter fibres were better developed
than the longer ones. As a consequence, the strength properties such as Scott bond,
tensile index and burst index tend to follow the same trends but with increasing
magnitude (Figures 9.25, 9.26, and 9.27). The overall improvements in strength
properties occurred in both EW and LW pulps.
~LW 35 r--
ooOooEW
[Jo 0 0 0 0 0 0 0 o[J 30 . • [Jo 0 0 0 0 0 0 0 0
"'El . " . . ;:;; . " ..; [J"
= 25 e ,.Q
;:: e ... --<Il
20 .. 15
Rl4 R28 R48 RI00
Figure 9.25 Scott bond of Bauer-McNett fractions ~--------------------------------------~
~LW
20 000
0 ·EW
0-------:;/ [J 00000000 _
• • o
Rl4 R28 R48 RlOO
Figure 9.26 Tensile index of Bauer-McNett fractions
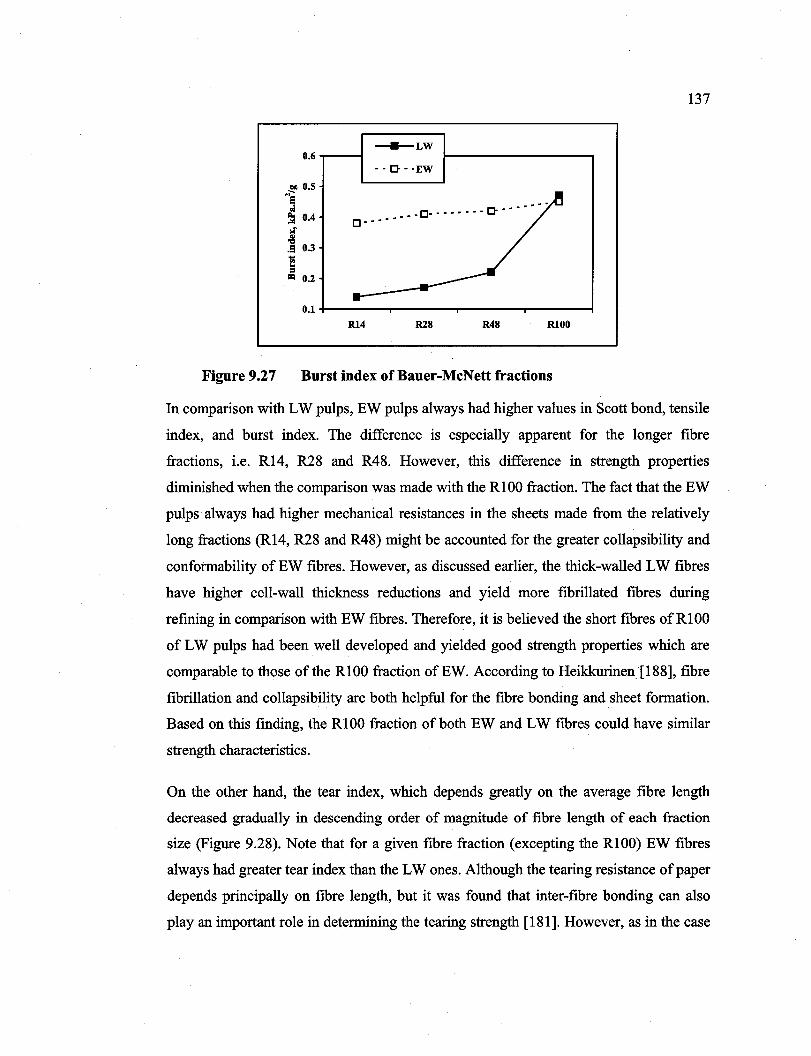
Reproduced with permission of the copyright owner. Further reproduction prohibited without permission.
0.6 -r---I ___ LW
- -O--EW
~ 0.5 Na
" ~ 0.4
~ .s 0.3
5 = 0.2
[} ---0- _ - - - - - - 0- - - - - - - -
0.1 +----..-------..,..------,-----1 R14 R28 R48 RI00
Figure 9.27 Burst index of Bauer-MeNett fractions
137
In comparison with LW pulps, EW pulps always had higher values in Scott bond, tensile
index, and burst index. The difference is especially apparent for the longer fibre
fractions, Le. R14, R28 and R48. However, this difference in strength properties
diminished when the comparison was made with the RI00 fraction. The fact that the EW
pulps always had higher mechanical resistances in the sheets made from the relatively
long fractions (R14, R28 and R48) might be accounted for the greater collapsibility and
conformability of EW fibres. However, as discussed earlier, the thick-walled LW fibres
have higher cell-wall thickness reductions and yield more fibrillated fibres during
refining in comparison with EW fibres. Therefore, it is be1ieved the short fibres of RI 00
of LW pulps had been well developed and yielded good strength properties which are
comparable to those of the RI00 fraction ofEW. According to Heikkurinen [188], fibre
fibrillation and collapsibility are both helpful for the fibre bonding and sheet formation.
Based on this finding, the RI00 fraction of both EW and LW fibres could have similar
strength characteristics.
On the other hand, the tear index, which depends greatly on the average fibre length
decreased gradually in descending order of magnitude of fibre length of each fraction
size (Figure 9.28). Note that for a given fibre fraction (excepting the RIOO) EW fibres
always had greater tear index than the LW ones. Although the tearing resistance of paper
depends principally on fibre length, but it was found that inter-fibre bonding can also
play an important role in determining the tearing strength [181]. However, as in the case
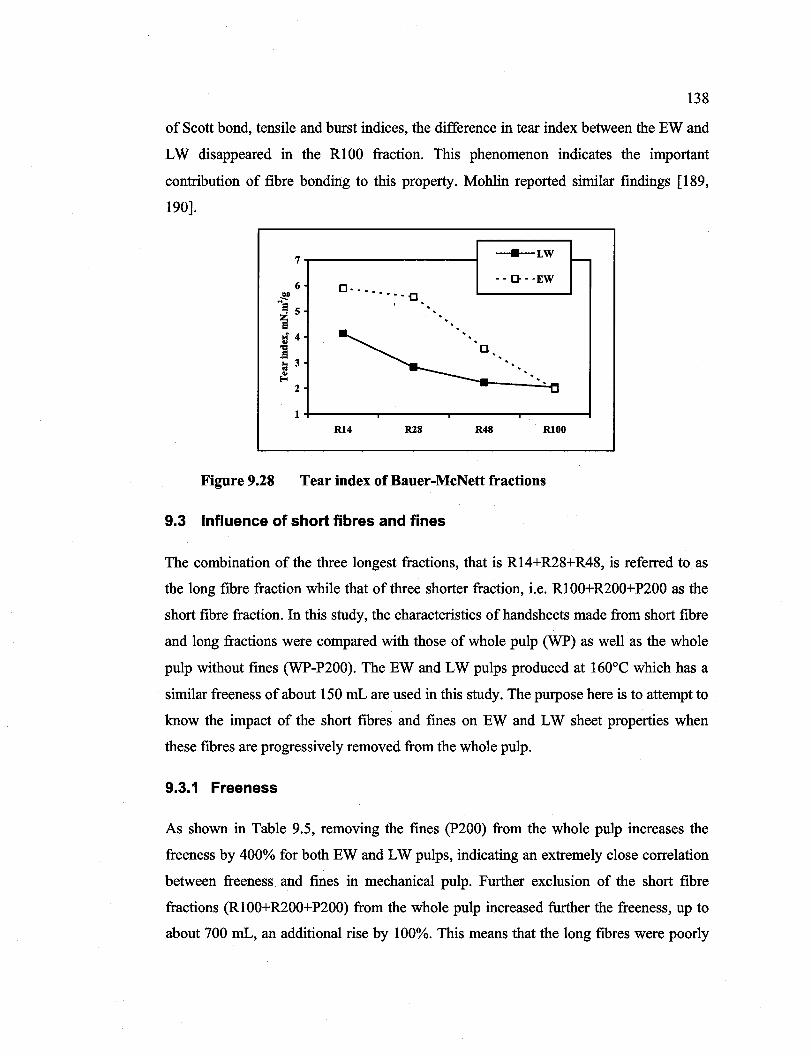
Reproduced with permission of the copyright owner. Further reproduction prohibited without permission.
138
of Scott bond, tensile and burst indices, the difference in tear index between the EW and
LW disappeared in the RI00 fraction. This phenomenon indicates the important
contribution of fibre bonding to this property. Mohlin reported similar findings [189,
190].
7~-----------------i
__ LW
- - 0 - 'EW 6 0-- _ -----0
l+-------~------r_------~----~
R14 R28 R48 RIOO
Figure 9.28 Tear index of Bauer-McNett fractions
9.3 Influence of short fibres and fines
The combination of the three longest fractions, that is RI4+R28+R48, is referred to as
the long fibre fraction while that of three shorter fraction, i.e. RI00+R200+P200 as the
short fibre fraction. In this study, the characteristics ofhandsheets made from short fibre
and long fractions were compared with those of whole pulp (WP) as well as the whole
pulp without fines (WP-P200). The EW and LW pulps produced at 160°C which has a
similar freeness of about 150 mL are used in this study. The purpose here is to attempt to
know the impact of the short fibres and fines on EW and LW sheet properties when
these fibres are progressively removed from the whole pulp.
9.3.1 Freeness
As shown in Table 9.5, removing the fines (P200) from the whole pulp increases the
freeness by 400% for both EW and LW pulps, indicating an extremely close correlation
between freeness and fines in mechanical pulp. Further exclusion of the short fibre
fractions (RI00+R200+P200) from the whole pulp increased further the freeness, up to
about 700 mL, an additional cise by 100%. This means that the long fibres were poorly
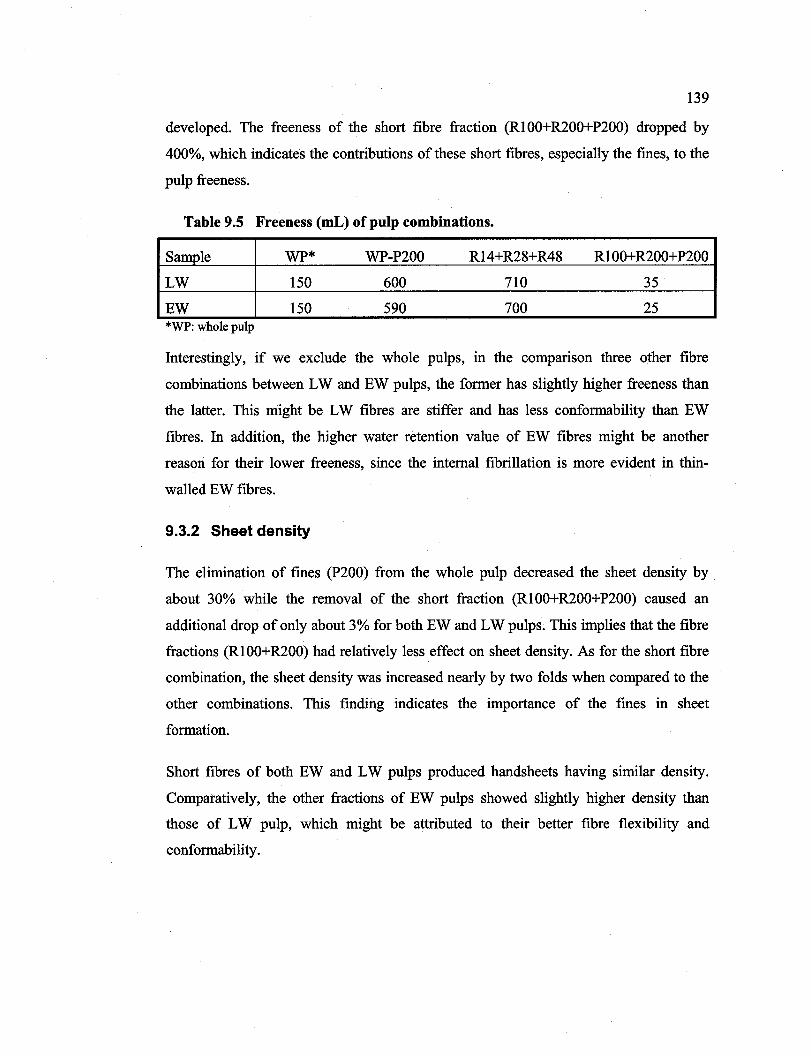
Reproduced with permission of the copyright owner. Further reproduction prohibited without permission.
139
developed. The freeness of the short fibre fraction (RIOO+R200+P200) dropped by
400%, which indicates the contributions of these short fibres, especially the fines, to the
pulp freeness.
Table 9.S Freeness (mL) ofpulp combinations.
Sample WP* WP-P200 RI4+R28+R48 RIOO+R200+P200
LW 150 600 710 35
EW 150 590 700 25 *WP: whole pulp
Interestingly, if we exclude the whole pulps, in the comparison three other fibre
combinations between LW and EW pulps, the former has slightly higher freeness than
the latter. This might be LW fibres are stiffer and has less conformability than EW
fibres. In addition, the higher water retention value of EW fibres might be another
reason for their lower freeness, since the internaI fibrillation is more evident in thin
walled EW fibres.
9.3.2 Sheet density
The elimination of fines (P200) from the whole pulp decreased the sheet density by
about 30% while the removal of the short fraction (RIOO+R200+P200) caused an
additional drop of only about 3% for both EW and LW pulps. This implies that the fibre
fractions (RI00+R200) had relatively less effect on sheet density. As for the short fibre
combination, the sheet density was increased nearly by two folds when compared to the
other combinations. This finding indicates the importance of the fines in sheet
formation.
Short fibres of both EW and LW pulps produced handsheets having similar density.
Comparatively, the other fractions of EW pulps showed slightly higherdensity than
those of LW pulp, which might be attributed to their better fibre flexibility and
conformability.
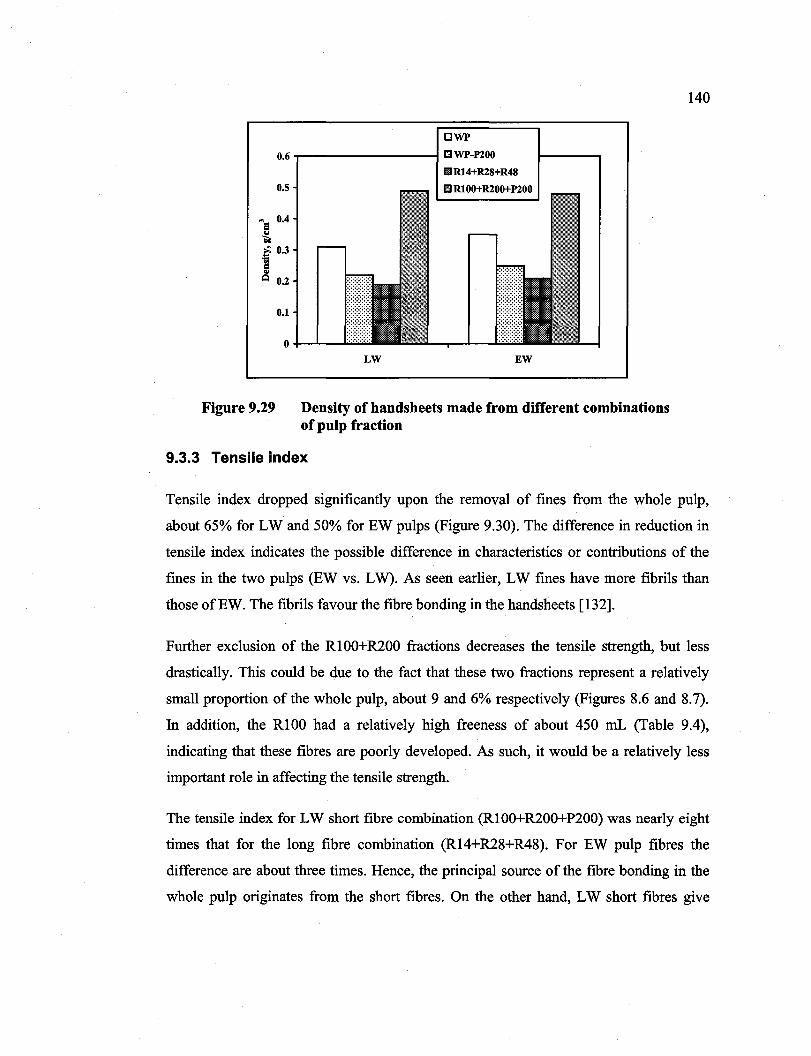
Reproduced with permission of the copyright owner. Further reproduction prohibited without permission.
DWP
0.6.,..---------1 CWP-P200
1iIR14+R28+R48
0.5
"'EI 0.4
~ ~ 0.3
-a ~ 0.2
0.1
Figure 9.29
LW EW
Density of handsheets made from different combinations of pulp fraction
9.3.3 Tensile index
140
Tensile index dropped significantly upon the removal of fines from the whole pulp,
about 65% for LW and 50% for EW pulps (Figure 9.30). The difference in reduction in
tensile index indicates the possible difference in characteristics or contributions of the
fines in the two pulps (EW vs. LW). As seen earlier, LW fines have more fibrils than
those ofEW. The fibrils favour the fibre bonding in the handsheets [132].
Further exclusion of the RIOO+R200 fractions decreases the tensile strength, but less
drastically. This could be due to the fact that these two fractions represent a relatively
small proportion of the whole pulp, about 9 and 6% respectively (Figures 8.6 and 8.7).
In addition, the RIOO had a relatively high freeness of about 450 mL (Table 9.4),
indicating that these fibres are poorly developed. As such, it would be a relatively less
important role in affecting the tensile strength.
The tensile index for LW short fibre combination (RIOO+R200+P200) was nearly eight
times that for the long fibre combination (RI4+R28+R48). For EW pulp fibres the
difference are about three times. Rence, the principal source of the fibre bonding in the
whole pulp originates from the short fibres. On the other hand, LW short fibres give
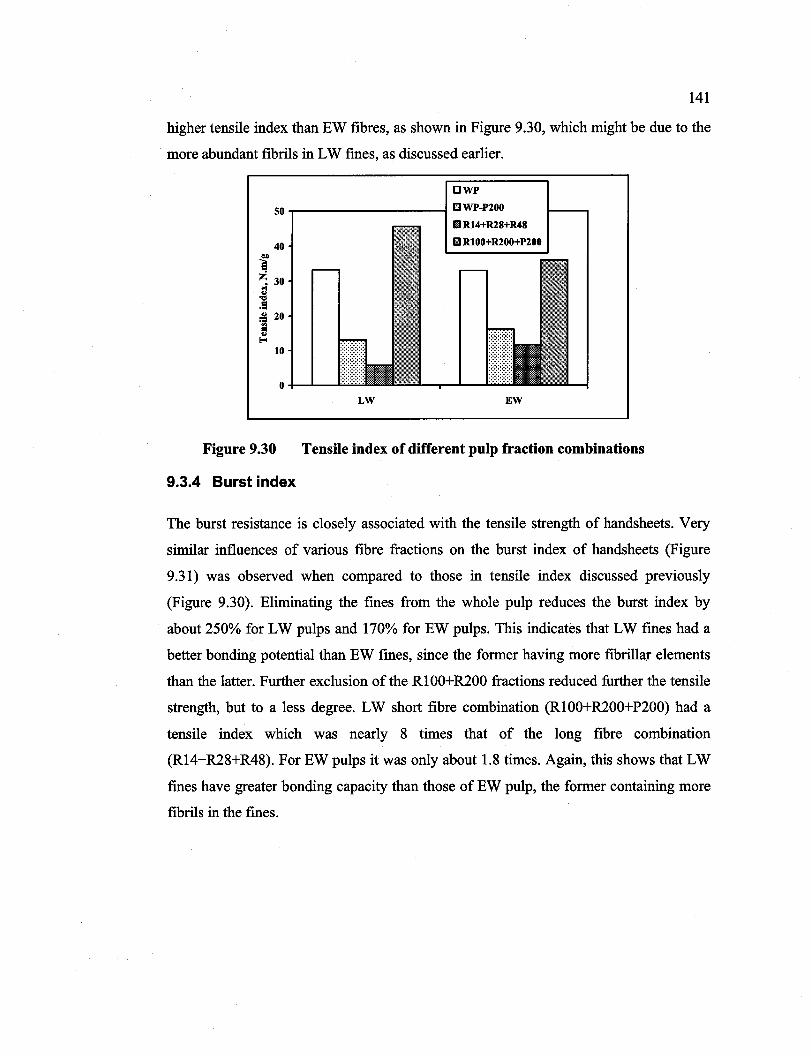
Reproduced with permission of the copyright owner. Further reproduction prohibited without permission.
141
higher tensile index than EW fibres, as shown in Figure 9.30, which might be due to the
more abundant fibrils in LW fines, as discussed earlier.
DWP
50 ...------------1 (]WP-P200
II RI4+R28+R48
40
~ :z:. 30
~ .51 ~ 20 .. i
E-< 10
0
LW EW
Figure 9.30 Tensile index of different pulp fraction combinations
9.3.4 Burst index
The burst resistance is closely associated with the tensile strength of handsheets. Very
similar influences of various fibre fractions on the burst index of handsheets (Figure
9.31) was observed when compared to those in tensile index discussed previously
(Figure 9.30). Eliminating the fines from the whole pulp reduces the burst index by
about 250% for LW pulps and 170% for EW pulps. This indicates that LW fines had a
better bonding potential than EW fines, since the former having more fibrillar elements
than the latter. Further exclusion of the RI00+R200 fractions reduced further the tensile
strength, but to a less degree. LW short fibre combination (RI00+R200+P200) had a
tensile index which was nearly 8 times that of the long fibre combination
(RI4+R28+R48). For EW pulps it was only about 1.8 times. Again, this shows that LW
fmes have greater bonding capacity than those of EW pulp, the former containing more
fibrils in the fines.
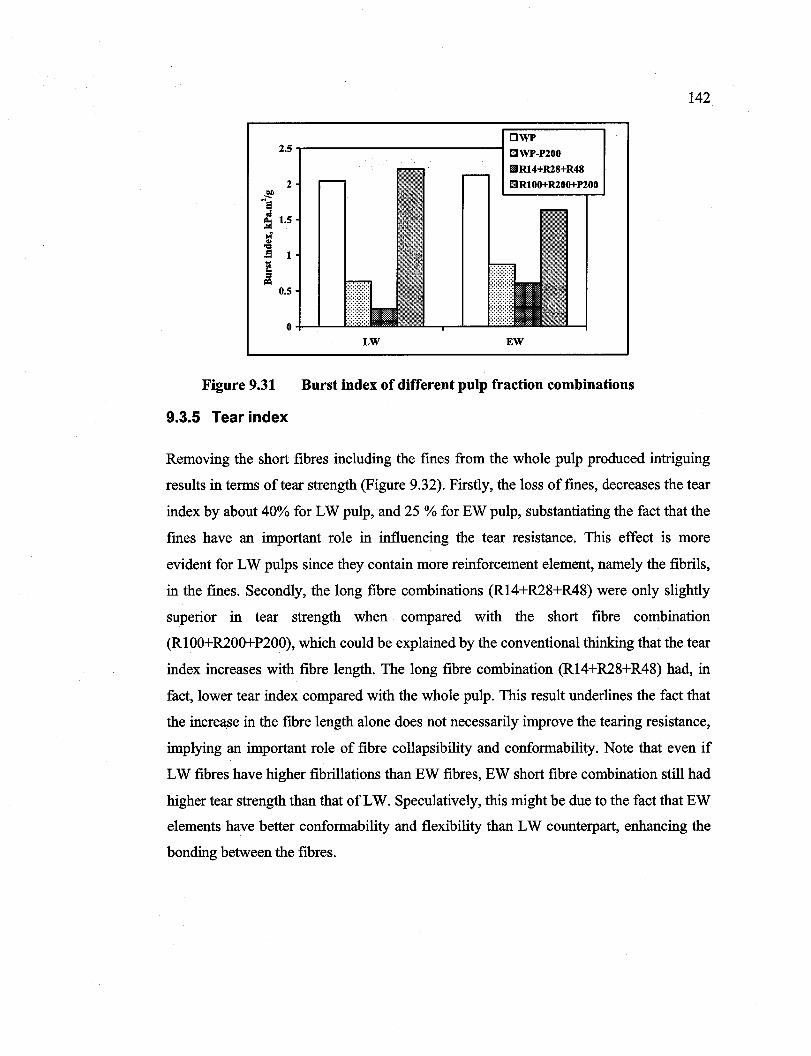
Reproduced with permission of the copyright owner. Further reproduction prohibited without permission.
Figure 9.31
DWP 2.5...-------------1 I::IWP-P200
2
0.5
LW
III R14+R28+R48
I1!!IRIOO+R200+P200
EW
Burst index of different pulp fraction combinations
9.3.5 Tear index
142
Removing the short fibres inc1uding the fines from the whole pulp produced intriguing
results in terms oftear strength (Figure 9.32). Firstly, the 10ss offmes, decreases the tear
index by about 40% for LW pulp, and 25 % for EW pulp, substantiating the fact that the
fines have an important role in influencing the tear resistance. This effect is more
evident for LW pulps since they contain more reinforcement element, namely the fibrils,
in the fines. Secondly, the long fibre combinations (RI4+R28+R48) were only slightly
superior in tear strength when compared with the short fibre combination
(RlOO+R200+P200), which could be explained by the conventional thinking that the tear
index increases with fibre length. The long fibre combination (RI4+R28+R48) had, in
fact, lower tear index compared with the whole pulp. This result underlines the fact that
the increa,se in the fibre length alone does not necessarily improve the tearing resistance,
implying an important role of fibre collapsibility and conformability. Note that even if
LW fibres have higher fibrillations than EW fibres, EW short fibre combination still had
higher tear strength than that of LW. Speculatively, this might be due to the fact that EW
elements have better conformability and flexibility than LW counterpart, enhancing the
bonding between the fibres.
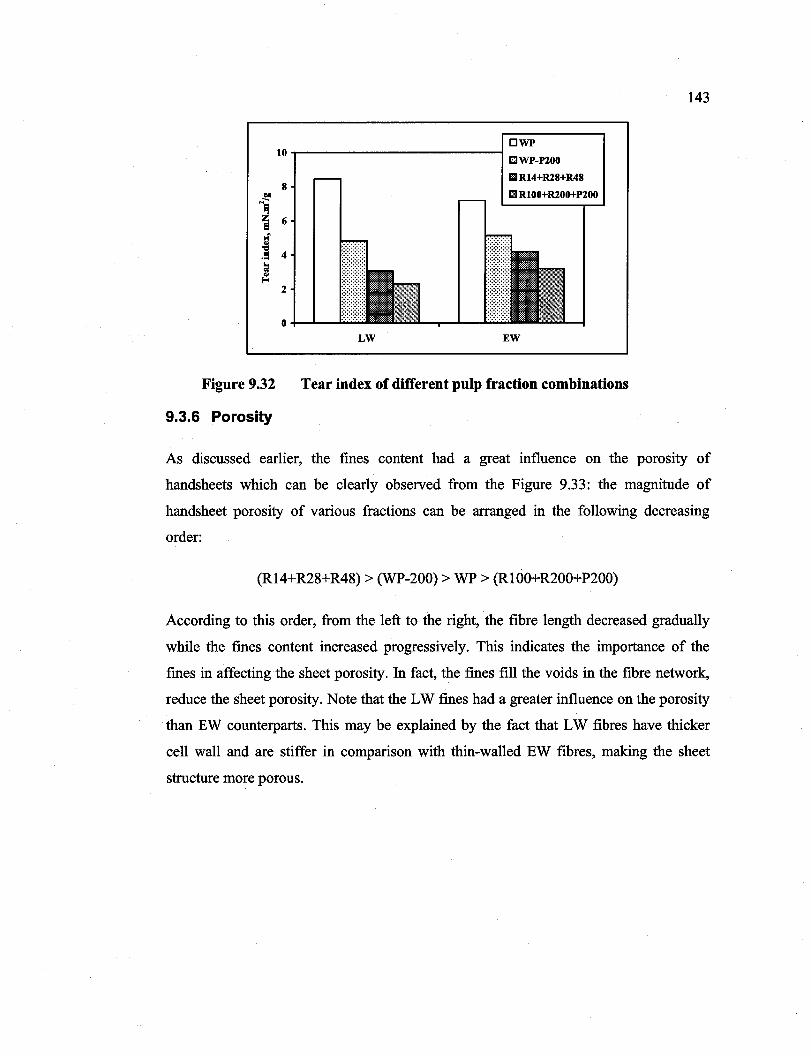
Reproduced with permission of the copyright owner. Further reproduction prohibited without permission.
~ Na ~ ~ .S! .. œ .. E-<
Figure 9.32
9.3.6 Porosity
10
8
6
4
2
0
[]WP -r-------------i tJWP-P200
LW
IIIR14+R28+R48
IIR100+R200+P200
EW
Tear index of different pulp fraction combinations
143
As discussed earlier, the fines content had a great influence on the porosity of
handsheets which can be c1early observed from the Figure 9.33: the magnitude of
handsheet porosity of various fractions can be arranged in the following decreasing
order:
(RI4+R28+R48) > (WP-200) > WP > (RlOO+R200+P200)
According to this order, from the left to the right, the fibre length decreased gradually
while the fines content increased progressive1y. This indicates the importance of the
fmes in affecting the sheet porosity. In fact, the fines fill the voids in the fibre network,
reduce the sheet porosity. Note that the LW fines had a greater influence on the porosity
than EW counterparts. This may be explained by the fact that LW fibres have thicker
cell wall and are stiffer in comparison with thin-walled EW fibres, making the sheet
structure more porous.
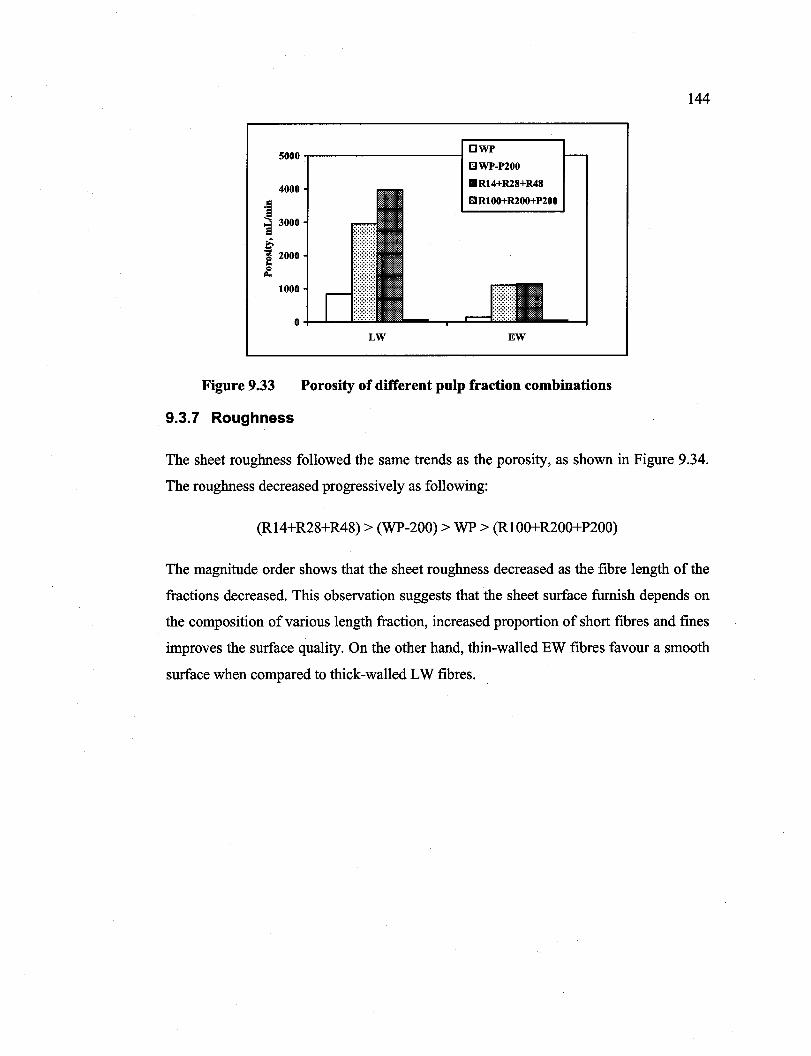
Reproduced with permission of the copyright owner. Further reproduction prohibited without permission.
5000 ,.-----------1 DWP DWP-P200
4000 IIRI4+R28+R48
.~ El! RI00+R200+P200
i 3000
~ l 2000
~ 1000
O+--'--~=
LW EW
Figure 9.33 Porosity of different pulp fraction combinations
9.3.7 Roughness
144
The sheet roughness followed the same trends as the porosity, as shown in Figure 9.34.
The roughness decreased progressively as following:
(R14+R28+R48) > (WP-200) > WP > (R100+R200+P200)
The magnitude order shows that the sheet roughness decreased as the fibre length of the
fractions decreased. This observation suggests that the sheet surface furnish depends on
the composition of various length fraction, increased proportion of short fibres and fines
improves the surface quality. On the other hand, thin-walled EW fibres favour a smooth
surface when compared to thick-walled LW fibres.

Reproduced with permission of the copyright owner. Further reproduction prohibited without permission.
145
10 DWP
l'!:IWP-P200
III R14+R28+R48 8
a =. 6 ,;; .. .. ~ l>4l
4 =' ~
2
0
LW EW
Figure 9.34 Roughness of different pulp fraction combinations
9.4 Influence of mixing processes
In this part of our study, we attempt to investigate the influence on pulp properties of co
refming of EW and LW chips and on the blending of EW and LW pulps which were
separately refmed. In the case of post-refining blending we used the same weight
proportion of EW and LW as in the chip mixture for co-refining. We used the term
"Chip Mixing" to signify the co-refming process, and "Pulp Mixing" to indicate the
post-refming blending of EW and LW pulps after separate refming. For this study, we
employed the pulps produced at 160°C and had freeness range of 50-250 mL.
9.4.1 Effect on fibre properties
9.4.1.1 Fibre length
Refining of mixture of EW and LW chips gave better fibre length than refming of EW
and LW chips separately (Figure 9.35). As a result, this translates into less fibre length
reduction in the co-refining process (Figure 9.36).
As indicated in 9.37, when compared with the fibre length reduction of EW and LW
pulps in their individual refining, thin-walled EW fibres were more fragile and suffered
severer fibre cutting (fibre length reduction) than thick-walled LW fibres.
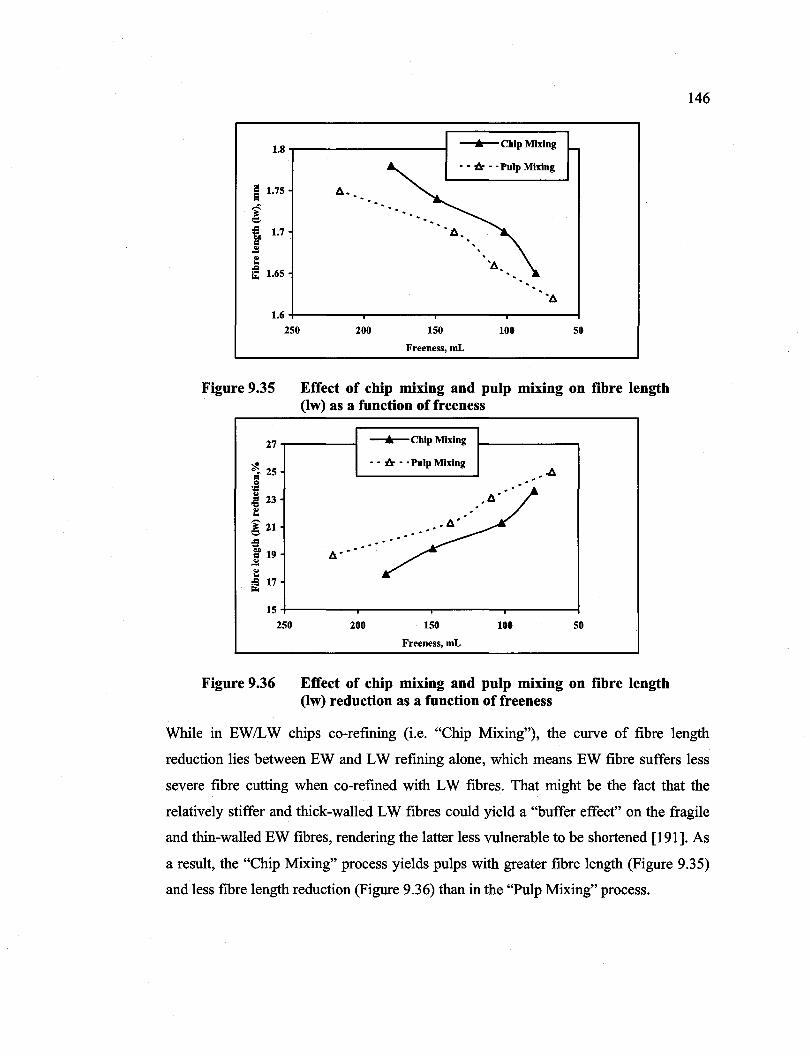
Reproduced with permission of the copyright owner. Further reproduction prohibited without permission.
1.8,----------1 --....-Chip Mixing
~ 1.75
i: e '! 1.7 j e ~ 1.65
/::;..
- - t:r - • Pulp Mixing
. . -/::;..
1.6 +----__r_------r-----r------I 250
Figure 9.35
200 150 100 50
Freeness, mL
Effect of chip mixing and pulp mixing on fibre length (lw) as a function of freeness
27 -r-------I --""-Chip Mixing
~ 25
~ .. .g 23 e ~ 21 -= i 19 ..! e ~ 17
- - t:r - . Pulp Mixing
15+----~----r_---__r_---___I
250
Figure 9.36
200 150 100 50
Freeness, mL
Effect of chip mixing and pulp mixing on fibre length (lw) reduction as a function of freeness
146
While in EWILW chips co-refining (i.e. "Chip Mixing"), the curve of fibre length
reduction lies between EW and LW refining alone, which means EW fibre suffers less
severe fibre cutting when co-refined with LW fibres. That might be the fact that the
relatively stiffer and thick-walled LW fibres could yield a "buffer effect" on the fragile
and thin-walled EW fibres, rendering the latter less vulnerable to be shortened [191]. As
a result, the "Chip Mixing" process yields pulps with greater fibre length (Figure 9.35)
and less fibre length reduction (Figure 9.36) than in the "Pulp Mixing" process.
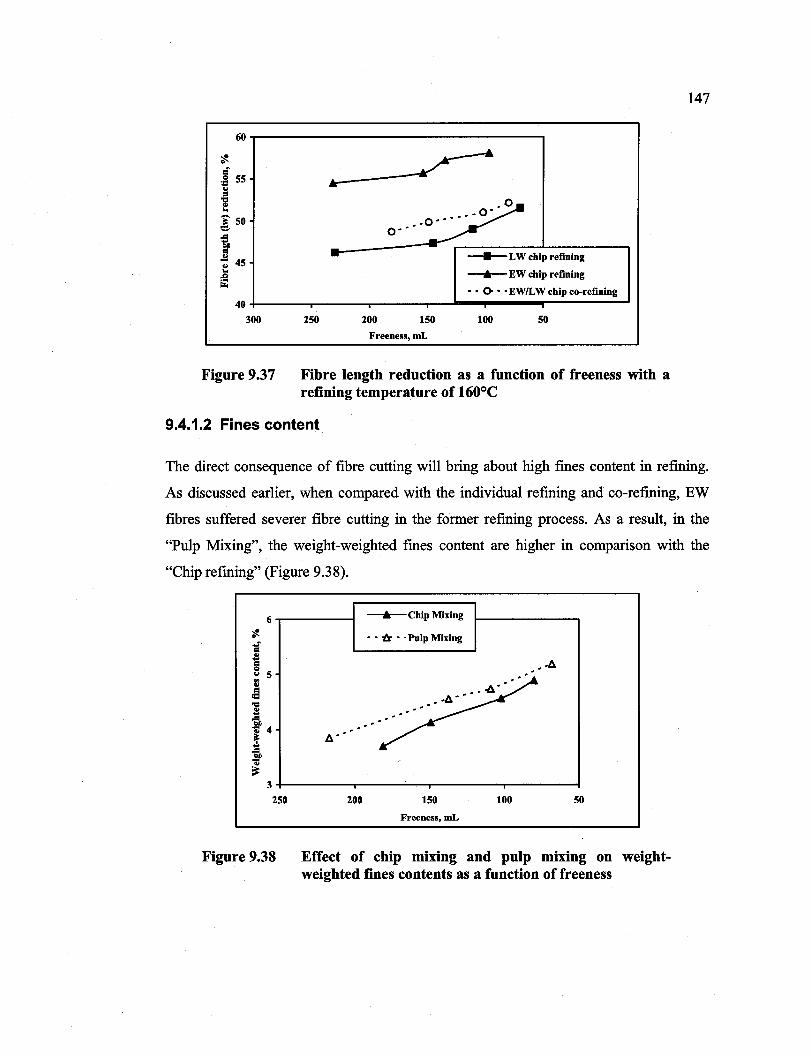
Reproduced with permission of the copyright owner. Further reproduction prohibited without permission.
60
40
300
Figure 9.37
~ .. ~ O"'~:"~
• __ LW chip refining
--.-EW chip refining
- - 0- - . EW/LW chip co-refining
250 200 150 100 50
Freeness, mL
Fibre length reduction as a function of freeness with a refining temperature of 160°C
9.4.1.2 Fines content
147
The direct consequence of fibre cutting will bring about high fines content in refining.
As discussed earlier, when compared with the individual refining and co-refining, EW
fibres suffered severer fibre cutting in the former refining process. As a result, in the
"Pulp Mixing", the weight-weighted fmes content are higher in comparison with the
"Chip refining" (Figure 9.38).
6 "T"'""-----I --'-Chip Mixing
- - à - . Pulp Mixing
•• b.
3+-----,~----r----~---~
250
Figure 9.38
200 150 100 50
Freeness, mL
Effect of chip mixing and pulp mixing on weightweighted fines contents as a function of freeness
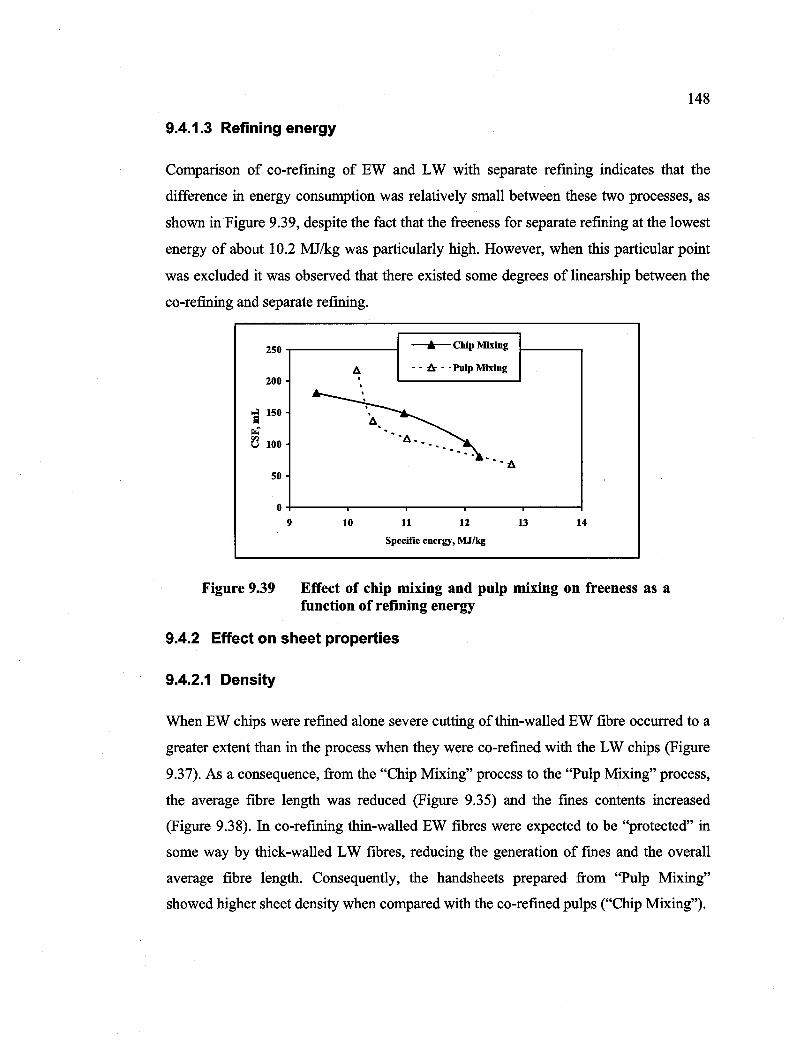
Reproduced with permission of the copyright owner. Further reproduction prohibited without permission.
148
9.4.1.3 Refining energy
Comparison of co-refming of EW and LW with separate refming indicates that the
difference in energy consumption was relative1y small between these two processes, as
shown in Figure 9.39, despite the fact that the freeness for separate refining at the lowest
energy of about 10.2 MJ/kg was particularly high. However, when this particular point
was exc1uded it was observed that there existed sorne degrees of linearship between the
co-refming and separate refining.
2S0 --...-Chip Mixing
Il. - - -& - • Pulp Mixing 200 .
i ISO
r.: ~ 100
SO
0 9 10 11 12 13 14
Specifie energy, MJIkg
Figure 9.39 Effeet of ehip mixing and pulp mixing on freeness as a funetion of refining energy
9.4.2 Effect on sheet properties
9.4.2.1 Density
When EW chips were refined alone severe cutting of thin-walled EW fibre occurred to a
greater extent than in the process when they were co-refined with the LW chips (Figure
9.37). As a consequence, from the "Chip Mixing" process to the "Pulp Mixing" process,
the average fibre length was reduced (Figure 9.35) and the fines contents increased
(Figure 9.38). In co-refining thin-walled EW fibres were expected to be "protected" in
sorne way by thick-walled LW fibres, reducing the generation of fmes and the overall
average fibre length. Consequently, the handsheets prepared from "Pulp Mixing"
showed higher sheet density when compared with the co-refined pulps ("Chip Mixing").

Reproduced with permission of the copyright owner. Further reproduction prohibited without permission.
0.4...----~
"'a 0.35
~ ~
] ... 0.3
----...- Chip Mixing
- - â- - . Pulp Mixing A
0.25 +----.....----""'"T"------r------I 250
Figure 9.40
200 150 100 50
Freeness, mL
Effect of chip mixing and pulp mixing on density as a function of freeness
9.4.2.2 Physical properties
149
Blending of pulp after separate refining yielded better tensile and burst indices than the
co-refming process Figures 9.41 and 9.42 show. These characteristics may be explained
by the fact that separate refining of EW and LW generated more fines than the co
refining of EW and LW (Figure 9.38). The increase in fines content is beneficial for
fibre bonding, improving the mechanical resistances of paper.
In contrast, the "Chip Refining", or co-refming gave higher tear index than the post
refining blending of pulps or "Pulp Mixing" (Figure 9.43) process. It is because co
refming had less fibre cutting effect than the separate refining, particularly for the thin-
walled EW fibres. In co-refming, the less resistant EW fibres are "protected" by thick
walled LW fibres against the harsh mechanical action exerted by the refmer bars, a
"buffer effect", thus minimizing the fibre shortening effect. The resulting increase in
average fibre length helps improve the tear resistance ofhandsheets.
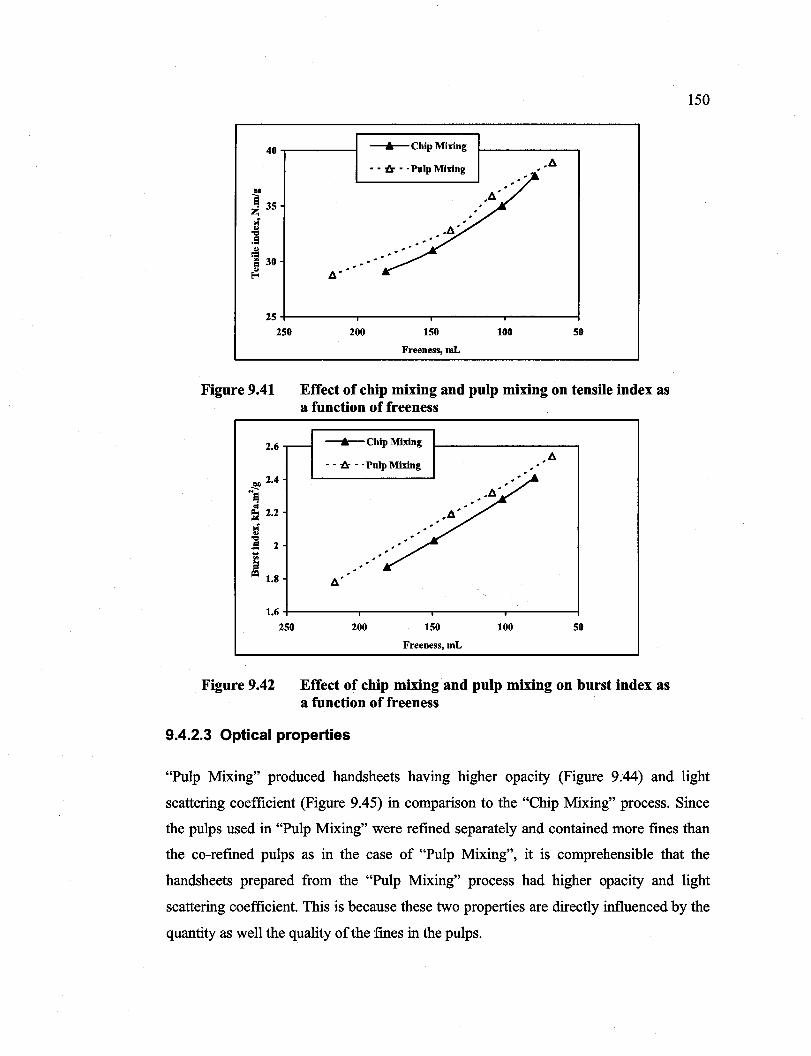
Reproduced with permission of the copyright owner. Further reproduction prohibited without permission.
40 T"""----I
1>4)
El 35 Z
i .51 " 1 30 ~ Il'
-""-Chip Mixing
, , {!r , • Pulp Mixing
25+----~---~----r_--___I
250 200 150 100 50
Freeness, mL
Figure 9.41 Effect of chip mixing and pulp mixing on tensile index as a function of freeness
2.6 -....-Chip Mixing
- - {!r - • Pulp Mixing
1.6 +----~---__r---___.,...._--___1
250
Figure 9.42
200 150 100 50
Freeness, mL
Effect of chip mixing and pulp mixing on burst index as a function of freeness
9.4.2.3 Optical properties
150
"Pulp Mixing" produced handsheets having higher opacity (Figure 9.44) and light
scattering coefficient (Figure 9,45) in comparison to the "Chip Mixing" process. Since
the pulps used in "Pulp Mixing" were refined separately and contained more fmes than
the co-refined pulps as in the case of "Pulp Mixing", it is comprehensible that the
handsheets prepared from the "Pulp Mixing" process had higher opacity and light
scattering coefficient. This is because these two properties are directly influenced by the
quantity as well the quality of the fines in the pulps.
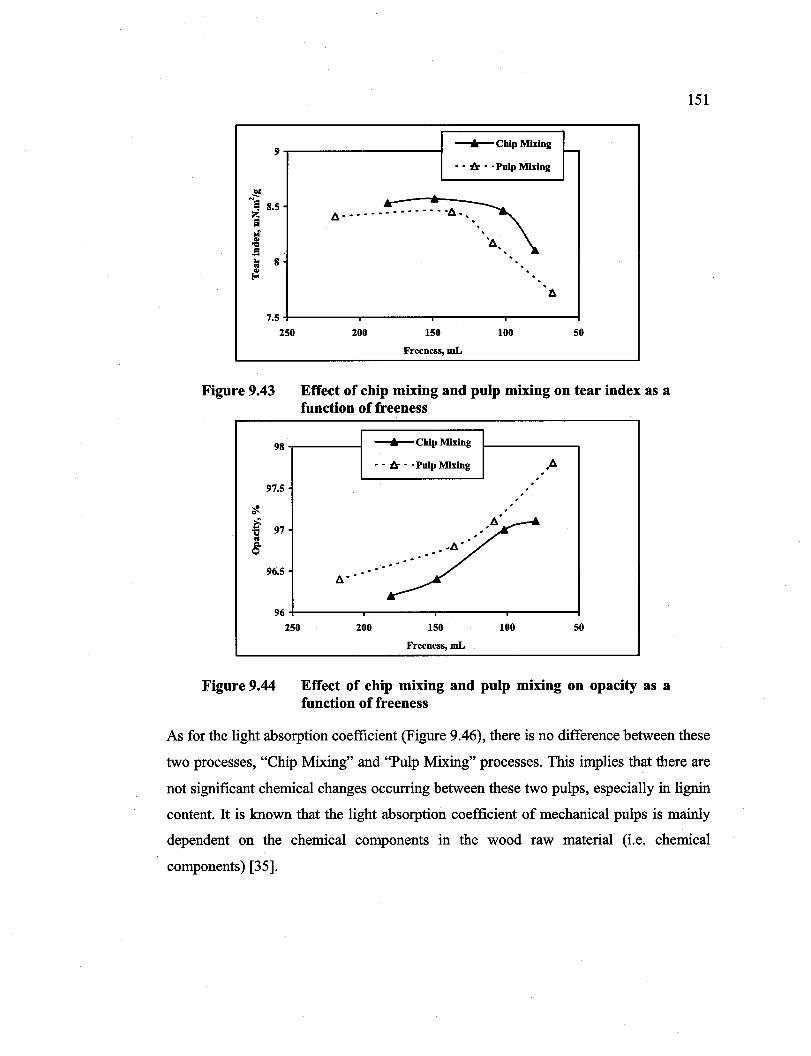
Reproduced with permission of the copyright owner. Further reproduction prohibited without permission.
9
..!!l Na 8.5
~ ~ ~ .s .. 8 01 QI
1-<
7.5 250
Figure 9.43
98
97.5
'$.
t 97 01
~ 96.5
96 250
Figure 9.44
---+-Chip Mixing f--
•• {z •. Pulp Mixing
1:. • ••••• ~ •••••• • 1:. •• . , , 'l:., , . , , . . . .
~
200 150 100 50
Freeness, mL
Effect of chip mixing and pulp mixing on tear index as a function of freeness
---+-Chip Mixing
•• {z •. Pulp Mixing
..
200 150
Freeness, mL
. .
100
.'
50
Effect of chip mixing and pulp mixing on opacity as a function of freeness
151
As for the light absorption coefficient (Figure 9.46), there is no difference between these
two processes, "Chip Mixing" and "Pulp Mixing" processes. This implies that there are
not significant chemical changes occurring between these two pulps, especially in lignin
content. It is known that the light absorption coefficient of mechanical pulps is mainly
dependent on the chemical components in the wood raw material (i.e. chemical
components) [35].
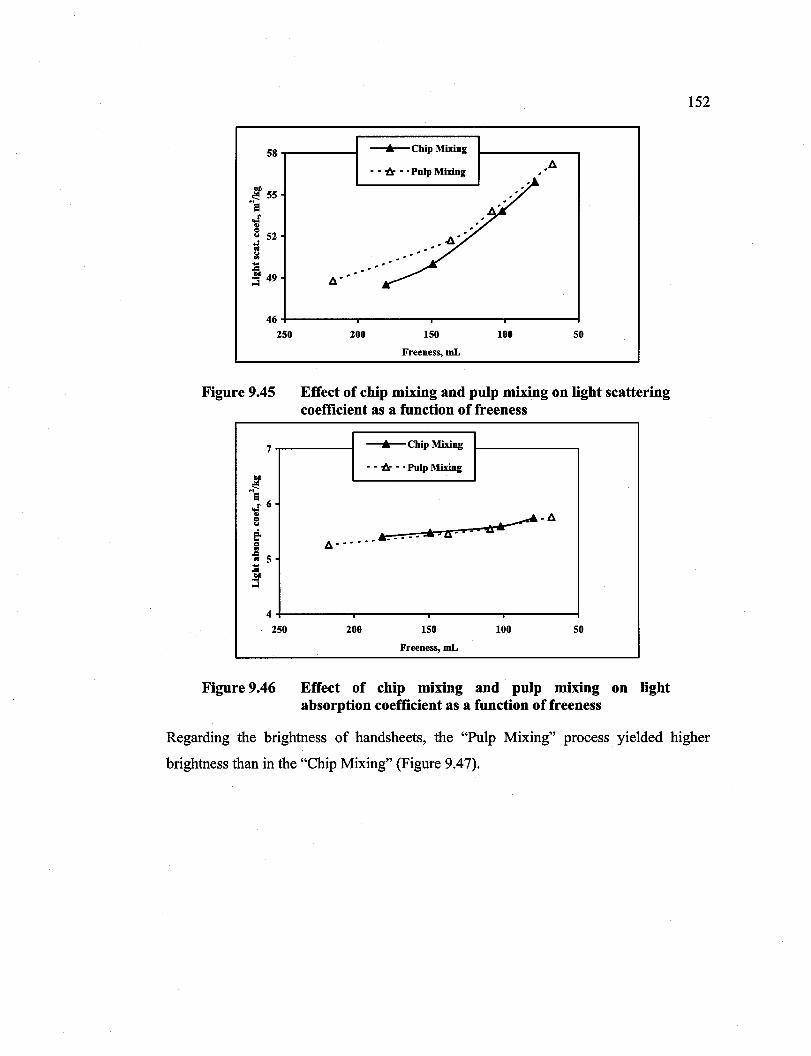
Reproduced with permission of the copyright owner. Further reproduction prohibited without permission.
58-r-----I -"'-Chip Mixing
- - t:r - . Pulp Mixing
... b." . -
46+-------~--------~--------~------__I
250
Figure 9.45
7
4
250
Figure 9.46
200 150 100 50
Freeness, mL
Effect of chip mixing and pulp mixing on light scattering coefficient as a function of freeness
-...-Chip Mixing
- - t:r - . Pulp Mixing
~-b. Ir.- _ - - "-n- -. 06
b.------
200 150 100 50
Freeness, mL
Effect of chip mixing and pulp mlxmg on light absorption coefficient as a function of freeness
152
Regarding the brightness of handsheets, the "Pulp Mixing" process yielded higher
brightness than in the "Chip Mixing" (Figure 9.47).
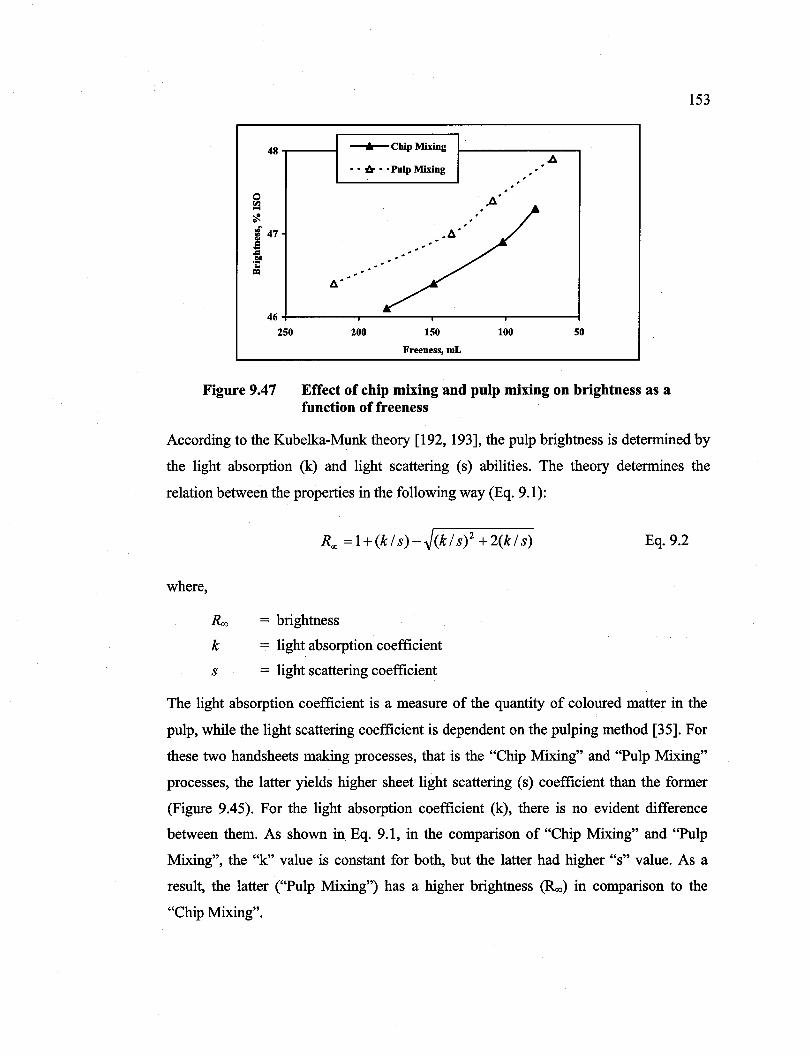
Reproduced with permission of the copyright owner. Further reproduction prohibited without permission.
48 -r-----1 ---+-Chip Mixing
•• -& •. Pulp Mixiug
46+-------~------~--------~----~
250 200 150 100 50
Freeness, mL
Figure 9.47 Effect of chip mixing and pulp mixing on brightness as a function of freeness
153
According to the Kubelka-Munk theory [192, 193], the pulp brightness is determined by
the light absorption (k) and light scattering (s) abilities. The theory determines the
relation between the properties in the following way (Eq. 9.1):
Eq.9.2
where,
Roo = brightness
k = light absorption coefficient
s = light scattering coefficient
The light absorption coefficient is a measure of the quantity of coloured matter in the
pulp, while the light scattering coefficient is dependent on the pulping method [35]. For
these two handsheets making processes, that is the "Chip Mixing" and "Pulp Mixing"
processes, the latter yields higher sheet light scattering (s) coefficient than the former
(Figure 9.45). For the light absorption coefficient (k), there is no evident difference
between them. As shown in Eq. 9.1, in the comparison of "Chip Mixing" and "Pulp
Mixing", the "k" value is constant for both, but the latter had higher "s" value. As a
result, the latter ("Pulp Mixing") has a higher brightness (Roo) in comparison to the
"Chip Mixing".
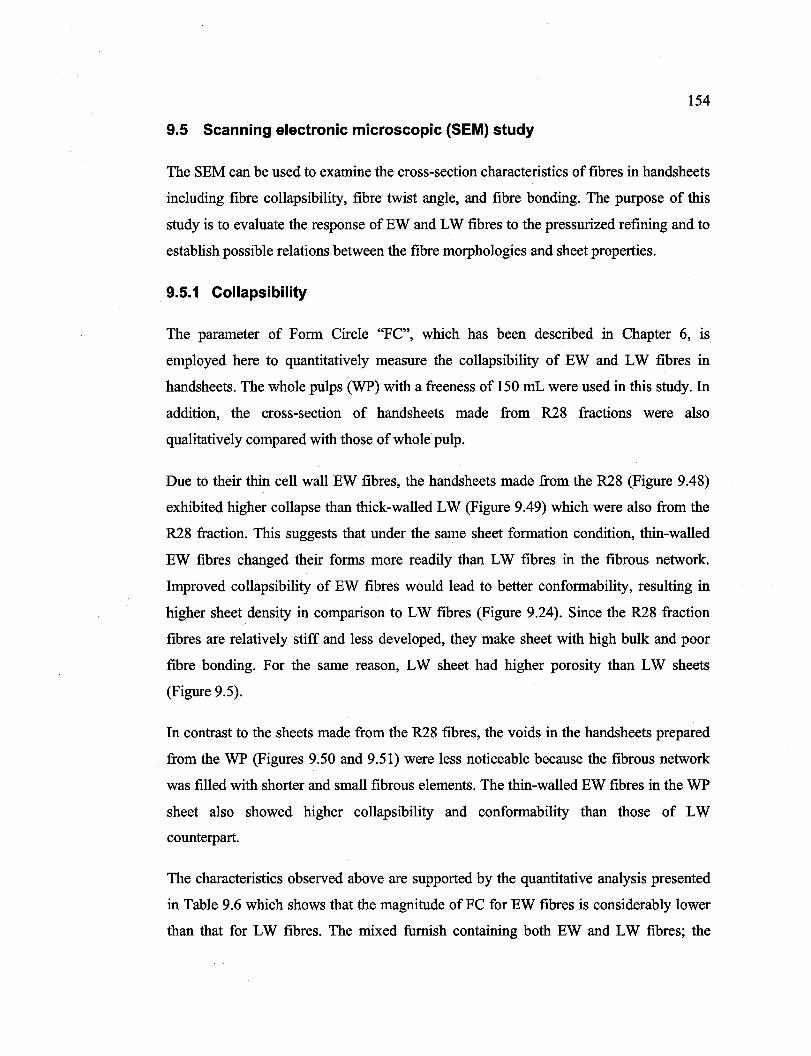
Reproduced with permission of the copyright owner. Further reproduction prohibited without permission.
154
9.5 Scanning electronic microscopie (SEM) study
The SEM can be used to examine the cross-section characteristics of fibres in handsheets
inc1uding fibre collapsibility, fibre twist angle, and fibre bonding. The purpose of this
study is to evaluate the response of EW and LW fibres to the pressurized refining and to
establish possible relations between the fibre morphologies and sheet properties.
9.5.1 Collapsibility
The parameter of Form Circ1e "FC", which has been described in Chapter 6, is
employed here to quantitatively measure the collapsibility of EW and LW fibres in
handsheets. The whole pulps (WP) with a freeness of 150 mL were used in this study. In
addition, the cross-section of handsheets made from R28 fractions were also
qualitatively compared with those of whole pulp.
Due to their thin cell wall EW fibres, the handsheets made from the R28 (Figure 9.48)
exhibited higher collapse than thick-walled LW (Figure 9.49) which were also from the
R28 fraction. This suggests that under the same sheet formation condition, thin-walled
EW fibres changed their forms more readily than LW fibres in the fibrous network.
Improved collapsibility of EW fibres would lead to better conformability, resulting in
higher sheet density in comparison to LW fibres (Figure 9.24). Since the R28 fraction
fibres are relatively stiff and less developed, they make sheet with high bulk and poor
fibre bonding. For the same reason, LW sheet had higher porosity than LW sheets
(Figure 9.5).
In contrast to the sheets made from the R28 fibres, the voids in the handsheets prepared
from the WP (Figures 9.50 and 9.51) were less notice able because the fibrous network
was filled with shorter and small fibrous elements. The thin-walled EW fibres in the WP
sheet also showed higher collapsibility and conformability than those of LW
counterpart.
The characteristics observed above are supported by the quantitative analysis presented
in Table 9.6 which shows that the magnitude ofFC for EW fibres is considerably lower
than that for LW fibres. The mixed fumish containing both EW and LW fibres; the
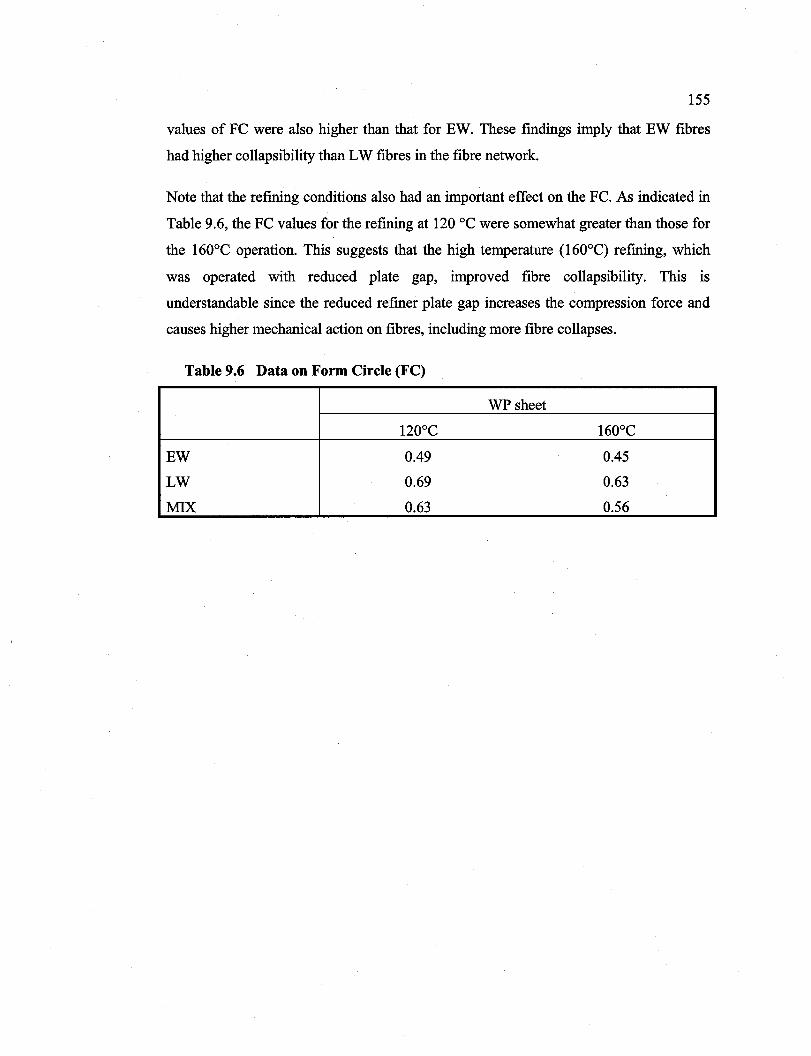
Reproduced with permission of the copyright owner. Further reproduction prohibited without permission.
155
values of FC were also higher than that for EW. These findings imply that EW fibres
had higher collapsibility than LW fibres in the fibre network.
Note that the refining conditions also had an important effect on the FC. As indicated in
Table 9.6, the FC values for the refining at 120 oC were somewhat greater than those for
the 160°C operation. This suggests that the high temperature (160°C) refming, which
was operated with reduced plate gap, improved fibre collapsibility. This is
understandable since the reduced refiner plate gap increases the compression force and
causes higher mechanical action on fibres, inc1uding more fibre collapses.
Table 9.6 Data on Form Circle (FC)
WP sheet
120°C 160°C
EW 0.49 0.45
LW 0.69 0.63
MIX 0.63 0.56
Reproduced with permission of the copyright owner. Further reproduction prohibited without permission.
Figure 9.48 SEM micrograph showing a cross-section of EW sheet made from R28 fraction 680
Figure 9.49 SEM micrograph showing a cross-section of LW sheet made from R28 fraction (CSF: 690 mL, rermed at 160°C)
156
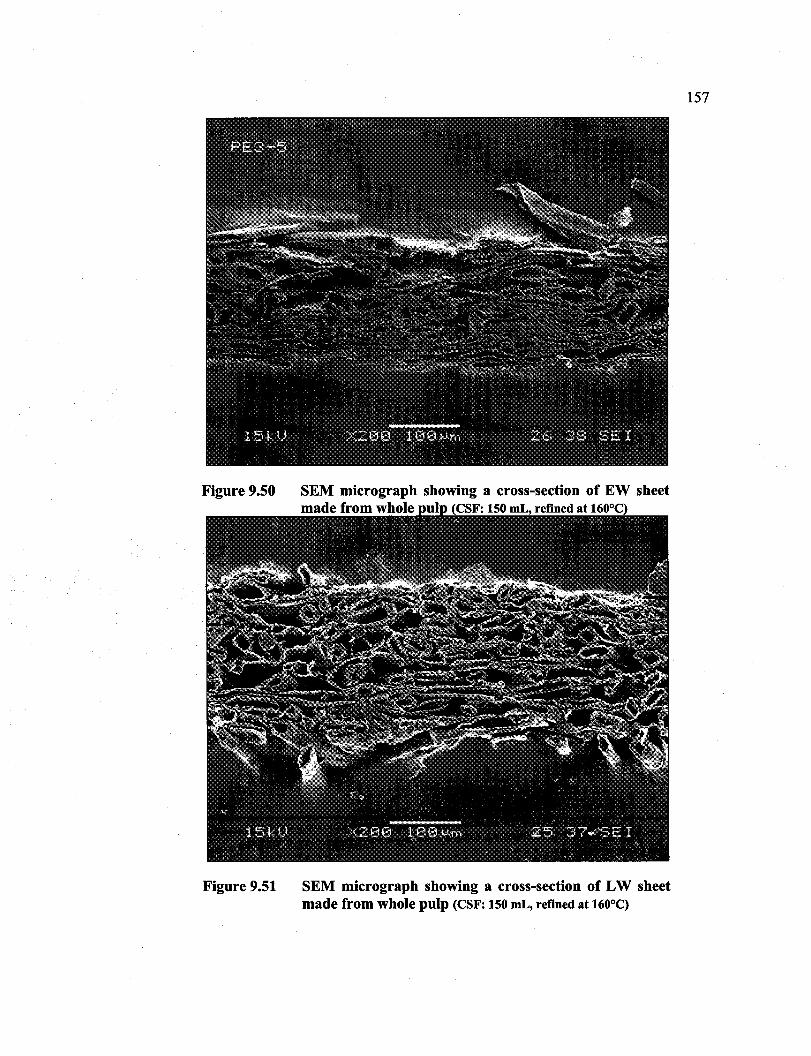
Reproduced with permission of the copyright owner. Further reproduction prohibited without permission.
Figure 9.50 SEM micrograph showing a cross-section of EW sheet made from whole 150
Figure 9.51 SEM micrograph showing a cross-section of LW sheet made from whole pulp (CSF: 150 mL, refined at 160°C)
157

Reproduced with permission of the copyright owner. Further reproduction prohibited without permission.
158
9.5.2 Twist angle
As discussed in section 6.7.1.2, the twist angle was the angle measured between the
longe st dimension of fibre cross section and the horizontal frame of the image. The
orientation of the fibre with respect to the paper plane (fibre twisting) could strongly
affect the structure of the paper. The reduction in fibre twist would decrease the amount
of space taken by the fibre in the paper structure, thereby reducing the void space and
increasing the density of paper. The reduction in fibre twist could also increase the
potential bonding surface area of the fibres, especially for the collapsed fibres [156].
Table 9.7 reveals several tendencies. Firstly, the high temperature refining (160°)
produced fibres with lower twist angles in both R28 and WP sheet, when compared to
the low temperature refining at 1200 e. This is because the reduced refiner plate gap used
at high temperature refining yiel4ed more collapsed fibres, resulting in less fibre twist
during the sheet formation. Second1y, when compared with the WP sheet, the R28 sheet
has higher twist angles. This is mainly due to the fact that the R28 fibres were stiffer and
less developed than the shorter and smaller elements in the WP pulps, resulting higher
twists in the fibre network. Thirdly, the LW fibres always had the higher twist angle than
those of EW. In the mixed furnish, which contained LW and EW fibres, the twist angle
was greater than that for EW fibres but lower than that for LW fibres. This is because
LW fibres are stiffer than thin-walled EW fibres, and have less conformability and more
twists than the latter. Owing to their less twists, the EW pulps have higher sheet density
than that ofEW sheet, as indicated in Figure 9.1.
Table 9.7 Twist angles e) in different handsheets
R28 sheet WP sheet
1200 e 1600 e 1200 e 1600 e EW 16.1 10.2 8.5 3.9
LW 32.8 27.6 10.5 11.3
MIX 28.9 24.7 9.1 10.1
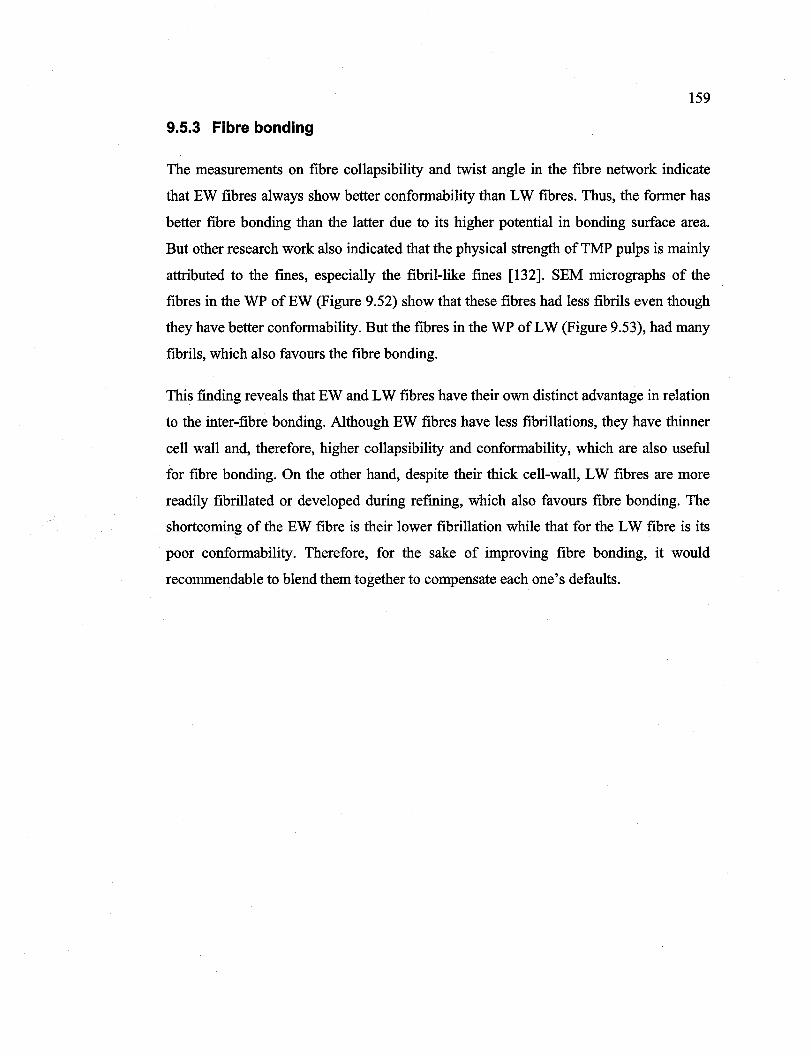
Reproduced with permission of the copyright owner. Further reproduction prohibited without permission.
159
9.5.3 Fibre bonding
The measurements on fibre collapsibility and twist angle in the fibre network indicate
that EW fibres always show better conformability than LW fibres. Thus, the former has
better fibre bonding than the latter due to its higher potential in bonding surface area.
But other research work also indicated that the physical strength of TMP pulps is mainly
attributed to the fmes, especially the fibril-like fines [l32]. SEM micrographs of the
fibres in the WP ofEW (Figure 9.52) show that these fibres had less fibrils even though
they have better conformability. But the fibres in the WP of LW (Figure 9.53), had many
fibrils, which also favours the fibre bonding.
This finding reveals that EW and LW fibres have their own distinct advantage in relation
to the inter-fibre bonding. Although EW fibres have less fibrillations, they have thinner
cell wall and, therefore, higher collapsibility and conformability, which are also useful
for fibre bonding. On the other hand, despite their thick cell-wall, LW fibres are more
readily fibrillated or developed during refming, which also favours fibre bonding. The
shortcoming of the EW fibre is their lower fibrillation while that for the LW fibre is its
poor conformability. Therefore, for the sake of improving fibre bonding, it would
recommendable to blend them together to compensate each one's defaults.
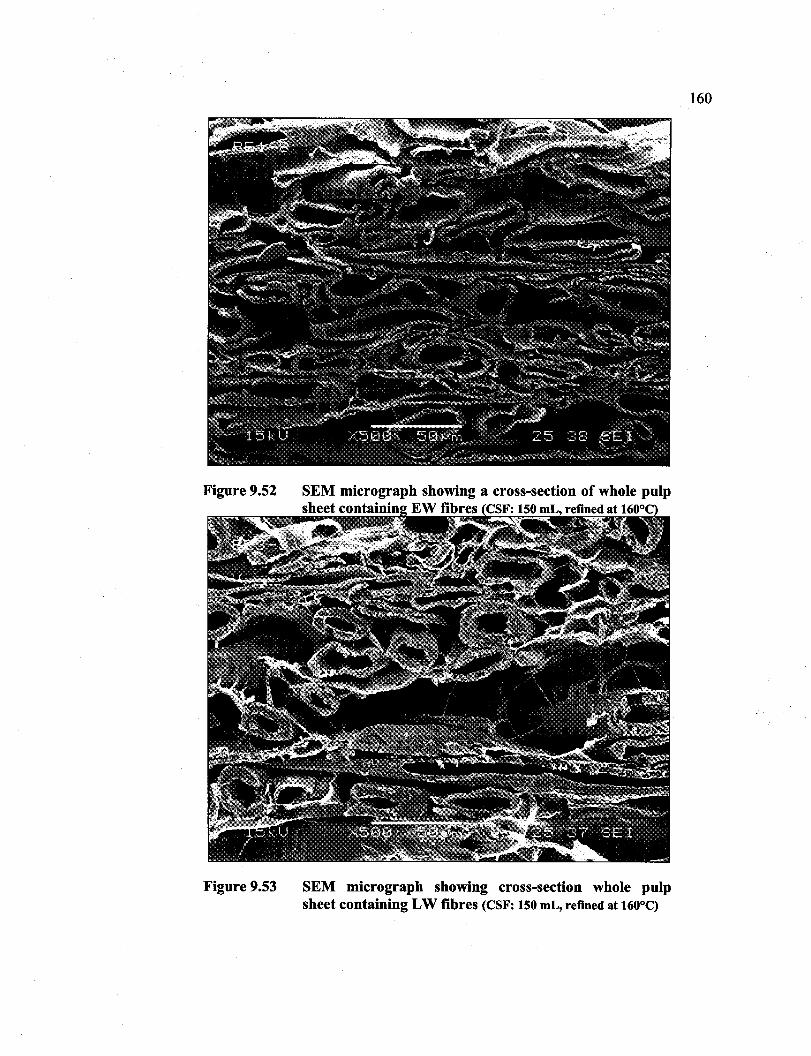
Reproduced with permission of the copyright owner. Further reproduction prohibited without permission.
Figure 9.52
Figure 9.53 SEM micrograph showing cross-section whole pulp sheet containing LW fibres (CSF: 150 mL, refmed at 160°C)
160
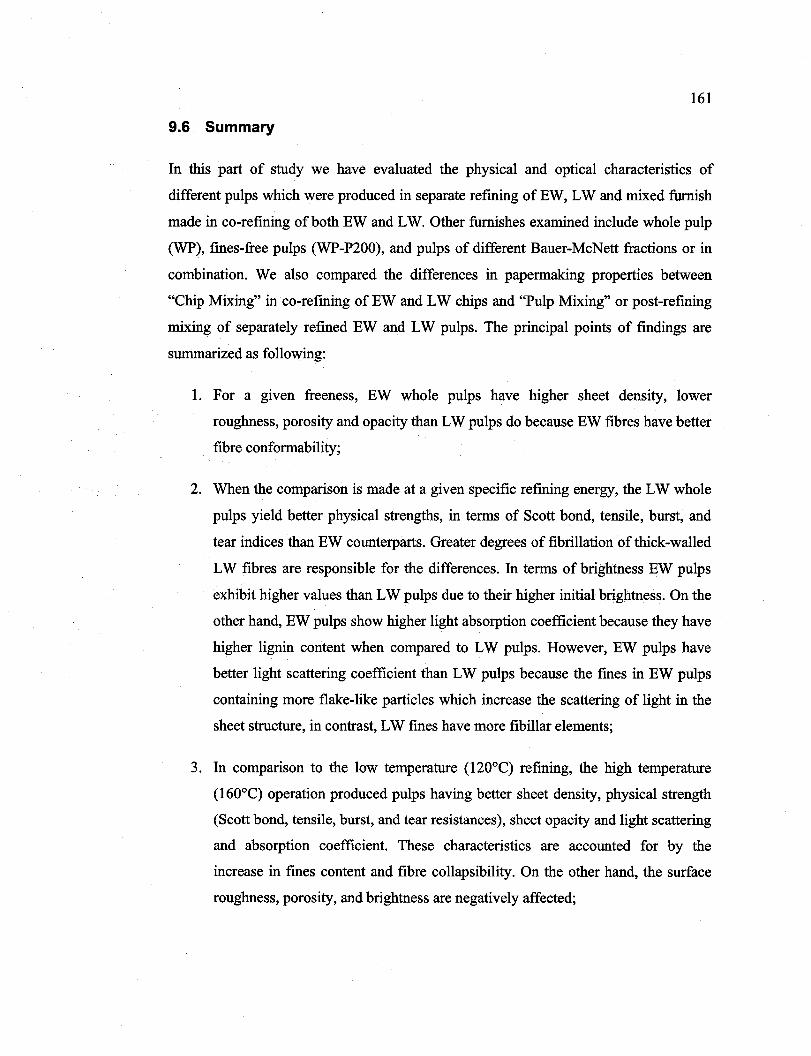
Reproduced with permission of the copyright owner. Further reproduction prohibited without permission.
161
9.6 Summary
In this part of study we have evaluated the physical and optical characteristics of
different pulps which were produced in separate refming ofEW, LW and mixed furnish
made in co-refining of both EW and LW. Other furnishes examined include whole pulp
(WP), fines-free pulps (WP-P200), and pulps of different Bauer-McNett fractions or in
combination. We also compared the differences in papermaking properties between
"Chip Mixing" in co-refining of EW and LW chips and "Pulp Mixing" or post-refming
mixing of separately refined EW and LW pulps. The principal points of findings are
summarized as following:
1. For a given freeness, EW whole pulps have higher sheet density, lower
roughness, porosity and opacity than LW pulps do because EW fibres have better
fibre conformability;
2. When the comparison is made at a given specific refining energy, the LW whole
pulps yield better physical strengths,in terms of Scott bond, tensile, burst, and
tear indices than EW counterparts. Greater degrees of fibrillation of thick-walled
LW fibres are responsible for the differences. In terms of brightness EW pulps
exhibit higher values than LW pulps due to their higher initial brightness. On the
other hand, EW pulps show higher light absorption coefficient because they have
higher lignin content when compared to LW pulps. However, EW pulps have
better light scattering coefficient than LW pulps because the fines in EW pulps
containing more flake-like partic1es which increase the scattering of light in the
sheet structure, in contrast, LW fines have more fibillar elements;
3. In comparison to the low temperature (120°C) refining, the high temperature
(160°C) operation produced pulps having better sheet density, physical strength
(Scott bond, tensile, burst, and tear resistances), sheet opacity and light scattering
and absorption coefficient. These characteristics are accounted for by the
increase in fmes content and fibre collapsibility. On the other hand, the surface
roughness, porosity, and brightness are negatively affected;

Reproduced with permission of the copyright owner. Further reproduction prohibited without permission.
162
4. Among the Bauer-McNett fibre fractions, e.g. R14 to RlOO, the short fibres are
more developed, resulting in lower freeness and coarseness, and they yield
handsheets with better strength properties;
5. Despite their low degree of fibrillation the fibre fractions (R14 to RlOO), EW
pulps always exhibit better physical properties than LW furnishes do. Even when
the fines are removed from the pulps, EW pulp fractions still have higher
physical properties than those of LW furnishes. This is because EW fibres posses
greater conformability during sheet consolidation and, hence, better fibre
bonding;
6. We have observed that the TMP fmes play a very important role in determining
the sheet density, tensile, burst and tear indices, surface roughness, sheet porosity
and the optical characteristics. In addition, we also noted that LW fines have
greater influences than EW fmes in affecting the physical properties of
handsheets because they contain a higher proportions of fibrils;
7. In co-refining or "EW IL W Chip Mixing" process, the fibres suffer less
shortening or breakage, probably due to a possible "buffer effect" by which thin
walled EW fibres are "protected" by thick-walled LW counterpart from the harsh
mechanical treatment. In contrast, in separate refming of EW and LW chips, EW
fibres experience more cutting and produce more fines. Therefore, when the
separate refining pulps (EW and LW) are recombined in handsheet making
("EW IL W Pulp Mixing") the resulting sheets have higher fines content. As
results, the "Chip Mixing" process gives greater average fibre length and, hence,
better tearing resistance as compared to the "Pulp Mixing" process. In contrast,
the fibres in the "Pulp Mixing" process are more developed and have more fines,
resulting in increased physical properties and light scattering coefficient;
8. In terms of sheet structure, thin-walled EW fibres have better collapsibility and
conformability and thus make sheets with higher density while thick-walled LW
fibres produce sheet with higher bulk and have greater fibre twists and fibrils in
the network.
Reproduced with permission of the copyright owner. Further reproduction prohibited without permission.
163
Chapter 10 - Conclusions
The main purpose of this study was to examine the physical responses of the eadywood
(EW) and latewood (LW) of Jack pine in thermomechanical pulping (TMP). In this
investigation we studied the changes in morphology of both EW and LW following two
stages of refining (pressurized primary stage and atmospheric secondary stage). The
pressurized stage was conducted at two temperatures: 120°C and 160°C.
We also evaluated the impacts of the fibre's morphological modifications on the
papermaking characteristics of the resulting pulps.
The main findings of the investigation are summarized in the following paragraphs:
• Characteristics of raw material
Jack pine has a large proportion of LW fibres, 60% by mass, and a density of 0.49 g/cm3
which is 1.6 times greater than that ofEW (0.30 g/cm3). Additionally, LW fibre of Jack
pine has a cell wall thickness of 4.75 J.lm, which is approximately two times greater than
that of EW fibre (2.12 J.lm), and a cell diameter (radial width) two times smaller than
that of EW. AlI these differences in fibre characteristics between LW and EW fibres are
responsible for the dissimilar refming behaviours of these two wood tissues. LW fibre is
physically more resistant to the refining actions than the EW counterpart, resulting in
different failure modes and dissimilar papermaking attribute.
• Characteristics of pulp, for a given specific refming energy
1. Due to their morphological differences, EW and LW fibres behave differently in
thermomechanical pulping (TMP), namely fibre separation and fibre
development. During refming, thin-walled EW fibres tend to separate in the PISI
interface and show little external fibrillation. While the fibre separation of thick
walled LW fibres takes place commonly in the PISI and S1IS2 regions,
generating considerable amounts of external fibrillation. In addition, the fragile
and thin-walled EW fibres manifest more noticeable delamination (internaI
Reproduced with permission of the copyright owner. Further reproduction prohibited without permission.
164
fibrillation) and have higher water retention value (WRV) than the thick-walled
LW fibres.
2. Thick-walled LW fibres are more resistant to the refining actions than EW
counterpart. Under the harsh mechanical actions, LW fibres exhibit mostly intra
wall failure and lower curl and kink indices, while EW fibres tend to fail in trans
wall mode (splitting) and show higher curl and kink indices. As a result, the LW
yields higher fibres length while EW suffers more fibre cutting mainly due to its
thin cell wall;
3. Under the compression forces existing in refming, EW and LW fibres have
different cross-section deformations. Thanks to their thinner cell wall and larger
lumen, EW fibres show higher collapsibility and conformability than the LW
counterparts. As a result, after refining, EW fibres have lower Form Circle (FC)
and Form Shape (FS) values than those of LW.
4. The different physical response of EW and LW fibres in refining influences
directly their fines and rejects productions. During refining, thick-walled LW
fibres experience considerable surface peeling effect (external fibrillation) and
produce more fibillar components in the fmes. In contrast, the fragile thinned
walled EW fibres yield more unfibrillated and flake-like fragments in the fines.
As a consequence, EW fines have higher surface lignin coverage while the LW
fmes give higher specifie volume (SV). Mainly due to their differences in fibre
development, the rejects of LW and EW are qualitatively and quantitatively
different. LW rejects have more fibrillar elements when compared with EW
rejects; the latter contains more bundle-like shives. The aggregates offibrils give
LW a higher rejects content when compared to EW counterpart;
5. The change of refining temperature from 120°C to 160°C also has different
impacts on the behaviours of EW and LW in refining. High temperature refming
at 160°C, which operates with reduced plate gap, produces more rejects and
generates more fibrillation from LW but more collapsed fibres from EW when
compared with the refining at 120 oC.
Reproduced with permission of the copyright owner. Further reproduction prohibited without permission.
165
• Characteristics ofhandsheets
1. The morphological modifications of EW and LW in refining strongly influence
the papermaking characteristics of the resulting pulps, namely the physical and
optical properties. For a given freeness, thanks to their better fibre
conformability, the fibres of EW whole pulps pro duce handsheets with higher
sheet density, lower roughness, porosity and opacity than those of LW pulps. At
a given specific energy, mainly due to highly fibrillated fibres and fibril-rich
elements in the fmes, the fibres of LW whole pulps yield handsheets with better
physical strengths, such as Scott bond, tensile, burst, and tear indices when
compared to the EW counterparts. In addition, the EW pulps are brighter than the
LW pulps due to their higher initial brightness. On the other hand, the EW pulps
show higher light absorption coefficient because they have higher lignin content
when compared to the LW pulps. However, EW pulps have better light scattering
coefficient than LW pulps because the fmes in EW pulps contain more flake-like
particles which increase the scattering of light in the sheet structure.
2. In comparison to the low temperature (120°C) refining, for both EW and LW, the
high temperature (160°C) operation produced pulps having better sheet density,
physical strength (Scott bond, tensile, burst, and tear resistances), sheet opacity
and light scattering and absorption coefficient. These characteristics are
accounted for by the increase in fines content and improved fibre collapsibility.
On the other hand, the surface roughness, porosity, and brightness are negatively
affected.
3. Despite of their low degree of fibrillation of the Bauer-McNett fibre fractions
(R14 to RlOO), EW pulps always exhibit better physical properties than LW
furnishes do. This is because EW fibres have greater conformability during sheet
consolidation and, hence, better fibre bonding.
4. The TMP fines play a very important role in determining the sheet density,
tensile, burst, tear indices, surface roughness, sheet porosity and the optical
characteristics. Due to the differences in fmes components, LW and EW fmes

Reproduced with permission of the copyright owner. Further reproduction prohibited without permission.
166
haves different contributions to the physical properties of final pulps. LW fines
have greater influences than EW fines in affecting the physical properties of
handsheets because they contain a higher proportions of fibrils which are more
favourable for fibre bonding than the tlake-rich elements in EW fines.
5. The interactions between EW and LW in co-refining of EW and LW chips or
"Chip Mixing" process are different than those observations when blending of
EW and LW pulps after separate refining or "Pulp Mixing" process, producing
fmal pulps having different physical and optical characteristics. In separate
refming of EW and LW chips, EW fibres experience more cutting and produce
more fines. Therefore, when the separate refming pulps (EW and LW) are
recombined in handsheet making (i.e. "Pulp Mixing" process) the resulting
sheets have higher fines content. In the "Chip Mixing" process, probably due to a
possible ''buffer effect" by which the thin-walled EW fibres are "protected" by
thick-walled LW counterparts from the harsh mechanical treatment, the fibres
have greater average fibre length and, hence, better tearing resistance as
compared to the "Pulp Mixing" process. In contrast, the fibres in the "Pulp
Mixing" process are more deve10ped and have more fmes, resulting in increased
physical properties and light scattering coefficient than the "Chip Mixing"
process.
6. In terms of sheet structure, thin-walled EW fibres have better collapsibility and
conformability and thus make sheets with higher density while thick-walled LW
fibres produce sheet with higher bulk and have greater fibre twists and fibrils in
the network.
Reproduced with permission of the copyright owner. Further reproduction prohibited without permission.
167
Chapter 11 - Recommendations
The morphological and chemical differences between earlywood (EW) and latewood
(LW) of Jack pine strongly influence their refining behaviours and the fmal sheet
properties. When compared with the traditional pulping species - black spruce, Jack
pine pro duces paper with inferior physical strength mainly due to its high LW
proportion. In addition, the resin-rich EW is the origin of its "pitch problem" in
papermaking. By means ofthis study, 1 would like to propose sorne recommendations to
overcome these problems caused by the differences between EW and LW and improve
the quality of Jack pine TMP.
1. During refming, thin-walled EW fibres tend to disintegrate into tiny fibrous
e1ements and suffer more fibre cutting. While thick-walled LW fibres are more
resistant to the mechanical refming forces, they are readily to retain their form
and produced more long fibres. As a result, in the fibre classification, the
majority of long fibre fractions (R14+R28+R48) are derived from LW. In
addition, these long LW fibres are less deve10ped and have higher coarseness and
inferior inter-fibre bonding abilities. In order to improve the pulp qualities, it
would be preferable to separate EW fibres by fractionation from the long fibres
before adding more energy to develop these thick-walled LW fibres. It is
desirable to refine these long fibres or LW fibres at an elevated temperature or
with chemical treatment to soften the fibres and minimize the fibre cutting. That
would certainly help improve the inter-fibre bonding potential;
2. Efforts on genetic engineering studies such as cloning and hybridization or other
biological engineering approaches should be emphasized to produce Jack pine
with thinner fibre wall and lower extractives content or different extractives
composition that causes no adverse effect on pulping and bleaching. "Genetic
engineering" most often refers to a technique used to transfer small fragments of
genetic material (genes which are composed of DNA) from one organism to
another. The transferred gene carries a new characteristic or trait that is
expressed in the engineered organism [194]. In recent years, the genetic
Reproduced with permission of the copyright owner. Further reproduction prohibited without permission.
168
engmeenng techniques were widely applied to modify pulpwood growth,
structure, and to maximize pulp yields with minimal energy consumption and
environment impacts [195, 196]. For example, Tsai et. al. [197] had genetically
augmented syringyllignin biosynthesis in low-lignin European aspen (Populus
tremula) and enhanced lignin reactivity during chemical pulping. Moreover,
Sundberg et.al. [198] had also genetically modified the structure of auxin (a kind
of growth hormone) of a hybrid aspen to control the tree growth and wood
properties. Based on these theories and present techniques, it is possible to
change the EW and LW growth rates such as the reduction and (or) retardation of
the formation of thick-walled LW, which would be beneficial for the fibre
development in thermomechanical pulping of Jack pine.
3. The "pitch problem" may be minimized by biological, mechanical, physical or
chemical treatments, which would be also use fui to improve the pulp quality and
extend the exploitation of Jack pine. For example, using seasoning at elevated
temperature (e.g. oxidation) and biological treatment of chips would reduce
wood resin and other extractives [199]. Deresination and extractives removal by
mechanical extraction with or without chemical aid or by inter-stage washing
could also eliminate the resins [200]. Furthermore, extraction of wood chips or
pulp using a solvent might offer another solution to the pitch problem relating to
wood extractives [201].
Reproduced with permission of the copyright owner. Further reproduction prohibited without permission.
169
Bibliography
1. Reme, P.A., and Johnson, P.O., 1999. "Changes Inc/uded in Early- and Latewood
Fibres by Mechanical Pulp Refining", Nordic Pu1p & Paper Res. J., 14(3), p. 256-
262.
2. Law, K.N., 2001. "Mechanical Behaviour of Early- and Latewood under
Compression Load", Proc.Intl. Mech. Pulp. Conf., Helsinki, Finland, p. 159-166.
3. Wimmer, R. 1995. "Intra-annual Cellular Characteristics and Their Implications
for Modeling Softwood Density", Wood Fiber Sei. 27(4), p. 413-420.
4. Jain, K.K., and Seth, M.K., 1979. "Intra-increment Variation in Specifie Gravity
of Wood in Blue Pine", Wood Sei. Technol. 13(4), p. 239-248.
5. Gamov, V.V., 1975. "Tensile Strength of Larch Spring- and Summerwood in the
Direction Perpendicular to the Fibers", Izv. VUZ. Lesnoi. Zh. 18(4), p. 161-163.
6. Harder, N., and Nyren, l, 1969. "Influence of Pulp Type and Post-treatments on
the Compressive Force Requiredfor Collapse", TAPPI STAP No. 8, p. 265-270;
discn.,p.271-277.
7. Jones, T.G., and Richardson, ID., 1999. "Relationships between Wood and
Chemimechanical Pulping Properties of New Zealand Grown Eucalyptus Nitens
Trees", Appita I 52(1), p. 51-56.
8. Law, K.N., Valade, J.L., and Daneault, C., 1989. "Chemimechanical Pulping of
Tamarack, (2). Effects ofpH and Sodium Sulfite", Cellul. Chem. Technol. 23(6),
p.733-741.
9. Reme, P.A., and Helle, T., 2001. "Quantitative Assessment of Mechanical Fibre
Dimensions During Defibration and Fibre Development", J. Pulp Paper Sci. 27(1),
p.I-7.
Reproduced with permission of the copyright owner. Further reproduction prohibited without permission.
170
10. Murton, K.D., Richardson, lD., Corson, S.R., and Duffy, G.G., 2001. "TMP
Refining of Radiata Pine Earlywood and Laterwood Fibres ", Proc. IntI. Mech.
Pulp. Conf., Helsinki, Finland, p. 361-371.
11. Agut, P., Gouttenoire, P., Michalowicz, G., Robert, A., Choudens, C.D., and
Lombardo, G., 1987. "Destructuration of Wood Chips in a Roller Press -
Morphological Aspects and Application to Kraft and Bisulfite Cooks", Poster
Presentations, Vol. 2, Proc. 4th IntI. Symp. Wood & Pulping Chem., Paris, France.
p.149-l55.
12. Luner, P. 1986. "Wet fiber Flexibility as An Index of Pulp and Paper Properties,
New Technologies in Refining", Vol. 1, Session 1, Paper 3, Proc. PIRA IntI. Conf.,
Birmingham, England. p. 26.
13. Hattula, T., and Niemi, H., 1988. "Sulfate Pulp Fiber Flexibility and Its Effect on
Sheet Strength", Paperi ja Puu 70(4), p. 356-361.
14. Uhmeier, A., and Salmén, L., 1996. "Repeated Large Radial Compression of
Heated Spruce", Nordic Pulp Paper Res. 1 11(3), p.171-176.
15. Mohlin, u.-B., 1975. "Cellulose Fiber Bonding. (5) Conformability of Pulp
Fibers", Svensk Papperstid. 78(11), p. 412-416.
16. Smith, W.E., and Byrd, V.L., 1972. "Fiber Bonding and Tensile Stress-strain
Properties of Earlywood and Latewood Handsheets ", U.S. Forest Serv., Res.
Paper FPL 193,l1p.
17. Hartler, N., and Nyren, J., 1970. "Transverse Compressibility of Pulp Fibers II,
lrifluence ofCooking Method, Yield, Beating, and Drying", Tappi J. 53(5), p. 820-
823.
Reproduced with permission of the copyright owner. Further reproduction prohibited without permission.
171
18. Laurent, J.M., Rudie, AW., and Shakhet, AR., 1993. "Mechanical Pulping by
Fraction after Low Energy Refining", 1993 TAPPI Pulping Conference, Atlanta,
USA, p. 95-99.
19. Salmén, L., Dumail, IF., and Uhmeier, A, 1997. "Compression Behavior of
Wood in Relation to Mechanical Pulping", Proc. IntI. Mech. Pulp. Conf.,
Stockholm, Sweden, p. 207-211.
20. Rehmat, T., and Branion, R., 1995. "Fibre Fractionation in Hydrocyclones", 81st
Annual Meeting, Technical Section, CPPA, Montreal, Canada, p.BI05-BI25.
21. Salmén, L.; and De Ruvo, A, 1985. "Model for Prediction of Fiber Elasticity",
Wood Fiber Sci. 17(3), p. 336-350.
22. Law, K.N., and Yang, K.C., 2003. "Characteristics of Fibre Separation in Wood
Loaded by Normal-to-grain Compression", AWita. l, 56(1), p.42-45.
23. Saiki, H. 1970. "Proportion ofComponent Layers in Tracheid Walls ofEarlywood
and Latewood of some Conifers", I Japan Wood Res. Soc. (Kokuzai Gakkaishi)
16(5), p. 244-249.
24. Butterfield, B.G., 1998. "Microfibril Angle in Wood", IAWAlINFRO
International Workshop on the Significance ofMicrofibril Angle to Wood Quality,
University of Canterbury, Christchurch, New Zealand.
25. Ifju, G., and Labosky, P. Jr. 1972. "Study of Loblolly Pine Growth Increments (1),
Wood and Tracheid Characteristics (2), Pulp Yield and Related Properties",
Tappi. J. 55(4), p. 524-534.
26. Stamm, AJ. 1973. "Maximum Effective Lumen and Pit Pore Sizes of the
Earlywood and the Latewood ofNever Dried Loblolly Pine Sapwood", Wood Sci.
TechnoI. 7(3), p. 212-217.
Reproduced with permission of the copyright owner. Further reproduction prohibited without permission.
172
27. Thomas, R.J., and Scheld, IL., 1967. "Distribution and Size of the lnter-tracheid
Pits in an Eastern Hemlock", Forest Sei. 13(1), p. 85-89.
28. Petit-Conil, M., Robert, A., and Pierrard, J., 1997. "Fundamental Principles of
Mechanical Pulping /rom Softwoods and Hardwoods; Theoretical Aspects ",
Cellul. Chem. Technol. 31(1/2), p. 93-104.
29. McIntosh, D.C., and Uhrig, L.O., 1968. "Effect of Refining on Load-elongation
Characteristics of Loblolly Pine Holocellulose and Unbleached Kraft Fibers ",
Tappi. l 51(6), p. 268-273.
30. Johansson, K., Thuvander, F., and Germgârd, u., 2001. "Single Fibre
Fragmentation: a New Measure of Fibre Strength Loss during Brown Stock
Washing and Oxygen Delignification", Appita. l 54(3), p. 276-280.
31. Zink,A.G., Pellicane, P.I, and Shuler, C.E., 1994. "Ultrastructural Analysis of
Softwood Fracture Surfaces", Wood Sei. Technol. 28(5), p. 329-338.
32. Saka, S., and Tsuji, M., 1987. "Relationship between the Microfibril Orientation
in the Tracheid S2 Layer and the Lignin Content of Coniferous Woods ", Cellul.
Chem. Technol. 21(3), p. 225-231.
33. Khattak, T.M., and Mahmood, A., 1986. "Estimation ofLignin, Holocel/ulose and
Alpha-cellulose Content of Earlywood and Latewood among lnnerwood and
Outerwood of Blue Pine (Pinus wallichiana, A.B. Jacks.) ", Pakistan J. Botany
18(2), p. 235-241.
34. Leask, R.A., and Kocurek, M.J., 1987. "Pulp and Paper Manufacture", Volume 2,
"Mechanical Pulping", TAPPIICPPA, Atlanta, USA, p.1-17, 98-112.
Reproduced with permission of the copyright owner. Further reproduction prohibited without permission.
173
35. Sundholm, l, 1999. "Papermaking Science and Technology, Mechanical
Pulping", Finnish Paper Engineering's Association & TAPPI, Helsinki, Finland,
p. 35-51,223-249,195-218,313-343.
36. Harkonen, E., and Tienvieri, T., 2001. "Energy Saving in TMP Pulping", Proc.
IntI. Mech. Conf., Helsinki, Finland, p. 547-556.
37. Law, K.-N., and Lanouette, R., 2000. "Effect of Mechanical Conditioning of Chips
on the Quality ofSoftwood TMP", Pulp Pap Cano 101(7), p. 31-35.
38. De Montmorency, W.H., 1965. "The Relationship of Wood Characteristics to
Mechanical Pulping", Pulp Paper Mag. Cano 66(6), p. T325-T348.
39. Kamis, A., 1994. "The Mechanism of Fibre Development in Mechanical
Pulping", 1 Pulp Paper Sci. 20(10), p. J280-J288.
40. Sundholm, J., 1993. "Can We Reduce Energy Consumption in Mechanical
Pulping", Proc. IntI. Mech. Pulp. Conf., Oslo, Norway, p. 133-142.
41. Kano, T., Iwamida, T., and Sumi, Y., 1982. "Energy Consumption in Mechanical
Pulping", Pulp Paper Cano 83(6), p. T151-T161.
42. Reme, P.A., and Helle, T., 2000. "Fibre Characteristics of Shives Initiating Web
Rupture", Nordic Pulp Paper Res. 1 15(4), p. 287-291.
43. Hattula, T., and Niemi, H., 1988. "Sulfate Pulp Fiber Flexibility and Its Effect on
Sheet Strength", Paperi ja Puu 70(4), p. 356-361.
44. Aspler, J.S., and Beland, M.C., 1994. "Review of Fibre Rising and Surface
Roughening Effects in Paper", J. Pulp Paper Sci. 20(1), p. 27-32.
45. Fengel, D., and Wegner, G., 1984. "Wood Chemistry, Ultrastructure, Reactions",
W. de Gruyter, New York, USA, p. 7-25.

Reproduced with permission of the copyright owner. Further reproduction prohibited without permission.
174
46. Core, H.A, Côté, W.A, and Day, AC., 1981. "Wood Structure and
Identification", 2nd Edition, Syracuse University Press, New York, USA, p. 14-18,
25-27,49,92, 106.
47. Panshin, AJ., and Zeeuw, C.D., 1970. "Textbook of Wood Technology", 3rd
Edition, Vo1.1, McGraw-Hill, New York, USA, p. 48-51, 91,151-177.
48. Larson, A, 1960. "Physiological Consideration of Springwood Summerwood
Transition in Red Pine", Forest Sci., 6, p. 110-122.
49. Little, C.H.A, and Eidt D.C., 1968. "Eflects of Abscisic Acid on Bud-break and
Transpiration in Woody Species", Nature 220, p. 498-499.
50. Funada, R.; Kubo, T.; Tabuchi, M., Sugiyama, T.; and Fushitani, M., 2001.
"Seasonal Variations in Endogenous Indole-3-acetic Acid and Abscisic Acid in the
Cambial Region of Pinus Densiflora Sieb. Et Zucc., Stems in Relation to EW
latewood Transition and Cessation of Tracheid Production ", Ho1zforschung
55(2), p. 128-134.
51. Kocurek, M.l, and Stevens, C.F.B., 1983. "Pulp and Paper Manufacture",
Volume 1, "Properties of Fibrous Raw Materials and Their Preparation for
Pulping", TAPPIICPPA, Atlanta, USA, p. 11-21,23.
52. Mark, R. E., Habeger, C.C., Jr., Borch, J, and Lyne, M.B., 2002. "Handbook of
Physical Testing of Paper", Volume 1, Second Edition, Marcel Dekker, New
York, USA, p. 700-720.
53. Stenius, P., 1999. "Papermaking Science and Technology", Book 3, "Forest
Products Chemistry", Finnish Paper Engineering's Association/TAPPI, Helsinki,
Finland, p. 50-65.
54. Bisset, I.J.W., 1950. Dadswell, H.E., Australian Forestrv, 14(1).
Reproduced with permission of the copyright owner. Further reproduction prohibited without permission.
175
55. Hatvani, T.G., Evans, R., Kibblewhite, R.P., and Parker, I.H., 1999.
"Relationships Between Tracheid and Kraft Pulp Fibre Transverse Dimensions",
Proc. 53rd Appita Ann.Gen.Conf., Rotura, New Zealand, p. 87-94.
56. Strelis, 1., and Kennedy, R.W., 1967. "Identification of North American
Commercial Pulp Wood and Pulp Fibres", University of Toronto Press, Toronto,
Canada, p. 5-9, 29.
57. Ingruber, O.V., Kocurek, M.J., and Wong, A, 1985. "Pulp and Paper
Manufacture - Volume 2: Sulfite Science & Technology", TAPPI/CPPA, Atlanta,
USA, p. 159-162.
58. Yang, K.C., and Benson, C., 1997. "Ultrastructure of Pits in Pinus banksiana
Lamb", Wood. Sei. & Technol., 31(1), p. 153-169.
59. Cochaux, A, D'Aveni, A, and Robert, A, 1995. "Étude Fondamentale de la
Résistance au Déchirement des Pâtes et Papiers I: Considérations Générales",
Cellul. Chem. Technolo. 29(1), p. 45-54.
60. Cochaux, A, Moutet, B., D'Aveni, A, and Robert, A, 1995. "Étude
Fondamentale de la Résistance au Déchirement des Pâtes et Papiers. IL La
Résistance au Déchirement en Fonction des Paramètres Morphologiques", Cellul.
Chem. Technol. 29(2), p. 215-22.
61. Howard, E.T., and Manwiller, F.G., 1969. "Anatomical Characteristics of
Southern Pine Stemwood", Wood Sei., 2(2), p. 77.
62. Ward, R.J., Côté. W.A,Jr., and Day, AC., 1964. "The Wood Structure-coating
Interface", Official Digest, 36(477), p. 1091.
63. Sjôstrôm, E., 1981. "Wood Chemistry, Fundamentals and Applications",
Academic Press, New York, USA, p. 1-20.
Reproduced with permission of the copyright owner. Further reproduction prohibited without permission.
176
64. Ruel, K., and Bamound, F., 1978. "Quantitative Determination of Tension Wood
in Beech: Statistical Significance of the Galactose Content", Ho1zforschung,
32(5), p. 149-156.
65. Fengel, D., and Stoll, M., 1973. "Variation in Cross-sectional Area of the Cell,
and Thickness of the Cell Wall and Wall Layers in Sprucewood Tracheids within
an Annual Ring", Ho1zforschung, 27 (1), p. 1-7.
66. Sjôstrôm, E, 1992. "Wood Chemistry: Fundamental and Applications", 2nd ed.,
Academic Press, New York, USA, p. 13-20, 56, 79.
67. Mork, 0, 1928. "Die Qualitat des Fichtenholzes unter Besonderer
Rücksichtnahme aufScleif- und Papierholz", Der Papierfabrikant (48), p. 741-747.
68. Fjerdingen, H., and Foreseth, T.F., 1997. "Some Mechanical Pulp Fibre
Characteristics, Their Process Relationship and Papermaking Significance", l1 th
Fund.Res.Symp. "The Fundamentals of Papermaking Materials ", Mechanical
Engineering Publications, London, England, p. 547-605.
69. Mohlin, u.-B., 1995. "Fibre Development during Mechanical Refining", Proc.
IntI. Mech. Pulp. Conf., Ottawa, Canada, p. 71-77.
70. Ladell, lL., 1971. "Variation Outwards and some InternaI Correlations in the
Wood of Black Spruce, Picea mariana (Mil!), B.S.P. ", Unpublished Report,
Ontario Research Foundation, Mississauga, Ontario, Canada.
71. Szanyi, L., and Sugden E.A.N., 1967. "The Relationship between Specifie Gravity
and the Scanned SoUd Volume of Wood", Unpublished Report (RSR No.539),
Columbia Cellulose Company Ltd., New Westminster, Canada.
Reproduced with permission of the copyright owner. Further reproduction prohibited without permission.
177
72. Sugden, E.A.N., 1962. "Douglas Fir Sulphate Pulp Strength as Affected by
Percentage Summerwood". Unpublished B.S.F. Thesis, Univ. ofB.C., Vancouver,
Canada.
73. Smith, D.M., and Miller, RB., 1964. "Methods of Measuring and Estimating
Tracheid Wall Thickness ofRedwood", Tappi 1 7(10), p. 599-604.
74. Johansson, D., 1940. "Über Früh- und Spatholz in Schwedischer Fichte und
Kiefer und über ihren Einfluss auf die Eigenschaften von Suljit- und
Sulfatzellstoff', Holz Roh- u, Werkstoof3, p. 73-78.
75. Kollmann, F.F.P., and Côté, W.A., Jr., 1968. "Principles of Wood Science and
Technology, 1: Solid Wood", N.Y., Springer-Verlag, New York, p. 9-12.
76. Goldstein, I.S., and Gould, Rf., 1977. "Wood Technology: Chemical Aspects",
ACS Symposium Series 43, American Chemical Society, Washington, USA, p.l-
23.
77. Fengel, D., 1969. "Ultrastructure ofCellulosefrom Wood (1): Wood as the Basic
Materialfor the Isolation of Cellulose", Wood Sci. Technol. 3(3), p. 203-217.
78. Gladstone, W.T., and Ifju, G., 1974. "Some Influences of Wood Morphology on
Kraft Pulping ofLoblolly Pine", Proc. TAPPI Forest Biology Conf., Seattle, USA,
p. 13-19.
79. Larson, P.R, 1966. "Changes in Chemical Composition of Wood Cell Walls
Associatedwith Age in Pinus resinosa Ait", Forest Products J. 16(4), p. 37-45.
80. Ritter, G.l, and Fleck, L.C. 1926. "Chemistry of Wood IX. Springwood and
Summerwood", Industrial Engineering Chemistry, 18, p. 608-609.
Reproduced with permission of the copyright owner. Further reproduction prohibited without permission.
178
81. Von Byrd, L., Ellwood, E.L., Hitchings, R.G., and Barefoot, AC., 1965. "Wood
Characteristics and Kraft Paper Properties of Four Selected Loblolly Pines",
Forest Products J. 15(8), p. 313-320.
82. Wu, B.J., Stonecypher, R., and Browne, C., 1967. "Lignification within
Coniferous Growth Zones", Pulp Paper Cano 68, p.159-164.
83. Bisset, I.J.W., and Dadswell, H.E., 1949. "The Variation of Fiber Length within
One Tree of Eucalyptus Regnans F. V.U", Australian Forestry, 13(2):, p.86-96.
84. Ranby, B.G., 1961. "The Fine Structure of Cellulose Fibrils in F. Bolam(ed),
Fundamentals of Papermaking Fibers", First Tech. Section Paper and Board
Makers Association, London, England.
85. Roelofsen, P.A, 1959. "The Plant Cell Wall, vol. III, part 4, Encyclopaedia of
Plant Anatomy", GebfÜder Bomtraeger, Berlin-Nikolassee, Germany.
86. Back, E. L., and Salmén, N. L, 1982. "Glass Transitions of Wood Components
Hold Implications for Modeling and Pulping Processes", Tappi 65 (7) p. 107-110.
87. Cousins, W. J., 1978. "Young's Modulus of Hemicellulose as Related to Moisture
Content", Wood Sci. TechnoI. 12 (3), p. 161-167.
88. Haun, J.L., and Britt, K.W., 1970. "Handbook of Pulp and Paper Technology",
Van Nostrand Reinhold, New York, USA, p. 25-31.
89. Glasser, W.G., and Sarkanen, K.V., 1989. "Lignin Properties and Materials",
ACS Symp. Ser.397. American Chemical Society, Washington, OC, USA
90. Kamis, A, 1993. "The Mechanism of Fibre Development in Mechanical
Pulping", Proc. IntI. Mech. Conf." Oslo, Norway, p. 268-293.
Reproduced with permission of the copyright owner. Further reproduction prohibited without permission.
179
91. Smook, G.A, 1992. "Handbook for Pulp & Paper Technologists", 2nd edition,
Angus Wilde Publications Inc., Vancouver, Canada, p. 45-64.
92. Alami, R., Boileau, 1., Harris, G., Lachaume, 1., Kamis, A, Miles, K.B., and
Roche, A, 1995. "Evaluation of the Impact of Refining Intensity on Energy
Reduction in Commercial Size Refiners: The Effect of Primary Stage
Consistency", Proc. IntI. Mech. Conf. Ottawa, Canada, p. 203-212.
93. Strand, B., 1997. "Quality Control of High Consistency Refiners", Proc. IntI.
Mech. Conf., Stockholm, Sweden, p. 127.
94. Harkonen, E., and Tienvieri, T., 2001. "Energy Saving in TMP Pulping", Proc.
IntI. Mech. Pulp. Conf., p. 547-556.
95. Pere, J., Liukkonen, S., Siika-Aho, M., Gullichsen, J., and Viikari, L., 1996. "Use
of Purified Enzymes in Mechanical Pulping", Proc. TAPPI Pulp. Conf., Atlanta,
USA, p. 693-696.
96. Petit-Conil M., de Choudens C., and Espilit T., 1998. "Ozone in the Production of
Softwood and Hardwood High-yield Pulps to Save Energy and Improved Quality",
Nordic Pulp Paper Res. 1. 13(1), p. 16-22.
97. Mao, C.B., Law, K.N., and Kokta, B.V., 2003. "Effect of Sulfonation on the
Compression Behaviour of Early- and Latewood", 89th Annual Meeting, Pulp and
Paper Technical Association of Canada, Montreal, Canada, p. 17-22.
98. Htun, M., and Salmén, L., 1996. "Importance of Physical and Chemical
Properties of Wood for Efficient Energy Input in Mechanical Pulping",
Wochenblatt fur Papierfabrikation 124(6), p. 232-235.
Reproduced with permission of the copyright owner. Further reproduction prohibited without permission.
180
99. Easterling, K.E., Harrysson, R, Gibson, L., and Ashby, M.F. 1982. "On the
Mechanics of Balsa and other Woods", Proc. Royal Society London A383, p. 31-
41.
100. Oumail, IF., and Salmén, L., 1997. "Compression Behaviour of Wood at Large
Plastic Deformations: Comparison between Water and Ethylene-glycol Saturated
Wood", Holzforschung, 51(4), p. 296-302.
101. Tabarsa, T., and Chui, Y.H., 2000. "Stress-strain Response of Wood under Radial
Compressions. Part L Test Method and Influences of Cellular Properties", Wood
and Fiber Sci. 32(2), p. 144-152.
102. Hartler, N., and Nyren, l, 1969. "Influences of Pulp Type and Post-treatment on
the Compressive Force Requiredfor Collapse". TAPPI STAP No.8, p. 265-270,
discn. p. 271-277.
103. Alexander, S.D., Marton, R, and McGovem, S.D., 1968. "Effect of Beating and
Wet Pressing on Fibre and Sheet Properties (1): Individual Fibre Properties",
Tappi. J., 51(6), p. 277-283.
104. McIntosh, D.C., and Uhig, L.O., 1968. "Effect of Refining on Load-elongation
Characteristics of Lobbly Pine Holocellulose and Unbleached Kraft fibres ",
Tappi. I 51(6), p. 268-273.
105. Reme, RA., Johnsen, P.O., and HelIe, T., 1998. "Fibre Characteristics of Some
Mechanical Pulp Grades", Nordic Pulp Paper Res. J. 13(4), p. 263-268.
106. Kure, K.A., 1999. "On the Relationship between Process Input Variables and
Fibre Characteristics in Thermomechanical Pulping", Doctoral Thesis 45/99,
Dept. Chem. Eng., Norwegian Univ. Sci.Tech., Norway.
Reproduced with permission of the copyright owner. Further reproduction prohibited without permission.
181
107. Cowan, W.F., 1968. "The Screening of Groundwood - A Reappraisal", Proc. IntI.
Mech. Pulp.Conf., Atlanta, USA, p. TOll.
108. Reme, P.A, Tufa, L.D., Helle, T., and Johnson, P.O., 1998. "The Fibre
Characteristics of Shive Initiating Web Rupture ", Paper Physics Seminar,
Vancouver, Canada, A4.
109. Rudie, AW., Morra, J., St. Laurent, lM., and Hickey, K.L., 1994. "The Influences
of Wood and Fibre Properties on Mechanical Pulping", Tappi. 1 77 (6), p. 86-90.
110. Ahlgren, P.A, and Olausson, lA, 1975. "Kraft Pulping of Pine Earlywood and
Latewood", Paperi ja Puu 57(2), p. 57-59.
111. Gladstone, W.T., and Ifju, G., 1974. "Some Influences of Wood Morphology on
Kraft Pulping of LobloUy Pine", Proc.Tappi. Forest Biology Conf., Seattle, USA,
p. 13-19.
112. Gladstone, W.T., 1969. "Response of Early- and Latewood from LobloUy Pine to
Kraft Pulping", Ph.D. Thesis. North Carolina State Univ. ,USA, p. 138.
113. Hasuika, M., 1973. "Physical Properties and Macrostructure of Earlywood and
Latewood Pulp Sheets", 1 Japan Wood Res. Soc. (Mokuzai Gakkaishi) 19(11), p.
547-553.
114. Franklin, C.L., 1945. "Preparing Thin Sections of Synthetic Resin and Wood
Composites and a New Maceration Methodfor Wood", Nature, 155, p. 51-54.
115. Law, K.N., Kokta, B.V., and Mao, C.B., 2001. "Fibre Morphology and Soda
sulphite Pulping of Switchgrass ", Bioresource Technology, 77, p. 1-7.
116 Koran, Z., 1967. "Electron Microscopy of Radial Tracheid Surface of Black
Spruce Separated by Tensile Failure at Various Temperatures ", Tappi J., 50(2), p.
60-67.
Reproduced with permission of the copyright owner. Further reproduction prohibited without permission.
182
117. Koran, Z., 1968. "Electron Microscopy of Tangential Tracheid Swface of Black
Spruce Produced by Tensile Failure at Various Temperatures ", Svensk
Papperstidning, 71(17), p. 567-576.
118 Koran, Z., 1970. "Surface Structure of Thermomechanical Pulp Fibres Studied by
Electron Microscopy", Wood and fibre, 2(3), p.247-258.
119. Atack, D., 1972. "Characterization of Pressurized Mechanical Pulps", Svensk
Papperstidning. 75(3), p. 89-94.
120. Sabourin, M.J., Cort, J.B., Waller, A., Xu, E. and Boileau, 1., 1996. "Optimizing
Residence Time, Temperature and Speed to Improve TMP Pulp Properties and
Reduce Energy", Preprints Tech. Sect., PAPTAC, Montreal, Canada, Book B, p.
B69-B79.
121. Fuglem, G., Kure, K.-A., LlZlbben, O.P. and Helle, T., 2000. "Full Scale
Comparison of TMP Fibre Properties - RTS and Conventional Conditions ",
Preprints Ann. Meet., PAPTAC, Montreal, Canada, Book C, p.C187-C191.
122. Sabourin, M., Vaughn, J., Frith, M., Lauritzen, J., Wisenman, N. and Fraser, T.,
2002. "Characterization of Paper Properties /rom Spruce and Pine
Thermomechanical Pulps - Effect of Refining Intensity", Preprints Ann. Meet.,
PAPTAC Book C, p. C125-C134.
123. Sabourin, M., 2004. "Operating Experience with New RTS Lines at Holmen
Hallstavik", Pulp Paper Can., 105(9), p. 27-29.
124. Münster, H., and Dahlqvist, G., 1995. "Operational Experience with the First
Commercial High Speed Refiner at Perlen Papier AG Switzerland", IntI. Mech.
Pulp. Conf., Ottawa, Canada, p.197-203.
125. Law, K.N., 2000, "New Insight into Chip Refining", Appita J., 53(3), p. 393-397.
Reproduced with permission of the copyright owner. Further reproduction prohibited without permission.
183
126. Meyers, J., and Nanko, H., 2005. "Effects of Fines on the Fiber Length and
Coarseness Values Measured by the Fiber Quality Analyzer (FQA)", TAPPI 2005
Spring Technical Conference, Atlanta, USA, p.1-8.
127. Robertson, G., OIson, J., Allen, P., Chan, B., and Seth, R, 2004. "Measurement of
Fibre Length, Coarseness, and Shape with the Fibre Quality",
hrtp://api.mech.ubc.ca/PDF/fga tappi.pdf(consulted on 6, December, 2005)
128. Bently, RG., Scudamore, P., and Jack, J.S., 1994. "A Comparison between Fibre
Length Measurement Methods", Pulp & Paper Canada, 95(4), p.41-45.
129. Page, D.H., Seth, RS., Jordan, B.D. and Barbe, M.C., 1985. "Curl, Crimps, Kinks
and Microcompressions in Pulp Fibers - Their Origin, Measurement and
Significance" Trans. 8th Fund. Res. Symp., Oxford, Sept. 1985,V. Punton, Ed.,
Mech. Eng. Publications Ltd., London, p. 183-227.
130. Law, K.N., Yang, K.C., and Valade, J.L., 1997. "Fibre Development in
Thermomechanical Pulping~' Comparison between Black Spruce and Jack Pine",
Preprints of CPP A Technical Section Annual Meeting, Montreal, Canada, 1997, p.
Bl13-B127.
131. Seth, RS., 2002. "The Measurement and Significant of Fines", 88th PAPTAC
Annual Meeting, Montreal, Canada, p. c97 -c 1 0 1.
132. Sirvio, J., and Nurminen, 1., 2004. "Systematic Changes in Paper Properties
Caused by Fines", Pulp Pap Can 105(8), p. 39-42.
133. Marton, R, and Robie, J.D., 1969. "Characterization of Mechanical Pulps by A
Settling Technique", Tappi. J., 52(12), p. 2400-2406.
134. Luukko, K., 1999. "Fine Quantity and Quality in Controlling Pulp and Paper
Quality", IntI. Mech. Pulp.Conf., Houston, USA, p.67-75.
Reproduced with permission of the copyright owner. Further reproduction prohibited without permission.
184
135. Allender, B. M., and Waterhouse, J. F., 1986. "Morphological Factors in the
Refining of Eucalypt and Pinus Radiata Fibers", PIRA Int. Conf. New
Technologies in Refining, Birmingham, England, Vol. 2, Session 3, Paper 8:, p.
22.
136. "Morfi Cell Wall Thickness Measurement", Website of Techpap, France,
http://www.techpap.com/(consulted on 4, Nov., 2005)
137. CMT, Appareil de mesure d'Épaisseur des parois, Manuel d'utilisation, Techpap
2005, France.
138. Reme, P.A., and Helle, T., 1999. "Methods to Assess Detai/ed Cross-sectional
Dimensions of Fibre Populations in Wood and Pulp Using SEM and Image
Analysis, Microscopyas a Tool in Pulp and Paper Research and Development", A
State of the Art Symposium, Concerted Action FAIR-98-3681, Stockholm,
Sweden.
139. Website of Scalex Corporation, http://www.scalex.com/products.php#mapwheel
(consulted on 6, December, 2006).
140. Cisneros, H.A., Williams, G.l, and Hatton, J.V., 1992. "Fibre Surface
Characteristics of Hardwood Refiner Pulps", TAPPI Pulp. Conf., Atlanta, USA,
p. 1151-1160.
141. K.N., Law, ll, Balatinecz, ll, and Garceau, lJ., 1974. "A Techniquefor Making
Oriented Fibre Sheet", TAPPI, Vol. (57), No.12, p. 153-154.
142. M.J., Dykstra, 1993. "A Manual of Applied Technical for Biological Electron
Microscopy", Plenum Press., New York, USA, p. 38-42.
Reproduced with permission of the copyright owner. Further reproduction prohibited without permission.
185
143. Reme, P.A., Johnsen, P.O., and Helle, T., 2002. "Assessment of Fibres Transverse
Dimensions Using SEM and Image Analysis", J. Pulp & Paper Sei., 28(4), p. 122-
128.
144. Website of National Institute of Neurological Disorders and Stroke, USA,
http://rsb.info.nih.gov/ij/ (consulted on Nov, 8,2005)
145. Fjerdingen, H., and Houen, P.J., 1997. "On the Effect of Recycling on Gross
sectional Shapes and Dimensions of Sulphate Pulp Fibres ", Recyc1ing
Symposium, TAPPI, Atlanta, USA, p. 347-360.
146. Jang, H.F., and Seth, R.S., 1998. "Characterization of the Collapse Behaviour of
Papermaking Fibres Using Confocal Microscopy", 84th Annual Meeting,
Technical Section CPPA, Atlanta, USA, p. 205-212.
147. Johnsen, P.O., Skinnarland, 1., Helle, T., and Housen, P.J., 1995. "Distribution of
Lignin and Other Materials on Particles Surfaces in Mechanical Pulps ", Proc.
IntI. Mech. Pulp. Conf., Ottawa, Canada, p. 93-107.
148. Maxwell, M.H., 1978. "Two Rapid and Simple Methods Usedfor the Removal of
Resinsfrom 1.0)lm T-epoxy Sections", J. Microscopy, 112(2), p. 253-255.
149. Williams, G.J., Drummond, lG., and Cisneros, H.A., 1994. "A Microscopic
Approachfor Examining Fibre and Paper Structure", l Pulp & Paper, 20(4), p.
J11O-J114.
150. Carlsson, G., 1996. "Surface Composition of Wood Pulp Fibres: Relevance to
Wettability, Sorption and Adhesion", Department of Pulp and Paper Chemistry
and Technology, Royal Institute of Technology and Institute for Surface
Chemistry, Stockholm.
Reproduced with permission of the copyright owner. Further reproduction prohibited without permission.
186
151. Osterberg, M., 2000. "On the Interactions in Cellulose Systems: Surface Forces
and Adsorption", Department of Chemistry, Surface Chemistry, Royal Institute of
Technology, Stockholm, Department of Forest Products Technology, Helsinki
University of Technology, Helsinki, and Institute for Surface Chemistry.
152. Dorris, G.M., and Gray D.G.,1978. "The Surface Analysis of Paper and Wood
Fibers by ESCA (Electron Spectroscopy for Chemical Analysis)/I. Application to
Cellulose and Lignin", Cellulose Chem. Technol, Vo1.12, p. 9.
153. Dorris, G.M., and Gray D.G., 1978. "The Surface Analysis of Paper and Wood
Fibers by ESCA (Electron Spectroscopy for Chemical Analysis)/II. Surface
Composition ofMechanical Pulps", Cellulose Chem. Technol, Vo1.12, p.721.
154. Gray, D.G., 1978. "The Surface Analysis ofPaper and Wood Fibers by ESCA. III.
Interpretation of Carbon (ls) Peak Shape", Cellulose Chem. Technol. Vo1.12,
p.735.
155. Hultén, A.H., and Paulsson, M., 2003. "Surface Characterization of Unbleached
and Oxygen Delignified Kraft Pulp Fibres", J. Wood Chem. Technol., 23(1), p.
31-46.
156. He, J.H., W.J., Batchelor, and R.E., Johnston, 2003. "The Behaviour of Fibres in
Wet Pressing", Tappi. J., 2(12), p.27-31.
157. Mohlin, U.B., Dahlbom, J., and Homatowska, J., 1996. "Fibre Deformation and
Sheet Strength", Tappi J., 79(6), p. 105-111.
158. Stationwala, M.I., Mathieu, J., and Kamis, A., 1996. "On the Interaction o/Wood
and Mechanical Pulping Equipment. Part 1: Fibre Development and Generation of
Fines", J. Pulp Paper Sei. 22(5), p. J155-J160.
Reproduced with permission of the copyright owner. Further reproduction prohibited without permission.
187
159. Law, K.N., and Valade, J.L., 1994. "The Status of the Utilisation of Jack Pine
(Pinus banksiana) in the Pulp and Paper Industry ", Canadian J. For. Res. 24, p.
2078-2084.
160. Jossart, D., Barbe, M.C., Lapointe, M., and Law, K.N., 1988. "Properties of
Mechanical and Chemi-Mechanical Jack Pine Pulps: Part 1 - Thermomechanical
Pulps", PuIp Paper Cano 89(4), p. T115-TI22.
161. Laliberté, D., Shallhom, P.M., and Kamis, A., 1987. "Comparison of TMP and
CTMP Properties from Spruce and Pine Sawmill Chips ", Pulp Paper Can., 88(3),
p.94-100.
162. Tyrvainen, J., Law, K.N., and Valade, J.L., 1997. "Alkaline-Peroxide Inter-Stage
Treated Mechanical Pulp from Jack Pine (Pinus banksiana), Part L Introduction
and Pulp Physical Properties", Pulp Paper Can., 98(6): TI91-196.
163. Tyrvainen, J., Law, K.N., and Valade, J.L., 1997. "Alkaline-Peroxide Inter-Stage
Treated Mechanical Pulp from Jack Pine (pinus banksiana), Part IL Pulp Optical
Properties, Colour Reversion, Extractives Content and Process Implication ", Pulp
Paper Can., 98(7): T223-227.
164. Isenberg, I.H., 1980. "Pulpwood of the United States and Canada, Vol.1-
Conifers", The Institute ofPaper Chemistry, Appleton Wis. USA.
165. Tay, C.H., and Manchester, D. F., 1982. "Jack Pine as Pulpwood for Newsprint
Manufacture. Part L The Significance of fibre morphology and Extractives ",
Proceedings of the Canadian Wood Chemistry Symposium, Niagara Falls, p.119-
114.
166. Beath, L.R., and Mihelich, W.G., 1977. "Refiner Mechanical Pulping of
chemically Pretreated Wood", Tappi.J., 60(12), p. 77-81.
Reproduced with permission of the copyright owner. Further reproduction prohibited without permission.
188
167. Berzins, V. 1966. "Chemical Composition of Woods", Pulp and Paper Research
Institute of Canada, Pointe-Claire, Quebec, Canada, p.61.
168. Yuen, T.Y.C., 1999. "Tree Gummies", Website of Econoteck,
http://www.econotech.com/newsletters/007 fall 99.pdf (consulted on 20, January,
2006)
169. Allen, L,H., 1988. "Pitch Control during the Production of Aspen Kraft Pulp",
Pulp. Paper Cano 89(10), p. T342-T346.
170. Yemchuk, E.M., 1970. "Oxidation of Black Liquor at Great Lakes Paper Co.
Ltd", Pulp Paper Mag. Can., 71(14), p.T45-T50.
171. Rapson, W.H., Wayman, M., and Anderson, C.B., 1965. "Hydrosulphite and
Peroxide Bleaching of Nine Pure Species Groundwoods", Pulp Paper Mag. Can.,
66(5), p.255-271.
172. Beath, L,R, Neill, M.T., and Masse, F.A, 1966. "Latency in Mechanical Wood
Pulps", Pulp & Paper Magazine of Canada, 67(10), p. T423-T430.
173. Kamis, A, 1993. "Latency in Mechanical Pulp Fibres", Paperi Ja Puu, 75(7),
p.505-511.
174. Harris, G., and Karris, A, 1986. "Storage of Latent Mechanical Pulps", Journal of
Pu1p and Paper Science, 12(4), p. JlOO-Jl07.
175. Lunan, W.E., Sferrazza, M.J., Franzen, RG., and May, W.D., 1986. "Curl-Setting
during Storage of Thermomechanical Pulp at High Consistency", Journal ofPulp
and Paper Science, 12(4), p. Jl08-Jl15.
176. Page, D.H., Barbe, M.C., Seth, RS., and Jordan, B.D., 1984. "Mechanism ofCurl
Creation, Removal and Retention in Pulp Fibers", Journal of Pulp and Paper
Science, 10(3), p. J74-J79.
Reproduced with permission of the copyright owner. Further reproduction prohibited without permission.
189
177. Label, R.G., Nobleza, G.C., and Paquet, R. 1979. "Water Retention Value
Indicates Machine Runnability of Pulp", Pulp & Paper Canada, 80(5), p.T135-
T140.
178. Law, K., Kokta, B.v., and Mao, C.B., 2006. "Effect of Temperature on
Compression Properties of Wood and Fibre Failures - A Problem Implication of
Screw-pressing of Chips in TMP", PAPTAC 92nd Annual Meeting, Montreal,
Canada, p. A429-A434.
179. Reme, P.A, Kure, K.-A, Gregersen, 0., and Helle, T., 1999. "Optimal
Mechanical Pulp Fibres for Publication Paper: Targets and Treatments", Proc.
IntI. Mechanical Pulping Conf., T APPI PRESS, p.171-182.
180. Fjerdingen, H., Forseth, T., Gregersen, 0., Helle, T., Johnsen, P.O., Kure, K.-A,
and Reme, P.A, 1997. "Some Mechanical Pulp Fibre Characteristics, Their
Process Relationshipsand Papermaking Significance", Trans. I1th Fundamental
Res. Symp., Fundamentals of Papermaking Materials, Cambridge,UK., p. 547-
605.
181. Shallhorn, P.M., Kamis, A, 1979. "Tear and Tensile Strength of Mechanical
Pulps", Trans. Techn. Sect. (CPPA), 5(4), TR92-TRlOO.
182. Sabourin, M., Cort, lB., Waller, A, Xu, E., and Boileua, l., 1996. "Optimizing
Residence Time, Temperature, and Speed to Improve TMP Pulp Properties and
Reduce Energy", PAPTAC annual meeting, Montreal, Canada, p. B69-79.
183. Sabourin, M., Vaughn, l, Wiseman, N., and Welungoda, B., 2003. "Industrial
Scale Evaluation of Low Retention, High Temperature, High Speed (RTS) TMP
Pulping of Southern Pine", APPITA Annual Gen. Conf. Proceedings, Melbourne,
Australia, p. 119-126.
Reproduced with permission of the copyright owner. Further reproduction prohibited without permission.
190
184. Lindholm C.A., 1980. "Comparison of Some Papermaking Properties of
Groundwood, Pressure Groundwood and Thermomechanical Pulp by Means of
Pulp Fractions. (2) Fines Fractions", Paperi ja Puu, 62(12), p803-808.
185. Luuk:ko, K., and Paulapuro, H., 1997. "Mechanical Pulp Fines; Effect of Particle
Size and Shape", 1997 Engineering & Papermakers: Forming Bonds for Better
Papermaking Conference, TAPPI Press, p. 131-136.
186. Alince, B., Porrubskâ, J., and Vande Ven, T.G.M., 2001. "Effect of Model and
Fractionated TMP Fines on Sheet Properties", Proc. 12th Fundamental Research
Symposium, Oxford, p. 1343-1355.
187. Norrstrôm, H, 1969. "Light-absorption Properties of Pulp and Pulp Components.
(1). Method (2). Sulfite Pulp", Svensk Papperstidning, 72(2), p.25-38.
188. L. T., Heikkurinen, 1997. "Changes in Fibre Wall Structure during Defibration",
Il th Fundamental Research Symposium in: the Fundamentals of Papermaking
Materials, Cambridge, United Kingdom, p. 641-662.
189. Mohlin, U-B., 1980. "Properties of TMP Fractions and Their Importance for
Quality ofPrinting Papers. (1). Large Variations in Properties within Fractions",
Svensk Papperstidning, 83(16), p.461-466.
190. Mohlin, U-B., 1980. "Properties of TMP Fractions and Their Importance for
Quality of Printing Papers. (2).Influence of Particle Properties and Particle Size
Distribution on Pulp Properties", Svensk Papperstidning, 83(18), p.513-519.
191. Zha, Q. Q., and Lanouette, R., 2006, "Co-refining Interfractions between White
Birch, Hybrid Larch and Black Spruce", PAPTAC 92nd Annual Meeting,
Montreal, Canada, p. A421-A426.
Reproduced with permission of the copyright owner. Further reproduction prohibited without permission.
191
192. MacDonald, R.G., 1969. "The Pulping of Wood", McGraw Hill Book Co., New
York, USA, p.629.
193. Aravamuthan, R. G., Shriver, E. H., and Mishra, A K. 1993, "Effect of Refining
on the Optical Properties of Softwood Thermo- and Chemithermomechanical
Pulps", Cellul. Chem. Technol. 27, no. 5, p. 525-535.
194. Barrett, K., and Flora, G., 2000. "Genetic Engineering and the Precautionary
Principle", website of Northern Plains Sustainable Agriculture Society (NPSAS),
www.npsas.org/GEPrecautionary.html (consulted on March 15,2006)
195. Sykes M., Yang, V., Blankenburg, l, AbuBakr, S.,1999. "Biotechnology:
Working with Nature to Improve Forest Recourses and Products", Tappi
International Environment Conference, Atlanta, GA, USA p. 631-637.
196. Moffa, A, "Genetic Engineering Turns to Trees", Science Vo1.271, No. 5250, p.
761.
197. Tsai, C.I, Zhang, D. Y., Davis, M. F., Chiang, V.L., 2004. "Genetic
Augmentation of Syringyl Lignin in Low-lignin Aspen Trees", TAPPI Paper
Summit - Spring Technical and International Environmental Conference. Atlanta,
USA, p.363-366.
198. Sundberg, B., Tuominen, H., Nilsson, O., Moritz, T., Little, C., Sandberg, G., and
Olsson, O., 1997. "Growth and Development Alteration in Transgenic Populus
[Poplarj: Status and Potential Applications - Micropropagation, Genetic
Engineering, and Molecular Biology of Populus Poplar", Rocky Mountain Forest
and Range Experiment Station, USA, p.74-83.
199. Nugent, H.M., Allen, L.H., and Bolker, H.I., 1977. "Effect of Seasoning on the
Acetone Extractives Composition of Wood [rom Black Spruce, Jack pine and
Trembling Aspen", CPPA Trans. Tech. Sect. 3, noA, Montreal Canada, p.l03-109.
Reproduced with permission of the copyright owner. Further reproduction prohibited without permission.
192
200. Tay, C. H., Fairchild, R. S., Manchester, D.F., 1983. "Jack Pine as Pulpwoodfor
Newsprint Manufacture. (2). Removal of Extractives During Ultra-High-Yield
Pulping", Int. Symp. Wood & Pulping Chem. Vol. 2, Japan, p. 28-35.
201. Tay, C. H., Fairchild, R. S., Manchester, D.F., 1982. "Jack Pine as Pulpwoodfor
Newsprint Manufacture. (1). Significance of Fiber Morphology and Extractives",
Cano Wood Chem. Symp. (Niagara Falls), Ontario, Canada, p. 109-114.
Reproduced with permission of the copyright owner. Further reproduction prohibited without permission.
193
Appendix
• "Effect of Primary Stage Refining Temperature on Fibre and Pulp
Properties of Jack Pine TMP"
This paper was presented at 92nd P APT AC Annual Meeting, Montreal (Feb., 2006).
• "Behaviour of Jack Pi ne Early- and Latewood in Refining"
This poster was presented at 91st PAPTAC Annual Meeting, Montreal (Feb., 2005).
It was also presented at the scientific poster competition of Uiversité du Québec à
Trois-Rivières (March, 2005) and won the frrst prize in the papermaking division.
• Micrograph: "Cross-section of early- and latewood TMP fibre"
This micrograph was published as a cover image in Journal of Pulp and Paper
Science (Vo1.31, No. 1,2006).
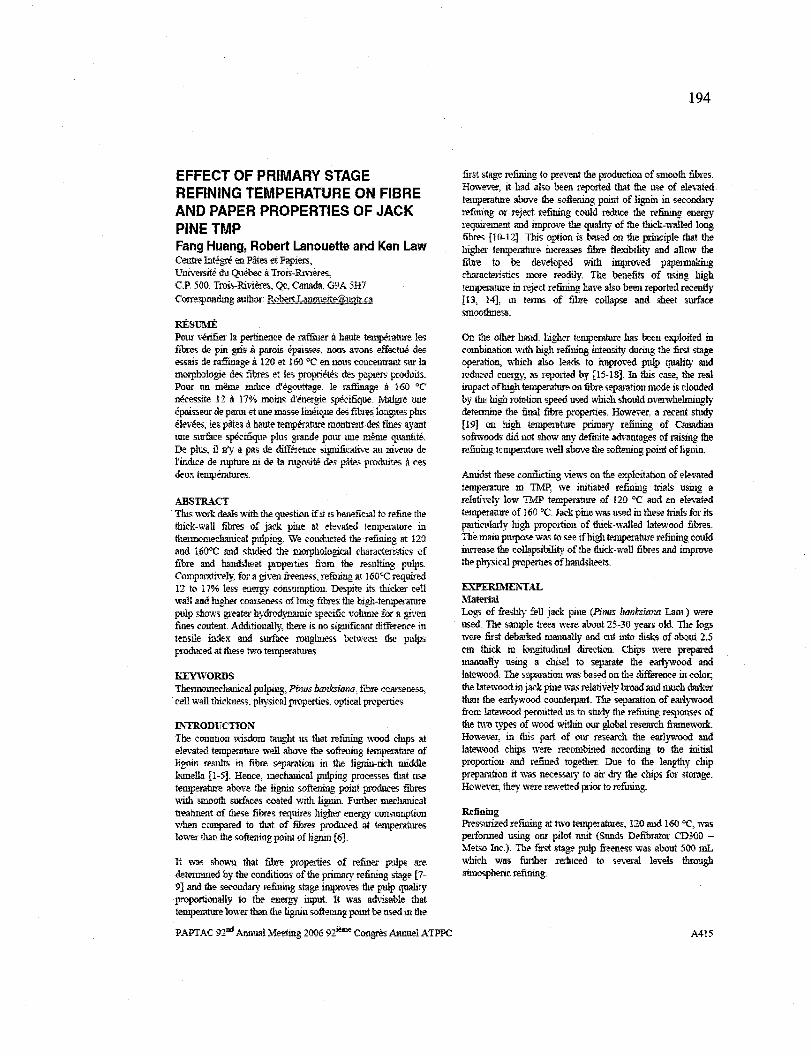
Reproduced with permission of the copyright owner. Further reproduction prohibited without permission.
EFFECT OF PRIMARY STAGE REFINING TEMPERATURE ON FIBRE AND PAPER PROPERTIES OF JACK PINETMP Fang Huang, Robert Lanouetle and Ken Law Centre Intégré en Pâtes et Papiers, Université du Québec il Trois-Rivières, C,P. 500, Trois-Rivières, Qc, Canada, G9A 5H7
Correspondîng author: RobertLanoueite1Èuqtr.ca
RÉSL1\IÉ POUl' vérifier la perrillOOce de raffiner il haute température les fibres de pin gris 11 parois épaisses, nous ayons effectué des essais de raffinage il 120 et 160 oC en nous concentrant sur la m01phologie des fibres et les pl'Opriéiés des papiers produits. Pour lin m~ indice d'égouttage, le raffinage à 160 oC uécessite 12 à 17% moills d'énergie spécifique. Malgré Ulle épaisseur de paroi et Ulle masse Iinéique des fibres longues plus élevées, les pâtes à haute' température montrent des fines ayant Ulle surface spécifique plus gratlde pour une même quatltité, De plus, il n'y a pas de différence signifil'ative au niveau de l'indice de rupture ni de la rugosité des pâtes produites Il ces deux températures,
ABSTRACT This work deals with the question if it l, beneficial to refiue Ihe thick-wall fibres of jack pine al elevated temperature in therm01uechanical pulping, We conducted the refinillg at 120 alld 16WC and studied the morphological duuactelistics of fibre lllld halldsheet pmperties from the resullillg pulps, Compru-atively, for a given tri'eness, refiuing al 1600C reqnired 12 to 17% le55 energ)' consumptioll, Despite its thicker cell wal! and higher coarseness of long fibres the high-temperatnre pulp shows gl'eate!' hydrodyrnunic specifie volume for Il given fines content Additiona11y, there is no significllllt dîf'ference in tensile index and surface rouglllless between the pulps produœd at these Thl'O temperatmes.
IŒYWORDS Thermomechanical pulping, Finus banksiana, fibre COaTSeness, cell wall thickness, physical properties, optical properlies
L'\'TRODLTCTION The common wisdom taught us that refining wood dlÏps aï elevated temperature wel! aoove the softenillg tempera/ure of Iignin results in fibre separation in the lignin-ricb !lliddle lamella [1-51 Hence, mechanic.al pulping processes that use temperature above the lignin softening point produces fibres with smooth 511lfaces coated with Iignin. Further mechanical tl'ea!ment of ihese fibres requires higher energy com.-umption when compared to that of fibres produced al temperatures lower than the softening point oflignin [6],
It was shown thai fibre pl'Operti.es of refiuer pulps are determiued by the conditions of the prima!}' refining stage [7-9] and the secondary refinillg stage impl'Oves the pulp quality proportionally to the enel'gy input It was advisable that temperatufi' lower than the ligllin softening point be used in !he
PAPTAC 92nd Annual Meeting 2006 nième Cong;:ès Annuel ATPPC
194
ru'St stage refining 10 prevent the production of smooth fibres, However, if bad also been reported that the use of elevated temperature aoove the softening point of lignin in secondary renning 01' reject refining could reduce the refiuing ellergy l'l'qnirement and improve the quality of the thick-walled long fibres fI 0-12]. This option is based on the priuciple that the higher temperature incre.ases fibre flexibility atld alIow the fibre to be devi'loped with improved papennakiug chru:acteristics more l'eadily, The beuefits of using high lemperature in reject refining have also been reporle'd recently [13, 14], in terms of fibre collapse and shee! surface smoothness.
On the othe!' hand, higher temperature lias been exploited in combiuation with high refiniug iuteusity dll!Ülg the fust stage operation, which a1so leads to improved pulp quality atld l-educed energy, as repOlted by [15-181 In this case, the real impact ofhigh temperatllre 011 fibre separation mode is c10uded by the high rotation speed used wbich ShOllld overnrhelmingly determine the final fibre properties. However, a recellt study [19J on high iemperalure prima!}' refiniug of Canadian softwoods did not show any derulite advatltages of l'aisùlg the refining lemperature wel! above the so.ftelling point of lignill,
Amidst tbese conflictiug views on the exploitation of elevated temperature in TMP, we initiated refining trials using a relatively low TMP temperatlue of 120 oC lllld an elevated temperature of 160 oc. Jack pine was used in these trials fol: its particularly high pmportion of thick-walled !atewood fibres. The main ptupose was to see ifhigh tempe1'llture refining could increa.se the collapsibility of the tllick-wall fibres and improve the physical propa11es ofhandsheets,
EXPERIl\IE?\"TAL Matl'lial Log, of freshly fell jack pille (FilIUS banksÛlna Lam.) were llsed. The sample h'ees were about 25-30 years old, TIre log, were ru'St debarked man.ua11y and eut into disks of about 2,5 cm thick in longitudinal direction. Chips were prepared manually using a cluse! to separate the earlywood and latewood. The separation "ms based on the difference in color; the latewood in jack pine was relatively bl'oad and much d.'!rl.:er than the earlywood COUllte'rpart. The sepru-ation of earlywood from latewood permitted us to study the l'efiniug responses of the two types of wood witllill our global research framework. However, in lhis part of OlU' research !he earlywood and latewood chips were recombined according to tbe initial pmportion and refined together: Due to the lengthy chip prepru'lltion it was necessru)' 10 air dl)' the chips for storage, However, flley were rewetted prior to refining,
Refining Pressurized refining at two temperatures, 120 and 160 cC, was performed llsing our pilot Imit (Sund" Defibrator CD300 -Meiso Inc) The first stage pulp freeness was about 500 mL which was furtller l'eduCed to several leveh througb atrnospberic refining,
A415

Reproduced with permission of the copyright owner. Further reproduction prohibited without permission.
Fibr~ and Pnlp Cblll'actel'izatÎon Ptùp freeness and bandsheet propel'ties were determined follO\\ing the appropriate PAPIAC standard llleiboos willle the fibre characœristics were measured using a Fiber Quality Analyzer (OpTes! Equipment, Canada). Additionally, cell wall ibickness was measured by means of Il Cell Wall Thickness Analyzer (TECHPAP, France).
RESULTS Al'\;'D DISCUSSION
Re.lining Energy The increase in re.fining temperatnre from 120 to 160"(' had significantly reduced the energy requïrement over a range of freeness from aront 250 to 75 mL (Fig. 1). The ro!'responding ena-gy ranged from about 9.5 to 12 Ml/kg; the savrugs in €nel'gY were approximately 12 ta 17% when the firs! stage refuùllg was raised from 120 ta 160 oc. The drop in refuring energy as a l'l'suit of secondary refining at elevlIted temperature had œen reporœd [9-11]. Alheit the use ofillgh temperature ru primary refining has been commercially l'Xploited [12-15], the real contribution of high teruperature ta the redudion in refuring energy is unclear because it is. employed in combination v.ith higb intensity refining. How~er, ibe lafter has in fuet the mos! far-reaclling impact on pulp qnalïty comparee! with the fonnel'. In reality, ibe ptupose of USUlg bigb tempernture in such Il case 15 to flexibilize the fibres, nrinimizing fibre cutting in the bigl! speed operation.
300 ... i 20.
·'58
~ 10.
58
0
a 9 10 11 12 13 14 15
Specifie -energy, M.Jlkg
Figure L CSF \'5 specifie refining elli'rg)~
Fibre Charactelistics The illgh temperatlll'e refining hac! different impact on fibre propelties as compared to the low temperature opemtion. The high tempel'ature (160 ·C) prodtlc,ed coarser fibres (Fig. 2) because it :is \vell above the lignin soflenÎllg porut favourÎllg fibre separation in the nriddle lamella. On the other hand, the lower ternperature of 120 oC is. expected to promote fibre ~epal1Ition in the Sllayer or at the 511S1 iuterface [20]. Wïth the snbseque1lt secolld-stage atnKlspheric ufining the fibre
MI6
195
le1lgth and œil wall tlnck!1ess decreased nearly Îll a linear manner" as revealed in Fig. 1. The trends were similar for both R28 and R48 Baner MeNet! fractions. Sunilar relations between cell walltllickness and coarsaless were also observed, as il1ustl'ated ru Fig. 3. Most interestingly, Fig. 3 sllo,,,"s that the fibre development process was differe1lt depalding on the initial defibration lemperature; ibere was disfuJct trend for each fraction. This implies that the fuJal pulp properlies are diclated by the frrst stage refining conditiollS. Besicles, the figure also reveals that thel'e exists a close cOIrelation betwee1l the Iwo illstl1lll1ents measuring cell wall tbickness and cOlIl'SeIl.ess. The pl'imary fmes pl'oouced with low ala:gy COn.SUlllption are comparable in lerms of hydrodynarnic specific volnme (HSV) and quantity for both bigh and low refining temperatures (Fig. 4). Howeva; the deve1opme1l! ofHSV dUl'ing the subsequellt .econd stages differed lloticeably bem-een the t\vo tE'ruperntures. The illgl! temperature l1~fmÎllg wonld he more favournblE' in terms of fines quality development whe1l comparee! ta the low temperatllre proœss.
Fi~r length (Iw). mm
Figure 2. CeD wall thickness ~. fiber length.
f ::: ! '.4
1 6..2
~u •. "+-~~-..,.~~-...... -~,,..,...;
0.15 0.20 0.25 0.30
Figure 3. Cell wall thickness vs eoarsenl'SS.
PAPTAC 92nd AnllUa! Meeting 2006 92iême Congrès Annnei ATPPC
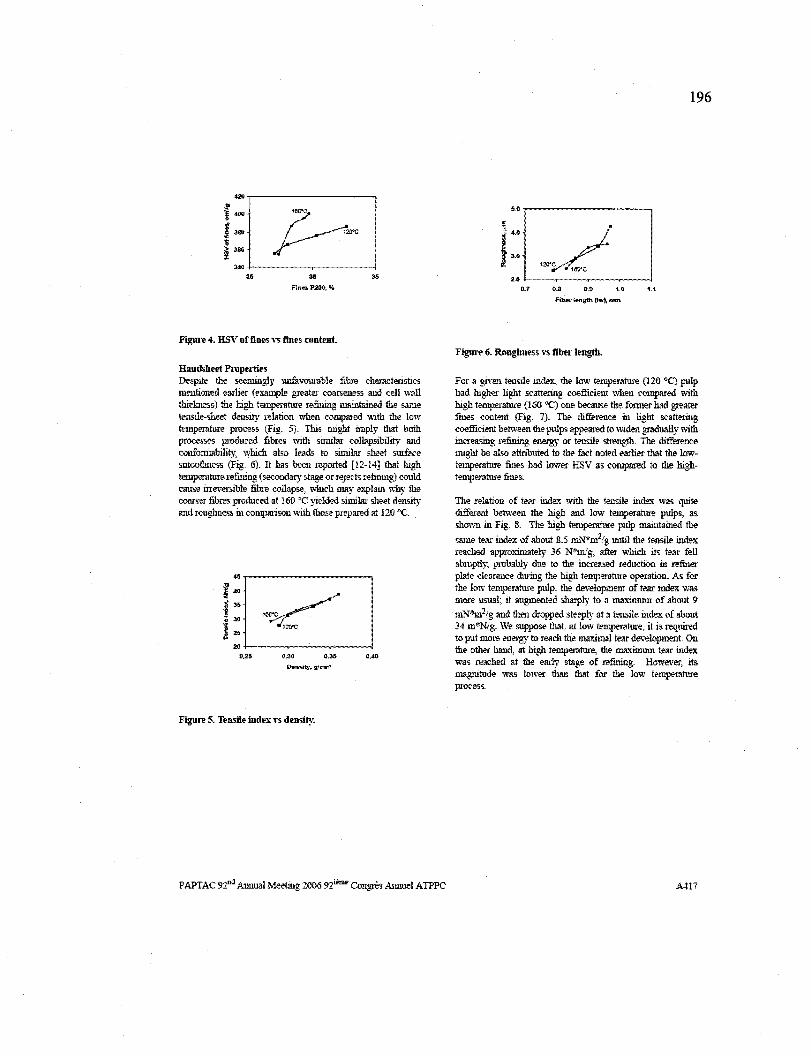
Reproduced with permission of the copyright owner. Further reproduction prohibited without permission.
~.~--------------------, !!! g .00
f 300 " '5 li 300
340+-----~---~~-------~ 35
Fin~P200,%
FigUl'e 4. HSV of fines vs fines content.
Handsheet PI'Opt'liies ~spite the seemingly unfavourable fibre clUlfacterîstics mt'ntioned earlier (t'xample greater coorseness and cel! wall lhîc1mess) th~ high ternperatuœ refining mailltainw the same tensile-sheet dell5ity relation when comp3lW with the 10w temperntm:e process (Fig, 5) This might imply thaï bath processes prodnrw fibres with sîmiJar collapsibility and confonnability, which al,o leads to similar shee! SlnfSCt' smoolhness (Fig, 6) Ii has bren reportw [12-14] tha! higb tempernturt' refinillg (secondary stage or rejects refinillg) could cause ill:eversible fibre collapse. which may explaill why the coar~r fibres produced af 160 oC yielded similar .hee! density and rougllness in comparison with Ihas!' prepared al 120 "C,
Figure 5. Teusüe index n deusity,
PAPTAC 92nd AllIlual Meeting 2006 nièmet Congrès A1lnuel ATPPC
5.0 r-----------------,
_ ..J ~
2'{)' . nvm= ···~·ty· .. ····"·M""W"'r=~""..,.."""'''''.",.
0] D.9 '.0
Figllfl' 6, Roughuess vs fibel'leugth.
196
For a given tellsile index. the low temperature (120 ·C) pllip had higher ligbt 5catterillg coefficÎellt when compared \lith rugh temperatuœ (160 OC) olle because the former had gt-eater frues cooteut (Fig. 1). Th~ differE.'llCE' in light scatterillg coefficiellt betweeu the pnIps appeared to widen gtadllally with increasing ""finillg E'llergy or tensile strength.. The differellce might be aIse attributed 10 the fuet noled earlier tlla! the lowiemperntuœ filles had lower KSV as compared iD the highteml'el1lture fmes.
The relation of lear index \\~th the tensile index was quite differeut œtweell the high and low temperature pulp., as 5hO\\l1 in Fig. Il. The high temperature pull' maintained the
same lem: index of about 8.5 rnN*m2rg Ulltil th", tensile index: reached approximately 36 N*m/g, der which iis tear fell abmptly, pl'Obably due to the increased reducliOll in refiner plate clearallce durillg the high temperatm'e OperntiOIl. As for the low temperanu? pulp .. the development of tem: iudex was more usual; if augmellted sharply 10 fi maxiumm of about 9 rnN*m2rg and theu (lroppe.d steeply al a tensile index of about 34 m*NIg. We suppose th.,t, al low temperalul<'. il is reqllÎl'ed to put more ellerg)' te l-elUjl the maximal tear develol'meut. On the other hand, lit higb temperntuœ, the maximlllll teal' index was reached al the eady stage of refinillg, However, ils maguitude \Vas lower thm fhat for the low temperanu'e proce.>,
Mn
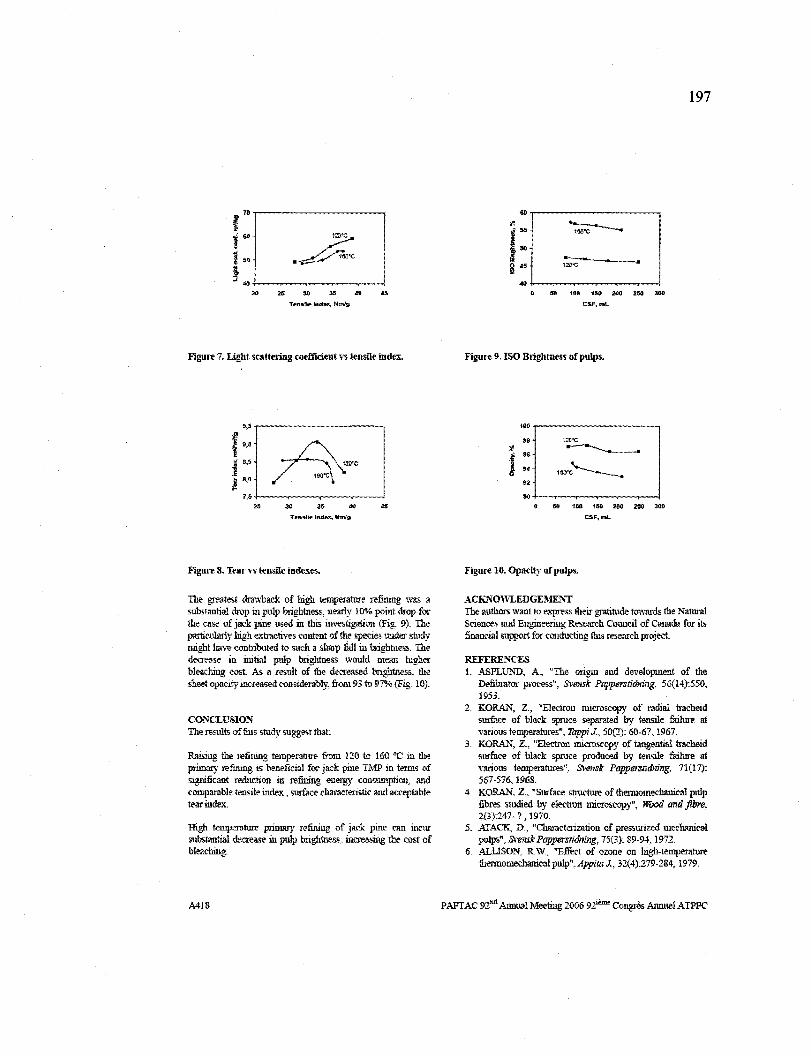
Reproduced with permission of the copyright owner. Further reproduction prohibited without permission.
(0 1"" ~ ~ .. ~.,,"C
J40
2. 2. 30 .. .. "" TE'flMlE' ind.x, Nmig
Figure 7. Light sc-atteling cot'fficient vs tensile indt'l: .
••• f ' .. {",. n-'6IJ'C 1 S,O
'" 7 ••
25 30 35 •• 45
TNI~~ inM.1t,. Hm/g
Figurt' 8. Tt'ar YS tensill" indexes.
TI1P gl'eatest drawback of high temperature refining was a substantial drop in pulp brightness, nea1"ly 10% point drop for the case of jack pine used in thi, investigation (Fig. 9). The partirutarly high extractives content of the species under study might have cOIllnbuted 10 sueh li sharp full in brightness. The deC1<':lI.Se in initial pulp brightness wouId mean higher blellching cost. As a restùt of the decreased brightness, the shee! opacity increa,ed COllsiderllbly. from 93 to 97% (Fig. 10).
CONCLUSION The resufu of Ibis study suggest tbat
Raising the refining tempermure fronl 120 to 160 ~C in the primary refining is beneficial fol' jack pine TMP in terms of significant redUCtiOll in refinÏllg euergy ronmmptioo, and comparable tellsile index. surface cbaracteristic and acceptable lem: ùu!ex.
Righ tempel'sture primary refining of jack pine Œil incur substantial decrease in puIp brightness. Ïllcreasing the cost of bleaching.
A41&
197
"" # ~ .5O 150
---.. ~ .. 12!l'C ..
50 100 '50 200 250 .00
CSF. mL
Fignl'e 9. ISO Brîgbtness of pulps.
, .. •• 12!l'C
# ---------1 9&
1WC'---. •• 92
9. .. 100 150 .. 0 ... 300
CSF.ml
Figure 10. Opadty ofpulps.
ACK'\OWLEDGE~IEi\T
The authors want to eJ\.'Pl'ess tbeir gratinlde tOWllrdS the Na!1ll:al Sciences and Engineering Research Council of Canada for its fill311Cial support for cOllducting this research project.
REFERENCES 1. ASPLUND, A., "The origin and development of the
Defibratol' process", Svensk Pappe/'stidning. 56(14):550, 1953.
2. KORAN, Z., "Electron miC1'Oscopy of radial tracheid surfuce of black spmce separated by tensile fuilure al various temperatures", Tappi J., 50(2):.60-67.1967.
3. KORAN, Z., "Electron miC1'Oscopy of tangential tracheid surface of black spruee produœd by tellsile failul'e at vmous lemperatures", Svensk Pappersridl1il1g, 71(17): 567-576, 1968.
4. KORAN, Z .. "Surface slmcture of thermomechaniclll pulp fibres studied by electroo microscopy", WOod and fibre. 2(3):247- 7, 1970.
5. ATACK, D., "Characterization of pressurized mecbanical puIps", SVl!nsk PapperstùJning, 75(3): 89-94, 1972.
6. ALUSON, R.w., "Effee! of ozone 011 high-iemperature thennomechallieal pulp", Appita J., 32(4):279-284, 1979.
PAPTAC 9200 AllllUill Meeting 2006 92'''''' Congrès Annuel ATPPC
Reproduced with permission of the copyright owner. Further reproduction prohibited without permission.
7. STATIONWALA, M. and A KAR.""o-:rS, "Pulp grinding - a new metlrod fol' producing mechanical pulp". Tappi J., 73(12):137-195, 1990.
8. STATIONWALA, M., I\1ILES, K.B. and A KAR1\'IS, "The e:ffect of first stllgl' refining conditions on pulp propertia and energy consumption" J. Pulp Pape/' Sei., 19(1):112-118,1993.
9. BEIKKURINlN, N., VAARASALO, 1. and A KARNIS, "Effect of initial defiberization on the propel1ies of refiner mechanical ptÙP", J. Pull' Paper Sei., 19(3):J1!9-JI24, 1993.
10. HOGLUND, R., MeK, B, FALK, B. and M. JACKSON, "Thamopulp - Il new alergy-efficient mechal1iral pulping processl" PulpPaperCan., 98(6):82-89,1997.
11. JOHANSSON, O., FRITH, M., FALK, B. and R. GAREAU, "The!1l1opulp® - !'eCellt procas dewlopmellts and expmences", fuprints 84th Arm. llIeet. Theh. Sect., PAPTAC, Book RB241-B:l51, 1998.
E. NORGREN, S., HOGLu'ND, R. and B. BAcK, "Irreversible long fibre collapse at high te!llperatm-e TMP reject refining - initial stndies", Pull' Paper Can., 105(7):47-51,2004.
13.MUENSTER, H., FERRITSIUS, O., LECOURT, M. and M. PETIT-CO:NIL, "Energy s~wings in Th1P by high tE'tllpffature LCiMC refiwng", Pme. IntI. Mech. Pull'. Conj., Oslo, 7-9 Jlme: 213-223, 2005.
14. NORGREN, S. and H. HOGLUND, "Irreversible long fibre collapse at high temperature Tl\1P reject refming", IntI. Mech. Ptü'p. Con j, Oslo, 7·9 Jlme: 163-168, :l005.
PAPTAC 92nd AllIlUal Meeting 2006 92ième Congrès Annuel ATPPC
198
15. SABOURlN, M.J., CORT, IR.. WALLER, A, XU, E. and 1. BOILEAU, "Optimizing residenee time, te!Ilp~ratllre and speed to improve TMP pulp propedies and reduce ellergy", Preprints Tech. Sect., PAP'DfC, Book B:B69-B79, 1996.
16. FUGLEM, G, KL1RE, K-A., L0BBEN, O.P. alld T. BELLE, ''Ftûl scale compal'ison of TMP fibre properties -RIS and convelltiooal conditions", Preprints Ann. Meet., PAPrAC Book C:C187-C191, 2000.
17. SABOURIN, M., VAUGHN, J, FRITH, M., LAURITZEN, J., 'WISEMAN, N. and T. FRASER, "Characterization of paper propedies from spmce and pine thermomechanical pulps - effect of refining intE.'mity", Preprints Ann. Meer., PAPTAC Book C:CI25-CB4, 2002.
18. SABOURIN. M., "Operating experiellœ with ne\\' RIS lilles at Holmen Hallstayik", Pull' Paper Can., 105(9):27-29,2004.
19. OMHOLT, L "Pleheating and refining of mechanical pulp at high temperatnre", IntI. Mech. l'lI/p. Con j, Oslo, 7-9 JIme: 59-62,2005.
20. Law, K.N" and KC. Yang, "Characteristics of fibre separatioIl in wood loaded by normal-to-grain. compt-ession", Appim J., 56(1):42-46, 2003.
21. SHALLHORN and P.M., KARNIS, "A Teal' and tensile stl'ength of mechanical pulp.", 1inns. Thehn. Sect .• PAPTAC,5(4):TR92-OO,1979.
A419
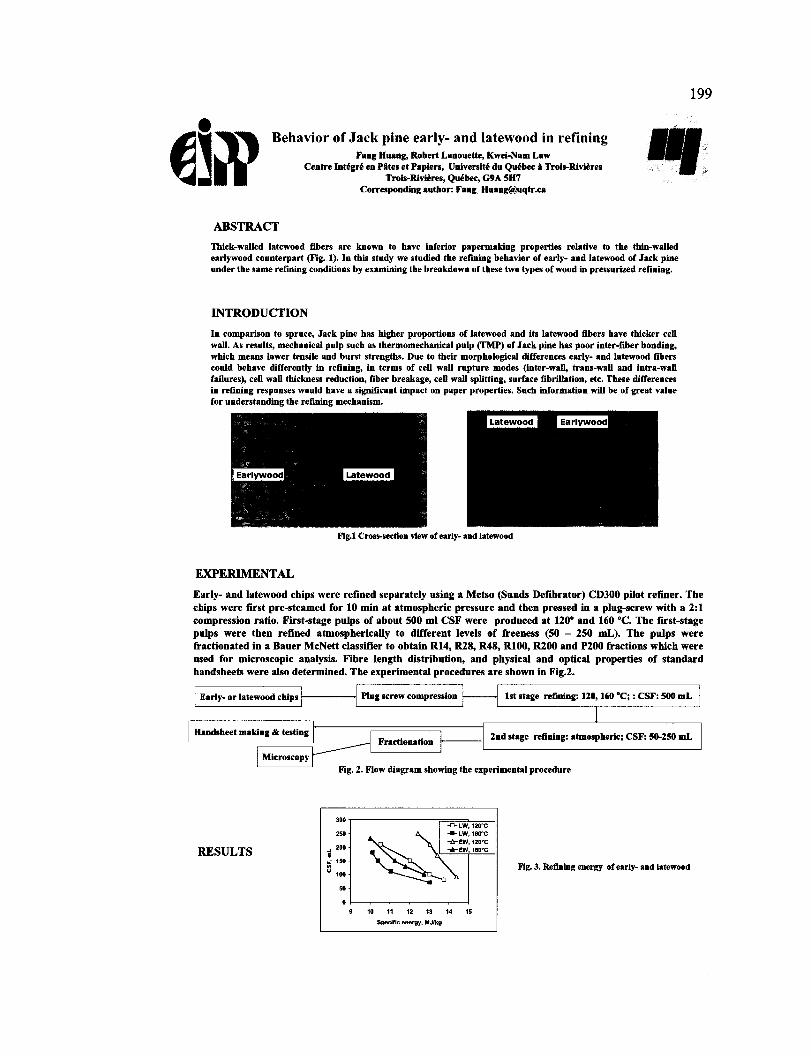
Reproduced with permission of the copyright owner. Further reproduction prohibited without permission.
Behavior of Jack pine early- and latewood in refining
ABSTRACT
Fang Huang, Robert Lanouette, Kwei-Nam Law Centre Intégré en Pites et Papiers, Université du Québec à Trois-Rivières
Trois-Rivières, Québec, G9A SH7 Corresponding author: [email protected]
Thick-walled latewood libers are known to have inferior papermaking properties relative to the thin-walled earlywood counterpart (Fig. 1). In this study we studied the refming behavior of early- and latewood of Jack pine under the same relining conditions by examining the breakdown of these two types of wood in pressurized refming.
INTRODUCTION
In comparison to spruce, Jack pine has higher proportions of latewood and its Iatewood libers have thicker cell wall. As resuIts, mechanical pulp such as thermomechanical pulp (TMP) of Jack pine has poor inter-liber bonding, which means lower tensile and burst strengths. Due to their morphological differences early- and latewood libers could behave differently in relining, in terms of cell wall rupture modes (inter-wall, trans-wall and intra-wall failures), cell wall thickness reduction, liber breakage, cell wall spUtting, surface librillation, etc. These differences in relining responses would have a significant impact on paper properties. Such information will be of great value for understanding the relining mechanism.
Flg.l Cross-sectlon vlew of early- and latewood
EXPERIMENTAL
199
Early- and latewood chips were retined separately using a Metso (Sunds Detibrator) CD300 pilot refiner. The chips were tirst pre-steamed for 10 min at atmospheric pressure and then pressed in a plug-screw with a 2:1 compression ratio. First-stage pulps of about 500 ml CSF were produced at 120· and 160 ·C. The fll"st-stage pulps were then retined atmospherically to different levels of freeness (50 - 250 mL). The pulps were fractionated in a Bauer McNett classifier to obtain R14, Rl8, R48, R100, RlOO and P200 fractions which were used for microscopic analysis. Fibre length distribution, and physical and optical properties of standard handsheets were also determined. The experimental procedures are shown in Fig.2.
Early- or Iatewood chips f-----., Plug screw compression tst stage relining: 120, 160 ·C; : CSF: SOO mL
I ......... --&-~ . 1 Fractionation
1 Microscopy Fig. 2. Flow diagram showing the experimental procedure
2nd stage relining: atmospheric; CSF: S8-25O mL
300
250 ~~::::;: 200 ~:::;~ 150
100
RESULTS Fig. 3. Refining energy of early- and latewood
50
0
9 ,. 11 12 13 ,. ,. Specifie energy. MJ/kg

Reproduced with permission of the copyright owner. Further reproduction prohibited without permission.
200
8
~~~:::::I 6
~EW,120°C
+EW, 160"C
1 -O-LW'~20'C 4 • ..--------------11
4_LW, 160"C
.,40 ~~:::~ ., 0/4 1i
~ 2 - •• •
~3' ~ 30
0
• 10 11 12 13 14 " 10 11 12 13 14 15
Specifie energy, MJ/kg Specifie anergy, MJfkg
Fig.4: Cross-section view of TMP tibers Fig. S. Rl4 fraction of early- and latewood.
Fig. 6. R28 fraction of early- and latewood
20 1 -0- LW, 120'C 1
~ I-LW
"60'C
" ""Ô'"'EW, 120"C ..... ew, 160°C
., 18 ~
t" ~ 1.
g 1<
1.
• 10 11 12 13 14 1. Specifie energy, MJ/kg
12 1 -0- LW, 120'C 1 ..... LW, 160°C
11 ~ I-o-EW"20'C ..... EW, 160"C
10
• 8
7 ~ 6
• 10 11 12 13 14 1. Specifie .nergy, MJ/kg
7
>: 6
~ . 10 11 12 13 14 15
Specifie energy, MJ/kg
Fig. 7. R48 fraction of early- and latewood
Fig. 8. RlOO fraction of early- and latewood
Fig. 9. R200 fraction of early- and latewood
10 11 12 13 14 15 Specifie energy, MJ/kg
4.r------------------,
~40 ~L z //
· ... 1 :: '/ I;~:::~r:~ ..... EW.160 .. C
2. J--:-~~~~=F"-"'I 10 11 12 13 14 15
Specifie energy, MJ/kg
11
10
{ • z È 8
7
•
~ 1 I~Lw.'20'C ..... LW, 160°C ---....... -Q- EW, 120"C .... EW, 160°C
• 10 11 12 13 14 " Specifie energy, MJ/kg
Fig. 10. P200 fraction of early- and latewood
Fig. 11. TensUe Index of early- and latewood
Fig. 12. Tear index of early- and latewood
CONCLUSION
1.
2.
3.
4.
For a given freeness earlywood required more specifie refming energy than latewood did, despite the faet that there was no c1ear dissimilarity in fmes generation between earlywood and latewood.
Regarding the refining behavior in terms of fiber fractions, there was no definite trend differentiating earlywood from latewood when they were refmed separately. However, they might response differently when they are refmed together. High temperature refming at 160 oC did yield significant higher proportion of earlywood fiber in the short fractions such as R48, RI00 and R200.
Surprisingly,latewood pulp showed higher tensile strength compared to earlywood counterpart, for a given refining energy and temperature. Tear index was also higher for latewood than for earlywood, under similar refming conditions.
Cell wall delamination was more significant for latewood fibers than for earlywood ones.
ACKNOWLEDGEMENT
Tbe autbors want to express tbeir gratitude towards tbe Natural Sciences and Engineering Researcb CouDcil of Canada for its flnanelal support in tbis work.
Reproduced with permission of the copyright owner. Further reproduction prohibited without permission.
I1&N0826.220
JOURNAL OF PULPAND PAPER SCIENCE
201