Embed Size (px)
Citation preview
Universidade dos Açores
Departamento de Oceanografia e Pescas
Mapping multi-species habitat use for marine conservation planning
Por
Mara Schmiing
Dissertação apresentada à Universidade dos Açores para obtenção do Grau de Doutor
no Ramo de Ciências do Mar e Especialidade em Biologia Marinha
Horta, 2013


Mapping multi-species habitat use for marine conservation planning
By
Mara Schmiing
Dissertation presented to the University of the Azores to obtain the Doctoral degree in Marine Sciences, speciality Marine Biology
Under the supervision of:
Dr. Ricardo Serrão Santos & Dr. Pedro Afonso
University of the Azores - Department of Oceanography & Fisheries IMAR - Institute of Marine Research
LARSyS – Associated Laboratory of Robotics and Systems in Engineering and Science
Dr. António Pascoal
Institute for Systems and Robotics, Instituto Superior Técnico , Lisbon
University of the Azores Horta, 2013
Copyright © Mara Schmiing


To my family

Acknowledgement
I would not have been able to complete this work without the assistance of many people. If I
neglect mentioning your name here, please forgive me that lapse and be assured that I did not
forget your support.
I am honoured to have lived and worked in a marine paradise during my PhD studies – thank
you Azores!
Let me express my gratitude to my supervisors who enabled and accompanied my journey,
had time and (moral) support available when needed, and did not get tired to correct my
Portuguese: Ricardo Santos, for his constant support, encouragement, and for pointing out
details I might have missed. António Pascoal, for his advice whenever needed and for
broadening my horizon by introducing me to the world of marine robotics. Pedro Afonso, for
our fruitful discussions, sharing of brilliant ideas, for pushing me, and for respecting my ups
and downs.
I received individual grants from the European Marie Curie Research Training Network
FREESUBNET (MRTN-CT-2006-036186), the Portuguese Foundation for Science and Technology
(FCT, SFRH/BD/66117/2009) and the Regional Fund for Science and Technology (FRCT,
M3.1.5/F/168/2012), thank you for supporting my work. This work could not have been
achieved without the extensive field work in the scope of the projects CLIPE (FCT – Praxis XXI/
3/3.2/EMG/1957/95), MARÉ (LIFE B4-3200/98-509), MAREFISH (FCT-POCTI/BSE/41207/2001),
OGAMP (INTERREG IIIb/MAC/4.2/A2 2001) and MARMAC (INTERREGIIIb-03/MAC/4.2/A1
2004). Thanks to P. Afonso, J. Fontes, T. Morato, F. Tempera, F. Cardigos, and N. Serpa who
actively participated in that data collection.
I am very grateful for all the support I received from Fernando Tempera throughout my PhD
studies. Thank you for being such a precious oracle.
Ricardo Medeiros helped me whenever ArcGIS got tricky, unbeatable, thank you so much. And
thank you for borrowing me your fast PC.
Thank you, Frederic Vandeperre, David Abecasis and Hugo Diogo for your valuable input, tricks
& tips, and our excellent discussions about certain aspects of my work. And thanks a million
Hugo for miraculously transforming my abstract into Portuguese.
A special thanks also to Alain Zuur, for not only making me understand statistic modelling but
even kind of liking it.

Thanks to all my colleagues at DOP who provided advice and help throughout the years. Thank
you, Sandra Andrade and Sandra Silva, for guiding me through a jungle of logistics and paper
work. Adriana Ressurreição provided me with valuable insight into socio-economic aspects of
MPA design, thank you. Thank you, Paulo Castro for arranging me 7 additional computers to
run the Marxan scenarios. Thank you, Frederico Cardigos for updating me with facts about the
Azores and taking your time to improve parts of my thesis. And Paulinha, thank you so much
for all you generous help, even with simple things.
My best wishes go out to Ralf Bublitz, for bringing me to the Azores and all the support in the
initial phase of my PhD.
Norberto, you taught me so much about the sea and truly made marine dreams come true.
Thank you so much! And thank you for pushing me to speak Portuguese.
I am deeply grateful to Ellen and Cherylle for their friendship, even over long distances, and
valuable comments on earlier drafts of my thesis.
I was blessed meeting amazing new friends in the Azores who always kept me going: Marlene
& Miguel, Serpa, Sergio & Lucia, Ruth, Mário A. and L., Humberto & Diana, Vanda, Vitor, Eunice
- you are wonderful!
I also was blessed to not lose touch with my friends in Germany (or wherever they moved to):
Cordula, Arne, Silke, Timo, Hans, Matze, you all helped me in your own special way.
Thank you César, especially for offering me (and my friends and family) a home in Lisbon on
the journeys to and from the Azores.
My private pilot Steeefan, who left this world far too early, wherever you are, you believed in
me and made me fly. I miss you. Thank you for everything!
Cheers to Nuno Sá who introduced me to more beauty than I expected in the Azores and for
allowing me to use his beautiful photos in presentations.
The “Freesubnet ESRs” truly made this PhD special. A huge thanks goes out to all of you.
Tigre & Mira, thank you, simply for being.
Thank you for having faith in me Hugo P. Tu és a minha força quando estou fraca - vou ser a
tua. “... vamos unidos, ... vamos ficar na aventura dos sentidos!” (A. Variações)
Astrid, you are my rock. You always gave me the guts I needed. I would not have made it
without you, not only during my PhD. Thank you for being part of me.

To my family – my mum and dad, my brother, grandmas and aunts: Danke, dass ihr immer an
mich geglaubt habt, mich bedingungslos unterstützt habt, und auch in der Ferne bei mir seid.
Ohne euch wäre ich nie hier angekommen! Ich hab’s geschafft Oma!
Thank you to the wonderful marine creatures and true treasures I met in the Azores,
constantly reminding me why I am here and doing this work.
And last but not least, thank you, all readers of this thesis who take their time for digging into
the results of several years of my life. I hope you can take something out of it, be it for your
own research or life. Our oceans are full of true wonders and miracles; let us try to preserve
them.


i
Abstract
Marine protected areas (MPAs) can play a key role in preserving biodiversity and habitats and
in managing the sustainable use of natural resources, including fish stocks. Designing
representative, connected, resilient, and adequate MPA networks requires a good
understanding of the species’ distribution and habitat preferences. Yet, detailed knowledge is
often reduced to a few sampled locations and species. This thesis focuses on marine reef fishes
in coastal habitats down to the 40 m isobath. A framework is developed to design MPA
networks that optimise ecological benefits. For this purpose, predictive distributions of a set of
fish variables are spatialised to identify potential sites of priority for conservation that can
serve multiple species and objectives. The thesis is organised in seven chapters.
Chapter 1 gives an overall introduction to the state of the art on the science of MPAs, species
distribution models (SDMs) and the marine ecosystem of the study area, two neighbouring
islands of the Azores archipelago (Northeast Atlantic). It includes an overview of the existing
MPA network and regional fisheries. The motivation and objectives of the thesis are outlined.
Chapter 2 presents the sampling method to acquire fish data, the selection of individual study
species, and the environmental data that are used in the thesis. The main methods and
background knowledge for the statistical models used to describe the species-environment
relationships and to produce predictive maps are explained in detail, setting the basis for the
following three chapters.
The occurrence and abundance of reef fishes with different trophic ecologies are modelled and
spatialised in chapter 3. Results showed that the environment shapes the spatial distribution
patterns of the reef fishes. For instance, the abundance was typically highest at the interface
between rock and sediment, highlighting the importance of this main ecotone for subtidal fish
assemblages. Individual species were predicted to occur in large parts of the study area but
these areas were much smaller if multiple species from the same trophic guild were
considered. These multi-species abundance hotspots can be a major potential contribution to
the ‘reserve effect’ of MPAs while minimising the area needed for protection.
Chapter 4 presents spatially explicit models for the spawning biomass and the potential
fecundity (number of oocytes of mature females) of selected reef fishes. The spatial
distribution of both measures was heterogeneous, species-specific and influenced by
bathymetry, oceanographic forces and the distance to the habitat edge. Maps of the potential

Abstract
ii
fecundity further refined the spatial patterns of the spawning biomass for species with sex-
ratios highly skewed towards males. Multi-species reproductive hotspots were identified and
are potential ‘source habitats’ of increased larvae production and export to adjacent areas. As
such, they potentially support the ‘recruitment effect’ of MPAs and their complete protection
should be promoted.
Chapter 5 evaluates different indices of biodiversity and vulnerability to fishing of fish
assemblages. The protection of high-biodiversity sites is often demanded in marine
conservation. Yet, results showed that biodiversity patterns alone may not represent well the
areas of higher need for conservation. Integrating the intrinsic vulnerability to fishing in spatial
planning resulted in a more precise identification of priority sites. The combination of both
parameters is proposed as a novel approach to support marine spatial planning that serves
fisheries management and conservation objectives.
Chapter 6 is one comprehensive analysis that combines the predictive maps produced in the
previous three chapters with additional habitat and socio-economic characteristics. Alternative
scenarios for a reserve network are produced with the systematic conservation software
‘Marxan’ considering different conservation targets and objectives. Results demonstrated that
the network statistics (e.g. size, edge-to-area ratio, and percentage of protected coastline) and
reserve localisation were mainly influenced by the targeted level of protection. In contrast,
differences were less pronounced between solutions that focused either on fisheries aspects
or the protection of biodiversity within a given conservation target. The solutions provided by
Marxan overlapped only partially with the existing MPA network. They provide potential
alternatives for the location and size of protected areas that can be used in adaptive
management processes.
Chapter 7 combines a general discussion of the thesis results, impacts and possible future
work. Results highlight that MPAs may not equally benefit all species, thus it is critical to
include information of multi-species spatial ecology in their design. Analyses of
representativeness showed that all multi-species hotspots are quantitatively well integrated in
the existing MPA network. However, given the high biological/ecological significance and the
rather small extent of these hotspots, future adaptive management processes should, possibly,
promote the protection of the entire area of the hotspots to ensure their ecological
functionality.
Abstract
iii
Because of its clarity the application of predictive species distribution maps should be a
principle tool for marine spatial management, especially in data scarce situations, provided
that rigorous validation criteria are applied. The presented framework is simple,
straightforward and efficient in identifying habitats with potentially high fish abundance,
fecundity, biodiversity or vulnerability to fishing. It is proposed to integrate this promising
approach as a first step of a manifold process for the identification of priority sites for
conservation that serve multiple purposes.

v
Resumo
As áreas marinhas protegidas (AMPs) desempenham um papel chave na preservação da
biodiversidade e dos habitats, e na gestão sustentável dos recursos naturais. Um desenho
representativo, conectado, resiliente e adequado das redes de AMPs requere uma boa
compreensão da distribuição das espécies e da sua preferência de habitats. No entanto, um
conhecimento detalhado está geralmente concentrado em apenas alguns locais de
amostragem e espécies.
A presente tese está direcionada para os peixes marinhos em habitats costeiros até os 40 m. A
abordagem que foi desenvolvida foca-se no desenho de redes de AMPs planeadas para
otimizar benefícios ecológicos. Para esta finalidade, previsões preditivas de um conjunto de
variáveis dos peixes foram mapeadas para identificar áreas prioritárias para a conservação de
múltiplos espécies e objetivos. A dissertação está organizada em sete capítulos.
O capítulo 1 dá uma introdução geral ao estado do conhecimento da ciência das AMPs,
modelos de distribuição de espécies (MDEs) e ao ecossistema marinho da área de estudo, que
integra duas ilhas vizinhas do arquipélago dos Açores (Nordeste Atlântico). Uma visão geral da
rede existente de AMPs e das pescas regionais está descrita. O capítulo conclui com a
motivação e objetivos desta dissertação.
O capítulo 2 apresenta o método de amostragem para aquisição dos dados de ictiofauna, a
seleção das espécies-alvos, e os dados ambientais que foram usados na dissertação. Os
principais métodos de MDEs utilizados para a produção de mapas preditivos são explicados em
detalhe. Este capítulo é a base metodológica para os seguintes três capítulos.
Abundância ou presença-ausência de peixes de recife com diferente ecologias tróficas são
modelados e mapeados no capítulo 3. Os resultados mostram que o ambiente determinou o
padrão espacial das espécies estudadas. Por exemplo, a abundância foi sempresuperior na
interface entre os principais tipos de habitat: rocha e sediment. As áreas com a presença
potencial de espécies individuais foram espalhadas na área de estudo mas mais pequenos para
múltiplas espécies de um determinado nível trófico. Estes hotspots de multi-espécies são uma
potencial contribuição para o 'efeito de reserva’ minimizando a área necessária para a
conservação.
O capítulo 4 apresenta modelos espaciais para a biomassa desovante e a fecundidade
potencial (o número de oócitos das fêmeas matures) de peixes de recife selecionados. As duas

Resumo
vi
medidas mostraram uma distribuição espacial heterogénea por espécie e influenciada pela
batimetria, forças oceanográficas e distância à fronteira do habitat. Mapas de fecundidade
potencial refinaram os padrões espaciais da biomassa desovante para espécies com um sex-
ratio altamente enviesado para os machos. Hotspots reprodutivos de várias espécies são
potenciais “habitats fonte” aumentando a produção e exportação de larvas para áreas
adjacentes. Como tal, vêm potencialmente apoiar o “efeito de recrutamento” das AMPs.
Consequentemente, a sua total proteção deve ser promovida.
Diferentes índices de biodiversidade e de vulnerabilidade intrínseca para a pesca são
analisados no capítulo 5. A proteção de locais de alta biodiversidade é frequentemente exigida
em conservação marinha. No entanto, os resultados mostraram que somente os padrões de
biodiversidade pode não representar bem as áreas de maior interesse e necessiade para a
conservação. A integração da vulnerabilidade intrínseca para a pesca no planeamento espacial
resultou numa identificação mais precisa de sítios prioritários. A combinação de ambos os
parâmetros é proposta como uma nova abordagem para apoiar o planeamento espacial
marítimo que serve a gestão pesqueira e os objetivos de conservação.
O capítulo 6 é uma análise abrangente que combina os mapas preditivos que foram
produzidos nos três capítulos anteriores com outras características do habitat e sócio-
econômicos. Cenários alternativos da rede de reserva foram produzidos com o software
‘Marxan’, considerando diferentes alvos de conservação e objetivos. Os resultados
demonstraram que a estatística da rede (ex. tamanho, ‘rácio da-borda-à-área’, e percentagem
da linha de costa protegida) e o posicionamento da reserva foram influenciados,
principalmente, pelos diferentes níveis de proteção. As diferenças foram menos pronunciadas
entre soluções que se focaram na pesca ou na conservação da biodiversidade. As soluções
criadas pelo Marxan correspondem parcialmente à atual rede de AMPs. Estas mostram
alternativas para a localização e tamanho das áreas protegidas, que podem ser usadas em
processos de gestão adaptativa.
O capítulo 7 combina a discussão geral dos resultados da dissertação, impactos e possíveis
trabalhos futuros. Os resultados evidenciam que as AMPs não podem beneficiar igualmente
todas as espécies, portanto, é fundamental incluir informação do ecologia espacial de multi-
espécies no seu desenho. Análises de representatividade mostraram que todos os hotspots de
multi-espécies são quantitativamente bem integrados na rede existente de AMPs. Porém dada
a elevada importância biológica/ecológica e a pequena extensão destes hotspots, os futuros

Resumo
vii
processos de gestão devem promover a proteção de toda a área de hotspots para assegurar o
seu funcionamento ecológico.
Devido à sua clareza a aplicação de mapas preditivos deve ser uma ferramenta prioritária para
a gestão do espaço marítimo, especialmente em situações de escassez de dados, desde que
rigorosos critérios de validação sejam aplicados. O enquadramento apresentado é simples,
direto e eficiente na identificação de habitats com potencialmente alta abundância,
fecundidade, diversidade e vulnerabilidade para a pesca. Propõe-se a integração desta
abordagem promissora como um primeiro passo de um múltiplo processo para a identificação
de sítios prioritários para a conservação que servem vários objetivos.


ix
Zusammenfassung
Meeresschutzgebiete spielen eine entscheidende Rolle zur Erhaltung der Artenvielfalt und
Lebensräume und zur nachhaltigen Nutzung natürlicher Ressourcen, einschließlich
Fischbeständen. Eine gute Kenntnis über Verbreitungsmuster und bevorzugte Lebensräume
der untersuchten Arten ist die Voraussetzung um repräsentative, miteinander verknüpfte,
widerstandsfähige und adequate Netywerke mit individuellen Schutzgebieten zu entwerfen.
Detailliertes Wissen ist allerdings oft auf wenige Untersuchungsstandorte und Arten reduziert.
Diese Doktorarbeit konzentriert sich auf Meeresfische in Küstengebiten bis 40 m Wassertiefe.
Das vorgestellte Konzept stellt die ökologische Funktionalität von Schutzgebieten in den
Vordergrund. Habitatmodelle verschiedener Fischvariablen werden erstellt, mit deren Hilfe
potentielle Gebiete identifiziert werden, die besonders schutzbedürftigt sind und mehrere
Arten und Schutzziele berücksichtigen. Die Arbeit ist in sieben Kapitel gegliedert.
Kapitel 1 ist eine allgemeine Einleitung zum Stand des Wissens über Meeresschutzgebiete und
über Habitatmodelle. Das marine Ökosystem des Untersuchungsgebietes zweier benachbarter
Inseln der Azoren (Nordost Atlantik) wird vorgestellt, einschließlich lokaler Schutzmaßnahmen
und Fischerei. Die Fragestellung und Absicht der Dissertation werden erläutert.
In Kapitel 2 werden die Sammlung von Fischdaten, Kriterien zur Auswahl einzelner Arten, und
die Umweltdaten vorgestellt. Grundlagen von Regressions- und Habitatmodellen werden
detalliert erläutert. Dieses Kapitel ist die Grundlage für die folgenden drei Kapitel.
Räumliche Verbreitungsmuster von Abundanzen oder dem Vorkommen von Rifffischen mit
verschiedener trophischer Zugehörigkeit werden in Kapitel 2 modelliert. Ergebnisse zeigen,
dass bestimmte Umweltbedingungen diese Muster steuern. Die Fisch-Abundanz war zum
Beispiel typischerweise am höchsten am Übergang zwischen Riff und Sediment. Individuelle
Arten hatten eine weite potentielle Verbreitung, die jedoch wesentlich eingeschränkter war,
wenn hohe Fischdichten oder mehrere Arten derselben trophischen Gilde berücksichtig
wurden. Diese artübergreifenden Hotspots sind ein potentieller Beitrag zum „Reservat-Effekt“
von Meeresschutzgebieten bei gleichzeitig kleinstmöglicher Schutzfläche.
Habitatmodelle der Biomasse aller geschlechtsreifen Individuen bzw. der Fekundität aller
geschlechtsreifen Weibchen werden in Kapitel 4 behandelt. Räumliche Muster beider
Parameter waren heterogen, artspezifische und beeinflußt durch die Tiefe, ozeanographische
Kräfte, und den Abstand zur Habitatgrenze. Muster der Fekundität verfeinerten die der
Zusammenfassung
x
Biomasse für Arten, die mit wesentlich mehr Männchen als Weibchen vertreten waren. Die
aufgezeigten „reproduktiven Hotspots“ sind potentielle Quellen, die Fischlarven produzieren
und in umliegende Gebiete exportieren. Da sie den „Rekrutierungs-Effekt“ von Schutzgebieten
potenziell unterstützen, sollten diese Gebiete vollständig geschützt werden.
In Kapitel 5 werde die Biodiversität und intrinsische Verwundbarkeit durch Fischerei
untersucht. Der Schutz von Gebieten mit hoher Artenvielfalt wird oft gefordert. Allerdings
zeigen die Ergebnisse, dass diese allein nicht unbedingt die schutzbedürftigsten Areale
darstellen. Die Berücksichtigung der Fischerei-Verwundbarkeit kann genauere Ergebnisse
liefern. Die Kombination beider Parameter wird vorgeschlagen, um Meeresschutzgebiete zu
planen, die sowohl der Fischerei als auch dem Schutz der Biodiversität dienen.
Modelle aus den vorhergehenden drei Kapiteln werden in Kapitel 6 mit weiteren
Informationen der Umwelt, sowie mit sozial-ökonomischen Werten kombiniert. Alternative
Reservat Vorschläge werden mit der Software ‘Marxan‘ erstellt, wobei verschiedene
Schutzziele und –grade untersucht werden. Ergebnisse zeigen, dass Netzwerk-Statistiken (z.B.
Größe, Prozent der Küstenlinie, Fläche-zu-Umfang-Verhältnis) hauptsächlich durch den Grad
des Schutzes beeinflußt werden. Bei gleichem Schutzgrad, waren die Unterschiede für
Szenarien, die entweder auf die Fischerei oder allgemeine Schutzabsichten ausgerichtet waren
weniger stark ausgeprägt. Die Marxan Ergebnisse decken sich nur teilweise mit der Aufteilung
und Größe der existierenden Schzugebiete. Stattdessen liefern sie Alternativen für ein
‘adaptives Management‘.
Eine allgemeine Schlussfolgerung und Vorschläge für zukünftige Arbeiten sind in Kapitel 7
dargestellt. Ergebnisse zeigen, dass nicht alle Arten im selben Maße von
Meeresschutzgebieten profitieren und daher mehrere Arten in der Planung berücksichtigt
werden müssen. Alle identifizierten artübergreifenden Hotspots waren gut in den bestehenden
Schutzgebieten vertreten. Diese Hotspots sind sehr klein, dennoch sind sie von höchster
biologischer und ökologischer Bedeutung. Um ihre ökologische Funktionalität zu
gewährleisten, sollten sie im Zuge eines adaptiven Managements vollständig in die
Schutzgebiete integriert werden.
Der Gebrauch von Habitatmodellen ist klar und geradlinig und sollte daher vor allem in
datenlimitierten Situationen ein Grundsatz in der Meeresplanung sein, vorausgesetzt, solide
statistische Methoden werden angewandt. Das vorgestellte Rahmenwerk ist einfach und
effizient, um Habitate mit potentieller hoher Fisch Abundanz, Biomasse, Fekundität,

Zusammenfassung
xi
Biodiversität oder Verwundbarkeit durch Fischerei zu erkennen. Es ist ein aussichtsreicher
erster Schritt in einem vielfältigen Prozess zur Identifizierung von Gebieten mit Schutz-
Priorität, die verschiedenen Zielen dienen.

xiii
Parts of this Phd dissertation have been published, submitted or are in preparation to be
submitted:
Schmiing M, Afonso P, Tempera F, Santos RS (2009) Integrating recent and future marine
technology in the design of marine protected areas - the Azores as case study. OCEANS
2009 - Europe, OCEANS-IEEE.
Schmiing M, Afonso P, Tempera F, Santos RS (2013) Predictive habitat modelling of reef fishes
with contrasting trophic ecologies. Marine Ecology Progress Series 474: 201-216.
Schmiing M, Afonso P, Santos RS (in press) Coastal marine protected areas in the Azores –
opportunities, benefits and limitations (As áreas marinhas protegidas costeiras dos
Açores – oportunidades, benefícios e limitações) (bilingual, English - Portuguese).
Arquipélago - Life and Marine Sciences. Supplement 8.
Schmiing M, Diogo H, Santos RS, Afonso P (submitted) Hotspots inside hotspots – Priority areas
for the conservation of biodiversity and fisheries management.
Schmiing M, Afonso P, Diogo H, Santos RS (in preparation) The influence of conservation
objectives and targets on the design of marine reserves – promoting an adaptive
management.
Schmiing M, Afonso P (in preparation) Locating potential hotspots of larval subsidy for marine
conservation.
Zuur AF, Schmiing M, Tempera F, Afonso P, Saveliev AA (2012) Zero inflated GLMs with spatial
correlation - analysis of parrotfish abundance. In: Zuur AF, Saveliev AA, Ieno EN (Eds.)
Zero inflated models and generalized linear mixed models with R. Highland Statistics
Ltd., Newburgh, pp. 231–256.

xv
Contents
Abstract (English) ................................................................................................................. i
Resumo (Português) ............................................................................................................ v
Zusammenfassung (Deutsch) .............................................................................................. xi
List of Tables ..................................................................................................................... xix
List of Figures .................................................................................................................... xxi
Acronyms & Abbreviations ............................................................................................... xxv
Chapter 1: General introduction..................................................................................................1
1.1 Marine conservation and spatial management ............................................................ 3
1.2 Statistical predictive modelling ..................................................................................... 8
1.3 The marine ecosystem of the Azores archipelago ........................................................ 9
1.3.1 Fishery ............................................................................................................ 10
1.3.2 Marine conservation in the Azores ................................................................ 12
1.3.3 Study site ........................................................................................................ 15
1.4 Research objectives..................................................................................................... 17
1.5 Organisation of the thesis ........................................................................................... 18
Chapter 2: General methods for predictive modelling ........................................................ 21
2.1 Fish censuses and selection of study species .............................................................. 23
2.2 Environmental variables ............................................................................................. 25
2.3 Data Exploration .......................................................................................................... 29
2.4 Consequences of data exploration ............................................................................. 33
2.5 Statistical modelling .................................................................................................... 34
2.5.1 Generalised additive models ......................................................................... 36
2.5.2 Probability distributions ................................................................................. 38
2.5.3 Model building ............................................................................................... 40

Contents
xvi
Chapter 3: Predictive distribution models of reef fish abundances..……….………….……………….45
3.1 Introduction ................................................................................................................. 48
3.2 Material and Methods ................................................................................................. 50
3.2.1 Study area and data ....................................................................................... 50
3.2.2 Species distribution models ........................................................................... 58
3.2.3 Model validation............................................................................................ 55
3.2.4 Spatial prediction of species' distributions.....................................................56
3.3 Results ......................................................................................................................... 58
3.3.1 Spatial distribution of reef fish abundances ................................................... 58
3.3.2 Ontogenetic influence on the spatial patterns of reef fishes ......................... 66
3.3.3 Spatial patterns of a rare species - the dusky grouper ................................... 71
3.4 Discussion .................................................................................................................... 73
3.4.1 Model performance ........................................................................................ 73
3.4.1 Influence of environmental variables ............................................................. 75
3.4.1 Benefits of multi-species habitat maps for conservation planning ................ 80
Chapter 4: Spatial analyses of spawning biomass and potential fecundity of reef fishes……..85
4.1 Introduction ................................................................................................................. 88
4.2 Material and Methods ................................................................................................. 90
4.3 Results ......................................................................................................................... 93
4.4 Discussion .................................................................................................................. 101
Chapter 5: Mapping of fish biodiversity and vulnerability to fishing insupport of marine conservation planning ..................................................................................................... 109
5.1 Introduction ............................................................................................................... 112
5.2 Material and Methods ............................................................................................... 113
5.3 Results ....................................................................................................................... 117
5.4 Discussion .................................................................................................................. 122
Chapter 6: The influence of conservation objectives and targets on the design of marine reserve networks ............................................................................................................ 131
6.1 Introduction ............................................................................................................... 134
6.2 Material and Methods ............................................................................................... 136
6.3 Results ....................................................................................................................... 142

List of figures
xvii
6.4 Discussion .................................................................................................................. 146
Chapter 7: Synthesis & Conclusion - Towards an adaptive management of marine protected areas ............................................................................................................................... 155
7.1 Towards an adaptive management of MPAs in the Azores ...................................... 157
7.2 Contributions to an ecologically optimal design of MPAs ........................................ 163
7.3 Main conclusions ....................................................................................................... 166
7.4 Recommendations and future work ......................................................................... 167
Bibliography .................................................................................................................... 169
Appendices .......................................................................................................................... I
Appendix A - Chapter 2.................................................................................................III
Appendix B - Chapter 4.................................................................................................VI
Appendix C - Chapter 5.................................................................................................IX


xix
List of Tables
Table 2.1: Spatialised environmental variables to model fish assemblages in the Azores ........ 28
Table 2.2: List of the probability distributions, link functions and R packages used to model
different types of response variables .......................................................................... 40
Table 3.1: Summary of the studied reef species and applied statistical models to predict their
abundances .................................................................................................................. 52
Table 3.2: Model validation and generality of final models for 11 coastal reef fishes in the
Azores .......................................................................................................................... 58
Table 3.3: Overview of the percentage of available rocky habitat with potential presence or
three different levels of relative abundance of single species and species from the
same trophic group ..................................................................................................... 63
Table 3.4: Significance of environmental variables in final generalised linear mixed models for
three coastal reef fishes in the Azores ........................................................................ 67
Table 3.5: Relative contributions of the environmental variables to the ‘Maxent’ model of
Epinephelus marginatus. ............................................................................................. 72
Table 4.1: Overview of the reproductive strategy and fecundity of selected reef fishes .......... 91
Table 4.2: Summary of final generalised additive models for location, scale and shape for
continuous responses and generalised additive models for binomial responses ....... 94
Table 4.3: Validation of predictive spawning biomass and potential fecundity models of
selected reef fishes ...................................................................................................... 95
Table 4.4: Comparison of multi-species reproductive hotspots in a conservation and fisheries
related scenario and their integration in the existing marine protected areas .......... 99
Table 5.1: Overview of four biodiversity indices and the intrinsic vulnerability index of coastal
fish assemblages in the Azores, including applied predictive models and model
validation ................................................................................................................... 116
Table 5.2: Summary of sighted fish species, including their habitat characteristics, trophic
ecology, commercial value, intrinsic vulnerability index and relative frequency of
occurrence for two islands of the Azores archipelago. ............................................. 118
Table 5.3: Size of most diverse or vulnerable hotpots and their representativeness in the
existing marine protected area network of Faial and Pico. ....................................... 119

List of tables
xx
Table 6.1: Overview of the spatial conservation features and their use in reserve selection
scenarios with two different objectives .................................................................... 140
Table 6.2: Conservation targets and costs for six reserve selection scenarios produced with the
software Marxan. ....................................................................................................... 141
Table 6.3: Network statistics of the best solutions of three fisheries and three biodiversity
reserve design scenarios and the existing marine protected area network ............. 142

xxi
List of Figures
Figure 1.1: The ‘Island Natural Parks’ of each island in the Azores archipelago ........................ 12
Figure 1.2: Zoning and legislation of the different sites inside the ‘Island Natural Park’ of Faial
and Pico Islands ......................................................................................................... 13
Figure 1.3: Map of the study area including the boundaries of the existing marine protected
area network ............................................................................................................. 16
Figure 1.4: Flowchart illustrating the objectives of the thesis. ................................................... 18
Figure 1.5: Diagram of the organisation of the thesis ................................................................ 19
Figure 2.1: Map with the location of 462 surveyed underwater visual transects ...................... 24
Figure 2.2: Important components of an appropriate data exploration. ................................... 29
Figure 2.3: Visualisation of the temporal sampling effort .......................................................... 30
Figure 2.4: Simplified flowchart of the basic modelling approach used to model a set of reef
fish parameters ......................................................................................................... 35
Figure 3.1: Relative contribution of environmental variables to the explained deviance of 11
generalised additive models of reef fishes ............................................................... 59
Figure 3.2: Smoother estimates for five environmental variables as obtained by generalised
additive models for carnivorous reef fishes.............................................................. 60
Figure 3.3: Smoother estimates for herbivorous reef fishes ...................................................... 61
Figure 3.4: Smoother estimates for planktivorous reef fishes ................................................... 62
Figure 3.5: Predictive maps for relative abundances of carnivorous, herbivorous, and
omnivorous reef fishes down to 40 m in Faial and Pico ........................................... 64
Figure 3.6: Probability of presence of Sparisoma cretense, Symphodus caeruleus and
Trachurus picturatus ................................................................................................. 65
Figure 3.7: Shared potential habitat with a minimum of 10 % of the maximum abundance of
carnivores and omnivores down to 40 m depth in Faial and Pico ............................ 66
Figure 3.8: Parameter estimates for the generalised linear mixed model of Diplodus sargus,
Sarpa salpa and Sparisoma cretense ....................................................................... 68
Figure 3.9: Loess smoothed predictions for the influence of environmental variables on the
abundance of small, medium, and large to very large Diplodus sargus ................... 69
List of figures
xxii
Figure 3.10: Loess smoothed predictions for the influence of environmental variables on the
abundance of small, medium, and large to very large Sarpa salpa. ......................... 70
Figure 3.11: Loess smoothed predictions for the influence of environmental variables on the
abundance of small, medium, and large to very large Sparisoma cretenses. ........... 70
Figure 3.12: Predictive distribution maps for the relative abundance of small, medium and
large to very large Diplodus sargus, Sarpa salpa and Sparisoma cretense ............... 71
Figure 3.13: Effect of environmental variables on the probability of occurrence of
Epinephelus marginatus as derived from Maxent predictions ................................. 72
Figure 3.14: Predicted probability of occurrence of Epinephelus marginatus ........................... 73
Figure 4.1: Predictive species distribution maps for the relative spawning biomass of five reef
fishes down to 40 m in the Azores ............................................................................ 96
Figure 4.2: Spatialisation of the probability of occurrence of mature Labrus bergylta,
Sparisoma cretense and Symphodus caeruleus. ....................................................... 97
Figure 4.3: Predictive species distribution maps for the relative potential fecundity of four
commercially valuable reef fishes ............................................................................. 98
Figure 4.4: Summary of percentages of available rocky reef habitat down to 40 m depth that is
suitable for different target levels of predictive relative spawning biomass and
relative potential fecundity, including multi-species hotspots ................................. 99
Figure 4.5: Map of shallow ‘multi-species reproductive hotspots’ for fisheries and conservation
scenarios .................................................................................................................. 100
Figure 5.1: Estimated smooth functions of the environmental variables to model biodiversity
indices and the intrinsic vulnerability index of coastal fish assemblages ............... 120
Figure 5.2: Predicted spatial distribution of four biodiversity indices and the intrinsic
vulnerability index of coastal fishes in relation to the boundaries of the existing
marine protected area network .............................................................................. 121
Figure 5.3: Combined hotspots of high vulnerability of commercial fishes to fishing and
biodiversity in two islands of the Azores archipelago ............................................. 122
Figure 6.1: Map of the study area in the Azores archipelago ................................................... 137
Figure 6.2: Maps of the cost layer used in Marxan reserve design scenarios for fisheries and
biodiversity objectives ............................................................................................. 139

List of figures
xxiii
Figure 6.3: Best solutions for reserve networks in Faial and West-Pico considering fisheries or
biodiversity scenarios and three different conservation targets ............................ 144
Figure 6.4: Summed solutions for alternative reserve networks in Faial and West-Pico, Azores
archipelago. ............................................................................................................. 145
Figure 7.1: Comparison of the percentage of available rocky habitat that was identified as
single- or multi-species hotspots ............................................................................ 161

xxv
Acronyms & Abbreviations
List of the most frequently used acronyms and abbreviations.
AIC - Akaike Information Criterion
AUC - Area under the curve
DE – Deviance explained
EBM – Ecosystem-based management
EFH – Essential fish habitat
GAM – Generalised additive model
GAMLSS - Generalised additive model for location scale and shape
GLM - Generalised linear model
GLMM – Generalised linear mixed model
GIS – Geographic information system
INP – Island Natural Park
IUCN - International Union for Conservation of Nature
MPA – Marine protected area
MR – Marine reserve
PU – Planning unit
SDM - Species distribution model
UVC - Underwater visual census
VIF - Variance inflation factor
YOY - Young-of-the-year


CChhaapptteerr 11
GGeenneerraall iinnttrroodduuccttiioonn

3
Chapter 1:
General introduction
1.1 Marine conservation and spatial management
There is growing awareness that marine resources are in decline and that human activities are
causing significant changes in the marine ecosystem (Fraschetti et al. 2011). Decreasing
biodiversity, declining fish stocks, and habitat loss are amongst the most visible consequences
(Worm et al. 2006, 2009, Srinivasan et al. 2012, Staples & Hermes 2012). Of all marine
ecosystems, coastal areas are exposed to a maximum of cumulative human impacts and as
such particularly vulnerable (Halpern et al. 2008). Effective conservation and resource
management are necessary to maintain marine ecosystem services. In this context, ecosystem-
based management (EBM) that incorporates all aspects and interactions within and among
ecosystems, including human activities, rather than considering them separately, is the
preferred approach (Leslie & McLeod 2007, Katsanevakis et al. 2011). It follows an adaptive
management strategy that is conscious of existing uncertainties, implies active learning and
constant advancement (Grafton & Kompas 2005, Curtin & Prellezo 2010).
Marine protected areas (MPAs) are an important component of EBM and play a key role in
maintaining biodiversity and habitats, protecting endangered species, managing a sustainable
use of natural resources, and preserving culturally or historically important sites (IUCN 1994).
By protecting habitats and biological assemblages, MPAs attempt to maintain their value and
support their recovery (e.g. Gaines et al. 2010, Halpern et al. 2010, Katsanevakis et al. 2011).
They have to be controlled and evaluated regarding their socio-economic and ecological
effects. If necessary, adjustments are made to constantly improve marine management
whereas stakeholder participation is crucial for all steps of the adaptive management to get
their support for MPA establishment (Grafton & Kompas 2005, Ressurreição et al. 2012a).
Throughout the thesis, the term ‘MPA’ is used as general form to refer to managed marine
areas with varying levels of protection.
The International Union for Conservation of Nature (IUCN) defines a protected area as “an
area of land and/or sea especially dedicated to the protection of biological diversity, and of
natural and associated cultural resources, and managed through legal or other effective

Chapter 1
4
means” (IUCN 1994). According to their management objectives they are categorised into six
classes (IUCN 1994, UNEP-WCMC 2008):
I – Strict Nature Reserve (Ia)/Wilderness Area (Ib): protected area
managed mainly for research or wilderness protection.
II – National Park: Protected area managed mainly for ecosystem
protection and recreation.
III – Natural Monument or Feature: Protected area managed mainly for
conservation of specific natural features.
IV – Habitat/Species Management Area: Protected area managed mainly for
conservation through management intervention.
V – Protected Landscape/Seascape: Protected area managed mainly for
landscape/seascape conservation and recreation.
VI – Protected area with sustainable use of natural resources: Protected area
managed mainly for the sustainable use of natural ecosystems.
Marine management has progressed constantly in the last decades and there is rising evidence
that species abundances, biomass and diversity increase under protection (Russ 2002,
Friedlander et al. 2003, McCook et al. 2010, Costa et al. 2013). The implementation,
recognition and acceptance of MPAs has increased (Day 2002, Fernandes et al. 2005,
Possingham et al. 2006, Spalding et al. 2010), sophisticated methodologies were developed to
support decision making processes, such as systematic conservation software (Possingham et
al. 2006, Ball et al. 2009), and governments agreed to protect 10 % of the world oceans by
2020 (target revised and updated in 2010, Convention on Biological Diversity 2010). Despite
this progress, certain challenges like the appropriate design, full compliance and adequate
monitoring continue (Grafton & Kompas 2005, Guidetti et al. 2008, Abecasis RC et al. 2013a,
Rife et al. 2013). In 2012, merely 2.3 % of the world’s oceans were protected according to the
World Database on Protected Areas (Spalding et al. 2013), although they cover 70 % of the
planet’s surface.
To be an effective tool for environmental or species conservation, MPAs should be designed as
a network that considers ecologically and biologically significant areas, representativeness,
connectivity, resilience, and adequate/viable sites (OSPAR 2007, UNEP-WCMC 2008, Ardron

General introduction
5
2008). This demands: i) a clear understanding of the available habitat and the ecology and life
history of target species (Russ 2002, Fraschetti et al. 2011), ii) clear definition of objectives and
activities (Fernandes et al. 2005, UNEP-WCMC 2008), iii) the education and involvement of all
involved stakeholders in the planning process and consideration of their interests (Halpern &
Warner 2003, Roberts et al. 2003a, Fernandes et al. 2005, Ressurreição et al. 2012a), and iv)
appropriate management, enforcement and compliance (McCook et al. 2010, Agardy et al.
2011, Fenberg et al. 2012).
Benefits of marine protected areas
The global loss of biodiversity (Worm et al. 2006) and declining fish stocks (Pauly et al. 2005,
Worm et al. 2009, Srinivasan et al. 2012) are two driving factors for an increasing number of
MPAs in coastal and offshore areas. The Food and Agriculture Organisation (FAO) reported
that in 2009, 57 % of the global fish stocks were fully exploited, with catches close to or
already at the maximum sustainable production limit, 29.9 % were overexploited, including
recovering and depleted fish stocks, and merely 12.7 % were non-fully exploited (FAO 2012). In
addition to classical fisheries management methods, including gear restrictions and catch
quota, MPAs are an important tool to promote an ecosystem-based management of
sustainable fisheries (Higgins et al. 2008, Vandeperre et al. 2008, Fraschetti et al. 2011). They
may represent refuge and recovery areas for decreasing fish stocks where classic fisheries
management methods are insufficient (Russ 2002, Higgins et al. 2008, Vandeperre et al. 2011).
In this context, marine reserves (MRs), areas completely set aside from fishing (‘no-take’ area),
are the most strict management strategy that may benefit fisheries and conservation
simultaneously (Roberts et al. 2005, Possingham et al. 2006, Gaines et al. 2010). Scientific
challenges for reserve design still remain, such as knowledge gaps in larval connectivity and
movement patterns of target species or rigorous demonstrations of long-term spillover (Sale et
al. 2005, Agardy et al. 2011, Fenberg et al. 2012). Yet, they offer one of the best approaches to
hedge against heavy fishing pressure and to ensure maintenance or even a future increase of
catches (reviewed in Gell & Roberts 2003).
Fish densities and average individual size are expected to increase inside the reserve
boundaries (“reserve effect”) (Fogarty 1999, Lester et al. 2009, Costa et al. 2013). These core
areas function as centre of dispersal for both larvae and adults (Russ 2002, Harrison et al.
2012). The migration of adult fish into adjacent, non-protected areas is an elementary process

Chapter 1
6
to support fisheries (“spillover effect”) (Gell & Roberts 2003, Halpern & Warner 2003,
Fraschetti et al. 2011). Additionally, the net export of larvae and eggs can enhance the supply
of recruits to fished areas (“recruitment effect”) (Russ 2002, Roberts et al. 2005, Harrison et al.
2012). The spillover and recruitment effect are supposed to compensate for the loss in access
to fishing area (Russ 2002). Halpern (2003) reviewed 89 studies about the impact of MRs and
concluded that, overall, density, biomass, individual size, and diversity in all analysed
functional groups increased inside the reserve.
Different species often have different habitat requirements, thus a single MPA or MR may not
be of optimal design and equal benefit for all target species (Kramer & Chapman 1999, Sale et
al. 2005). As consequence, a multi-species approach for the definition of the most favourable
MPA design is strongly advisable (e.g. Possingham et al. 2000, Claudet et al. 2010, White et al.
2010).
Size and connectivity of marine protected area networks
Similar to other research methods and scientific models in marine science, many aspects of
marine conservation planning were adopted from terrestrial research (e.g. Carr et al. 2003,
Wedding et al. 2011). There has been much debate whether to give preference to a single
large or several small reserves (`SLOSS debate´). Early researchers argued that a single large
reserve is generally better to preserve more and larger populations than an equal area divided
into several small reserves (Diamond 1975, Wilson & Willis 1975). From a conservational point
of view, increasing the size of reserves, including a high area to edge ratio, is favourable
(Kramer & Chapman 1999, Possingham et al. 2006) but this may cause more conflicts than
benefits if it is opposed to the interest of involved stakeholders, like local fishermen (e.g.
Fenberg et al. 2012). Halpern (2003) showed that although relative impacts of MRs may be
independent of their size (e.g. equal proportional difference in biological measures between
small and large reserves), larger reserves do show greater absolute differences. Similarly, the
density of commercial fishes inside reserves increased with increasing size of the no-take zone
across European MRs (Claudet et al. 2008). In general, benefits for fisheries are highest when a
reserve is large enough to export sufficient larvae and adults, and small enough to minimise
the economic impacts for fishermen (Possingham et al. 2006). However, a network of several
reserves with ecological coherence (covering 20 % -50 % of the total managed area) that vary
in size and spacing (Halpern & Warner 2003) can be more beneficial than a single large reserve
General introduction
7
(Roberts & Hawkins 2000, Gaines et al. 2010). Such networks also enable to achieve
conservation goals on a large spatial scale (Gaines et al. 2010, McCook et al. 2010).
The connectivity between the different spatial sites in a network describes the success or
extent to which different populations are linked by exchange of larvae (passive dispersal) or
adults (active migration) (Palumbi 2003). It is influenced by the mobility of specimens, larval
dispersal distances, reserve size, and local morphological and oceanographic conditions (e.g.
Kramer & Chapman 1999, Roberts et al. 2003b, Meyer et al. 2010). For example, reserves have
to be adequately connected to supply and receive larvae from each other or they must be self
sustaining (self-seeding) to be effective (Hastings & Botsford 2003, Roberts et al. 2003b,
Gaines et al. 2010).
Priority sites for conservation
Marine fishes express a multitude of life history traits (growth rate, size at maturity, parental
investment), habitat requirements (benthos, pelagial) and trophic levels (carnivorous,
herbivorous, omnivorous) that even may change throughout ontogeny (e.g. Russ 2002, Afonso
et al. 2008b, Claudet et al. 2010). In this regard, the identification of habitats that are
important for the survival of a species or a certain ontogenetic stage, especially under fishing
pressure, is increasingly demanded by (fishery) biologists and governments (Roberts et al.
2003b).
The term ‘essential fish habitat’ (EFH) was first defined in 1996 by the Magnuson-Stevens
Fishery Conservation and Management Act of the United States as “those waters and
substrates necessary to fish for spawning, breeding, feeding or growth to maturity”
(Sustainable Fisheries Act of 1996, Public Law 104-267). According to the EFH guidelines
“‘Waters’ include aquatic areas and their associated physical, chemical, and biological
properties that are used by fish, and may include areas historically used by fish where
appropriate. ‘Substrate’ includes sediment, hard bottom, structures underlying the waters,
and associated biological communities. ‘Necessary’ means the habitat required to support a
sustainable fishery and the managed species contribution to a healthy ecosystem. ‘Spawning,
breeding, feeding, or growth to maturity’ covers the full life cycle of a species” (Code of
Federal Regulations - Title 50: Wildlife and Fisheries, 50 CFR 600.10). Inside the European
Union EFH has been defined as “a habitat identified as essential to the ecological and biological
requirements for critical life history stages of exploited fish species, and which may require

Chapter 1
8
special protection to improve stock status and long term sustainability’’ by the Scientific,
Technical and Economic Committee for Fisheries for the Mediterranean (STECF 2006).
Examples for EFHs include spawning sites, feeding grounds, nursery areas and migration
corridors (Sala et al. 2003, Appeldoorn et al. 2009, Baillon et al. 2012). The geographical and
temporal identification of EFHs for certain life stages of commercial important fish is crucial for
managing fisheries of those stocks (Afonso et al. 2008b,d Bellido et al. 2008, Compton et al.
2012). Including EFHs in MPA networks will improve their spatial management and their
effectiveness (Roberts et al. 2003b). For instance, protection of spawning sites or habitats of
mature specimens, especially older and larger individuals that generally produce more eggs
and more persistent larvae (Berkeley et al. 2004), will support larval export and in turn can
benefit fisheries (Birkeland & Dayton 2005, Pelc et al. 2010). Tools such as predictive modelling
are used for identifying favourable and less favourable environmental conditions, and as such
EFHs, for single and multi-species or different life stages (Bellido et al. 2008, Compton et al.
2012).
1.2 Statistical predictive modelling
The interest in processes that control species distribution patterns reaches far back in the 20th
century with first computer-based models being developed in the 1970s (reviewed in Guisan &
Thuiller 2005). Nowadays, such species distribution models (SDMs) are widely used and much
facilitated by improved techniques, including a growing number of modelling tools, improved
algorithms and increasing capabilities of geographic information systems (GIS) (e.g. Wood
2004, Guisan & Thuiller 2005, Swenson 2008). Furthermore, progressively advancing remote
sensing techniques, computing power and dissemination of information (e.g. Mumby et al.
2004, Pittman et al. 2009) increase the precision of SDMs and predictive modelling techniques
that are used to define species-environment relationships and to project results into non-
surveyed areas (Guisan & Zimmermann 2000, Huettmann & Diamond 2001, Hirzel & Le Lay
2008).
Regression techniques that relate response variables to a combination of explanatory variables
(environmental information) via a link function (McCullagh & Nelder 1989, Hastie & Tibshirani
1990) are well-established in marine science (e.g. Maravelias & Reid 1997, Beger &
Possingham 2008, Liu et al. 2011). Complex non-linear relationships that typically occur in
ecological data are, for instance, modelled with generalised additive models (GAMs) that are a
General introduction
9
more flexible expansion of generalised linear models (GLMs) and use non-parametric
smoothers instead of linear combinations of explanatory variables (e.g. Hastie & Tibshirani
1986, Murase et al. 2009).
Species modelling requires a thorough data exploration, the definition of an appropriate model
and systematic validation (e.g. Guisan & Zimmermann 2000, Zuur et al. 2009, 2010) to produce
unbiased parameter estimates and, consequently, allow correct ecological inferences (e.g.
Bolker et al. 2008, Zuur et al. 2010). Model results can be visualised spatially, for instance in a
GIS, and habitat suitability maps can be established where EFHs are identified (e.g. Pittman et
al. 2007b, Bellido et al. 2008, Lauria et al. 2011). Such illustrative and clear represented
information can then be integrated in marine spatial planning and management activities.
Maps provide increased capabilities for stakeholders and decision makers to perceive distinct
spatial planning alternatives and support decision-making processes and, as such, can support
the communication in marine management discussions that aim to evaluate a MPA network
and require scientific support for upcoming decisions.
Comparable studies that apply predictive modelling in support of marine management were
conducted in coastal environments on continental shelves (e.g. Cañadas et al. 2005, Bellido et
al. 2008, Mellin et al. 2010, Arias-González et al. 2012) but only a few consider oceanic
archipelagos and, in that case, typically tropical islands (e.g. Pittman et al. 2007b, Knudby et al.
2011, Pittman & Brown 2011). Thus, results of this thesis will not only support to the regional
assessment of the performance of existing MPAs but also contribute to the general knowledge
of isolated, oceanic, volcanic island coastal ecosystems. A detailed introduction and
description of the modelling techniques applied in this thesis is given in chapter 2.
1.3 The marine ecosystem of the Azores archipelago
The Azores are the most recent, extensive and isolated archipelago of volcanic origin in the
Northeast Atlantic (36 - 40º N, 24 - 32º W). The nine islands, divided into three groups, spread
across approximately 600 km at a triple junction between the American, Eurasian and African
lithospheric plate. They lie about 1300 km eastwards to the nearest point of the European
continent and around 2000 km westwards from the coast of Newfoundland, Canada and are
the northwestern-most island group of the Macaronesia region (including also Madeira,
Selvagens, Cape Verde, and Canary Islands). The Economic Exclusion Zone (EEZ) of the Azores
comprises almost one million km2 of which only 8 % are above 1500 m depth and only 0.4 %
Chapter 1
10
(including islands) are shallower than 500 m (Isidro 1996). Coastal habitats are limited, instead
steep slopes and narrow platforms are typically present around the islands and deep waters
dominate. The seafloor inside the EEZ is characterised by irregular, mainly rocky bottom with
underwater canyons and small islets, and a total of 63 large and 398 small seamount-like
features are identified (Morato et al. 2008).
The islands are situated in an oceanic convergence zone and exhibit a complex system of
currents, including local eddies and surface circulations that are related to topographical
features and show seasonal/decadal changes and episodic anomalies (Santos et al. 1995, Le
Traon & Morrow 2001, Reverdin et al. 2003). Two branches of the Gulf Stream dominate the
large-scale circulation in the Azores: the cold North Atlantic Current in the north and the warm
Azores Current in the south (Santos et al. 1995, Reverdin et al. 2003). In general, the region is
characterised by a high salinity, high temperature (water temperatures vary between 24 ºC in
summer and 15 ºC in winter, Bashmachnikov et al. 2004) and low nutrient regime (Santos et al.
1995). Tides are rather modest and typically between 0.5 m and 1.5 m (springtide) (Instituto
Hidrográfico 2007, Sebastião et al. 2008). Exposure to hydrologic forces varies substantially
along the coast with large sections being exposed to the full force of prevailing winds and
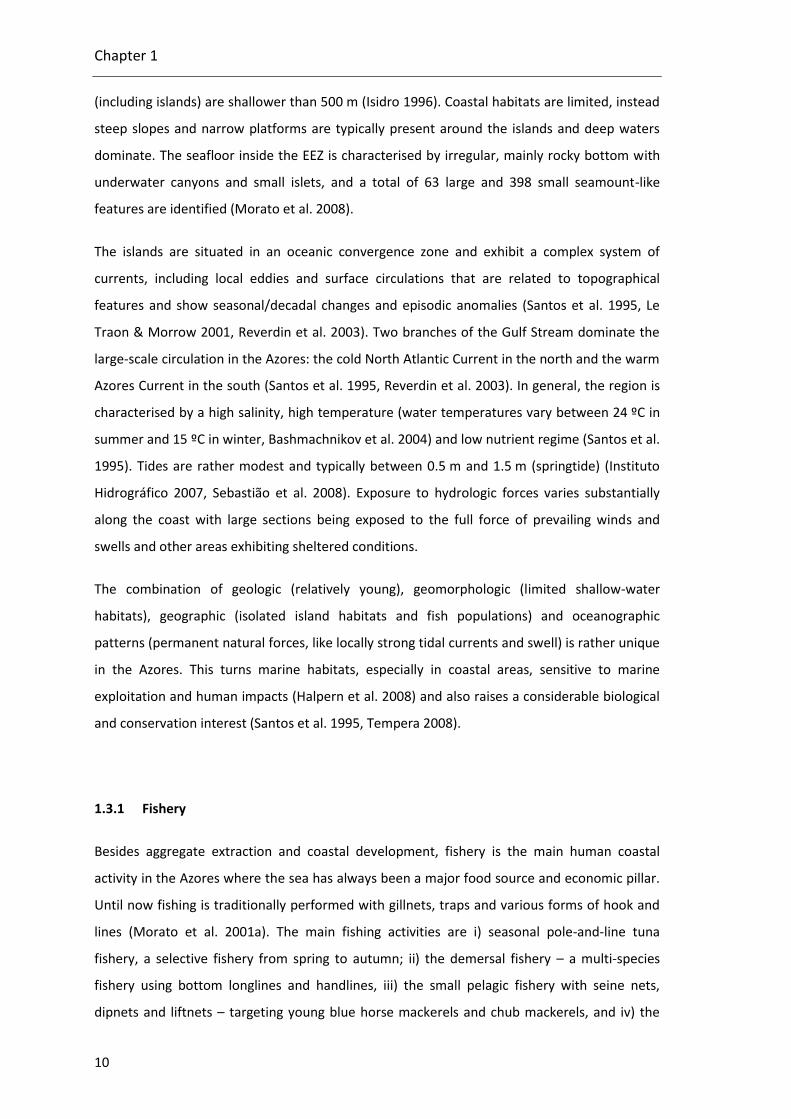
swells and other areas exhibiting sheltered conditions.
The combination of geologic (relatively young), geomorphologic (limited shallow-water
habitats), geographic (isolated island habitats and fish populations) and oceanographic
patterns (permanent natural forces, like locally strong tidal currents and swell) is rather unique
in the Azores. This turns marine habitats, especially in coastal areas, sensitive to marine
exploitation and human impacts (Halpern et al. 2008) and also raises a considerable biological
and conservation interest (Santos et al. 1995, Tempera 2008).
1.3.1 Fishery
Besides aggregate extraction and coastal development, fishery is the main human coastal
activity in the Azores where the sea has always been a major food source and economic pillar.
Until now fishing is traditionally performed with gillnets, traps and various forms of hook and
lines (Morato et al. 2001a). The main fishing activities are i) seasonal pole-and-line tuna
fishery, a selective fishery from spring to autumn; ii) the demersal fishery – a multi-species
fishery using bottom longlines and handlines, iii) the small pelagic fishery with seine nets,
dipnets and liftnets – targeting young blue horse mackerels and chub mackerels, and iv) the

General introduction
11
swordfish fishery using surface longlines (Santos et al. 1995, Morato et al. 2001a, Carvalho et
al. 2011a, Pham et al. 2013). The Azorean fleet is mainly composed of i) artisanal open deck
vessels with less than 12 m, ii) artisanal closed deck vessels with a less than 18 m, and iii)
vessels between 18 m and 30 m (Pinho & Menezes 2006 and references therein). In
comparison to the large scale fishery, the Azorean small scale fishery (artisanal fishery with
vessels up to 12 m length) has more landings and higher landed values, employs more
fishermen, needs less fuel, and appears to have less discards (Carvalho et al. 2011a).
There are several restrictions in place to control fishery effort and for conservational aspects.
For instance, depending on the size and type of the fishing vessel and the fishing gear certain
minimum and maximum distances to the coast have to be respected (Decreto Legislativo
Regional (DLR) no. 31/2012/A, Portaria - S.R. do Ambiente e do Mar - no. 50/2012). Bottom
trawling and similar towed nets touching the sea bottom are banned by EU regulations
(Council Regulation (EC) no. 1811/2004) in addition to the prohibited use of any demersal
fishing gear in a large part of the Azorean EEZ (Council Regulation (EC) no. 1568/2005). In
defined seasons it is prohibited to catch certain species, including limpets (Patella spp., 1st
October to 31st May), slipper lobster (Scyllarides latus, 1st of May to 31st of August), spiny
lobster (Palinurus elephas) and spider crab (Maja brachydactyla, 1st October to 31st March) and
(DLR no. 15/2012/A). Additionally, there are minimum legal catch sizes for these species and
various fishes (Portaria – S. de Estado das Pescas - no. 27/2001, DLR no. 15/2012/A).
Recreational fisheries have to respect certain restrictions, including bag limits (10 fish and 2
crustaceans per spearfisher and day, DLR no. 9/2007/A) and are not allowed to sell the catch.
Studies show that the impact of recreational fishery and spear-gun fishing is not negligible and
corresponds to approximately one third of the captures of commercial artisanal fishing along
the coast of Pico and Faial (Diogo 2007) and thus needs to be managed as well (Frisch et al.
2012). In 1998, the official Azores Fisheries Observer Programme was initiated to monitor tuna
fisheries and was later extended to other fisheries (Machete & Santos 2007).
Additional fishery management plans include the implementation of MPAs orMRs where
fishery is either completely prohibited or underlies certain restrictions. Such management
strategies are introduced in the following subsection. Since 2003 the outer 100 Nautical Miles
of the EEZ are open to the entire EU fisheries fleet, including deep-water fishery (Probert et al.
2007, Council Regulation (EC) no. 1954/2003). This permitted the use of trawling nets around
the Azores until November 2004 (Council Regulation (EC) no. 1811/2004) and seine nets until
September 2005 (Council Regulation (EC) no. 1568/2005).

Chapter 1
12
1.3.2 Marine conservation in the Azores
The first MRs in the Azores were created in 1988, the “Caldeirinhas reserve” in Faial Island
(part of the “Monte da Guia protected area”) and the “Formigas reserve” off Santa Maria
Island (Santos et al. 1995). Since then, marine conservation has received growing attention in
the archipelago and during the last two decades several protected sites were designated under
different classifications schemes ranging from regional, national to international legislation
(e.g. Azores Network of Protected Areas, Special Areas of Conservation (SACs) in the
framework of the NATURA2000 network, OSPAR MPAs, and Biosphere reserves). Recently
(2008-2011), all marine sites within territorial waters (<12 nautical miles) were included (or
expanded) into the so called “Island Natural Parks” (INPs, “Parques Naturais da Ilha”) that also
include terrestrial sites and follow the classification of the International Union for
Conservation of Nature (IUCN) (Figure 1.1). Today each island has one INP that either
encompasses the entire marine area surrounding the island (i.e. Corvo Island) or has a network
with several sites (e.g. Faial Island, Figure 1.1).
Figure 1.1: Areas protected by the ‘Island Natural Parks’ (red squares) of each island in the Azores archipelago. Note that the three island groups are not on the same scale and only in relative position to each other.
Individual sites inside each INP can have different regulations regarding, for instance, fisheries,
resource extraction and other activities (Figure 1.2). Only four sites of the INPs can be
considered as marine reserve or highly restrictive areas (IUCN category Ia/Ib) with the
Caldeirinhas reserve in Faial Island (8 ha) being the only ‘no-take’ zone where all fishing
activities are banned. Other MRs, for example the Formigas reserve that was revised in 2003
and only then became a ‘quasi’ reserve, allow for regulated operations of the commercial tuna
fishing fleet. In addition to the INPs, other small ‘no-take’ zones were declared for
archaeological reasons, for example in Terceira (Decreto Regulamentar Regional (DRR) no.
20/2005/A) and São Miguel Island (DRR no. 12/2012/A). A small voluntary no-take reserve, the
General introduction
13
‘Caneiro dos Meros MR’ (“Groupers’ Alley”) was established in 1999 by the population of
Corvo Island and is complied until today. This community-based reserve shows several key
elements for effective MPA establishment (Abecasis RC et al. 2013a). Another example for
stakeholder-driven protection is the Condor seamount, close to Faial Island, that is closed for
commercial bottom fisheries since 2010 for the purpose of scientific investigations (Portaria -
S.R. do Ambiente e do Mar - no 47/2012). Four small areas in Santa Maria were added to this
list in 2012 because of their importance for non extractive, recreational marine activities,
namely diving, and fishing is forbidden until the end of 2014 (Portaria - S.R. do Ambiente e do
Mar - no. 62/2012). All offshore MPAs outside the territorial sea, for instance several
seamounts and hydrothermal vent fields, are included in the Azorean Marine Park that follows
regional law and (inter-) national legislation (IUCN, OSPAR, Calado et al. 2011). In summary,
the regional framework for biodiversity protection (DLR 15/2012/A) includes 44 MPAs that
cover over 10,000 km² (1.12 %) of the Azorean EEZ, and more than 100,000 km2 outside the
EEZ (Abecasis et al. unpublished). The eight mentioned reserves for archaeological, touristic or
science purposes complete that list.
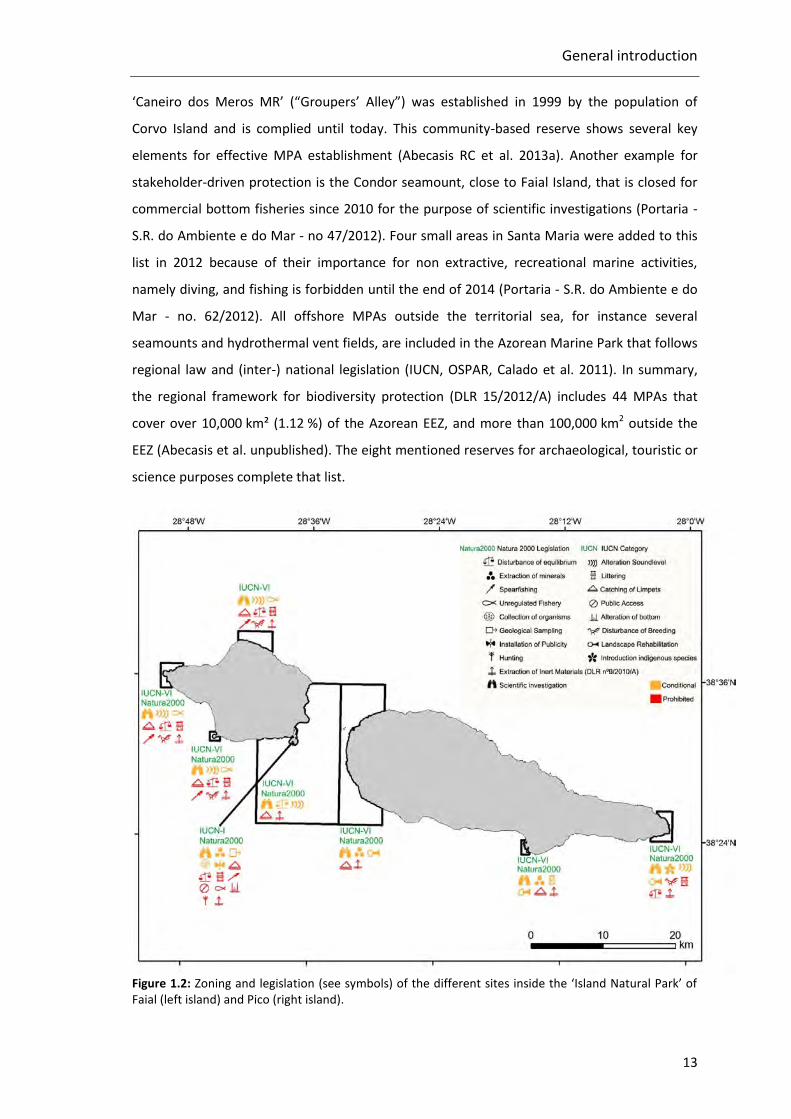
Figure 1.2: Zoning and legislation (see symbols) of the different sites inside the ‘Island Natural Park’ of Faial (left island) and Pico (right island).

Chapter 1
14
Despite this impressive list and variety of MPAs, there are weaknesses of the Azorean MPA
design, including an EEZ coverage of much less than the 10 % goal of the Aichi Biodiversity
Targets (Convention on Biological Diversity 2010), very small and few no-take areas, the
absence of management plans, few resources for enforcement and monitoring, and weak
community involvement and information (Abecasis et al. unpublished data). A recent
evaluation of the performance of the Caldeirinhas, Formigas and Caneiro dos Meros MRs did
not show any apparent positive effect of protection level or reserve age on abundance or size
of commercially fishes (Afonso et al. unpublished data). In this study, species were grouped
according to a set of ecological traits, including home range, yearly displacement, maximum
adult size, and habitat type. Traits were analysed separately and only species with lower
mobility showed some signs for the efficacy of protection, such as cryptic species or those with
small home ranges. These traits had increasing abundances or sizes inside the reserves in
comparison to adjacent areas and/or with proceeding age of the reserves. Results support the
theory that even small reserves, like the Caldeirinhas MR, can offer potential benefits for
species with high site-fidelity (Afonso et al. 2011). Contrarily, species with high mobility
showed no clear trend and had oscillating or diminishing abundances in the three MRs (Afonso
et al. unpublished data). This dependency of the reserve effect on species’ ecological traits,
particularly those that relate to patterns of habitat use, was also shown in other studies (e.g.
Claudet et al. 2010).
On the other hand, the regional assessment suggests that the Azorean MPA network does not
perform optimally and thus, would benefit from an enhanced design to efficiently protect a
variety of species. Possible improvements include but are not limited to i) adequate zoning
schemes that, for instance, include larger no-take zones that are appropriate for multiple
species (e.g. Kramer Chapman 1999, Halpern & Warner 2003), ii) raised public awareness and
understanding of the MPAs and their regulations (e.g. Salm et al. 2000, Rodríguez-Martínez
2008, Abecasis RC et al. 2013b), iii) more rigorous enforcement and compliance (e.g. Byers &
Noonburg 2007, McCook et al. 2010), and iv) implementation of an adaptive management
approach as applied successfully, for example, in the Great Barrier Reef, Australia (McCook et
al. 2010). The latter involves active learning, planning and evaluation of socio-economic-
ecological processes (Grafton & Kompas 2005) whereby MPA goals, zoning and legislation may
change over time. In the Azores, such an approach could, for instance, include more technical
knowledge (Abecasis et al. unpublished data) as delivered by this thesis.

General introduction
15
1.3.3 Study site
Coastal habitats down to 40 m depth were studied in Faial and West-Pico that belong to the
central island group of the Azores, including the “Faial-Pico channel”, an 8 km-wide passage
between the islands (Figure 1.3). Contrarily to the deep waters that normally separate islands,
the channel has a maximum depth of about 200 m, with most parts lying even above 100 m
(Tempera 2008, Tempera et al. 2012). On the north and south side it drops abruptly to depths
of more than 700 m. There are three offshore reefs inside the channel (from northernmost to
southernmost location: “Baixa da Barca”, “Baixa do Norte”, “Baixa do Sul”) of which Baixa do
Sul is the largest with a minimum depth of 8 m. Baixa da Barca is the only reef with steep walls
and the deepest with the highest point in 25 m. More than half of the study area is mapped
hard bottom (33.62 km² out of 56.74 km², see also Figure 2.1 in chapter 2, Tempera 2008,
Tempera et al. 2012). The marine environment of Faial and Pico Islands is quite similar,
exhibiting a wide range of environmental conditions that enable a variety of different habitats
in the study area: i) seafloor characteristics diverge between sandy floors and bedrocks,
boulder fields, caves, shallow banks, cliffs and canyons; ii) surface hydrodynamic events
(exposure to waves and swell) alter from a typically highly exposed coast to more sheltered
bays; and iii) oceanographic forces generate areas with high exposure to currents (Tempera
2008, Tempera et al. 2012, Quartau et al. 2012). Faial and Pico are of great relevance for
nature conservation and different marine conservation classifications schemes have been
applied. An INP was established under regional law for each island in 2008 (DLR no. 20/2008/A
and 46/2008/A). 256.08 km2 of Faial’s coast and the neighbouring channel to Pico are covered
by the INPs of the study area. These INPs integrate previously declared protected areas,
including i) five Special Areas of Conservation (SACs) that are part of the NATURA2000 network
of the European Union, ii) the marine no-take reserve ‘Caldeirinhas’, a sunken crater of the
Monte da Guia volcano in the southeast of Faial, and iii) five harvest refuges for limpets. The
combined area of both INPs that lies inside the Faial-Pico channel is also classified under the
OSPAR Convention MPA network.

Chapter 1
16
Figure 1.3: Map of the study area that encompasses shallow habitats down to 40 m around Faial and Pico Islands in the Azores archipelago. Boundaries of the existing marine protected area network (black lines), bathymetry and mapped hard bottom (light brown shaded areas) down to 200 m depth (adapted from Tempera 2008) are shown.
The entire study area has an excellent accessibility from the facilities of the Department of
Oceanography & Fisheries/University of the Azores and a good database for geomorphologic,
oceanographic and biological data exists (e.g. Santos et al. 1995, Tempera 2008, Tempera et al.
2012). Studied shallow coastal areas are essential for certain life stages of many fish species
(e.g. Santos & Nash 1995, Nash & Santos 1998, Afonso et al. 2008a,c, Fontes et al. 2009) and
this thesis aims to fill knowledge gaps in their habitat use and distribution.

General introduction
17
1.4 Research objectives
Marine research has delivered a multitude of biological, geomorphological and oceanographic
data for the Azores, but there are still gaps in knowledge of how these factors interact and
how they could be combined to support the local marine management. This thesis integrates
spatial predictive modelling techniques, GIS analyses, and systematic conservation planning
software to: 1) quantify the spatial habitat use of coastal reef fish assemblages, 2) identify
species-specific and multi-species essential fish habitats, 3) critically analyse MPA design, and
4) divulge the best available scientific knowledge in the context of marine spatial management
(Figure 1.4). Results are believed to enhance adaptive management strategies in the area. The
existing marine zoning scheme is evaluated and suggestions for an ecologically coherent MPA
network are presented under the consideration of a multitude of ecological, biological,
environmental and socio-economic factors. The following specific objectives are addressed:
Assess the relationship between abundance, spawning biomass, potential
fecundity, biodiversity, and vulnerability to fishing of rocky reef fishes and
environmental characteristics via the establishment of sound statistical
models.
Predict and map the modelled reef fish variables in two Azorean islands.
Identify single- and multi-species “hotspots” of each biological variable.
Evaluate the representativeness of conservation hotspots within the existing
zoning scheme in the study area.
Analyse alternatives of marine spatial planning, considering different
conservation targets and objectives.
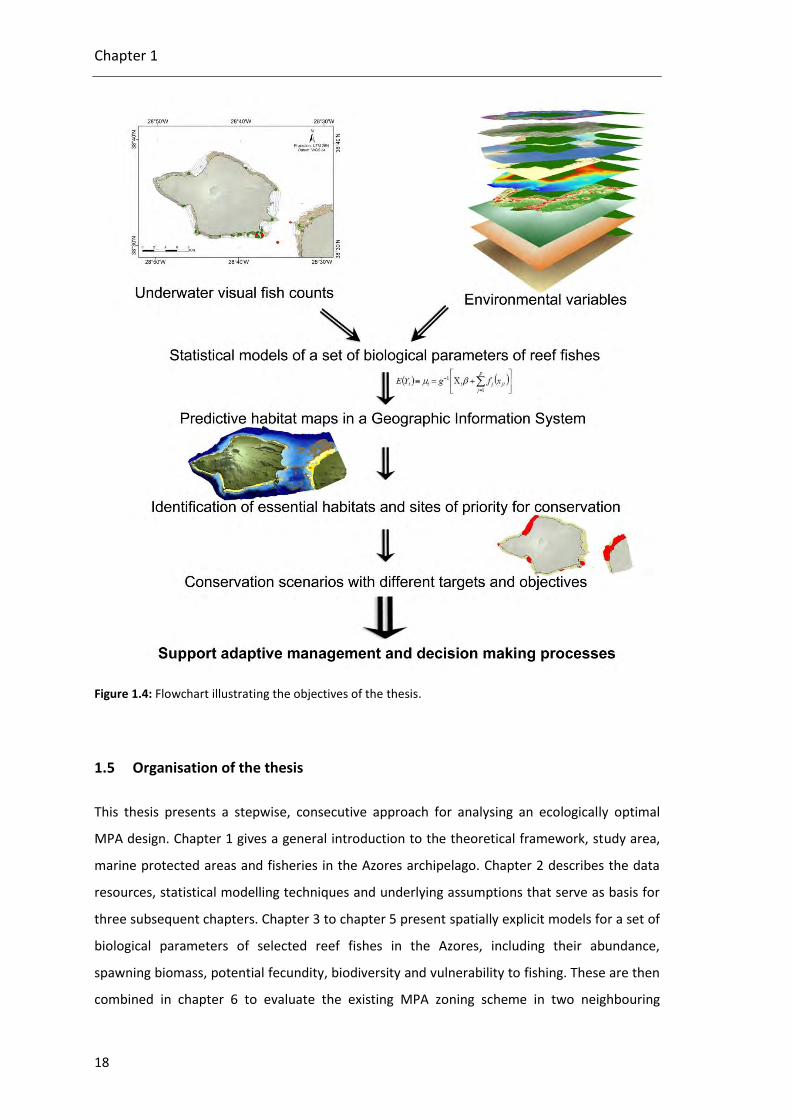
Chapter 1
18
Figure 1.4: Flowchart illustrating the objectives of the thesis.
1.5 Organisation of the thesis
This thesis presents a stepwise, consecutive approach for analysing an ecologically optimal
MPA design. Chapter 1 gives a general introduction to the theoretical framework, study area,
marine protected areas and fisheries in the Azores archipelago. Chapter 2 describes the data
resources, statistical modelling techniques and underlying assumptions that serve as basis for
three subsequent chapters. Chapter 3 to chapter 5 present spatially explicit models for a set of
biological parameters of selected reef fishes in the Azores, including their abundance,
spawning biomass, potential fecundity, biodiversity and vulnerability to fishing. These are then
combined in chapter 6 to evaluate the existing MPA zoning scheme in two neighbouring
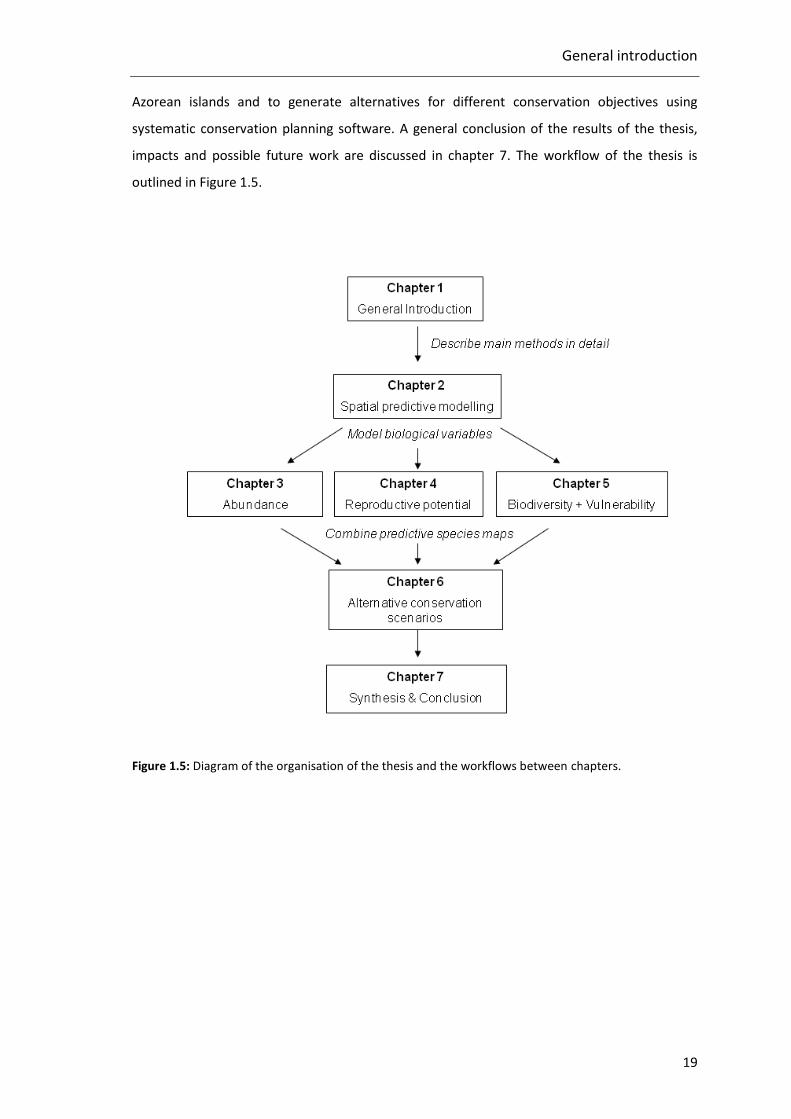
General introduction
19
Azorean islands and to generate alternatives for different conservation objectives using
systematic conservation planning software. A general conclusion of the results of the thesis,
impacts and possible future work are discussed in chapter 7. The workflow of the thesis is
outlined in Figure 1.5.
Figure 1.5: Diagram of the organisation of the thesis and the workflows between chapters.