Embed Size (px)
Citation preview

i
UNIVERSAL SECONDARY EDUCATION (USE) IN GUYANA June 2008 P
ublic
Dis
clos
ure
Aut
horiz
edP
ublic
Dis
clos
ure
Aut
horiz
edP
ublic
Dis
clos
ure
Aut
horiz
edP
ublic
Dis
clos
ure
Aut
horiz
edP
ublic
Dis
clos
ure
Aut
horiz
edP
ublic
Dis
clos
ure
Aut
horiz
edP
ublic
Dis
clos
ure
Aut
horiz
edP
ublic
Dis
clos
ure
Aut
horiz
ed

Revision 23 July 2008
/ii
Acknowledgements This Review could not have been completed without the assistance, guidance and insights provided by Mrs Evelyn Hamilton, Chief Planning Officer, Ministry of Education, and the staff of the Planning Unit during fieldwork in Guyana in November-December 2007. Assistance provided by Joy Duff-Alleyene in the World Bank Office in Georgetown is also acknowledged. Any errors in interpretation of the information and Ministry data are the author’s, but hopefully the insights and presentation of the data are more useful than any errors.
Currency: This Review uses Guyanese Dollars (G$). Approximate exchange rate in November/December 2007 was US$1=G$200.
Aggregation of Regional Data: To focus discussion of enrollment and other patterns, this Review aggregates regional data in three groups. There are marked variations across all regions. Data for individual regions are included in Attachments.
R1789 R1,R7,R8,R9 Hinterland and Riverine Regions R2560 R2,R5,R6,R10 Coastal Rural Regions R3411 R3,R4,R11 Coastal Urban Regions (Georgetown and adjacent areas)
Data for Georgetown is sometimes included in Region 4 (such as NCERD data prior to 2007), as a subset of Region 4, and education expenditure reported under the Ministry. Some Ministry reports refer to Georgetown as “Region 11”. This Review uses “Region 11”. Data sets: Major data sets used during this review were the Annual Statistical Digests, especially 2004/05 and the unpublished 2005/06 Digest. The Planning Department provided individual school data for some 350 secondary schools (including 242 Primary Tops), a teacher data set containing age, gender, qualification, trained status, and position for some 3,400 “Secondary” teachers, plus a table with individual school data on monthly attendance in 2004/05. Student examination data for the Secondary Schools Entrance Examination (SSEE) and the Caribbean Examinations Commission (CXC) were from reports published by the National Center for Educational Resources and Development (NCERD). Financial data by region was from MOF FreeBalance Financial Management System reports. Questions about calculations and methods used to manipulate Guyana data in MS Access, including more detailed reports and the structured query language (SQL) used to generate reports, plus any spreadsheets using data are available from the author [email protected] .

Revision 23 July 2008
/iii
The Iwokrama map is one of the simplest published maps of Guyana showing Regions 1-10 and Georgetown. It could be improved by showing Venezuela, Brazil and Surinam, plus the Atlantic Ocean. Region 6 may be misleading – it has a large hinterland area but the population is concentrated towards the Atlantic coast.

Revision 23 July 2008
/iv
Abbreviations
BEAMS Basic Education and Management Strengthening Project CHS Community High Schools CSEC Caribbean Secondary Education Examination CXC Caribbean Examinations Commission DfID UK Department for International Development EFA Education for All (MDG) FTI Fast Track Initiative (EFA) GBET Guyana Basic Education Teacher Training Project GDP Gross Domestic Product GEAP Guyana Education Access Project GER Gross Enrollment Rate G$ Guyana Dollar GSS General Secondary Schools IADB InterAmerican Development Bank MDG Millennium Development Goals MOE Ministry of Education NCERD National Center for Educational Resource Development NER Net Enrollment Rate PTop Primary Top (Secondary classes in a Primary School) SSEE Secondary Schools Entrance Examination SSRP Secondary Schools Rehabilitation Project SIP School Improvement Plan UPE Universal Primary Education USE Universal Secondary Education WB World Bank

Revision 23 July 2008
/v
Table of Contents EXECUTIVE SUMMARY.............................................................................................vii
I. Context for a Review of USE..............................................................................vii II. Organization of this Report............................................................................vii III. Key Findings ..................................................................................................... ix
IV. Guyana USE Scenarios ................................................................................xi V. Recommendations ...............................................................................................xii
Chapter 1: Current Status of Secondary Education in Guyana................................... 1
Four Strategic Options for USE 2008-2012 ................................................................ 2 Trends in Secondary Enrollment................................................................................. 3 Creating Viable Secondary Schools............................................................................. 6
Chapter 2: Improving Access, Participation and Attendance ................................... 12
USE Strategy and Recommendations........................................................................ 23 Chapter 3: Upgrading and Qualifying Teachers.......................................................... 25
Staffing Small Secondary Schools.............................................................................. 27 Staffing Schools with Trained/Qualified Teachers .................................................. 30 Staffing is a Size of School Issue ................................................................................ 38
Chapter 4: Improving Student Learning Outcomes.................................................... 41
Grade 6 Examination Outcomes................................................................................ 41 Transition from Grade 6 to Grade 7 ......................................................................... 45 Student attendance...................................................................................................... 46 Grade 7 to Grade 11 Progression............................................................................... 50 CXC Examination outcomes ...................................................................................... 51 Comparisons between Guyana and Other CXC Countries .................................... 57 Summary of Challenges to Secondary Student Outcomes ...................................... 58 Recommendations for further action ........................................................................ 59
Chapter 5: Schools and Infrastructure ......................................................................... 60 Chapter 6 Secondary Education Resources and Budgets...................................... 67
I. Measuring Education Shares of Budget and Gross Domestic Product ....... 67 II. Using Existing Education Budgets more Efficiently.................................... 69 III. Whole School Plans and Budgets .................................................................... 76 Summary and Recommendations.............................................................................. 77
Chapter 7: GUYANA USE 2008-2012.......................................................................... 78
Three Scenarios ........................................................................................................... 79 Demand for Secondary Education:............................................................................ 81 Secondary Recurrent Expenditure “Gap”................................................................ 84 Sensitivity Analysis...................................................................................................... 84 Five Risks ..................................................................................................................... 85

Revision 23 July 2008
/vi
ATTACHMENTS ........................................................................................................... 87 Attachment A1: Terms of Reference for Consultancy ............................................ 87 Attachment A2: References.................................................................................... 90 Attachment B: Core Issues for MOE Discussion 13 December 2007................... 91 Attachment C: Briefing Note on USE Review for meeting with Minister 19 December 2007............................................................................................................. 93 Attachment D1: Summary of Guyana Performance on 15 Measures................... 95 Attachment D2: Primary Completion using Grade 6 2005/06 Enrollment as percentage Grade 1 Enrollment in 2000/01 .............................................................. 97 Attachment D3: Secondary Enrollment as percent Primary Enrollment, 2004/05....................................................................................................................................... 98 Attachment D4: Staffing and School Size ............................................................... 101 Attachment D5: Student Attendance ..................................................................... 103
Attachment D6A: School Age Population Profile 2004/05 by Region and Gender......................................................................................................................................... 106
..................................................................................................................................... 108 Attachment D7: SSEE Examination Results by Region, 2001/02-2006/07 ...... 110
Attachment E: Projected Demand and Supply of Teachers ................................ 113 Attachment F: Teachers by Status and by Region................................................ 121 Attachment G: Education Finance .......................................................................... 125 Attachment H: Summary of ODA Project Assistance.......................................... 133 Attachment J: Summary of Baseline, Medium and High Outcomes Scenarios. 134

Revision 23 July 2008
/vii
UNIVERSAL SECONDARY EDUCATION (USE) IN GUYANA EXECUTIVE SUMMARY I. Context for a Review of USE
In 2002, Guyana adopted a broadly-based five year plan (2003-2007) to achieve universal secondary education, with a strategy to convert secondary classes in primary schools and grade 7-10 community high schools into General Secondary Schools (GSS) in which all students could present for the Caribbean Examination Certificate (CXC) or an alternative competency-based Certificate. Guyana had received extensive inputs from the Secondary Schools Rehabilitation Project (SSRP), the Guyana Education Access Project (GEAP), and the Basic Education and Management Strengthening Project (BEAMS), but achievements in 2007 remained well short of the 2002 objective. At the beginning of November 2007, the World Bank commissioned a review1 of all relevant documentation on Universal Secondary Education (USE) in Guyana, critical analysis of policies and proposed plans for achieving secondary education goals, development of a simulation model to estimate the costs of the major alternative policy options and to provide recommendations to Government for the finalization of the secondary education policy for Guyana. Costing secondary education policy options required answers to questions about the 2003-2007 USE Strategy and the identification of the issues which the Government should consider in formulating a sector strategy which supports its broader poverty reduction strategy. The development of alternative scenarios with which Government could test policy options was complicated by the lack of a comprehensive education sector review. In a system where Ministry officials and the Minister have detailed knowledge about each of the 106 GSS and CHS (and 244 “primary” tops), Guyana required a more generalized analysis of the structural problems confronting its education system. II. Organization of this Report
Current Status of Secondary Education (Chapter 1) summarizes the performance of public schools in Guyana against the MOE Policy on Universal Secondary Education (2002), trends evident in the annual Statistical Digests, and the broad issues presented to Senior MOE officers on 13 December and to the Minister on 19 December 2007. The first barrier to achieving USE is achieving sufficient primary school graduates with the competencies to succeed in secondary schools. Improving Secondary Student Participation (Chapter 2) examines national and regional trends in population, enrollment, low levels of apparent transition from primary to secondary schools, poor secondary school entry examination (SSEE) results and issues related to the “size” of secondary schools. The “size” issue recurs in later chapters, with its effect on the number and quality/qualifications of secondary teachers, teacher attrition, the range of subjects that small schools can offer, poor student attendance, poor completion rates to Grade 11 and poor CXC examination results for the few students who complete Grade 11. Only 3.5% of secondary
1 Terms of Reference (Attachment A1) included a review of comparable Caribbean countries. With five weeks available in the field and the additional time required for a comprehensive review of secondary education, the Bank agreed any visit/s to another country was unnecessary.

Revision 23 July 2008
/viii
students in Primary Tops, 14.1% of Community High School students, and 50.6% of GSS reach Grade 11. More female students reach Grade 11 than do male students. Summary of Secondary Education in Guyana, 2005/06 and “survival” to Grade 11
Grade Students Mean G11/G7(%) SchoolType Region N=
7 8 9 10 11 12 M F M+F Enroll M F
Primary R1789 114 1146 861 766 411 23 4 1797 1481 3278 29 2 2
Tops R2560 75 1070 828 727 486 70 0 2116 1436 3552 47 6 7
R3411 53 1153 1162 629 226 26 11 1888 1333 3220 61 1 4
Comm R1789 1 170 68 25 18 6 0 151 136 287 287 0 8
HS R2560 5 366 358 248 214 82 0 733 535 1268 254 13 37
R3411 18 2437 1917 1565 1271 331 0 4072 3449 7521 418 9 19
General R1789 9 916 824 770 611 423 0 1540 2004 3544 394 43 49
SS R2560 32 5516 4982 3793 3677 2617 111 9554 11142 20696 647 42 53
R3411 41 5767 5506 4699 4109 3130 450 10721 12610 23331 569 48 61 Source: MOE data (GY0506S_Enr_Zone.sql)
Upgrading and Qualifying Teachers (Chapter 3) identifies small school enrollment issues in earlier chapters with the enrollment required to offer a viable secondary curriculum, improve teacher qualification/training and reduce attrition rates. The Chapter examines the combined effect of teacher attrition, student/teacher ratios and mean school enrollment with a changing mix in school types – fewer “primary tops” and an increase in general secondary schools. Factors affecting teacher supply and demand include projected enrollment, teacher attrition (loss) rates, retraining of untrained teachers, recruitment of trained teachers, improving student/ teacher ratios and the shift to increased GSS enrollment to achieve USE. Student Learning Outcomes (Chapter 4) links poor student attendance, poor primary (SSEE) examination outcomes, limited secondary curriculum offerings, low rates of survival from Grade 7 to Grade 11 to the reported CXC results for Guyana. This chapter concludes with an analysis of better performing secondary schools – they presented more students/subjects, had higher average attendance, had higher percentage trained teachers, and were mostly schools in Georgetown and the adjacent regions 3 and 4. Recent data were not available to compare Guyana’s performance with other Caribbean countries. Schools and Infrastructure (Chapter 5) presents the assessment that low student “demand” and a shortage of qualified teachers prevents Guyana achieving USE. Increasing the “supply” of secondary school places would not achieve USE unless other investments are made to improve the pool of suitably qualified students. Local factors justify new school construction (upgrading CHS to GSS, consolidating “tops”, replacing inadequate facilities) but this capital investment requires an equivalent investment in retraining, refreshing, upgrading, certifying and retaining teachers. Secondary Education Resources and Budgets (Chapter 6) reviews education expenditure as a proportion of budget and the salary/non-salary recurrent expenditure for Primary (“Tops”) and Secondary schools. Regional differences in primary and secondary expenditure, and differences in expenditure by category contribute to variations in average expenditure per student. Small enrollment and higher residential costs distort per capita expenditure in hinterland regions. The salary expenditure “saved” by employment of untrained/unqualified teachers has been calculated to support an argument that these funds should be invested in upgrading teachers, improving curriculum and student learning outcomes.

Revision 23 July 2008
/ix
Guyana USE Scenarios: For Guyana to approach universal secondary education, more students have to progress from primary to secondary and to remain in school to Grade 11. Chapter 7 identifies six “demand” assumptions – population aged 12-16, population loss, secondary Gross Enrollment Rate (GER), GSS share of total secondary enrollment, Grade 7 share of total secondary enrollment, and Grade 11 survival rates. Baseline, medium and high outcome scenario values for each assumption project the number of students presenting for CXC examinations to 2012. For any given student enrollment, the budget implications of each policy scenario depend on student/teacher staffing ratios, the retention of qualified teachers and success in upgrading qualifications of current teachers. III. Key Findings
Achieving USE requires understanding of nine (9) key findings reported in Chapters 1-6:
� Quality primary education outcomes are the basis for achieving USE - Grade 6 completion rates, primary student attendance, and secondary school entrance examination (SSEE) results determine the “demand” secondary education.
Primary completion rates2 in 2004/05 were 96% for both boys and girls, but were 92% for boys and 90% for girls in the four riverine/hinterland regions (1, 7, 8 and 9). While performance should improve through Fast Track Initiative (FTI) activities, these four poor performing regions account for only 11% of total Guyana primary enrollment. (Georgetown, Region 3 and 4 account for 52%)3.
Primary student attendance reported as 76% for 2003/04 (Table 24 in 2004/05 MOE Statistical Bulletin) and limits initiatives to achieve better outcomes. There is some progress - Primary enrollments in hinterland regions increased 28% between 2001/02 and 2005/06 and SSEE candidature increased 37% over the same period.4
� Quality of primary school graduates.Combined hinterland and coastal rural regions average only 90% of the SSEE scores achieved in coastal urban regions (Georgetown, Region 3 and 4)5. Reducing this rural-urban gap will require improved performance in Math and English, as these subjects provide the foundations for success in secondary grades.6
� Demographic change points to a larger cohort passing out of Primary, but this may obscure performance on transition from primary to secondary.
Students aged 7-11 years represent approximately 45% of combined primary and secondary enrollment in 2005/06 and will produce an increase in secondary enrollment as this larger cohort passes from primary grades to secondary7. Analysis of MOE statistics reveals that only 77% of 9-10 year-old students in 2001/02 were present as 13-14 year-olds in 2005/06. Poor transition exists across all regions, but appears to be greater for boys in Georgetown and Region 4.8
2 Primary Completion Rate is the number enrolled in Grade 6 as a percentage of population aged 11. Population aged 11 used 2002 Census data (population aged 9 years). 3 See Table 1.2 4 See Chapter 4: Table 4.2 5 See Table 4.3 and Figures 4.3 and 4.4 6 See Chapter 2 (paragraph 2.17) and Chapter 4 (paragraph 4.18) 7 See Chapter 2: Table 2.2 and Figure 2.2 8 See Chapter 2: Table 2.6

Revision 23 July 2008
/x
� Secondary grade repetition, especially of males in Grade 7 remains high.High grade repetition rates (14.4% of male students and 8.8% of female students in 2004/05) are symptoms of poor system performance, including poor primary student outcomes above and reduce prospects of achieving USE. Hinterland Grade 7 repetition rates (17.6%) and coastal urban Grade 7 repetition (18.3%) are different phenomena, but each threatens the viability of secondary education. In a system with a shortage of qualified teachers, high repetition increases lower grade enrollment, adds to the numbers of teachers required, as well as aggravating poor attendance and “drop out”.9
� Retention of students from grades 7 through 11 remains too low.To achieve USE, Guyana has to improve on the 38% of Grade 7 students in 2001/02 who were still present in Grade 11 in 2005/06. There are three related concerns – males were 31.5% compared with 45.6% for females; overall retention has declined from 42.9% (of the 1997/98 Grade 7 intake), and greater male attrition in Georgetown and Regions 3 and 4 (only 29% survival to grade 11).10
� Student attendance rates of 60% in “Tops” and 80% in GSS are too low. The USE policy in 2002 should have had an attendance target which would have drawn attention to poor performance. Attendance remains around 60% in Primary Tops and Community High Schools (and male rates approximately 5% lower than female rates) and only 80% in GSS. Guyana cannot compete against CXC standards if one to two days are “lost” per week11.
� Teacher qualifications and competencies limit student outcomes. In a system where attracting qualified teachers is a problem, there could be greater returns in helping “untrained” teachers achieve “trained” status and in encouraging teachers to upgrade their qualifications. Only 1-in-9 male teachers and 1-in-5 female teachers aged 16-30 are trained. Reducing recruitment of untrained teachers will be necessary if overall performance is to be improved. Secondary schools require teachers to be “qualified” in their teaching subject and this requires closer examination.12
� Losses of trained teachers increase pressure on education performance. Between 2004 and 2005, Guyana General Secondary Schools (GSS) lost 68 “trained” teachers and replaced them with 25 “untrained” teachers. Net losses understate the impact of teacher turnover – approximately 17% of teachers in 2004 “left” their school, including attrition by teachers who “transfer out” but do not take up an appointment at another school.13
� Subject offering and poor CXC outcomes limit overall education quality. Guyana reports increased CXC English A candidature between 2002 and 2003 but it has fluctuated around 8000 students over the past three years. Fewer than 30% candidates achieve Grade 1-3 passes in Math (against USE objective 35%). The National Center for Educational Resource Development (NCERD) does not report against the objective that 40% of secondary school leavers achieve Grade 1-3 proficiency in five subjects (but
9 Table 2.8 and paragraph 2.25 (Chapter 2) and Table 4.4 Grade 6/7 Transition. 10 Table 2.10, Tables 4.4, 4.8, 4.9 11 Table 2.9, paragraph 2.32, Table 4.7 and Figures 4.7 and 4.8. 12 Tables 3.1, 3.3, 3.4, 3.8, paragraph 3.26, and Figures 3.1, 3.9, 3.10. 13 Tables 3.14, 3.15, paragraph 3.42.

Revision 23 July 2008
/xi
should analyze the unit record CXC data). Some 8000 English A candidates averaged only 2.7 Grade 1-3 passes in 2007.14
IV. Guyana USE Scenarios The following table compares 2011/12 outcome using baseline, a medium outcome scenario and a high outcome, and compares the difference between the baseline and high outcome. The baseline is largely the “status quo” with 8 fewer CHS requiring conversion to GSS or new GSS construction. The major difference between the “Medium” and “High” outcomes is a major reduction in Primary Tops requiring new GSS with boarding facilities and some “virtual” GSS with a core GSS serving a network of classrooms attached to Primary Schools. The difference between current “Primary Tops” and the proposed cluster or network school would be the students and the teachers “belong” to the GSS not to the host Primary schools.
PROJECTED 2011/12 Baseline Medium Outcome
High Outcome
Difference High-Baseline
Population aged 12-16 79,000 87,900 90,500 +11,500 Secondary Students 67,900 77,600 81,400 +13,500 CXC Candidates 6,800 8,400 9,700 + 2,900 GSS students as percent all Secondary 78% 79% 90% Students per Teacher (more GSS students) 20:1 23:1 26:1 Percent trained (more GSS teachers) 61% 70% 80% Projected new teachers (over 5 years) +226 +515 +660 + 434 Recurrent Expenditure (G$M constant) $4,290 $4,631 $4,646 +$M 356 Recurrent Expenditure increase (5 years) +4.4% +8.3% +8.5% Number of Primary Tops 181 178 36 - 130 Number of CHS 12 11 9 - 11 Number of GSS 89 92 96 + 12 Recurrent Expenditure (G$M constant) $4,290 $4,631 $4,646 +G$M 356 Recurrent Expenditure increase (5 years) +4.4% +8.3% +8.5% Additional GSS required over 5 years Capital Expenditure required (G$M)
+5 GSS G$M5,250
+8 GSS G$M8,400
+12 GSS G$M12,600 +G$M 7,350
Source: Scenario.XLS; Tables 7.2, 7.3, 7.4, 7.5; capital expenditure assumptions in Table 5.3 The High outcome scenario assumes that 90% of secondary students would be enrolled in a GSS, with more students per GSS. The ratio of Students per Teacher (STR) increases in almost equal steps from 20:1 in Baseline to 23:1 in Medium and to 26:1 for the High Outcome. The percentage of trained Teachers increases from 61% in the Baseline to 80% for the “High” outcome. Even with the Baseline Scenario, Guyana requires five additional GSS, half the numbers of CHS and some reduction in the number of Primary Tops. The Medium scenario would require a further 3 GSS. The major difference between the Medium and the High outcome scenario is a major reduction in the number of Primary Tops and construction of a further 4 GSS. The underlying assumption is that USE policy aim to get more students enrolled in (larger) GSS, fully-staffed by qualified teachers, higher student attendance and more students completing Grade 11 with successful CXC outcomes in five subjects. Without this educational USE focus,
14 Paragraphs 4.46-4.55, and Tables 4.10-4.13.

Revision 23 July 2008
/xii
investment in new GSS construction would be difficult to justify. The efficiency outcomes are an important part of the financial justification for the additional capital required for upgrading CHS to GSS and consolidating “Primary Tops” into viable GSS. Recurrent expenditure would be just over G$4,600 million for both the Medium and the High outcomes, largely because of efficiencies of having 90% of secondary students in GSS and the higher STR requires fewer teachers. The average enrollment per CHS+GSS (“size”) in 2011/12 is 592 in the Baseline, 658 for the Medium outcome and 755 for the High outcome. These improvements in efficiency not only have larger numbers of students completing secondary but the average expenditure per student is lower. While the capital expenditure for these scenarios is based on the number of new GSS required (at a standards less than Wisburg GSS), Guyana could identify better uses for these funds. Upgrading clusters of Primary Tops into a Regional GSS, with residential facilities where necessary, could meet student and community needs more effectively than construction of a new “green-fields” school. Some CHS could be upgraded to GSS with some classroom/facilities added at lower cost than construction of a completely new school. Chapter 5 suggests a framework for community, Regional Departments and MOE consultation about the best mix of schooling to achieve USE. V. Recommendations
These nine findings suggest the Government should consider four strategies to improve student outcomes:
(1) Improve the viability of secondary schools: Secondary schools with few students cannot deliver satisfactory outcomes – Primary Tops with an average 43 students cannot prepare students for transfer to a GSS to complete Grade 11. Consolidation of Primary Tops into a GSS may only be feasible in some coastal regions but not in the hinterland. CHS with an average 378 students and smaller GSS cannot attract qualified teachers, and prepare students to be competitive at CXC.
The better performing GSS at the CXC averaged more than 700 students, averaged 90% student attendance and had more than 60% trained teachers15. Larger GSS can achieve efficiencies in larger class size, better student/teacher ratios, attract qualified teachers and can form viable classes to offer a wider range of CXC subjects;
(2) Redirect funds in regional budgets16 (using apparent “savings” in employing
unqualified/untrained teachers) to fund retention and upgrading of existing teachers, attract new teachers, improve student attendance, achieve more students completing Grade 11 and presenting for CXC, and achieve better secondary school outcomes (or graduating with a diploma);
(3) Reduce regional differences between hinterland, rural/coastal and urban/ coastal
regions, and implement strategies to improve male learning outcomes and reduce gender differences; and
15 See Table 1.4 16 See Tables 6.8-6.9
Revision 23 July 2008
/xiii
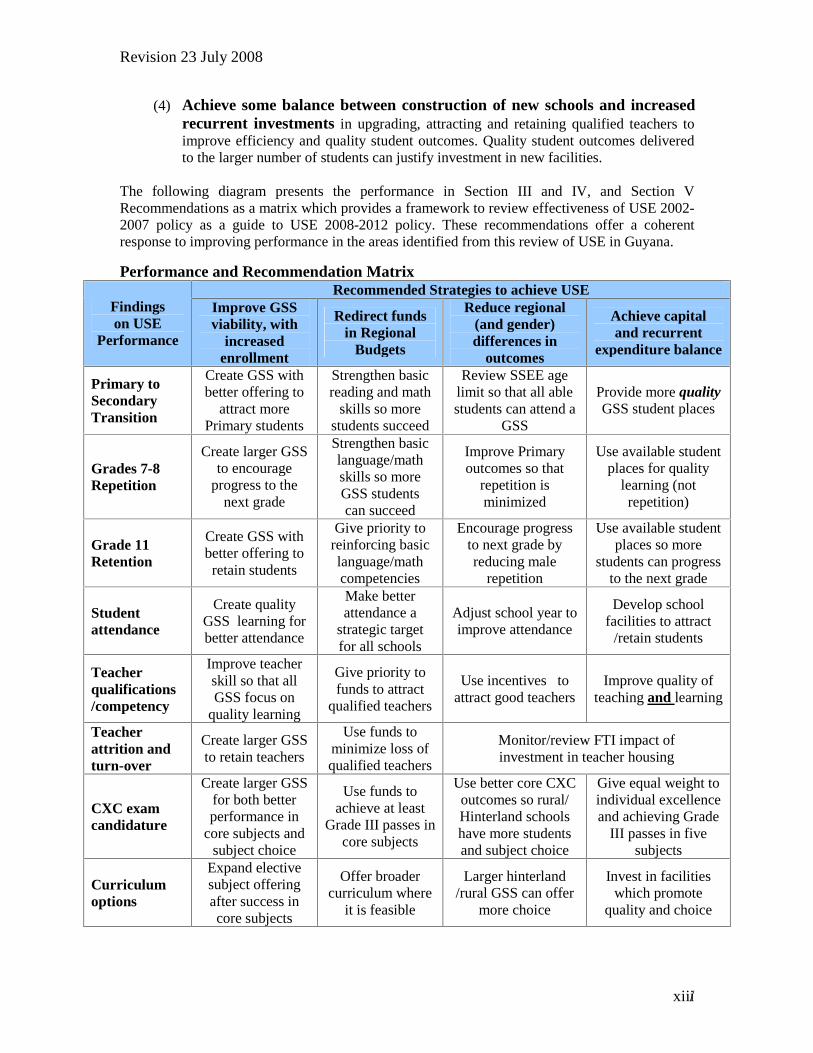
(4) Achieve some balance between construction of new schools and increased recurrent investments in upgrading, attracting and retaining qualified teachers to improve efficiency and quality student outcomes. Quality student outcomes delivered to the larger number of students can justify investment in new facilities.
The following diagram presents the performance in Section III and IV, and Section V Recommendations as a matrix which provides a framework to review effectiveness of USE 2002-2007 policy as a guide to USE 2008-2012 policy. These recommendations offer a coherent response to improving performance in the areas identified from this review of USE in Guyana.
Performance and Recommendation Matrix Recommended Strategies to achieve USE
Findings on USE
Performance
Improve GSS viability, with
increased enrollment
Redirect funds in Regional
Budgets
Reduce regional (and gender) differences in
outcomes
Achieve capital and recurrent
expenditure balance
Primary to Secondary Transition
Create GSS with better offering to
attract more Primary students
Strengthen basic reading and math
skills so more students succeed
Review SSEE age limit so that all able students can attend a
GSS
Provide more quality GSS student places
Grades 7-8 Repetition
Create larger GSS to encourage
progress to the next grade
Strengthen basic language/math skills so more GSS students can succeed
Improve Primary outcomes so that
repetition is minimized
Use available student places for quality
learning (not repetition)
Grade 11 Retention
Create GSS with better offering to retain students
Give priority to reinforcing basic language/math competencies
Encourage progress to next grade by reducing male
repetition
Use available student places so more
students can progress to the next grade
Student attendance
Create quality GSS learning for better attendance
Make better attendance a
strategic target for all schools
Adjust school year to improve attendance
Develop school facilities to attract
/retain students
Teacher qualifications /competency
Improve teacher skill so that all GSS focus on
quality learning
Give priority to funds to attract
qualified teachers
Use incentives to attract good teachers
Improve quality of teaching and learning
Teacher attrition and turn-over
Create larger GSS to retain teachers
Use funds to minimize loss of qualified teachers
Monitor/review FTI impact of investment in teacher housing
CXC exam candidature
Create larger GSS for both better performance in
core subjects and subject choice
Use funds to achieve at least
Grade III passes in core subjects
Use better core CXC outcomes so rural/ Hinterland schools have more students and subject choice
Give equal weight to individual excellence and achieving Grade
III passes in five subjects
Curriculum options
Expand elective subject offering after success in core subjects
Offer broader curriculum where
it is feasible
Larger hinterland /rural GSS can offer
more choice
Invest in facilities which promote
quality and choice

1
Chapter 1: Current Status of Secondary Education in Guyana 1.1 This Chapter reviews recent performance of public secondary schools in Guyana against the
Policy on Universal Secondary Education (2002), and broad trends evident in the annual Statistical Digests and unpublished data. The USE 2003-2007 Strategic Plan had six objectives, and Guyana has achieved the following outcomes:
USE OBJECTIVE REPORTED OUTCOMES
1) 75% of primary school leavers will have access to a five-year secondary education program
• Insufficient students complete Grade 6 with the learning competencies required to succeed in GSS and CXC.
• Grade 7 transition is reported at 93% (including Primary Tops but excluding Grade 7 repeats), but apparent attrition in Grades 8 and 9 suggest that only GSS students are likely to complete 5 years.
• Grade 11 completion calculated as 38% of Grade 7 intake in 2001/02 (Males 31.5% and Females 45.6%).
2) 25%-40% of primary school leavers will have access to the GTEE-Basic Competency Certificate Program
• Students in Primary Tops unlikely to progression to GSS (and CXC) and located in small communities without access to an alternative Basic Competency Program.
• Students in CHS in Georgetown and regional centers may have “access” to technical subjects but have very poor attendance.
• Small GSS cannot offer viable technical subjects, have difficulty attracting qualified teachers and Industrial Training Centers and Technical Institutes cannot provide alternative pathways.
3) 35% of secondary school leavers, after 5years of secondary education will have achieved CXC Grades 1-3 General Proficiency in Math.
• 20-25% of CXC candidates achieve Grade 1-3 Math, but more students drop-out of secondary schools well before Grade 11.
4) 40% of secondary school leavers, after five years of secondary education will have achieved CXC Grade 1-3 General Proficiency in five subjects.
• NCERD publishes CXC “subject” entry data and Grades but no analysis of numbers of candidates achieving Grade 1-3 in five subjects. (Analysis is recommended in Chapter 4).
• No CHS students presented CXC subjects in 2007 (unless they
had transferred to a GSS17).
5) Conversion of the remaining Community High Schools to General Secondary Schools.
• Most conversion occurred before the 2003-2007 USE Plan. GEAP Project funded consolidated of CHS at Wisburg (Region 10). Seven of the 24 CHS in 2005/06 are located in Georgetown (Region 11), and another 6 in Region 4.
6) Establishment of discrete General Secondary Schools by amalgamation of clusters of Primary Tops.
• Half the 240 Primary Tops in 2005/06 are located in the Hinterland (Regions 1, 7, 8 &9) where opportunities for amalgamation are limited. Different strategies are required to deliver quality secondary education for hinterland students.
• Amalgamation remains possible in some lowland/coastal regions
1.2 Of the wide range of observations presented to senior Ministry officers on 13 December 2007 and refined for a presentation to the Minister on 19 December 200718, this Review of secondary education urges Guyana to consider four strategic options in developing its USE strategy for 2008-2012.
17The “status” of Cove and John School was unclear. 18 See Attachments B and C.
2
Four Strategic Options for USE 2008-2012 1.3 The decline in the status and quality of education in Guyana did not occur in the last five
years NOR can any strategic plan reverse the decline by 2012 (or some longer term target). The challenge is to identify those strategic investments which arrest decline and provide prospect for future improvement across the four elements – capacity, motivation, quality and facilities.
- Achieving quality primary education outcomes, especially performance in language, literacy and numeracy, are the foundation for universal secondary education;
- Reducing the apparent “drop out” from schooling during the transition from primary to secondary and between Grade 7 and Grade 9, through a more flexible/modular curriculum which combines core competencies with practical skills which motivate less willing “learners” and encourages improved attendance;
- Improving competencies of existing teachers, through shorter courses in subject content and teaching methodology, which may count as credit towards training and a formal teaching qualification, a post-secondary diploma or university degree;
- Achieving some balance between recurrent funding to improve and sustain quality and capital funding for the construction of new schools. Without better primary outcomes, more motivated learners and better teaching, new school construction may be responding to the symptoms rather than the causes of poor secondary education.
1.4 Looking beyond 2012, the USE 2008-2012 Strategic Plan should seek an appropriate
balance across these four outcomes. Taken separately, each option has merit, and each should demonstrate some success. As discussed in Chapter 5, increasing the supply (and quality) of secondary school places has not met the other quality outcomes. The physical conditions of existing schools (especially Primary Tops and Community High Schools) could justify construction of new schools, but relocating students from inferior to better facilities does not increase overall participation, nor does it improve the quality of learning without the other three conditions.
1.5 If the general community equates new buildings with better teaching and learning, and this
encourages them to have their children continue in secondary school, the motivational impact should not be understated. School Improvement Plans (SIP) and community initiatives introduced through SSRP, GEAP and BEAMS help reinforce this community impact. Capital investment in buildings and textbooks cannot guarantee a better education for more children unless the secondary schools are staffed by trained and qualified teachers with sufficient command of the subject content to prepare all children for CXC in Year 11.
1.7 Different scenarios are presented in Chapter 7, draw on both recurrent and capital funds,
but may take longer to demonstrate student learning benefits. Most of USE achievements in 2003-2007 were an outcome of SSRP and GEAP activity, and BEAMS and the EFA Fast Track Initiative (FTI) are contributing to achievements in 2008-2012. New capital funding to consolidate Primary Tops and upgrade CHS/GSS facilities will contribute to USE outcomes beyond 2012.
3
Trends in Secondary Enrollment
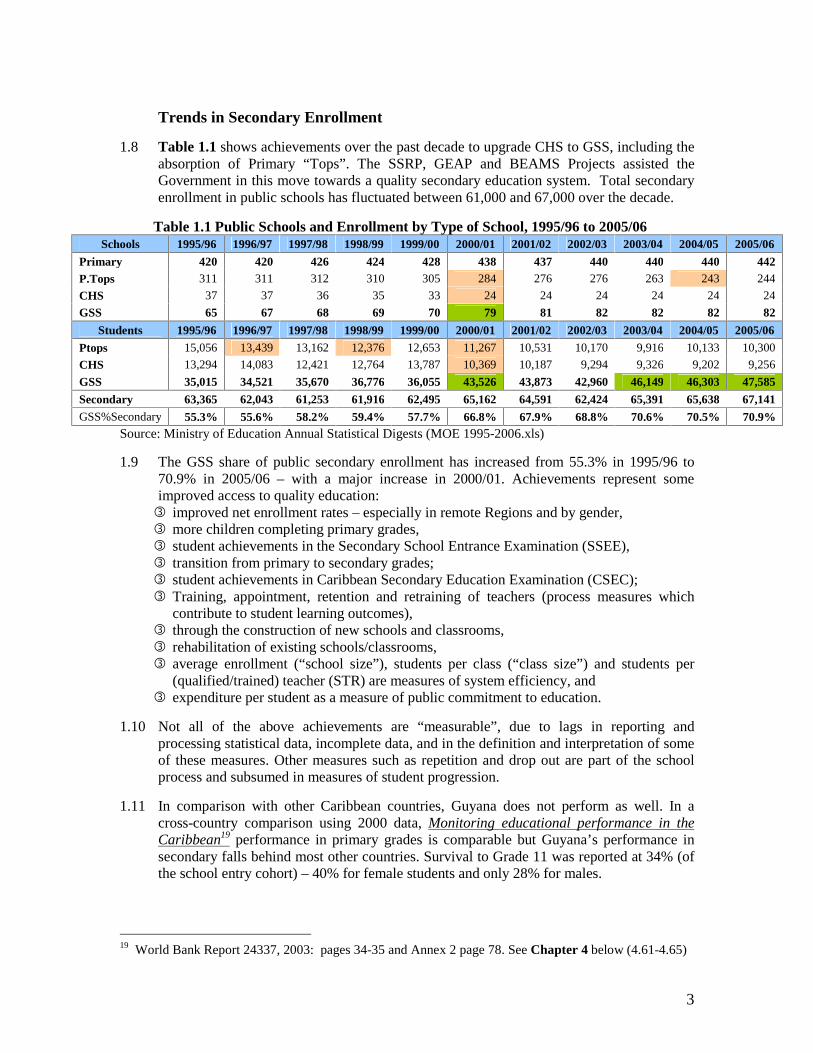
1.8 Table 1.1 shows achievements over the past decade to upgrade CHS to GSS, including the absorption of Primary “Tops”. The SSRP, GEAP and BEAMS Projects assisted the Government in this move towards a quality secondary education system. Total secondary enrollment in public schools has fluctuated between 61,000 and 67,000 over the decade.
Table 1.1 Public Schools and Enrollment by Type of School, 1995/96 to 2005/06 Schools 1995/96 1996/97 1997/98 1998/99 1999/00 2000/01 2001/02 2002/03 2003/04 2004/05 2005/06
Primary 420 420 426 424 428 438 437 440 440 440 442 P.Tops 311 311 312 310 305 284 276 276 263 243 244
CHS 37 37 36 35 33 24 24 24 24 24 24
GSS 65 67 68 69 70 79 81 82 82 82 82
Students 1995/96 1996/97 1997/98 1998/99 1999/00 2000/01 2001/02 2002/03 2003/04 2004/05 2005/06
Ptops 15,056 13,439 13,162 12,376 12,653 11,267 10,531 10,170 9,916 10,133 10,300
CHS 13,294 14,083 12,421 12,764 13,787 10,369 10,187 9,294 9,326 9,202 9,256
GSS 35,015 34,521 35,670 36,776 36,055 43,526 43,873 42,960 46,149 46,303 47,585
Secondary 63,365 62,043 61,253 61,916 62,495 65,162 64,591 62,424 65,391 65,638 67,141 GSS%Secondary 55.3% 55.6% 58.2% 59.4% 57.7% 66.8% 67.9% 68.8% 70.6% 70.5% 70.9%
Source: Ministry of Education Annual Statistical Digests (MOE 1995-2006.xls)
1.9 The GSS share of public secondary enrollment has increased from 55.3% in 1995/96 to 70.9% in 2005/06 – with a major increase in 2000/01. Achievements represent some improved access to quality education: � improved net enrollment rates – especially in remote Regions and by gender, � more children completing primary grades, � student achievements in the Secondary School Entrance Examination (SSEE), � transition from primary to secondary grades; � student achievements in Caribbean Secondary Education Examination (CSEC); � Training, appointment, retention and retraining of teachers (process measures which
contribute to student learning outcomes), � through the construction of new schools and classrooms, � rehabilitation of existing schools/classrooms, � average enrollment (“school size”), students per class (“class size”) and students per
(qualified/trained) teacher (STR) are measures of system efficiency, and � expenditure per student as a measure of public commitment to education.
1.10 Not all of the above achievements are “measurable”, due to lags in reporting and processing statistical data, incomplete data, and in the definition and interpretation of some of these measures. Other measures such as repetition and drop out are part of the school process and subsumed in measures of student progression.
1.11 In comparison with other Caribbean countries, Guyana does not perform as well. In a cross-country comparison using 2000 data, Monitoring educational performance in the Caribbean19 performance in primary grades is comparable but Guyana’s performance in secondary falls behind most other countries. Survival to Grade 11 was reported at 34% (of the school entry cohort) – 40% for female students and only 28% for males.
19 World Bank Report 24337, 2003: pages 34-35 and Annex 2 page 78. See Chapter 4 below (4.61-4.65)

4
1.12 Guyana has been successful in enrolling more children of secondary school age, but that success has not (yet) resulted in a greater proportion of Grade 7 students completing Grade 11 with a quality education. Problems of access and (income) poverty in hinterland areas explain part of continuing this under-performance. In Guyana, this is compounded by urban poverty, many “out-of-school” males of school age, and a potentially self-fulfilling culture of hopelessness.
1.13 About the same time that Guyana adopted its “Universal Secondary Education” policy, Jamaica developed its second Reform of Secondary Education (ROSE II) Project – with a focus on youth “at risk”20. There is a potential contradiction in many education strategies in that keeping more children in school longer will fail if those children are unable, under-prepared and unwilling to learn.
1.14 Making education “compulsory” should be unnecessary if schools offer a relevant and quality education. If reluctant learners are compelled to attend school (with fines and penalties), they are more likely to be behavioral problems and more likely to be suspended or expelled. School systems which measure success in the number of CXC passes and focus on the “survivors” to upper secondary grades are at risk of “failing” the majority of youth. High rates of repetition are discussed elsewhere in this review – repetition increases pressure on learning places, on teaching resources and increase costs of education without demonstrable gains in learning outcomes and progression to further levels of education.
1.15 Fifteen measures: This review uses existing MOE data to identify 15 measures21 which summarize the current situation in secondary education, and could guide the Ministry in its strategic choices. If performance on a measure is acceptable, this should be an indicator of USE success. If performance is unacceptable, the measure should suggest USE strategies to improve performance. A distinction should be drawn between “measures” of education process outcomes and an acceptable “standard” of performance. Measures of current performance against the “standard” would provide the Ministry (and Regional Departments) with performance “indicators”.
Fifteen measures of Education in Guyana 1 Population aged 6-11 years (2002 Census and 2007 estimate) 2 Primary survival to Grade 6 (Grade 6 as %Grade 1 in 1999/2000) 3 Primary teachers trained (percentage, 2004/05) 4 Secondary Schools Entrance Exams (percentage Grade 5, 2004/05) 5 SSEE mean scores in Math and English (2007) 6 Primary/Secondary transition, Grade 7 as %Grade 6 7 Population aged 12-16 (2002 Census and 2007 estimate) 8 General Secondary Schools (GSS) as percent Secondary enrollment 9 Mean enrollment per GSS (“size” and number of schools) 10 Secondary teachers trained (percentage, 2005/06) 11 Secondary student attendance (percent attendance, by gender) 12 Attrition Grade 7-9, by gender (Grade 9 as percentage Grade 7) 13 Secondary survival to Grade 11 (Grade 11 as percentage Grade 7 in 2001/02) 14 Caribbean Examination results (percentage CXC candidates at Level I-III) 15 Secondary Expenditure and expenditure per secondary student
20 World Bank Project Appraisal PAD Report 24783-JM pages 7-8. 21 See Attachment D1 notes and definitions

5
1.16 Process outcomes are presented as a sequence of measures, so that USE strategy can target under-performance. Measures 1-5 (shaded green) are Primary Education outcomes which should contribute to quality secondary education. Measure 2 differs from the conventional measure of primary completion, and measures 6, 12 and 13 are used in Chapters 2 and 4 to demonstrate where Guyana needs to improve performance if USE is to be achieved.
1.17 Improving student attendance (measure 11) and reducing student “attrition” (measure 12) are complementary strategies, provided that all continuing students have the core competencies for learning. The latter is both a curriculum and a teacher competency issue discussed in Chapters 3 and 4.
1.18 Available data for each measure are presented for Guyana by Region, with regions grouped as Hinterland/Riverine (Regions 1, 7, 8, 9), as Rural/Coastal (Regions 2, 5, 6, 10), and Urban/Coastal (Region 11, Georgetown, and adjacent Regions 3 and 4). This arbitrary grouping attempts to assist comparisons and contrasts.
1.19 Enrollments are a function of the school age population discussed in Chapter 2. Measure 1 shows the population aged 6-11 years as broadly stable from the 2002 Census to 2007, but enrollments in the hinterland regions are growing while the coastal areas are stable or declining and the proportion of students who complete 6 years primary school. The latter measure differs from the “completion” indicator used by UNESCO and other international agencies, which relate Grade 6 enrollment to the number of children of official school-age in the last year of primary (which in Guyana would be 11 years).
1.20 The simpler Grade 6/Grade 1 ratio demonstrated in Table 1.2 would allow each Regional Department and individual school communities can “see” their performance without relying on an abstract measure and out-dated estimates of the school age population.
Table 1.2: Primary Education Survival to Grade 6 (2004/05) MEASURE 2: SURVIVAL TO GRADE 6
Guyana Total
Hinterland Regions 1789
Rural/Coastal Regions 256 10
Urban/Coastal Regions 34 11
Grade 1 enrolled (1999/2000) 19,495 2,166 7,222 10,107 Grade 6 enrolled (2004/05) 17,606 1,889 6,505 9,212 Measure 2 (Grade 6/Grade 1) 90.3% 87.2% 90.1% 91.1%
Males 88.2% 85.8% 87.5% 89.2% Females 92.6% 88.9% 92.8% 93.3%
Source: MONE Statistical Digests 1.21 With nine out of ten children who enter Grade 1 completing Grade 6 (and 8.6 males in
Hinterland regions), universal primary education (UPE) is a foundation for universal secondary education. The quality of primary completion is important, with Measure 3 (Primary Teachers trained), Measure 4 (Students sitting SSEE) and Measure 5 (SSEE results) offering possible measures of primary education quality. Six out of ten Primary teachers trained is a major threat to quality USE, especially in the hinterland where only one-in-three primary teachers are trained.
1.22 Fewer hinterland primary students undertook SSEE (85.6% versus an average 89-90% in coastal regions), with mean Math and English scores only 72% and 75% of the national averages. As discussed with other measures, dispersed population in hinterland regions present problems for operating and staffing primary schools, but these schools require even greater resources per student if Guyana is to achieve universal quality secondary education for all children. Bringing hinterland students to the national average will not be sufficient – the national averages are still below a level which Guyana should accept.

6
1.23 Central to this review of USE performance in Guyana are questions about the quality of secondary education delivered through Primary Tops and Community High Schools. USE 2002-2007 objectives correctly identified strategies to consolidate primary tops into GSS and to convert CHS to GSS so that other USE outcome objectives could be achieved.
1.24 In this review of data gathered late in 2007, an additional measure (or a variation on measures 8 and 9) - GSS enrollment as a percentage of Primary enrollment - may assist the Ministry and Regional Education Departments measure their USE “shortfall” and identify strategies to achieve USE. In Table 1.3, total secondary students were 57.8% of Primary students in Guyana in 2004/05, with female students 59.3% compared with 56% for males, with little apparent regional variation. The tan shaded rows show a less satisfactory picture – only a quarter of Primary students in hinterland regions (R1, 7, 8&9) enroll in GSS in the same region.
Table 1.3 Secondary Enrollment as a Percentage of Primary Enrollment, 2004/05 Regions 1,7,8&9
Regions 2,5,6&10
Regions 3,4&11
Guyana 2004/05
F 52.8% 59.7% 60.6% 59.3% All Secondary students as a percentage of Primary students M 47.7% 56.3% 57.8% 56.0%
F 28.4% 50.7% 43.1% 44.1% GSS students as a percentage of Primary students M 21.4% 43.2% 37.0% 37.3%
Source: MOE Statistical Digest Tables 22, 41A, 41B, 41C. See Attachment D3.
1.25 Students successful in SSEE are offered places in GSS in Georgetown, President’s College in Region 4 and better performing schools in Regions 2, 6 and 10. Georgetown averages 73% for Females and 65% for Males but this is overstated by Region 4 students who attend GSS in Georgetown. The combined Region 4 and Region 11 averages are 44.5% for females and 38.5% for males.
1.26 Fast Track Initiative (FTI) activities which improve access and participation in hinterland primary schools, and teacher training should improve learning outcomes, but Guyana will need to invest substantial resources if those gains are to be sustained into secondary grades. Table 1.3 indicates a need to increased GSS provision in hinterland regions. Transition from primary to secondary education (Measure 6) is discussed in more detail in Chapter 2.
Creating Viable Secondary Schools
1.27 With a small population dispersed across a large land area dissected by large rivers flowing into the Atlantic Ocean, secondary schooling in Guyana is characterized by many small secondary schools. In hinterland regions, there are almost as many students in Primary Tops as in GSS (and more boys in Tops than GSS). With an average about 43 students and few qualified and trained teachers, small primary tops cannot offer a viable secondary education.
1.28 Later chapters suggest that Guyana has three options for remote communities: � Staffing primary tops with qualified and trained teachers in Math and English so that
students have skills to transfer to the nearest GSS in Grade 8 or Grade 9; � Staffing primary tops with qualified and trained teachers in Math and English, as a
“cluster” GSS where the most centrally located school provides itinerant specialist teachers in other subjects and specialist facilities for science and other subjects;
� Residential GSS provide quality educational and residential facilities to which remote Amerindian communities are happy for their children to attend.

7
1.29 There is no “low cost” option for the provision of a quality secondary education leading to enrollment to Grade 11 and CXC Grade I-III outcomes in at least five subjects.
1.30 The USE 2003-2008 objective to consolidate primary tops as GSS may be viable in more densely settled and accessible coastal communities but it is not feasible in hinterland areas. Community High Schools in lowland rural areas and in Georgetown do not offer quality secondary education leading to Grade 11 and CXC outcomes. Most CHS have fewer than 400 students and insufficient qualified and trained teachers. Upgrading CHS to GSS require fewer schools, with higher average enrollment and better qualified/trained teachers.
1.31 In addition to issues such as public expenditure per secondary student, which are common to many low income (and middle income) countries, the recurring issue in this review is “What is a minimum viable secondary school?” – defined not just as secondary student enrollment, but also whether the school delivers a “minimum viable secondary curriculum”. A parallel question about “minimum viable primary education” is outside the terms of reference for this review but is the foundation for effective secondary education.
1.32 The 2003-2007 USE policy assumed that “access to a five-year secondary education program” would be in a GSS. The distribution small schools suggests that viable GSS cannot be provided for all secondary students, and the implications for planning were discussed with senior officers in the Ministry and with the Minister.
1.33 With only GSS presenting CXC candidates, the structural challenge for Guyana is how to deliver viable, quality education in GSS to all students. Half of 348 secondary schools (including secondary classes in Primary Tops) in Table 1.4 have fewer than 300 students. Most Primary Tops have <100 students. Hinterland (R1, 7, 8&9) has a total of 10 CHS or GSS, and only two with 500 or more students. Most CHS are in Regions 3, 4&11 with 400-600 students. Regions 2, 5, 6&10 have 23 GSS with more than 600 students.
Table 1.4 Secondary Schools by Enrollment, Type and Region, 2005/06 Primary Tops CHS GSS
Size
Scho
ols
Tea
cher
s/S
choo
l
Per
cent
Fem
ale
perc
entA
tten
d
Stud
ent/
Tea
cher
Per
cent
Tra
ined
R1,7,8&9
R2,5,6&10
R3,4 &11
R1,7,8&9
R2,5,6&10
R3,4 &11
R1,7,8&9
R2,5,6&10
R3,4 &11
1 219 1 43.7 63.0 17.7 42.3 111 64 42 1 1101 21 7 42.0 53.3 22.1 49.6 3 7 7 1 1 1 1201 14 12 43.7 59.3 20.2 46.3 2 4 1 1 3 1 1 1
301 17 19 50.5 68.7 19.1 54.1 2 1 3 2 3 6401 17 24 50.9 68.5 18.6 53.1 6 3 3 5501 21 27 50.4 70.9 20.1 53.4 1 5 3 12 601 13 33 56.3 80.5 19.6 60.9 9 4701 16 33 54.1 76.8 22.0 55.0 8 8801 5 38 54.7 84.2 22.3 64.5 2 3901 3 38 52.9 81.8 24.6 61.7 2 1
1001 2 41 55.0 67.5 25.9 81.7 1 1Source: MOE data (Gy0506s_size2008.sql)
1.34 Primary Tops and the smallest secondary schools have more male students (<45% female), low attendance and less than half the teachers are trained. Schools with 300-600 students have 50% female students, about 65-70% attendance and 50-55% trained teachers. GSS with 600+ students have about 55% female students, more than 75% attendance, higher ratio of students to teachers and about 60% trained teachers.

8
1.35 There are apparent efficiency benefits in larger schools – higher ratios of students per teacher in Table 1.4 and more specialist subject teachers22.
1.36 Table 1.5 reports NCERD data for 85 Guyana schools reporting CXC entries in 2007 against Grade 11 enrollment (in 2005/06) by total secondary enrollment. Only 5 out of 254 “schools” with less than 300 had students entered in CXC in 2007. Larger schools with more than 500 secondary students averaged 29% Level 1 or 2 outcomes and 61% had Level 3 passes or higher.
Table 1.5 Guyana Secondary Schools by Size 2005/06 and CXC Entries in 2007
Enrolled(size)
Schools with CXC
entries
Total Enrolled 2005/06
CXC Entries
2007
Grade 11 as % Enrol
L1, L2 Percent Entries
L3% Entry
L4% Entry
Mean Entries/Grade
11 <300 5 1061 483 9% 14% 33% 26% 5.0
301-500 26 10470 13111 11% 28% 27% 21% 6.4 501+ 54 37646 22642 13% 29% 32% 22% 5.8
TOTAL 85 49,177 36,236 13% 29% 31% 22% 5.9 Source: MOE and NCERD data. (excludes one school <300 with no 2005/06 enrollment)
1.37 All 49 schools with 600+ secondary students in Table 1.5 are GSS, as are 15/21 schools
with 501-600 students. The hinterland regions in Table 1.6 have only one GSS with more than 600 students23. Of the rural coastal regions, 22/33 schools are GSS with 600+ students, while 26/43 schools in Georgetown and adjacent regions 3 and 4 are GSS.
Table 1.6 Guyana Secondary Schools by “Region” and CXC Entries in 2007
Regions
Schools with CXC
entries
Total Enrolled 2005/06
CXC Entries
2007
Grade 11 as % Enrol
L1, L2 Percent Entries
L3% Entry
L4% Entry
Mean Entries/Grade
11 R1, 7, 8, 9 9 3729 2061 11.2% 15% 31% 25% 5.0 R2, 5, 6,10 33 21038 15231 12.5% 25% 31% 23% 5.8 R3, 4, 11 43 24410 18944 12.7% 33% 31% 20% 6.1 TOTAL (a) 85 49177 36236 12.5% 29% 31% 22% 5.9
Source: MOE and NCERD data. (a) excludes one school <300 with no 2005/06 enrollment.
1.38 Tables 1.4-1.6 support the USE strategy to increase GSS student enrollment, especially if students are in GSS with 600+ students, with high attendance rates, a higher proportion of trained teachers and better CXC outcomes. The other part of the USE strategy requires a reduction in secondary enrollments in Primary Tops and the upgrading of CHS to GSS.
1.39 Figure 1.1 uses available performance measures to summarize the situation in Guyana. The “tan” colored cells represent “progress” to the next step in the education system. The values on the arrow show the combined result of each step – If almost 97% of children of primary age enroll, and 88% complete primary school, this is 85.5% (=0.9670 x 0.8840). With 93% progression to secondary, 79.7% “survive to Grade 7, but only 38% progress to Grade 11, reducing participation in Grade 11 to approximately 30% of the cohort.
22 See Tables 3.3 and 3.4 23 Bartica GSS has more than 1,000 students (but a second school is under construction)

9
Figure 1.1: Summary of Available Performance Measures for Guyana (A) Æ (A*B) Æ (B*C) Æ (C*D) Æ = (E)
(A) 96.7% Primary net
enrolment rate 0.9670
24
Teachers, qualifications, retraining
(B) 88.4% Grade 6
Completion Rate 0.8548
Expenditure per Primary Student
Non-salary expenditure
(C) 92.3% Progression to
Secondary (includesTops)
0.7890
Teacher qualifications, retraining
(D) 38.3% Secondary
Completion Rate
0.3022 (M 0.2395)
Expenditure per Secondary Student
Textbooks, non salary expenditure
(E) Secondary CXC outcomes Math 41.6% English 72.7%
1.40 Table 1.7 presents regional differences on measures (A)-(E) in Figure 1.1, together with gender differences where data are reported. These differences are discussed in Chapters 2-4, together with more disturbing data on student attendance. Seasonal variations in attendance are to be expected, but fewer than one-in-four males appear to reach Grade 11.
Table 1.7 Regional and Gender Differences on Measures A-D Measures Primary Net
Enrollment Rate (A)
Grade 6 Survival Rate (B)
Progression to Secondary
(C)
Grade 11 Completion
Rate (D)
Survival to Grade 11 (A*B*C*D)
R1,7,8,9 91.6% 90.6% 105.9% 23.2% 20.4% R2,5,6,10 96.5% 86.1% 96.4% 46.9% 37.6% R3,4,11 96.7% 89.8% 86.8% 36.0% 27.1% Females 96.2% 89.6% 93.8% 45.6% 36.9% Males 95.7% 87.4% 90.9% 31.5% 23.9%
1.41 USE is a comprehensive policy, but it should not be seen as a single plan. Different student, teacher and school needs may require each of the 11 regions to have a separate plan – with some common elements. The test for any Regional Plan will be whether it delivers the best educational outcomes for all children – access to a functioning school with good facilities, high student attendance and fully staffed by qualified teachers. � Regions 178&9 (Hinterland) have many Primary Tops, one Community HS, and few
GSS. With the exception of Bartica GSS in Region 7, GSS tend to be small, and depend on residential dormitories. Mainly Amerindian communities need to identify the best way of bringing secondary teachers to the community, taking secondary students to a central location, or some mixture of these strategies.
24 Tan colored cells are measurable outcomes of student progress through the school system. The green cells are measurable recurrent inputs to the school system (A) Census 2002 data for 6-11 year-olds; (B) Grade6 (2005/06)/Grade1 (2000/01); (C) Note the difference between 93.2% (G7-Repeats)/Grade6 and analysis based on students aged 13/14 over aged 9/10 four years earlier. Older children may not be in secondary; (D) G11/G7 four years earlier; (E) NCERD (Sept 2007) modified from GEAP analysis. Seasonal variations in student attendance require careful analysis, as do measures of teacher attendance.

10
� Regions 5 and 6 in southern Guyana have many Primary Tops, a network of GSS, but few CHS. Communities should look for strategies to strengthen/consolidate Tops at the same time that GSS performance and outcomes are strengthened. Regions 2 and 10 have some of each type of secondary school. Communities could borrow parts of the Hinterland strategy and parts of the southern Guyana strategy. The opening of Wisburg GSS could be a focus for other improvements in secondary education in Region 10.
� Regions 3 and 4 have many Tops, more CHS and different needs because of their proximity to Georgetown. Options could include transforming CHS into GSS, absorbing nearby Primary Tops or merging with an existing GSS. Region 11 (Georgetown) is in a separate class, with an ill-defined private school sector which competes for students and makes planning public education less certain. Georgetown could be part of a Region 4+11 strategy - or even a Regions 3+4+11 strategy.
1.39 USE Outcomes 1 (75% access to Secondary), 5 (CHSÆGGS conversion) and 6 (Amalgamating Primary TopsÆGSS) are the major focus of this Review. Outcomes 2-4 depend on curriculum reforms which need to be put in place to parallel universal access to secondary education. All six policies depend on the availability of qualified teachers, extensive retraining of current teachers, and the annual recurrent funding to employ (and retain) teachers.
1.40 Policy issues confronting the Ministry include:
Has participation in Secondary education increased, (in rural schools and urban schools)?
Yes, marginally.
Has the standard of student performance on SSEE increased?
More students sit SSEE examinations, but mean performance has declined.
Has the curriculum offered to secondary students been broadened?
See Chapter 4.
Has the quality of teaching (and qualification of teachers) improved?
See Chapter 3.
Has average secondary student attendance increased?
Yes, in CHS, but male attendance 55% in Primary Tops and 60% in CHS.
Have student/teacher ratios changed? Yes, in GSS with increased enrollment.
Has the efficiency of secondary school operations improved?
Yes, increased enrollment absorbed in the existing schools, and the average GSS enrollment increased from 542 in 2001/02 to 580 in 2005/06.
Has real expenditure per student improved? See Chapter 5. Has Guyana performance on Caribbean Examinations improved?
NCERD data show increased CXC candidature and 70% English pass rates. Math pass rates remain around 40%.
Have Community High Schools been upgraded to General Secondary Schools?
Nine GSS opened in 2000/01, with 9 fewer CHS. Numbers/total enrollment have been unchanged since 2002/03.
Have Primary Tops been consolidated into General Secondary Schools?
The major change occurred in 2000/01. There were 20 fewer Tops in 2004/05 with no reduction in total enrollment.

11
1.39 The last two issues relate to the specific objectives of the USE Policy Paper in 2002. School improvement plans, teacher training/retraining and regional centers (under SSRP, GEAP, BEAMS and GBET) supported these Government objectives. Sustaining initiatives introduced by externally-supported projects should be central to MOE planning for USE 2008-2012. Capital investment such as the Wisburg Secondary School is tangible and necessary, but the model will only be effective if the curriculum, teaching and support services are in place to deliver better secondary school outcomes for all students.
1.40 Achieving USE requires better primary school outcomes and better secondary teacher knowledge and skills. Governments and the community can “see” new school construction – teaching quality and learning outcomes are less visible, but require recurrent funding to realize the benefits of new construction.
1.41 On 19 December 2007, the Minister for Education, Mr. Shaik Baksh, indicated that a national meeting on teacher education would be held early in 2008. Changing pre-service education is a long-term strategy – it cannot provide an immediate benefit in new teachers with the skills and flexibility required, nor will it improve the knowledge, skills and competency of the majority of unqualified/ untrained teachers already in the system.
1.42 One option could be reducing the duration of pre-service primary teacher education to two years, followed by a two term “internship” – the first term teaching with a qualified teacher/mentor, the term semester having sole responsibility for the class while the qualified teacher undertakes mentoring and knowledge/skills development of other teachers on the school staff (and nearby schools). After two terms internship, the temporary qualified teacher returns to complete a final term at College/University before certification as a primary teacher. In systems already understaffed, teachers cannot undertake in-service training if their classes have no replacement – this model could meet both needs – giving real teaching experience to the new teacher and creating time for upgrading of existing teachers. Seasonal variations in student attendance may offer another opportunity for teacher upgrading without loss of student learning time.
1.43 There may be a parallel between “preventative” maintenance of school facilities and investment in professional development to maintain the quality of the teaching service. At some point, it can be decided that no further maintenance of a building is justified and a new building is required. Teachers are different to buildings, but ongoing in-service training is “preventative” maintenance!
1.44 In systems short of teachers, more resources tend to be spent on pre-service training rather than in-service. Guyana may have to reverse that policy – upgrading, qualifying, certifying, reinvigorating existing teachers will strengthen morale and encourage more teachers to remain in the profession, especially in difficult to staff locations. By contrast, even if the pre-service teacher training curriculum was changed in 2008, for the academic year 2008/09, the first graduates would not enter teaching until school year 2011/12 – when the new strategic plan ends.

12
Chapter 2: Improving Access, Participation and Attendance 2.1 The policy on Universal Secondary Education (2002) sought to ensure that, by 2010, 75%
of primary school leavers would have access to a five year secondary education program, with 25-40% having access to the Basic Competency Certificate Program and 40% of secondary school leavers achieving Grade 1-3 proficiency in five subjects at the Caribbean Examination Commission (CXC) examinations. The USE Policy sought to improve access, participation and student outcomes by the conversion of the remaining Community High Schools (CHS) to General Secondary Schools (GSS) and the establishment of discrete GSS by amalgamation of clusters of Primary Tops (primary schools with secondary classes).
2.2 This chapter examines national trends in school-age population, enrollment, secondary
school entry examination (SSEE) candidature, apparent transition from primary to secondary schools, repetition in secondary grades, and reported student attendance. Differences by gender, between riverine/hinterland regions and coastal regions and by “size” of school were examined where recent data were available. The “school size” issue recurs in later chapters, with its effect on the number and quality/qualifications of secondary teachers, teacher attrition, the range of subjects that small schools can offer, student attendance, completion rates to Grade 11 and CXC examination results for those students who complete Grade 11.
2.3 Students enrolled in General Secondary Schools: The major change over the past decade
has been an increased proportion of students enrolled in public GSS which offer the full five years of secondary schooling leading to CXC examinations at Grade 11. The increase from 55.3% GSS students in 1995/96 to 70.9% in 2005/06 is one measure of USE progress. In Table 2.1, aggregate secondary enrollment fluctuated between 61,253 in 1997/98 and 67,141 in 2005/06 (the highest level over the past decade). The major shift occurred in 2000/01, when the GSS share increased from 57.7% to 66.8%. GSS enrollment in 200/01 increased by 7,471 with CHS declining 3,418 and primary tops by 1,386.
Table 2.1 Public Schools and Enrollment by Type of School, 1995/96 to 2005/06 School Type 1995/96 1996/97 1997/98 1998/99 1999/00 2000/01 2001/02 2002/03 2003/04 2004/05 2005/06
Nursery 288 288 305 334 320 324 322 322 323 325 325 Primary 420 420 426 424 428 438 437 440 440 440 442 Primary Tops 311 311 312 310 305 284 276 276 263 243 244 CHS 37 37 36 35 33 24 24 24 24 24 24 GSS 65 67 68 69 70 79 81 82 82 82 82 Public Schools 1121 1123 1147 1172 1156 1149 1140 1144 1132 1114 1117
Students 1995/96 1996/97 1997/98 1998/99 1999/00 2000/01 2001/02 2002/03 2003/04 2004/05 2005/06 Nursery 29,306 30,736 33,366 36,212 36,955 35,558 34,886 33,006 32,226 31,730 30,136 Primary 100,252 102,000 100,998 105,320 105,800 108,311 109,005 110,776 115,172 113,971 110,828 Primary Tops 15,056 13,439 13,162 12,376 12,653 11,267 10,531 10,170 9,916 10,133 10,300 CHS 13,294 14,083 12,421 12,764 13,787 10,369 10,187 9,294 9,326 9,202 9,256 GSS 35,015 34,521 35,670 36,776 36,055 43,526 43,873 42,960 46,149 46,303 47,585 Secondary 63,365 62,043 61,253 61,916 62,495 65,162 64,591 62,424 65,391 65,638 67,141 Public School Enrollment 192,923 194,779 195,617 203,448 205,250 209,031 208,482 206,206 212,789 211,339 208,105
GSS%Secondary 55.3% 55.6% 58.2% 59.4% 57.7% 66.8% 67.9% 68.8% 70.6% 70.5% 70.9% Source: Ministry of Education Annual Statistical Digests (MOE 1995-2006.xls)

13
2.4 Many education systems report increasing enrollment as a measure of success, but the enrollment may be distorted by students repeating grades. International comparisons use “gross enrollment rates” (GER25) which link the number enrolled to school-age population. Table 2.2 consolidates Guyana data on public school enrollment by age for the past five years26 to show the following GER:
- Nursery schools: 88.3% of the population27 aged 4-5 (in 2005/06) - Primary schools: enrollment equals 96.5% of population aged 6-11 - Secondary schools: enrollment equals 80.7% of population aged 12-16.
Note differences in reported age in annual schools data and in the population census – more 8 year-olds were enrolled in 2005/06 than the number of five year-olds at the 2002 Census.
2.5 The major application of Table 2.2 is to demonstrate the progression by cohorts of 20,000 students through primary grades and apparent attrition from age 12. The increase in the number of 11 year-olds from around 15,000 in 2001/02 to almost 18,500 in 2005/06 is a “demographic effect” of the larger primary cohort and some of the USE initiatives.
Table 2.2: Enrollment in Guyana Public Schools by Age, 2001/02 to 2005/06
Age at Report 2001/02 2002/03 2003/04 2004/05 2005/06
Percent 2005/06 Enrolled
Enrolled as percent Population
<4 3574 3325 3976 3431 3308 1.6% 4 15808 14664 14474 14399 14582 7.0% 89.5% 5 18041 18256 17472 16450 15857 7.6% 89.0% 6 19345 18385 19166 18065 16343 7.8% 93.2% 7 19633 19674 18636 18925 18174 8.7% 92.3% 8 18836 19993 19829 18534 18883 9.1% 102 % 9 17806 18259 20055 20011 18495 8.9% 98.2%
10 16455 17534 18353 19588 19196 9.2% 95.1% 11 15281 15563 17648 18353 18450 8.9% 91.9% 12 16405 14153 15654 15910 15541 7.5% 84.7% 13 14558 14126 13148 13419 13836 6.6% 80.3% 14 12669 12102 13057 12311 12616 6.1% 79.9% 15 9756 10838 10633 10894 10552 5.1% 68.0% 16 6456 6193 6976 6690 7945 3.8% 48.5%
>16 3859 3141 3712 4359 4637 2.2% 30.2%
Public 208,482 206,206 212,789 211,339 208,415 100% Nursery 34,886 33,006 32,226 31,730 30,136 14.5% 88.3% Primary 109,005 110,776 115,172 113,971 110,828 53.2% 96.5% Secondary 64,591 62,424 65,391 65,638 67,141 32.2% 80.7% Source: Guyana MOE Statistical Digests (+draft 2005/06). Private school data are excluded.
2.6 The decline from 18,353 students aged 11 in 2004/05 to only 15,541 aged 12 in 2005/06 should be of greater concern, together with the loss of a further 2,000 students between age 12 and 13. From about 100% of 8 and 9 year-olds enrolled (see green shaded cells in Table 2.2), Guyana public schools lose about 5% per year at each age 10, 11, 12 and 13. Effective USE sector planning should build upon an understanding of this process.
25 GER is the number of students enrolled divided by the population in the relevant age-range. GER may be inflated by repetition. Net Enrollment Rate (NER) reduces the impact of repetition by expressing students in the relevant age-range as a percentage of the population. 26 The Ministry of Education reports incomplete data on private schools and their enrollment. 27 Children aged 1-2 at the September 2002 Census.

14
2.7 Table 2.3 shows an emerging change in age-structure of public school enrollments from 2001/02 to 2005/06. Percentage of students in “primary” ages 6-8 has declined and those aged 10-11 increase.
2.8 Regional patterns in Figure 2.2 show 2001/02 enrollment (red lines) and 2005/06 enrollment (blue lines). The hinterland regions (1, 7, 8 &9) have greater numbers enrolled at each age, while the more densely settled coastal regions including Georgetown (3, 4, 1128) show fewer children enrolled aged 4-7 years and more children enrolled ages 10-11. Regions 2, 5, 6 &10 combine the coastal regions other than Georgetown and its two neighbors. This categorization generalizes patterns of population and enrollment, but is used elsewhere in this Review of USE to discuss access, participation and outcomes data.
Figure 2.2
GUYANA SCHOOL AGE ENROLLED
0
2000
4000
6000
8000
10000
12000
<04 04 05 06 07 08 09 10 11 12 13 14 15 16 >16
Age
ENR
OLL
ED
01/02 R1789 05/06 R1789 01/02 R2560 05/06 R2560
01/02 R3411 05/06 R3411
Data for individual regions are included in Attachment D6A
28 The Ministry reports Georgetown as “Region 11”, it has a major impact on adjacent Region 4 and some impact on Region 3. SSEE data published prior to 2007 combined data for Region 4 and Georgetown. Care is required in interpreting some regional statistics.
Table 2.3: Percentage Age Distribution
Year 01/02 02/03 03/04 04/05 05/06
Age<4 1.7% 1.6% 1.9% 1.6% 1.6%
Age04 7.6% 7.1% 6.8% 6.8% 7.0%
Age05 8.7% 8.9% 8.2% 7.8% 7.6%
Age06 9.3% 8.9% 9.0% 8.5% 7.8%
Age07 9.4% 9.5% 8.8% 9.0% 8.7%
Age08 9.0% 9.7% 9.3% 8.8% 9.1%
Age09 8.5% 8.9% 9.4% 9.5% 8.9%
Age10 7.9% 8.5% 8.6% 9.3% 9.2%
Age11 7.3% 7.5% 8.3% 8.7% 8.9%
Age12 7.9% 6.9% 7.4% 7.5% 7.5%
Age13 7.0% 6.9% 6.2% 6.3% 6.6%
Age14 6.1% 5.9% 6.1% 5.8% 6.1%
Age15 4.7% 5.3% 5.0% 5.2% 5.1%
Age16 3.1% 3.0% 3.3% 3.2% 3.8%
Age>16 1.9% 1.5% 1.7% 2.1% 2.2%
TOTAL 100% 100% 100% 100% 100% Source: Calculated from annual MOE Statistical Digests

15
2.9 The blue-lines in Figure 2.2 (and the tan shaded cells in Tables 2.2 and 2.3) highlight this structural change in the school-age population. Fewer students aged 6-7 between 2000/01 and 2005/06 is a demographic effect, increased numbers aged 10-11 are a combined effect of demography and improved primary participation, but the decline in each age group after age 11 is a major threat to achieving USE. Improved primary completion rates and better teaching contribute to increasing numbers of Grade 6 students sitting the Secondary Schools Entrance Examination (see Table 2.5 and Figure 2.3 below). � Regions 1, 7, 8 &9 average about 2,000 students in each primary age group and the
hinterland numbers enrolled have expanded for each age over the period. � Regions 2, 5, 6 &10 averaged 6,000-7,000 students in each primary age, but there are
fewer 5-7 year olds and the number of 9-11 year-olds has increased. � Regions 3, 4 &11 averaged 8,000-10,000 in each primary age, with fewer aged 4-7, and
more aged 10-11.
2.10 Primary completion rates divide enrollment in the last year of Primary (Grade 6) by the number of children aged 1129. Table 2.4 reports 96% for both boys and girls in 2004/05. The hinterland regions averaged 92% for boys and 90% for girls. Performance is expected to improve through the Fast Track Initiative (FTI), but the hinterland regions account for 11% of total Guyana primary enrollment. Georgetown, Region 3 and 4 account for 52%. Primary Completion Rates should be used with care30.
Table 2.4: Primary Completion Rates by Region, 2004-05 2004-05 2002 Census Primary
Region Enrolled Grade 6 Age 9 (=11 in 2004) Completion Rate Male Female Total Male Female Total Male Female Total
R01 331 342 673 328 357 685 1.01 0.96 0.98 R02 598 591 1189 655 667 1322 0.91 0.89 0.90 R03 1153 1141 2294 1214 1210 2424 0.95 0.94 0.95 R04 1668 1664 3332 2041 2027 4068 0.82 0.82 0.82 R05 680 711 1391 650 699 1349 1.05 1.02 1.03 R06 1506 1496 3002 1539 1438 2977 0.98 1.04 1.01 R07 212 197 409 235 240 475 0.90 0.82 0.86 R08 101 95 196 157 115 272 0.64 0.83 0.72 R09 319 292 611 332 320 652 0.96 0.91 0.94 R10 454 469 923 549 543 1092 0.83 0.86 0.85 R11 1830 1756 3586 1548 1485 3033 1.18 1.18 1.18
Guyana 8852 8754 17606 9248 9101 18349 0.96 0.96 0.96 1,7,8,9 963 926 1889 1052 1032 2084 0.92 0.90 0.91
2,5,6,10 3238 3267 6505 3393 3347 6740 0.95 0.98 0.97 3,4,11 4651 4561 9212 4803 4722 9525 0.97 0.97 0.97
Guyana 8852 8754 17606 9248 9101 18349 0.96 0.96 0.96 Source: MOE Statistical Digest 2004-05; Population Census data, 2002
29 Population aged 11 in 2004/05 assumed equal to population aged 9 years (September 2002 Census). 30 This analysis of Guyana data examined the ratio of Grade 6 enrollment to Grade 1enrollment as a proxy measure of Primary “completion”. See Table 1.2 and Attachment D3. The 17,606 students in Grade 6 in 2004/05 were 90.3% of the Grade 1 enrollment in 1999/2000. High grade repetition in Grade 1 may understate “completion”.

16
2.11 Single year of age estimates from a population census data become even less reliable each year after the census. Internal migration reduces further the reliability of regional measures. Many students living in Region 4 attend primary schools in Georgetown, inflating the Region 11 PCR to 118% and deflating the Region 4 PCR (82%). The combined Region 4+11 PCR was 97.3%.
2.12 The number of Grade 6 students completing the Secondary Schools Entrance Examination (SSEE)31 provides an alternative measure of primary completion, with numbers increasing in most Regions over the past decade. The Ministry identified a potential problem, where the maximum age at which a primary student can sit SSEE may exclude over-age students (mostly boys) from GSS. A review of the age limit on SSEE candidature appears necessary.
2.13 Table 2.5 and Figure 2.3 show how Region 4 (which includes Georgetown, shaded tan, up to 2006), with some 7,000 candidates, dominates SSEE - about 44% in 1996 and 40% in 2007. The combined Hinterland candidature (Regions 1, 7, 8&9, shaded light green) increased from 1,100 in 1996 to 1,900 candidates in 2007.
Table 2.5: Secondary Schools Entrance Examination Candidates by Region, 1996-2007 YEAR R04 R06 R03 R05 R02 R10 R01 R09 R07 R08 Total1996 6487 2423 1933 1085 920 827 339 290 354 155 148131997 6107 2370 1686 909 1018 773 259 308 283 138 138511998 6133 2227 1689 992 1049 777 260 306 291 137 138611999 6487 2423 1933 1085 920 827 339 290 354 155 148132000 6962 2502 2029 1147 1058 791 392 376 361 163 157812001 6748 2414 1946 1036 1056 811 401 378 346 240 153762002 6326 2336 1871 1111 959 798 358 409 351 173 146922003 6090 2414 1942 1046 1021 871 472 452 410 239 149572004 6668 2639 2165 1180 1154 1013 507 528 434 206 164942005 7239 2896 2243 1294 1176 1042 512 519 439 234 175942006 7500 3122 2445 1297 1322 1082 541 516 490 225 185402007 7011 3044 2212 1231 1167 989 675 508 476 221 17534
Note: Region 4 included Georgetown prior to 2007.
2.14 SSEE data are neither reported nor analyzed gender. The National Center for Educational Resource Development (NCERD) analysis of 2007 SSEE Results (published in August 2007) does not include analysis of SSEE participation rates by region. Student performance by region is discussed below (Chapter 4), and analysis by gender and by “size” of primary school is recommended.
2.15 This USE Review has concentrated on the average secondary school enrollment (“size”), but a similar analysis of average Primary school size and SSEE results could provide a useful focus for discussions between the Ministry and Regional Education Departments.
2.16 Guyana should not expect to achieve USE (and be competitive at CXC examinations) if Grade 6 students lack the literacy and numeracy skills to succeed in secondary school. As noted in Chapter 4 Student Outcomes, the Ministry, Regional Departments and NCERD should discuss the quality and competencies of primary Grade 6 graduates.
31 Note that SSEE (and CXC) candidate data include private school students.

17
2.17 If an expanded pool of students inadequately prepared for SSEE has contributed to declining scores (Figure 4.4 in Chapter 4), this decline should be arrested as more primary teachers are trained (and retrained) and the quality of learning in primary grades improves.
Figure 2.3: Secondary Schools Entrance Examination Candidates by Region, 1996-2007
R04+Gtown
R06 R03
0
1000
2000
3000
4000
5000
6000
7000
8000
1996 1997 1998 1999 2000 2001 2002 2003 2004 2005 2006 2007
R04 R06 R03 R05 R02 R10 R1978
Source: Analysis SSEE/NGSA Results 1996-2007, August 2007, Volume 1, pages 10-15.
2.18 Persistent attrition from school after age 10 is one of the major challenges to the implementation of USE. Emigration may exaggerate the slope showing declining enrollment in Figure 2.2. With more children completing Primary school, the larger numbers aged 10 and 11 in 2005/06 will increase demand for secondary school places in 2006/07 and 2007/08, and they should stabilize in 2008/09 and 2009/10. Smaller cohorts aged 4-7 years (where blue line is above red line for all regions except the hinterland) suggest that new entrants to Secondary grades may decline after 2010/11.
2.19 Improving the primary-secondary transition is one of the measures identified in Chapter 1 to improve USE and could offset the potential demographic effect identified above. Table 2.6 illustrates apparent attrition between primary and secondary schools. Of the 34,261 primary students aged 9-10 years reported in the 2001/02 school statistics, only 26,452 or 77% were present as 13-14 year olds in secondary schools in 2005/06. Some of the “missing” students may be in Private schools32, some may have emigrated but an unknown number have “dropped out” out of the school system. Hinterland regions (1,7,8&9) averaged 84% apparent survival to secondary schools, with approximately half continuing in Primary Tops and half in GSS.
2.20 This analysis excluded ages 11 and 12, both of which have some primary and secondary enrollment. Regions 3, 4 &11 have more 11 year-olds in secondary schools. There is a caveat to Table 2.6 – students from regions other than 3, 4&11 who are successful in the
32 MOE will have authority in the new Education Act to obtain comprehensive data for Private schools.

18
Secondary Schools Entrance Examination and gain a place at one of the preferred colleges/schools inflate the Region 3, 4&11 survival rate (and deflate the rate in their own Region). Improving the quality of rural secondary schools should reduce this impact.
Table 2.6: Age 9/10 survival to Ages 13/14 by Region 2001/02 2005/06 2005/06 Mean
AGE: 9 10 13 14 9Æ13 10Æ14 13+14
R1,7,8,9 F 957 926 842 760 0.880 0.821 0.851 R1,7,8,9 M 935 905 796 734 0.851 0.811 0.832 R2,5,6,10 F 3259 2959 2748 2350 0.843 0.794 0.820 R2,5,6,10 M 3313 3079 2603 2429 0.786 0.789 0.787 R3,4,11 F 4673 4155 3508 3292 0.751 0.792 0.770 R3,4,11 M 4669 4431 3339 3051 0.715 0.689 0.702
Guyana F 8889 8040 7098 6402 0.799 0.796 0.797 Guyana M 8917 8415 6738 6214 0.756 0.738 0.747 Source: MOE Statistical Digests (ZZRYSNAS_X15MARCH.SQL)
2.21 A greater proportion of female students “survive”, and the pattern is consistent across these Regional “groups”. Higher attrition of male students may exaggerate female retention. Survival rates from age 9 to age 13 are higher than survival from age 10 to age 14 – except for females in Regions 3, 4 and 11, where the latter reflects transfers to secondary schools in Georgetown (and to President’s College in Region 4).
2.22 Table 2.7 disaggregates transition rates by gender and by the type of school. More males who progress to secondary do so in Primary Tops (0.170 and 14.3) compared with females (0.126 and 0.103) or in CHS (males 0.117 compared with 0.095 and 0.100 for females).
Table 2.7: Transition from 9/10 to 13/14 years, by Gender and Secondary Type 9Æ13 10Æ14
Female students not continuing 0.201 0.204Transition to Primary Tops F 0.126 0.103Transition to CHS F 0.095 0.100Transition to GSS F 0.578 0.593 Female rate 10% above Male rate Total Females Continuing 0.799 0.796 Female rate 4-6% above Male
Male students not continuing 0.244 0.262Transition to Primary Tops M 0.170 0.143 Male rate 5% above Female Transition to CHS M 0.117 0.117 Male rate 2-3% above Female Transition to GSS M 0.469 0.479Total Males Continuing 0.756 0.738 Source: RYSNAS_26NOV_SECY.sql
2.23 For USE, transition to GSS is strategic – with almost 60% of girls aged 9-10 being in GSS by ages 13-14. Males are more than 10 percentage points lower (0.469 and 0.479). These patterns explain why regions other than Georgetown and Region 4 have higher transition rates in Tables 2.6. The exception already noted is the higher female transition 10/14 which is also apparent in higher GSS transition.33
2.24 Transition rates of 10-17% for both Primary Tops and CHS should be of concern - especially as few students would complete the USE target of five years secondary schooling. In the Primary Tops, male transition is almost 5% above female transition. In
33 See also paragraph 2.15-2.17 (need for NCERD analysis of SSEE data by gender and by region).

19
CHS, male transition is approximately 3% higher. This may not be due to poorer performance by girls, but successful girls had already achieved their GSS places.
2.25 Repetition inflates apparent transition from Grade 6 to Grade 7 (109% gross transition is reduced to 92.3% when Grade 7 repetition is excluded). Table 2.8 demonstrates divergent patterns of repetition. Students who repeated in 2003/04 are expressed as a percentage of 2004/05 enrollments to approximate repetition rates34.� 11.6% of all secondary students repeated, with males averaging 14.4% and females
8.8%, representing 2811 out of 18263 students in Grade 7. � 17.5% of CHS students repeated (38% in Region 3; 20% in Region 11), and 226/910
CHS students in Grade 7 in Region 11. � 14.9% GSS students repeated, but half the GSS students in Region 8, and 43% of the
198 Grade 7 students in Region 8.
Table 2.8 Secondary Grade Repetition Rates by Region R01 R07 R08 R09 R02 R05 R06 R10 R03 R04 R011 TOTAL R1789 R2560 R34110.20 0.03 0.43 0.12 0.09 0.09 0.10 0.15 0.18 0.08 0.24 0.15 17.6% 10.3% 18.3%0.22 0.00 0.21 0.09 0.04 0.05 0.11 0.09 0.11 0.09 0.18 0.12 12.4% 8.0% 14.2%0.16 0.01 0.04 0.16 0.03 0.05 0.12 0.07 0.11 0.10 0.17 0.12 10.7% 8.3% 13.9%0.18 0.00 0.14 0.07 0.03 0.13 0.14 0.06 0.11 0.14 0.13 0.11 8.4% 9.9% 12.5%0.06 0.02 0.00 0.04 0.00 0.01 0.04 0.00 0.03 0.01 0.01 0.02 3.1% 1.9% 1.5%0.17 0.01 0.18 0.09 0.03 0.06 0.08 0.05 0.09 0.07 0.12 8.8% 10.4% 6.3% 10.2%0.21 0.02 0.31 0.13 0.05 0.08 0.13 0.12 0.16 0.11 0.21 14.4% 14.9% 10.4% 17.0%0.22 0.03 0.16 0.10 0.11 0.03 0.01 0.02 0.00 0.03 0.00 6.8% 14.4% 3.9% 1.8%
0.38 0.07 0.20 17.5% 20.4%0.23 0.01 0.51 0.13 0.06 0.09 0.12 0.15 0.07 0.16 0.22 14.9% 17.3% 11.0% 17.8%
PTOPCHSGSS
%R10%R11
FemaleMale
2004/5%R07%R08%R09
Source: Calculated from MOE Education Digest 2004/05 data. Old Gold cells report >15% repetition.
2.26 Repetition complicates enrollment forecasts, but has much wider implications for educational effectiveness, increases the total staffing required, and reduces the probability that students will reach Grade 11.
2.27 Overlaying each of the above issues about enrollment, primary completion rates, transition from primary to secondary and grade repetition rates, student prospects for achieving USE by completing Grade 11 also depend on time which students spend in school.Guyana may be unique in the amount of detail most schools report on monthly attendance, the care with which schools information is stored in a data base and summary tables are generated for the annual MOE Statistical Digest35. Guyana, as a result, has a long series of average annual attendance by region, by gender and by level of schooling.
Table 2.9: Average Attendance, by level of schooling Percent
Attendance 2000/01 2001/02 2002/03 2003/04 2004/05
Nursery F73% ; M72% F74%; M71% F68%; M65% F74%; M71% F78% ; M76%Primary F77%; M76% F77%; M76% F70%; M69% F77%; M76% F80%; M78%Pmy Top F60%; M55% F59%; M54% F58%; M53% F61%; M55% F61%; M55%CommHS F62%; M56% F64%; M60% F56%; M50% F61%; M54% F67%; M60%GSS F78%; M75% F80%; M77% F75%; M71% F78%; M75% F79%; M77%Source: MOE Statistical Digests report average attendance for previous year (including draft 2005/06);
34 The denominator should be 2003/04 enrollments, but similar patterns would be expected. 35 MOE Statistical Digest Tables 8, 24 and 43.

20
2.28 Average student attendance varies by level of schooling and by region. Female student attendance exceeds male student attendance at each level of education. Primary and GSS average about 80% attendance. Primary Tops and CHS average only 60% attendance (shaded tan), with an improvement reported for CHS in 2004/05 (shaded gold).
2.29 Detail on variations in attendance by level of schooling, by gender, by region as well as seasonal patterns in monthly attendance are included as Attachment D5. The major findings which affect USE outcomes are summarized as follows: � Average primary attendance of 80% may contribute to poorer performance in SSEE
examinations and lower transition rates to secondary schools; � Attendance of 61% for girls and 55% for boys in Primary Tops in 2004/05 increases the
likelihood that students will lack either competencies or aspirations to transfer to a GSS; � CHS attendance improved in 2004/05 (female attendance to 67%, up from 61% in
2003/04; male attendance from 54% to 60%) but represents a large loss in learning time; � GSS attendance (79%F; 77%M) has fluctuated around 80% over the period.
2.30 Local knowledge such as industrial action by teachers in one year and the flooding in 2004/05 may “explain” some annual variations, but there should be further analysis of the valuable data MOE holds on monthly/seasonal attendance patterns and how they vary across regions. Such analysis could assist the Ministry in issues relating to the school year, vacations and compulsory attendance in the new Education Act.
2.31 More importantly for USE, an analysis of seasonal patterns reveals a pattern which shows attendance as a threat to effective secondary education. Enrollment and staffing data are resource inputs – but do not show the quality of the inputs. Primary and secondary curricula define the number of hours per subject or days instruction per annum, but the effective curriculum is the number of days students and trained teachers are present and “on task”. The nominal school year is approximately 39 weeks (in three terms).
2.32 USE should include an attendance target. Achieving at least 80% attendance in CHS/Primary Tops and more than 90% in General Secondary Schools could be considered as initial targets. Even on the aggregate data published in the Statistical Digests, Primary Tops and Community High Schools lose the equivalent of two days each school week.
2.33 As planning for USE, the Ministry should ask whether low transition and retention reflects longer-term trends or are a shorter term response to perceived economic prospects. Expanding secondary schools capacity in Georgetown/Region 4 may be necessary to reduced reported over-crowding, but it should be undertaken with great care, as apparent attrition in Table 2.6 averaged 26% (100 minus 74%). Over-crowding may be contributing to greater attrition in urban schools, but no data were available.
2.34 Attention should be given to alternative curriculum pathways, linking secondary grades and Practical Instruction Centers to Technical Education and the GTEE Basic Competency Certificate Program. Expanded offerings of commercial training courses (in computing, business, and other areas) appear unregulated and acceptable courses could be integrated as an alternative pathway.
2.35 Completing Grade 11: If better primary SSEE outcomes and strategies to improve transition from primary to secondary are successful, Guyana should focus USE on improving retention of students from Grade 7 through Grade 11.

21
2.36 In Chapter 1, the ratio of Grade11 students to Grade7 enrollment 4 years earlier provided a measure of secondary school completion. Table 2.10 presents these data by region and by gender. Data for Grade 7 in 1997/98 at the foot of the table provide a comparison with an earlier cohort. Guyana should examine why performance 2001/02 to 2005/06 was lower than for the previous five year period.
Table 2.10: Secondary Grade Completion: Region and Gender Enrolled 2001/02
Enrolled 2005/06
SURVIVAL 2001/02 - 2005/06 Regions
Schools M07 F07 M11 F11 M11/07 F11/07 G11/07
R01 40 321 300 27 53 8.4% 17.7% 12.9% R07 18 209 202 102 100 48.8% 49.5% 49.1% R08 18 128 142 2 29 1.6% 20.4% 11.5% R09 42 302 286 62 64 20.5% 22.4% 21.4%
R1789 118 960 930 193 246 20.1% 26.5% 23.2% R02 27 596 553 280 405 47.0% 73.2% 59.6% R05 26 536 564 262 339 48.9% 60.1% 54.6% R06 30 1438 1393 493 638 34.3% 45.8% 40.0% R10 25 448 406 150 215 33.5% 53.0% 42.7%
R2560 108 3018 2916 1185 1597 39.3% 54.8% 46.9% R03 36 1235 1083 384 497 31.1% 45.9% 38.0% R04 44 1549 1340 289 384 18.7% 28.7% 23.3% R11 32 2288 2179 803 1130 35.1% 51.9% 43.3%
R3411 112 5072 4602 1476 2011 29.1% 43.7% 36.0%
Guyana 338 9050 8448 2854 3854 31.5% 45.6% 38.3%
97/98 8096 7657 01/02 2840 3758 35.1% 49.1% 41.9%
Source: MOE Statistical Digest data 1997/98, 2001/02, 2005/06 2.37 Regions 2 and 5 average more than 50% retention to Grade 11 in 2005/06, and, with Region
11, were also above 50% for the cohort which reached Grade 11 in 2001/02. By gender, Region 2 performance was even more marked – 73% of girls survived to Grade 11 in 2005/06, compared with 60% in Region 5, 53% in Region 10 and 52% in Region 11.
2.38 This is not an age-structure effect because it is the same cohort being measured. Net movement of students to Georgetown may have declined between the 1997/98 and 2001/02 intakes into Grade 7. Private schools and emigration of secondary students from Guyana may have contributed, but the most disturbing conclusion is that more students in Georgetown “dropped out” of school.
2.39 For USE planning in Georgetown, a cross-section of the 25 GSS and 7 CHS could be asked to compare their current list of Grade 11 students with their Grade 7 intake in 2003/04. Such a review could improve understanding of drop-out and assist the school, its community and the Ministry to implement more effective USE strategies. It is understood that the Ministry is examining such an analysis.
2.40 Access issues identified by Ministry of Education: Improving secondary provision in hinterland regions will be necessary to accommodate growth in primary enrollments, but the hinterland regions account for approximately 10% of national enrollments. Accommodating secondary school students in available school places in Georgetown and other coastal regions is an equally pressing priority.

22
2.41 Through SSEE, students from other regions with best performance are offered places in schools in Georgetown and Region 4. This process may be counter-productive – the quality of secondary education in more remote regions cannot improve if the most able primary students continue to be offered places in Georgetown schools. Better performing Georgetown schools are more attractive to teachers, add to difficulties in attracting (and retaining) teachers in rural regions, and will further delay improvement in the quality of secondary education in more remote regions.
2.42 The Ministry should monitor the impact of the new high school in Wisburg on improving secondary enrollments in Region 10. This model may not be replicable in more sparsely settled regions, where residential provision would add to the capital cost of establishing a new school. Schools with new facilities and better teaching may be a powerful incentive to attract and retain students, to retain teachers, to improve student attendance, to improve CXC outcomes, and to increase community confidence in its school.
2.43 Increases in secondary participation reflect the demographic changes evident in Figure 2.2 and more primary students undertaking the Secondary Schools Entrance Examination (Figure 2.3). Total Secondary enrollment has increased from 62,424 in 2002/03 to 67,141 in 2005/06 (Table 2.1), plus an unknown change in private school enrollment. Table 2.11 shows a grade distribution of secondary enrolment by Region which mirrors the age-profile in Figure 2.4. Regions are ranked by their total secondary enrollment, from over 17,000 in R11 (Georgetown) to less than one thousand in Region 8.
2.44 On a number of measures, Region 2 out-performs the rest of Guyana – in Table 2.11 this is evident in it having 13.8% of secondary enrollment in Grade 11, higher than Georgetown at 11% and the national average 10.1%. It also has a high proportion of girls continuing (53.6% in Region 8 is the same, but it has very few students and, as noted elsewhere, boys are underrepresented in Region 8 schools).
Table 2.11: Secondary Students by Grade, Type of School and Region, 2005/06 Region G07 G08 G09 G10 G11 G12 Male Fmale Total %G11 %F Schools SizeR11 4629 4349 3550 3081 1933 365 8408 9169 17577 11.0% 52.2% 32 549R06 2776 2504 1998 1808 1131 59 4983 5293 10276 11.0% 51.5% 30 343R04 2496 2201 1766 1203 673 96 4211 4224 8435 8.0% 50.1% 44 192R03 2232 2035 1577 1322 881 0 4062 3999 8060 10.9% 49.6% 36 224R05 1381 1152 1021 898 601 0 2534 2519 5053 11.9% 49.9% 26 194R02 1400 1271 802 812 685 0 2305 2665 4970 13.8% 53.6% 27 184R10 1280 1088 840 804 365 52 2313 2487 4800 7.6% 51.8% 25 192R09 768 705 603 348 126 4 1340 1214 2554 4.9% 47.5% 42 61R01 856 579 502 260 80 0 1137 1207 2344 3.4% 51.5% 40 59R07 427 428 389 352 202 0 894 904 1798 11.2% 50.3% 18 100R08 296 194 174 135 31 0 385 445 830 3.7% 53.6% 18 46Total 18541 16506 13222 11023 6708 576 32572 34126 66697 10.1% 51.2% 338 197Source: MOE Statistical Digests. Note higher Grade 11 share in Region 2 (old gold shading)
2.45 Region 2 appears to have achieved higher participation and CXC results above the Guyana average even though the Region 2 schools have an average enrollment of only 184 students. Further study of success in Region 2 may help other Regions improve their performance and move towards USE.

23
2.46 USE 2008-2012 should aim at moving regional profiles in Figure 2.4 higher and to the right. The USE challenge is to identify the initiatives (by government, by the community, and by the international community) to lift national performance higher at each step - especially from Grade 8 to Grade 9 and Grade 9 to Grade 10. Inclusion of private schools and colleges would lift national performance, as would the inclusion of students who continue in technical education.
Figure 2.4:
Students by Grade by Region
R11
R06
R10
R08
0
500
1000
1500
2000
2500
3000
3500
4000
4500
5000
G07 G08 G09 G10 G11 G12
Enr
olle
d20
05/0
6
R11 R06 R04 R03 R05 R02
R10 R09 R01 R07 R08
USE Strategy and Recommendations 2.47 The Ministry should monitor age-structure of primary and secondary enrollment, noting
gender and regional variations, with attention to attrition between primary and secondary. Understanding who discontinues is the first step towards strategies to improve transition.
2.48 The Ministry should analyze progression from Grade 6 in one year to Grade 7 the
following year, with attention to regional differences, gender differences and placement by type of secondary school (i.e. placed in Primary Tops, CHS, GSS in same region and GSS in other regions). Discussion these trends with Regional Departments could improve placement.
2.49 Differences in grade repetition rates suggest that primary schools in some Regions may
promote Grade 6 students to Grade 7 without the competencies to perform in Grade 7. If this accounts for high levels of Grade 7 repetition in Regions 1, 3, 8, 9, 10 and 11, Regional Departments should examine how to improve Grade 6 student competencies.

24
2.50 The maximum age of SSEE entry should be reexamined, so that no students are kept in Primary Tops because they were “too old” to undertake SSEE.
2.51 NCERD (and the Ministry) should analyze differences in SSEE participation rates by
region and by gender, and differences in SSEE performance by region. In Chapter 4, it is recommended that NCERD examine differences in SSEE performance, especially regional differences in specific competencies in English language and in Math. Analysis of performance by size of school should be considered. Teacher retraining and professional development should target competencies which require strengthening.
2.52 If seasonal variations in student attendance are monitored, consideration could be given
to adjusting school terms to minimize time lost due to seasonal flooding and high river levels.
2.53 Guyana should examine a 90% attendance rate in Grades 10 and 11 as a requirement for
CXC candidature. The objective should be to improve attendance not exclude students from candidature.
2.54 Secondary completion rates (using G11/G7 ratios or CXC Entries as a percentage of G7
enrollment four years earlier) should be monitored by communities and regions so that high attrition is identified, reasons are examined and local action taken to reduce attrition.
2.55 Chapter 7 examines USE strategies and the following five elements in the demand for
secondary education places:
� Demand flowing from age-structure of the population, improved primary education participation, improved primary school learning outcomes, access issues in hinterland regions, improved transition from primary to secondary schools, and student placement/migration to Georgetown schools;
� Demand if CHS ÆGSS and Tops Æ GSS improve completion/transfers;
� Demand if secondary school attendance rates improve, and Grade 7 repetition is reduced. This may not increase aggregate demand, but will compete with new enrollments for available teachers and classroom places;
� Demand, estimate of new enrollments in private schools which potentially reduce demand for places in public secondary schools;
� Demand, clarifying links between secondary schools, Practical Training Centers, technical education and commercial/business colleges which potentially reduce demand for places in secondary schools.
Attachment E provides further detail on demand and supply issues and assumptions. 2.56 Many of these elements are beyond the direct control of the Ministry, and an initiative in
one area may be offset by other changes – success in the Fast Track Initiative, for example, should improve primary completion rates in Hinterland Regions, but will also require an expansion in secondary school places which are accessible to students and acceptable to the Amerindian communities. USE requires a strategy to provide sufficient secondary places with staffing by qualified and experienced teachers to meet improved demand from FTI activities.

25
Chapter 3: Upgrading and Qualifying Teachers 3.1 Secondary teachers are the link between students and the curriculum, drawing on their
qualifications, training and experience to enrich student learning and understanding, and to prepare students for formal examinations. The number of teachers required by a school depends on enrollment, class size standards, the way the secondary curriculum is divided into subjects, and the maximum teaching hours per subject per week. Student/Teacher Ratios (STR) are an outcome of the staffing process based on the above factors36.
3.2 Guyana faces three strategic problems in managing the supply of trained teachers:
(1) For schools with fewer than 300 secondary students, providing trained teachers qualified to teach in the required subjects is a recurring problem. Most Primary Tops and small secondary schools are located in hinterland regions which are difficult to staff, staff are difficult to retain, and tend to employ more unqualified/untrained teachers;
(2) Guyana cannot reduce its dependence on untrained teachers while it has a shortage of teachers and it continues to recruit untrained teachers to replace qualified and experienced teachers who leave the public system; and
(3) There appears to have been no improvement in issues (1) and (2) over the past decade. Recommendations prior to the USE 2003-2007 Plan based on 1997/98 teacher qualifications data appear just as applicable to USE 2008-2012 based on 2005/06 data.
Primary-Secondary TransitionMain issue: From the quality perspective, this is the key issue upon which the success of the change to a unified system will hinge. In 1997/1998 the percentage of trained teachers was 50%.37 The goal under the National Development Strategy is for 80% of all teachers to be trained by 2010. See Table Five for specific data from the ‘1997-1998 Education Statistics’ that illustrates the severity of the problem:
Type of secondary schools # of
teachers # of trained
teachers
% of teacher population that
is trained Secondary departments in Primary Schools 669 335 50
Community High Schools 615 343 51
Government Secondary Schools 1744 1004 58 Total (1997/98) 3028 1682 56
Suggested inputs: The professional development needs of USE cannot be tackled in isolation from the other sub-sectors. It is recommended that a ten year Education Professional Development Plan (EPDP) be drawn up and that the goals and targets developed under this EPDP are incorporated as a sub component of the GOG overall Education Development Plan (2001-2006). This Plan will need to provide the following: (i) agreement on the basic minimum professional qualifications for those teaching within each
sub-sector; (ii) recommendations regarding the qualifications and realistic salaries for specialist educators (e.g.
advisory teachers; inspectors; principals; heads of department); (iii) define norms and standards that will govern the work, conduct and performance of educators; (iv) set a deadline for the elimination of unqualified teachers within the Form 1 through 5 classes; (v) integrate in-service and pre-service courses (certification and delivery) across UG, CPCE and
NCERD.
Source: Latham M, Final Report Nov Revised, 2000: 15-16
36 STR are not a resource allocation mechanism, but provide a summary measure of resource usage. 37 The 2000 Report quoted 60% of hinterland teachers as “trained” in 1997/98. “Untrained” is more likely.

26
3.3 Most of the issues identified in report by Latham (2002) still apply – Table 3.1 compares data for 2005/2006, success in upgrading secondary education in GSS expansion, more students (+9.6%), an increase in mean GSS size (525 to 580), and a fewer Primary “Tops” and CHS enrollment. Quality may not have matched the expanded quantity – the percentage trained teachers has declined from 55.5% to 53.7%, the STR declined from 20.2 to 19.5, and STTR38 remained unchanged at 36.4.
Table 3.1: Secondary Teachers in 2005/06 and change since 1997/98
Type of Secondary Schools Teachers Trained Teachers
Percent Trained
Schools Students
Primary Tops 459 202 44 244 10,300Community High Schools 499 243 49 24 9,256General Secondary Schools 2479 1399 56 82 47,585Total Secondary (2005/06) 3437 1844 53.7 350 67,141Change 1997/98 to 2005/06 (a) Primary Tops -210 -133 -63.3 -68 -2,862Community High Schools -116 -100 -86.2 -12 -3,165General Secondary Schools +735 +395 +53.7 +14 +11,915All Secondary +409 +162 +39.6 -66 +5,888Source: MOE Statistical Digests; (a) “trained” marginal rate of change (absolute change -1.8%).
3.4 There are some related issues: In developing the new Education Act, its teacher employment requirements should be strengthened – establish post-secondary education and training as the (desirable) requirement for new Primary teachers and a university qualification in their subject area/s for new Secondary teachers39.
3.5 Secondary schools require teachers who are “trained” teachers and “qualified” in the subject being taught. A “trained” primary teacher who teaches secondary math but has no subject specific math training or a graduate teacher with a university degree in a different subject area may not meet their students’ needs.
3.6 Analysis undertaken for this Review suggests that the supply of qualified subject specialists
with teacher training for their subject is considerably below the 53.7% trained secondary teachers reported. Each Region requires an audit of secondary teacher qualifications, experience and skills against the classes and subjects that they are teaching. This audit could be linked to targeted recruitment and the development of Regional training plans.
3.7 Achieving USE will require a program to provide in-service training for qualified but
untrained teachers and to examine incentives to encourage unqualified teachers to become qualified, such as formal recognition of Escuela Nueva and multi-grade teaching initiatives as teacher “training” and as credit towards a teaching qualification for unqualified teachers.
3.8 In parallel with recruitment and qualifications issues, the Ministry requires better
information on levels of teacher attendance.40 In Chapter 2, improving student attendance is a step towards improving learning outcomes, so any USE strategy should target at least 95% teacher attendance to strengthen learning quality.
38 STTR is Students per Trained Teacher 39 The proposed Act defines the rights and responsibilities of students and teachers, but does not appear to define the rights, responsibilities and duties of teachers (and principals). 40 There is no reported data or analysis of teacher attendance.

27
3.9 In Table 3.1, secondary student numbers increased by 5,888 since 1997/98, secondary teachers by 409 but trained teachers by only 162. Table 3.2 points to broad stability in teacher numbers without improvement in the proportions trained. Trained teacher share depends on which teachers leave the public school system and which teachers are recruited. The percentage trained “improves” if more untrained teachers leave, and vice-versa.
Table 3.2 Trend in Teacher numbers and Trained Teachers, by level of schooling TEACHERS 2001/02 2002/03 2003/04 2004/05 2005/06
Nursery 2279 2190 2103 1958 1992Primary 4243 4098 4069 4013 4043Primary Top 602 606 529 464 459Community HS 505 566 531 510 499General SS 2501 2556 2541 2421 2479Total Public 9528 10016 9773 9366 9472
TRAINED 2001/02 2002/03 2003/04 2004/05 2005/06 Nursery 971 1014 993 959 998Primary 2324 2346 2273 2291 2326 Primary Top 297 286 240 199 202Community HS 244 271 247 240 243General SS 1396 1444 1411 1351 1399Total Secondary 1937 2001 1898 1790 1844Total Public 5232 5361 5164 5040 5168Percentage Public School Teachers Trained Nursery 42.6% 46.3% 47.2% 49.0% 50.1%Primary 54.8% 57.2% 55.9% 57.1% 57.5%Secondary 53.7% 53.7% 52.7% 52.7% 53.7%Source: MOE Statistical Digests (including unpublished draft 2005/06 data);
3.10 Between 2003/04 and 2005/06, teachers in Primary Tops declined by 70, the number of trained teachers declined by 38, so the Primary Tops proportion declined from 49% to 43%. CHS remained 48%-47% and the GSS proportion trained remained unchanged about 56%.
Staffing Small Secondary Schools
3.11 Guyana differs from more densely settled/more urban countries in its dependence on untrained teachers to staff many schools, and the persistence of “primary tops” to provide students in rural areas with access to some secondary education. Table 3.3 shows school enrollment, school type and the proportion of secondary teachers who are “trained”.
3.12 As noted at Table 1.4 in Chapter 1, there is a direct relationship between school “size”, school type and the proportion of teachers “trained”:
• More than half the teachers in schools with <300 secondary students are untrained, with most Primary Tops with <50 students having only 45% trained teachers. Smaller CHS also have a majority of untrained teachers. Between 300 and 600 students, the one large Primary Top and several CHS have less than 50% trained, while GSS average more than 55%. Between 600 and 900, GSS teachers trained average around 60% and GSS over 900 students average two-thirds teachers trained.
• Above some 300-400 students, total teacher numbers are linked closely to student
enrollment and the student teacher ratio (STR) is more stable, with only small increases with increasing enrollment. The proportion of “trained” teachers stabilizes between 50%

28
and 60%. This stability may be an illusion – it is a contrast between mostly GSS (+larger CHS) and Primary Tops (mostly <50 students and all less than 300).
3.13 Table 3.3 points to an organizational “boundary” for schools above/below 300 students, with percentage teachers trained less than 50% (green cells). Between 301 and 600, the percentage trained generally 50-60% for a mix of CHS and GSS, while in the 9 GSS above 850 students, two-thirds or more of the teachers are trained41. For all secondary schools <300 students, less than half the teachers are trained, less than 10% are trained graduates and, upper secondary students represent less than 20% of enrollment.
Table 3.3: Guyana Secondary Teachers 2005/06 by Percent Trained, School Type and Size
Size /50 Schools
Students
Enrolled
STR TrainedTeacher
s
Total Teacher
s
percentTrained
Primary
Tops CHS GSS
1 141 2700 12.2 100 221 45 45 43
51 34 2518 25.7 35 98 36 36 31
101 10 1140 28.5 24 40 60 64 25
151 11 1893 19.5 44 97 45 54 36 31
201 10 2235 19.6 54 114 47 39 54 50
251 4 1079 21.6 22 50 44 50 42
301 4 1366 19.5 40 70 57 60 56
351 13 4834 19.0 136 255 53 40 55 55
401 10 4256 17.7 121 240 50 39 54
451 7 3372 19.8 97 170 57 53 63
501 10 5266 20.8 135 253 53 48 56
551 11 6297 19.6 172 321 54 44 55
601 7 4397 19.5 147 226 65 65
651 6 3986 19.7 114 202 56 56
701 12 8594 21.6 207 398 52 52
751 4 3110 23.2 86 134 64 64
801 1 812 33.8 13 24 54 54
851 4 3478 20.7 111 168 66 66
901 2 1842 25.6 39 72 54 54
951 1 988 23.0 32 43 74 74
1001 1 1040 24.2 31 43 72 72 1051 1 1080 27.7 36 39 92 92
304 66283 20.2 1796 3278 55 46 48 58 Source: MOE Statistics. (GY0506S_x004_Type.sql 9 December 2007) See Attachment D4. Excludes 28 Primary Tops where teachers are reported in Primary. 3.14 The broad relationship between enrollment and staffing above 300 students is presented
in Table 3.4 as a matrix of enrollment (rows) and teachers per school (columns), with the number of schools the value in each cell. The shading of the cells makes the table into a “graph” showing effective staffing ratios, and the above-300/below-300 boundary described above. Cells with 4 or more schools are shaded “gold” and the number in bold and cells with 1-3 schools shaded “tan”.
41 In Attachment D4 similar data are presented with schools grouped by enrollment in 150 student bands. Grade 10-12 students are more than 30% of total enrollment in GSS>300 students, and Trained Graduate teachers more than 10% of all teachers in secondary schools with 301-750 students.

29
3.15 A column showing percent teachers trained is included (Primary tops and CHS<300 students have more “untrained” teachers, GSS> 300 students have a majority of “trained” teachers), as well as a column showing the average number of teachers per school.
Table 3.4: Matrix of Secondary Schools by Enrollment (“size”) and Teachers per School
Number of Teachers per school
Type SIZE Sc
hool
s
Tot
alT
each
ers
perc
ent
Tra
ined
Tea
cher
s/S
choo
l
<5 5 10 15 20 25 30 35 40+
3GSS >900 5 197 70% 39 0 0 0 0 0 1 0 1 33GSS 801 5 192 65% 38 0 0 0 0 1 0 1 1 23GSS 701 16 532 55% 33 0 0 0 0 2 5 3 4 23GSS 601 13 428 61% 33 0 0 0 0 1 4 3 4 13GSS 501 15 449 55% 30 0 0 0 0 5 4 1 4 12CHS 501 6 125 46% 21 0 0 0 3 3 0 0 0 03GSS 401 11 256 56% 23 0 0 2 1 5 2 1 0 02CHS 401 6 154 48% 26 0 0 0 1 2 1 2 0 03GSS 301 11 223 55% 20 0 1 1 4 3 2 0 0 02CHS 301 4 77 56% 19 0 0 1 2 1 0 0 0 01PTop 301 2 25 40% 13 1 0 0 0 1 0 0 0 03GSS 201 3 38 50% 13 0 0 3 0 0 0 0 0 02CHS 201 5 71 48% 14 1 0 2 2 0 0 0 0 01PTop 201 6 55 42% 9 1 3 2 0 0 0 0 0 03GSS 151 2 26 31% 13 0 1 0 1 0 0 0 0 02CHS 151 1 14 36% 14 0 0 1 0 0 0 0 0 01PTop 151 8 57 54% 7 3 3 2 0 0 0 0 0 03GSS 101 1 4 25% 4 1 0 0 0 0 0 0 0 01PTop 101 9 36 64% 4 9 0 0 0 0 0 0 0 02CHS 51 1 13 31% 13 0 0 1 0 0 0 0 0 01PTop 51 32 82 38% 3 30 2 0 0 0 0 0 0 02CHS 26 1 7 43% 7 0 1 0 0 0 0 0 0 01PTop 26 43 101 46% 2 41 1 0 0 0 0 1* 0 0
1PTop 1 98 116 44% 1 98 0 0 0 0 0 0 0 0
GUYANA 304 3278 55% 11 185 12 15 14 24 19 12 14 93GSS 82 2345 58% 29 1 2 6 6 17 18 9 14 92CHS 24 461 48% 19 1 1 5 8 6 1 2 0 0
1PTop 198 472 46% 2 183 9 4 0 1 0 1 0 0Source: MOE Statistics 2005/06; *School with 2 Top teachers reports 30+ Primary Teachers.
3.16 It is recommended that the Ministry identify the minimum number of (trained and qualified) teachers a school requires to offer a viable range of subjects leading to CXC or the Basic Competency Certificate Program. If a “viable” secondary school requires >300 students and 15+ teachers, the challenge is how to deliver secondary education to students in most Primary Tops and about half the CHS which may fall below this “standard”.

30
Staffing Schools with Trained/Qualified Teachers
3.17 The analysis for this Review was to identify how secondary education functions in Guyana so that strategies to achieve universal secondary education can be examined and costed. There are three levels of teacher data – (1) aggregated data reported in annual MOE Statistical Bulletins, (2) school level summary reports which contribute to (1), and (3) unit record teacher data. Table 3.4 used level-2 data for 334 schools, excluding 16 Primary Tops with “no teachers”42. The following analysis used unit-record data (level-3) from the MOE Planning Department for 3297 secondary teachers.
3.18 MOE teacher status43 is abbreviated in Table 3.5 and a separate field (sex) created to identify female teachers so that no data are lost. Light green shading in Table 3.5 approximates the “trained” status in aggregate MOE statistics. Status is a variable attribute of a teacher – a teacher can become “trained” and, less frequently, become “qualified”.
Table 3.5: Secondary Teachers 2005/06 by Status and by Region and Gender44
Status (Master=Mistress)
meanAGE N=
R1789 Female
R1789 Male
R2560 Female
R2560 Male
R3411 Female
R3411 Male
Headmaster 49 119 5 22 18 18 36 20
Deputy Head 49 67 18 13 26 10
Head of Department 40 401 3 8 119 57 153 61
Senior Master 42 210 7 2 50 29 101 21
Senior Assistant Master 40 76 1 24 5 38 8
Assistant Master 29 916 47 40 282 102 340 105
Teacher Aide (Trained) 42 1 1
Temporary Qualified Master 22 1 1
Temporary Assistant Master 53 15 1 1 9 4
TRAINED (A1:B3) 1806 63 73 511 225 705 229
Assistant Master 32 1 1
Head of Department 34 3 1 2
Temporary Assistant Master 43 3 3
Temporary Qualified Master 26 578 13 13 126 91 208 127
Untrained Graduate 33 149 2 17 17 75 38
Temporary Unqualified Master 26 301 14 14 86 34 111 42
Acting Teacher 33 331 33 27 79 31 117 44
Part Time Teacher 44 10 2 2 2 4
Junior Teacher 26 7 7
Pupil Teacher 19 79 9 8 32 11 15 4
Teacher Aide 35 28 14 11 3
Teacher-in-charge 28 1 1
UNTRAINED (B4:C3) 1491 83 77 340 187 543 261
SECONDARY TEACHERS 3297 146 150 851 412 1248 490Percentage Trained 54.8% 43.2% 48.7% 60.1% 54.6% 56.5% 46.7%
Source: MOE statistical data for 3297 Secondary teachers in 2005/06. (STeach_StatusReg3.sql) (Teachers.XLS) Data for 3,297 teachers is 140 fewer than the 3,437 in the draft 2005/06 Statistical Digest.
42 These Primary Tops had secondary classes are staffed by primary teachers. 43 “/Mistress” removed from the field descriptions. Annual school level reports used in the Statistical Digests mirror previous year data and may lag behind the salary status upon which teachers are paid. 44 Attachment F shows distribution by individual Regions 01-11.

31
3.19 More than half of the secondary teachers in Guyana are “trained” teachers (54.8%), being as high 68% in Region 2 and 75%45 in Region 7. At the other extreme, only 23% in Region 8 are trained, 37% in Region 9 and 45% in Region 1. In aggregate, only 46% of Hinterland secondary teachers are trained (Females 43%; Males 49%).
3.20 If USE is to be achieved and results in CXC examinations are to be improved, training existing teachers is more immediate and more cost effective than strategies which attempt to recruit new trained teachers.
3.21 Of those “untrained”, many of 578 “Temporary Qualified Masters” and 147 Untrained Graduates could become trained through external/distance units of study, short vacation courses and credit for effective teaching experience. Achieving trained status through full-time formal study is not a viable option – it is of no immediate use to the classroom teacher, it takes too long, it is too expensive to pay teachers during training and to pay for replacement teachers, especially if rural teachers have to attend University of Guyana or Charles Potter College of Education.
3.22 The highest proportion untrained is aged 16-30 (Table 3.6: 19% trained) – to target this group for training would have the dual benefit of encouraging them to remain in teaching and improve the quality of student learning. The largest numbers untrained are aged 31-45, and targeted training would encourage them to remain in teaching.46
Table 3.6: Summary of Teachers Trained/Untrained by Sex and Age (2005) Status and Sex Teachers n.s. 16-30 31-45 46-60 61+
Females Trained 1279 85 100 677 381 36Males Trained 527 36 22 244 189 36Females Untrained 966 93 360 403 92 18Males Untrained 525 36 171 236 63 19
Secondary Teachers 3297 250 653 1560 725 109Females %Trained 57% 48% 22% 63% 81% 67%Males % Trained 50% 50% 11% 51% 75% 65%
Total %Trained 54.8% 48% 19% 59% 79% 66%Source: MOE Statistics. Source: Steach_StatusRegion_bsex.sql
3.23 The “trained/ untrained” distinction may make the staffing situation appear more grim than necessary. Table 3.7 used unit record teacher data to identify teachers with some academic qualification but no teaching qualification.
Table 3.7: Secondary Teachers by Professional Qualification and Age in 2005
Prof47 Age N= NS 16 21 26 31 36 41 46 51 56 61+ MBD 39 220 7% 17 22 34 25 31 50 32 6 3TTC 33 1586 48% 105 15 256 391 236 119 132 170 144 12 6UNO 25 1268 38% 121 231 417 236 97 44 37 37 35 8 5UNT 32 223 7% 7 3 51 63 29 25 18 13 9 3 2
3297 250 249 724 712 396 213 218 270 220 29 16Source: MOE teacher data; Attachment F (Tch56_X005.xls) “Age” is the mean for teachers in the row.
45 Bartica Secondary School has 92% trained and it accounts for 39/63 of Region 7 secondary teachers 46 Years of untrained service warrants MOE examination (it was not in the data set used for this Review). 47 MBD=Masters, Bachelors, Diploma, TTC=Trained Teacher Certificate, UNO= Untrained with Other qualification, UNT= neither qualification nor teacher training.

32
3.24 Some 55% of secondary teachers in Table 3.7 have a professional teaching qualifications (Masters, Bachelor or Diploma in Education, shown as MBD) or with a Teacher Training Certificate (TTC). “Untrained” teachers have been subdivided between 38% of teachers with some qualification but “untrained” (UNO) and teachers with neither an academic qualification nor any teacher training (UNT 7%).
3.25 Most UNO are under 26 years-of-age (shaded tan in Table 3.7). In-service training which
leads to a teaching qualification for this UNO group should improve teaching, encourage teachers to remain in the profession and contribute to the overall USE strategy. This is a potential target for school-based, region-based in-service training to upgrade these teachers to “trained” status. The first objective of in-service should be to improve teaching and learning, but improving reported qualifications also demonstrate national commitment to better quality education.48
3.26 Untrained/Unqualified 7% understates the problem in Hinterland regions (26%), in Primary Tops (22%) and where teaching subject is not stated (12%). As noted at paragraph 3.5, the quality of secondary education depends not only on the “trained/untrained” distinction, but also on whether teachers are “trained” in subjects they are teaching. 49
3.27 For a school to offer a viable secondary curriculum – up to CXC in Grade 11 – it requires teachers with the knowledge and skills to prepare students in CXC subjects. This is at the core of the USE 2003-2007 rationale to upgrade Community High Schools to General Secondary Schools and to consolidate Primary Tops into GSS. Some upgrading and consolidation was achieved through the Secondary Schools Rehabilitation Project (SSRP), the Guyana Education Access Project (GEAP) and the Basic Education Access and Management Support (BEAMS) Project. In Chapter 5 (Schools and Infrastructure), the contribution of these projects to creating new secondary school places is reviewed.
3.28 The curriculum component in upgrading CHS and consolidating Primary Tops is captured
in Table 3.8 and in Figure 3.1. Teachers with English as their first or second teaching subject are shown as “English (1,2)” and Math teachers as “Math (1,2)”. To avoid any understatement of Math teachers, any English teacher who also teaches Math is counted as a “Math” teacher.
3.29 The school size “boundary” about 300 students identified in Table 3.4 is reinforced by
the subjects offered in Table 3.8. Below 300 students, most Primary Tops and CHS have few subject teachers, especially in English and Math. Classes are taught by general teachers with Primary training and possibly no teaching training. Above 400 students, specialist subject teachers are the norm50.
3.30 Figure 3.1 plots the distribution of English teachers (red line) and Math teachers (yellow diamond on solid black line) against schools ranked by mean enrollment (pink squares on blue diagonal line sloping from left to right). The thin blue line represents average number of teachers per school (against the right hand scale) – so schools 800 and above average around 40 teachers per school or a STR around 20:1.
48 An audit of teaching qualifications (see paragraph 3.6) would be an appropriate starting point. 49 School data used for Table 3.4 does not include “subject” (which is an attribute of teacher, but it may vary from year to year – and many secondary teachers teach more than one subject). 50 This “boundary” effect may be exaggerated because data on subjects is not reported in all school returns. Analysis using teaching subject data may encourage better reporting by schools to MOE.

33
Table 3.8 Secondary Teachers by School Type, Size and Teaching Subject
GCP SIZE meansize
mean teachers/school
Total Teachers
ENGLISH(1,2)
MATH(1,2)
Other Subjects
None /Not
Stated SE 901 995 40.4 196 27 25 89 55
SE 801 859 40.0 208 37 27 121 23
SE 701 733 34.5 527 75 63 221 168
SE 601 645 33.7 439 58 52 214 115
SE 501 555 31.4 447 67 51 199 130
CH 501 547 22.3 109 19 16 47 27
SE 401 441 24.8 254 45 34 121 54
CH 401 478 25.0 121 23 20 59 19
SE 301 365 22.1 234 36 31 96 71
PR 301 351 21.1 22 2 5 8 7
CH 301 371 19.6 77 13 13 37 14
SE 201 210 12.9 38 10 7 17 4
PR 201 236 10.4 55 7 12 16 20
CH 201 245 17.1 81 12 19 39 11
SE 151 188 9.0 9 1 1 0 7
PR 151 172 8.3 57 8 8 19 22
CH 151 166 14.0 14 3 2 9 0
SE 101 102 4.0 4 1 1 2 0
PR 101 115 4.1 36 4 4 6 22
PR 051 76 3.5 83 3 5 12 63
CH 051 76 13.0 12 3 3 1 5
PR 026 37 3.1 71 2 0 10 59
CH 026 30 7.0 7 2 0 3 2
PR 001 12 1.4 112 0 3 3 106
3213 458 402 1349 1004Source: MOE Teacher data from 2005/06 school returns (TCH56_XCode02.sql 15 Dec 2007)
3.31 In addition to showing English and Math teachers, Figure 3.1 includes the percentage of teachers in subjects other than English and Math (lime green diamonds) and the percentage of teachers with no subject specialty or not stated (bright green circles). For schools with fewer than 200 students, subject teachers “disappear”, and dotted black trend line summarizes the distribution of “No-specialty”/Not stated” subjects. The bright green circles are highly correlated with school “size” (R2=0.79 or a 0.89 correlation).
3.32 Table 3.9 condenses data in Table 3.8 by Type of School and the percentage distribution of teachers by subject. GSS have 15% of teachers teaching English, 12% teaching Math and 46% in Other Subjects. CHS report higher proportions of English (18%) and Math (17%). Primary Tops have a markedly different profile – English teachers (only 6%) and Math teachers (9%) but 68% as “no subject”, “all subjects” or “not stated”.
3.33 The same data are reported by Region in Table 3.10, with the differing mixes of secondary schools. Hinterland Regions (1, 7, 8&9) have many small Primary Tops and 11 GSS, only 19 Math teachers (6.5% of secondary teachers) and 60% general teachers with no specific subject. Other rural regions (2, 5, 6 &10) outside the more densely settled region (3, 4) around Georgetown (11) have a similar average profile. Regions 2, 5, 6 and 10 have many

34
Primary Tops, GSS and few CHS. Georgetown and its neighboring regions have half Guyana’s GSS, 18/24 CHS and some Primary Tops. USE requires the conversion of the 7 remaining CHS in Georgetown to GSS and this will require a substantial increase in the numbers of teachers trained in relevant subjects/disciplines.
Figure 3.1
Teaching Subjects by Secondary School Size, 2005/06
R2 = 0.79
0
100
200
300
400
500
600
700
800
900
1000
901 801 701 601 501 501 401 401 301 301 301 201 201 201 151 101 051 026 001
SE SE SE SE SE CH SE CH SE PR CH SE PR CH PR PR PR PR PR
mea
msi
ze;
tota
lte
ach
ers
0
10
20
30
40
50
60
70
80
90
100
mea
nte
ach
ers;
%b
ysu
bje
ct
meansize
teachers/school
PercentENGLISH
PercentMATH
%OtherSubjects
%None %NS
none/ns against size
Source: See Teacher_Subject by school size.xls
Table 3.9: Subject Teachers by Secondary School Type ENGLISH
(1,2) MATH
(1,2) Other
Subjects None/ Not
Stated Total
Teachers GSS 357 292 1080 627 2356CHS 75 73 195 78 421Primary Tops 27 39 78 303 447
Guyana 459 404 1353 1008 3224GSS 15.2% 12.4% 45.8% 26.6% 100% CHS 17.8% 17.3% 46.3% 18.5% 100%
Primary Tops 6.0% 8.7% 17.4% 67.8% 100%
Guyana 14.2% 12.5% 42.0% 31.3% 100%
Source: MOE Teacher data 2005/06. TCH56_XCode03.sql (15 Dec 2007)

35
Table 3.10: Subject Teachers by Regional Grouping
Regions ENGLISH
(1,2) MATH
(1,2) Other
Subjects None
n.s. Total
Teachers
Regions 1, 7, 8, 9 31 19 67 174 291Regions 2, 5, 6, 10 178 165 531 370 1244Regions 3, 4, 11 250 220 755 464 1689
Guyana 459 404 1353 1008 3224Regions 1, 7, 8, 9 10.7% 6.5% 23.0% 59.8% 100% Regions 2, 5, 6, 10 14.3% 13.3% 42.7% 29.7% 100%
Regions 3, 4, 11 14.8% 13.0% 44.7% 27.5% 100%
Guyana 14.2% 12.5% 42.0% 31.3% 100%
Source: MOE Teacher data 2005/06. TCH56_XCode04.sql (15 Dec 2007)
3.34 Beyond these “descriptions” of teachers by subject specialty in Tables 3.8-3.10, quality learning requires qualified teachers in each subject discipline. With 55% of all secondary teachers “trained” (Tables 3.4-3.6), Table 3.11 reports trained teacher status by subject area and school type. General Secondary Schools have higher overall trained teachers, especially in English (67%), Math (64%) and other subjects (61%). Community High Schools have more untrained teachers in subjects other Math.
Table 3.11: Subject Teachers by School Type and Trained Status
Type Statuscode Teachers
English(1,2)
Math (1,2)
Other Subjects
None /n.s.
Trained GSS A,B 1376 240 187 658 291Untrained GSS B4,C 980 117 105 422 336
%Trained GSS 58.4 67.2 64.0 60.9 46.4Trained CHS A,B 207 40 44 95 28Untrained CHS B4,C 214 35 29 100 50
%Trained CHS 49.2 53.3 60.3 48.7 35.9Trained Ptop A,B 195 21 25 25 124Untrained Ptop B4,C 252 6 14 53 179
%Trained Ptop 43.6 77.8 64.1 32.1 40.9Trained All A,B 1778 301 256 778 443Untrained Schools B4,C 1446 158 148 575 565
%Trained 55.1 65.6 63.4 57.5 43.9Source: MOE data. Attachment F 51.
3.35 In Primary tops, the problem may not be the qualification of Math and English teachers but there are too few specialist Math and English teachers. With Primary Tops concentrated in Hinterland regions (R1,7,8&9), there are only 19/291 trained teachers teaching Math, but they may not be “trained” to teach Math! Almost 41% of Primary Top teachers with no or not stated teaching area are untrained.
51 Status code A includes Heads, Deputies, Senior Masters and Heads of Departments. Code B (except B4) are trained teachers, B4 are mostly untrained graduates and qualified but untrained teachers. Code C are mostly unqualified and untrained

36
Table 3.12: Subject Teachers by Region and Trained Status, 2005/06
Region Statuscode
Teachers English
(1,2) Math (1,2)
Other Subjects
None /n.s.
R1,7,8,9 A,B Trained 135 21 12 34 68 B4,C Untrained 156 10 7 33 106
%Trained 46.4 67.7 63.2 50.7 39.1 R2,5,6,10 A,B Trained 725 124 100 335 166
B4,C Untrained 519 54 65 196 204 %Trained 58.3 69.7 60.6 63.1 44.9
R3,4,11 A,B Trained 918 156 144 409 209 B4,C Untrained 771 94 76 346 255
%Trained 54.4 62.4 65.5 54.2 45.0 Guyana A,B Trained 1778 301 256 778 443
B4,C Untrained 1446 158 148 575 565
%Trained 55.1 65.6 63.4 57.5 43.9
3.36 For USE to be effective, Guyana needs to both more trained teachers and more graduate teachers. If the quality of both education and CXC examination results are to improve, Guyana will need more trained graduate teachers in Math and Science. This highlights yet another dilemma confronting Guyana – if Georgetown absorbs more of the better qualified teachers, there will be even fewer available in the rural communities which already lack skilled and experienced teachers.
3.37 As noted at above, the proportion “trained” depends on which teachers leave the school
system and which teachers are recruited. Percentage trained “improves” if more untrained teachers leave, and vice-versa. Table 3.13 reports MOE data for 2005/06 by region (grouped) and by type of secondary school. Guyana has very few graduate teachers (14.8%; two-thirds with a teaching qualification), mostly in GSS in Regions 3, 4 and 11.
Table 3.13 Secondary Teachers by Training/Qualification by Region and School Type Region R1,7,8&9 R2,5,6&10 R3,4&11 Guyana
Type PTop CHS GSS Total PTop CHS GSS Total PTop CHS GSS Total Total
Schools 114 1 9 124 75 5 32 112 53 18 41 112 348
Trained Graduate 2 0 9 11 3 2 90 95 10 40 156 206 312Untrain Graduate 1 1 1 3 0 0 40 40 2 8 121 131 174Trained Qualified 47 2 76 125 78 37 518 633 75 140 511 726 1484Untrain Qualified 32 1 46 79 69 27 322 418 58 162 396 616 1113Untrained 62 0 14 76 22 5 28 55 11 35 17 63 194
Teachers 2005 144 4 146 294 172 72 998 1242 156 385 1201 1742 3278Source: MOE Statistical Bulletin (2005/06 draft). Teacher status at October 2005.

37
3.38 Table 3.14 uses the same data to show net teacher turnover between October 2004 and
October 2005. Net outflow was only 21 teachers or 0.6% of total teachers in 2004. At the school level, turnover of trained teachers is mostly “transfers”. Inflow and Outflow include untrained teachers, but detail is not shown to simplify the table. Attachment F presents the same data in enrollment bands (<300, 301<600, 601+).
Table 3.14 Inflow and Outflows of Teachers by Training/Qualification, 2004-2005 Region R1,7,8&9 R2,5,6&10 R3,4&11 Guyana
Type PTop CHS GSS Total PTop CHS GSS Total PTop CHS GSS Total Total
GT New/ReEmply 0 0 0 0 0 0 1 1 1 0 2 3 4GT Transfers In 2 0 1 3 3 1 14 18 6 8 24 38 59TQ New/ReEmp. 1 0 0 1 0 0 6 6 1 1 6 8 15TQ Transfers In 6 0 5 11 10 2 43 55 21 15 53 89 155INFLOW 31 0 24 55 30 9 149 188 55 41 186 282 525
GT Loss 0 0 0 0 0 0 3 3 0 0 4 4 7GT Transfers Out 0 0 0 0 0 1 14 15 4 4 37 45 60QT Loss 1 0 1 2 1 2 17 20 1 0 3 4 26QT Transfers Out 11 0 10 21 7 4 69 80 10 22 65 97 198
OUTFLOW 39 0 23 62 18 14 194 226 25 48 185 258 546
Teachers 2004 152 4 145 301 131 77 1010 1218 126 392 1200 1718 3237Net Trained -3 0 -5 -8 5 -4 -39 -38 +14 -2 -24 -12 -58
Net Untrained -5 0 +6 +1 7 -1 -6 0 +16 -5 +25 +36 +37 Source: MOE school level data. (Tchr_Loss.XLS; TCH05_003TRF_Region.sql). 3.39 Reported change between October 2004 and October 2005 shows little net change in
Trained Graduates (GT-4), greater losses of Other Qualified Teachers (TQ -54 or 4%) and losses of untrained teachers (Inflow 192-Outflow 254= net loss 62, or 4%).
3.40 The 9 GSS in the Hinterland regions had a net loss of 5 trained teachers and a net gain of 6
untrained teachers. Rural Coastal Regions GSS had a net loss of 39 trained teachers and 6 untrained teachers, while GSS in Regions 3, 4&11 lost 24 trained teachers and gained 26 untrained teachers.
3.41 There may be lags in the way in which education systems respond to changing enrollments.
Table 3.14 shows that the 53 Primary Tops in Regions 3 and 452 had a net increase of 30 teachers between October 2004 and October 2005, when Table 3.15 shows an increase of 331 students enrolled (+11.4%) in the same period. This increase appears to be at the expense of the 15 CHS in Regions 3, 4&11 which declined by 374 students (-7 teachers). GSS in Regions 3, 4&11 had a net gain of only 11 students, and +1 teacher.
52 There are no Primary Tops in Georgetown.

38
Table 3.15 Changes in 2004-2005 Secondary Enrollments by Type of School and Region
Type Region Size Schools Enrolled
2005 Enrolled
2004 Change04-05
%Grades10,11,12
TrainedTeachers
STR
1PTop R1789 1 108 3278 2915 363 13.4% 34.0% 22.761PTop R2560 1 69 2845 2439 406 16.0% 48.3% 19.351PTop R2560 301 2 707 56 651 14.4% 40.0% 28.28
1PTop R3411 1 53 3220 2889 331 8.2% 54.5% 20.642CHS R1789 1 1 287 108 179 8.4% 50.0% 71.752CHS R2560 1 3 407 391 16 37.1% 51.2% 9.932CHS R2560 301 2 861 809 52 16.8% 60.0% 28.702CHS R3411 1 4 848 902 -54 13.6% 38.3% 14.132CHS R3411 301 14 6673 6993 -320 22.3% 48.3% 20.533GSS R1789 1 3 492 520 -28 31.9% 25.0% 17.573GSS R1789 301 5 1972 1879 93 26.3% 53.2% 24.963GSS R1789 901 1 1080 1085 -5 33.2% 92.3% 27.693GSS R2560 1 1 212 180 32 22.2% 50.0% 17.673GSS R2560 301 9 4094 4233 -139 30.5% 56.6% 19.313GSS R2560 601 19 13457 12486 971 30.8% 61.3% 20.363GSS R2560 901 3 2933 2768 165 32.9% 68.1% 25.963GSS R3411 1 2 390 409 -19 6.9% 53.6% 13.933GSS R3411 301 23 11084 11146 -62 33.1% 55.6% 17.403GSS R3411 601 15 10920 10827 93 34.3% 55.6% 22.24
3GSS R3411 901 1 937 937 0 25.6% 55.6% 20.82
338 66697 63972 2725 27.4% 54.8% 20.35Source: MOE school level data. Attachment F (Tchr_Loss.XLS; TCH05_003TRF_Size300.sql). 3.42 Minimizing attrition should be a strategic USE issue. Every teacher retained (and every
untrained teacher trained) is one less teacher that has to be recruited. The Ministry and Regional Departments should note with concern that GSS in Regions 3, 4&11 lost 24 trained teachers and gained 25 untrained teachers. Tables 3.13 and 3.14 are based on analysis on only 2004/2005 changes – similar analysis for more years could help the Ministry and Regions to target areas of greatest attrition.
3.43 Analysis of enrollment and staffing data over several years would also provide an
understanding of USE implementation and the lags between enrollment and staffing.
Staffing is a Size of School Issue
3.44 Tables 3.4 and 3.8 above show staff allocation issue linked closely to size of school. Without a formula which ensures adequate staffing, small one or two teacher Primary Tops do not appear to be viable educational institutions, especially if combined with low student attendance rates reported in Chapter 2. Small schools in Table 3.16 have the least trained teachers, especially for the majority of small schools in Hinterland Regions. Table 3.17 presents the “subject” dimension (see also Figure 3.1)
3.45 USE 2003-2007 Objective 6 requiring amalgamation of Tops into discrete General
Secondary Schools may be the most difficult of all USE objectives. Identifying a central location with sufficient students to operate a viable secondary school will remain a problem.

39
It may be feasible in Region 4, but is unlikely in Region 9, where the three existing GSS have fewer than 300 students.
Table 3.16: Percentage of trained teachers by Subject and Size of School
Guyana R1789 Percent R2560 percent R3411 Percent SIZE Teachers Teachers Trained Teachers Trained Teachers Trained <200 405 155 34.2% 143 46.2% 107 50.5% 201 507 47 42.6% 150 54.0% 310 54.5% 401 931 49 53.1% 155 55.5% 727 54.3% 601 966 0 0.0% 587 57.8% 379 53.8% 801+ 404 39 92.3% 199 71.4% 166 57.8%
3213 290 46.6% 1234 58.5% 1689 54.4% Source: MOE Teacher Data, 2005/06 (Tch56_X005.XLS)
Table 3.17: Percentage of trained teachers by Subject and Size of School
Size Total Teachers
EnglishTeachers
English percent Trained
Math Teachers
Math percent Trained
SubjectsTeachers
Subjectspercent Trained
Other Teachers
Other percent Trained
001 112 0 0.0% 3 0.0% 3 0.0% 106 0.0%026 78 4 50.0% 0 0.0% 13 23.1% 61 37.7% 051 95 6 66.7% 8 50.0% 13 23.1% 68 35.3% 101 40 5 80.0% 5 80.0% 8 50.0% 22 50.0% 151 80 12 75.0% 11 54.5% 28 35.7% 29 48.3%
201 174 29 69.0% 38 57.9% 72 38.9% 35 37.1% 301 333 51 68.6% 49 61.2% 141 53.9% 92 50.0% 401 375 68 66.2% 54 66.7% 180 50.6% 73 45.2% 501 556 86 55.8% 67 59.7% 246 58.9% 157 43.9%
601 439 58 70.7% 52 69.2% 214 66.8% 115 40.9% 701 527 75 60.0% 63 60.3% 221 58.4% 168 42.9% 801 208 37 81.1% 27 66.7% 121 62.8% 23 56.5% 901 196 27 66.7% 25 76.0% 89 75.3% 55 60.0%
3213 458 65.7% 402 63.4% 1349 57.6% 1004 44.0% Source: MOE Teacher Data, 2005/06 (Tch56_X005.XLS);
3.46 If Primary Tops are to continue in Guyana, they should be better resourced and better staffed. If there is no reasonable access to a GSS, the Ministry and the Regional Departments have to invest more in Primary Tops – ensuring that trained and experienced teachers are appointed, providing itinerant specialist teachers to support classroom teacher/s, and providing funds for student and teacher travel to the nearest accessible GSS.
3.47 The above analysis suggests a minimum viable size for a Primary Top of 40-50 students , with at least two trained teachers, one qualified in teaching English and the second qualified in teaching Math. It is recommended that each Region assess its current Primary Tops against such a standard. Training in teaching English and Math should be a priority for in-service courses. In rural Regions already short of qualified English and Math teachers, this would appear an unrealistic standard but it is the minimum for students in Primary Tops to have any prospect of transferring to a GSS in Grade 8 or Grade 9.
3.48 If neither consolidating Tops nor achieving the recommended staffing are feasible, the next best alternative would be the creation of a “cluster” secondary school, where teachers and students in “satellite” classes are part of a centrally located school. Itinerant specialist

40
teachers would support satellite classes, teacher professional development could be provided for the cluster, and students could participate in “whole school” activities several times per year.
3.49 A more expensive option would be to establish a national quality school with boarding
facilities in one of the hinterland regions so that the best SSEE students from across the country compete to attend. This would dramatically improve secondary education in Region 9 (for example) but would also reduce excess demand for places in Georgetown.
3.50 Increasing teacher supply is a long term process, especially where curriculum change
increases the need for in-service/retraining of existing teachers. Expanding capital expenditure on new school places require a greater recurrent investment in training and continuing recurrent expenditure to employ (and retain) skilled teachers. Annex E summarizes teacher supply and demand issues.
3.51 Analysis of Ministry and Regional expenditure on education delivery (Chapter 6) shows
limited resources allocated to teacher in-service training. Budget line item 6302 Training includes Scholarships but represents less than 0.5% of recurrent expenditure. There may be other expenditure in 6261 Local Travel and Subsistence, but this is also less than 0.5% of recurrent expenditure.
3.52 Managing existing and future staffing is shown in this Chapter to be central to achieving
USE objectives. In Chapter 4 it is also central to better learning outcomes. To achieve USE Objectives 2, 3 and 4, Guyana requires a clear strategy to upgrade and refresh teacher skills, especially if SSEE/CXC examination performance is to improve. Involving more teachers from outlying regions in examination marking could be an effective retraining activity, and contribute to better examination performance.

41
Chapter 4: Improving Student Learning Outcomes
4.1 Universal Secondary Education in Guyana seeks to give all students in Guyana access to quality learning opportunities, but the accessible curriculum53 depends on how well prepared Grade 6 students have been prepared for secondary education, how may progress to Grade 7, and the type of education to which they have access. In Chapter 2, enrollment patterns, student attendance patterns, gender differences in entry to the Secondary Schools Entrance Examination (SSEE) limit potential participation beyond Grade 6. In Chapter 3, the availability of qualified and trained teachers have a bearing on primary outcomes, success at SSEE, placement in GSS and the quality of learning opportunities available. Chapter 5 examines whether the availability of secondary school places limit participation.
4.2 This Chapter examines the quality of Grade 6 graduates (using SSEE results), attrition
during transfer from Grade 6 to Grade 7, student progression to Grade 11 and CXC examinations, seasonal variations in student attendance54, and student performance at CXC. USE Objective 3 required at least 35% achieving Grades 1-3 in CXC Math (NCERD reported 23.9% against this objective at 2007 CXC). A secondary school system cannot be effective without qualified, trained and experienced teachers, and without student and teacher attendance in excess of 90%.
Grade 6 Examination Outcomes Figure 4.1
4.3 Primary students sitting the Secondary Schools Entrance Examinations (SSEE) are presented in Figure 4.1 and Table 4.1. This is the first requirement for a viable secondary education system. SSEE candidature increased from 14,692 in 2001/02 to 18,540 in 2005/06 (and 18,538 entries in 2006/07).55
4.4 Table 4.1 uses MOE statistics on public school enrollments between 2001/02 and 2005/06 to compare female students as a percentage of Grade 6 and the number of SSEE entries as a percentage of Grade 6 enrollments the previous October. Female students fluctuate between 49% and 50% of SSEE entries.
53 The formalcurriculum is what a society believes its students should learn, the taughtcurriculum is what teachers plan to teach, the receivedcurriculum is what skills, competencies and knowledge (beyond the rote learning of facts) that each student takes away from schooling, and the assessedcurriculum is what external examiners think should be tested in terminal examinations. 54 The impact of student attendance on the effectivecurriculum is discussed in Chapter 2. There is no analysis of teacher attendance reported for Guyana. 55 SSEE data reported by NCERD include private school entrants.
SSEE EXAMS 2001-2006
98 97 99 100 101
49.149.749.449.549.9
0
3000
6000
9000
12000
15000
18000
21000
01/02 02/03 03/04 04/05 05/06
0
10
20
30
40
50
60
70
80
90
100
110
Grade6 Entry %Female %Entry

42
Table 4.1: Grade 6 Enrollment in Public Primary Schools
Year Male
Entries Female Entries
Females %Total
Enrolled Grade 6
SSEE Entry % Enrolled
SSEE Entry
01/02 7,496 7,479 49.94 14,975 98.11 14,692 02/03 7,754 7,600 49.50 15,354 97.41 14,957 03/04 8,471 8,265 49.38 16,736 98.55 16,494 04/05 8,852 8,754 49.72 17,606 99.93 17,594 05/06 9,377 9,035 49.07 18,412 100.70 18,540
Source: MOE Statistical Digests. Attachment D7 data by region (SSEE_Exams.xls) 4.5 The National Centre for Educational Resource Development (NCERD) publishes an
analysis of SSEE results, with mean scores in Math, English, Social Studies and Science. Analysis of gender differences in performance would strengthen the NCERD publication, especially if poor educational performance by boys is a policy issue for Government and a potential barrier to achieving USE. NCERD analysis of results by “size” of school would assist USE planning56. Poor outcomes for students from the smallest Primary schools should be a strategic issue for USE.
4.6 Guyana has had success in more students completing primary school, especially in the
hinterland regions. In Table 4.2, Grade 6 enrollment in the hinterland increased +28% between 2001/02 and 2005/06 and SSEE entries increased +37%. Rural coastal regions (2, 5, 6 &10) had +28% increase in Grade 6 and +31% at SSEE. Georgetown and adjacent regions 3 and 4 account for more than half Grade 6, and enrollment increased +19% and SSEE entries by +21%.
Table 4.2: Regional Trends in Grade 6 Enrollment and SSEE Entries
R1789 Hinterland R2560 Rural Coastal R3411 Urban Coastal Guyana
Year Grade
6%
Entry SSEEEntry
Grade6
%Entry
SSEEEntry
Grade6
%Entry
SSEEEntry
Grade6
%Entry
SSEEEntry
01/02 1542 83.72 1291 5383 96.67 5204 8050 101.83 8197 14975 98.11 1469202/03 1688 93.19 1573 5582 95.88 5352 8084 99.36 8032 15354 97.41 1495703/04 1888 88.72 1675 5988 99.97 5986 8860 99.70 8833 16736 98.55 1649404/05 1889 90.21 1704 6505 98.51 6408 9212 102.93 9482 17606 99.93 17594
05/06 1978 89.59 1772 6881 99.16 6823 9553 104.10 9945 18412 100.70 18540change +28% +37% +28% +31% +19% +21% +23% +26%
Source: SSEE Exams.XLS (SSEE2007_002.sql) 4.7 Figure 4.2 compares the combined hinterland and rural/coastal regions with
Georgetown/Regions 3&4. Combined rural (columns colored purple) entries increased from 6,495 to 8,595 while urban/coastal regions (orange) increased from 8,197 to 9,945. Female students in Grade 6 (Figure 4.2 blue columns) increased 24% in rural regions compared with +18% in Regions 3, 4&11. Grade 6 male students increased +32% but SSEE entries increased by only +19%.
4.8 One impact of increased rural enrollment and SSEE entry has been a decline in average SSEE scores.
56 NCERD could use SSEE entries as a proxy for Grade 6 and total school enrollment (“size”).

43
Figure 4.2
4.9 NCERD publishes SSEE data by region from 1996 through 2007, with mean scores for Math, English, Social Studies and Science.
4.10 Guyana needs an analysis of
these data to assist the Regional Departments (and Ministry) understand why the hinterland regions have consistent averages below 20/40 in Math, English and Social Studies and under 10/40 in Science.
4.11 In this Review, the SSEE
scores used are weighted averages of each region score and its SSEE entries. Aggregation emphasizes contrasts, especially any implications for educational management and achieving USE. “Rural” is a generalization – there are marked differences between Hinterland (R1, 7, 8&9) and rural/coastal (R2, 5, 6&10) and within urban/coastal (R3, 4&11)57.
4.12 The interaction between SSEE performance and Grade 7 repetition requires further analysis, especially if it reduces the probability of students completing five years secondary schooling58. If primary performance predicts secondary outcomes, Guyana needs a more effective educational strategy to improve primary school outcomes. NCERD analysis of the particular SSEE competencies where rural students consistently under-perform could guide in-service education for teachers and pre-service training at CPCE and the University of Guyana.
4.13 Coastal/urban regions (R3, 4&11) had aggregate Math, English, Social Studies and Science
(MESS) scores around 104-107 from 2001/02 to 2004/05, declining to 99 in 2005/06 (blue line in Figure 4.3). Rural regions averaged 89-94 from 2001/02 through 2004/05, declining to 86% in 2005/06 (green line).
57 Regional Departments need separate regional data (and in most cases individual school data). 58 For example, analysis of the proportion of “ever repeaters” in students in Grade 11.
SSEE ENTRY AND GENDER
9945
85958197
6495
0
2000
4000
6000
8000
10000
12000
Rural 3411 Rural 3411 Rural 3411 Rural 3411 Rural 3411
01/02 01/02 02/03 02/03 03/04 03/04 04/05 04/05 05/06 05/06
Entry G6F

44
4.14 Guyana requires some analysis of the relationship between increased student entry (Figure 4.2) and declining outcomes59 in Figure 4.3.
Figure 4.3 4.15 The black line (right hand
scale) shows combined rural regions as a percentage of coastal/ urban regions 3, 4&11, with the rural regions in a narrow 85-88% range.
4.16 Table 4.3 contrasts separate subject means and an aggregate score for the four subjects, including SSEE scores in 2006/07.60
Table 4.3 Contrasting Rural and Urban/Coastal Subject Means 2001/02-2006/07 Year Region Entry Math English SStudy Science MESS
01/02 Rural 6,495 20.86 21.34 22.27 25.30 89.7601/02 R3411 8,197 24.99 24.89 25.63 28.29 103.8002/03 Rural 6,925 21.18 21.99 23.07 27.20 93.4402/03 R3411 8,032 24.49 25.78 26.08 30.37 106.7103/04 Rural 7,661 22.36 20.19 21.10 24.91 88.5603/04 R3411 8,833 26.14 23.97 25.30 28.80 104.2104/05 Rural 8,112 24.97 23.39 20.46 24.86 93.6704/05 R3411 9,482 28.13 27.13 23.89 27.98 107.1405/06 Rural 8,595 20.85 21.16 19.19 24.60 85.8005/06 R3411 9,945 24.17 24.95 22.47 27.77 99.3606/07 Rural 8,311 20.96 17.56 22.23 21.07 81.82
06/07 R3411 9,223 25.02 21.64 26.70 24.97 98.34Source: NCERD Volume 1 (2007) data; (SSEE_Exam.xls)
MESS= Math +English +Social Studies +Science (ssee2007_0003b.sql)
4.17 The black lines in Figure 4.4 are the same as the blue and green MESS lines shown in Figure 4.3 above, with the addition of 2006/07 SSEE subject scores. Figure 4.4 includes the individual subject means (on the left hand scale) which make up the aggregate MESS score (on the right hand scale). Regions 3, 4 & 11 (Georgetown) consistently average more than the weighted rural region average. The apparent decline in 2005/06 has continued in 2006/07 in English and Science scores, Math has a level similar to 2005/06 and Social Studies were at their highest level since 2001/02.
59 Age of students sitting SSEE could be examined – especially if some schools are encouraging Grade 5 students to sit SSEE as experience practice for sitting SSEE at the end of Grade 6. 60 . Enrollment data for 2006/07 were not available (Table 4.2).
Rural Urban SSEE Performance
0
15
30
45
60
75
90
105
120
135
150
01/02 02/03 03/04 04/05 05/06
SS
EE
Ag
gre
gat
e(M
ES
S)
0%
10%
20%
30%
40%
50%
60%
70%
80%
90%
100%
Ru
ral
%U
rban
Rural Urban R/U

45
Figure 4.4
Trend in Subject Mean Scores: 2001/02-2006/07
0
5
10
15
20
25
30
35
40
01/02 02/03 03/04 04/05 05/06 06/07 01/02 02/03 03/04 04/05 05/06 06/07
Rural R3411
0
15
30
45
60
75
90
105
120
Maths English SStudy Science MESS
Source: Table 4.3 data
4.18 Poor primary outcomes provide a poor foundation for achieving USE. English scores in 2006/07 are lower than their 2001/02 level. The reasons for this decline warrant further examination by NCERD, especially if identification of poor performance on particular competencies can assist teacher in-service and student learning. If the decline is attributable to higher primary completion rates and the increased numbers entering SSEE, the Ministry requires a national strategy to improve Primary teaching and to attempt to arrest this decline in student outcomes.
Transition from Grade 6 to Grade 7 4.19 The end of primary school is the first transition at which students may be “lost” from the
education system. It is also a transition in which Primary Tops have a distinct advantage – students do not have to change school to proceed to Grade 7. There may be an offsetting disadvantage – overage students in Grade 6 progress to Grade 7 because they are too old to sit SSEE for entry to GSS. The age-limit on SSEE warrants review so that older students in rural schools are not penalized.
4.20 Transition measures are distorted by high repetition rates – in Grade 6, high repetition
may overstate apparent “drop out” and, in Grade 7, high repetition may overstate the real level of progression. The model in Table 4.4 is approximate, as only 2003/04 Grade 7 repetition data were available (from the 2004/05 Statistical Digest). Values in green-shaded cells require updating from the new Statistical Digest, and could affect the values in cells shaded tan.
4.21 There are wide variations between Regions in Grade 6 and Grade 7 repetition rates and
discussion of these rates should be included in the analysis of SSEE outcomes recommended above.

46
Table 4.4: Grade 6/7 Transition Rates (excluding Grade 7 repetition) Grade 6 2003/04
(A) Grade 7 2004/05
(B) Grade 7 Repeats
2003/0461 (C) Net Progression
(B-C)/A Region Male Female Male Female Male Female Male Female Total R1789 976 912 1279 1148 260 167 104% 108% 106% R2560 3010 2978 3280 3141 438 221 94% 98% 96% R3411 4485 4375 4961 4454 1122 603 86% 88% 87% Total 8471 8265 9520 8743 1820 991 91% 94% 92% Source: MOE Statistical Digests 4.22 As net progression rates should not exceed 100%, the Hinterland net progression rates
require further examination to identify Grade 7 “first” enrollments or re-enrollments by students not in Grade 6 the previous year.
4.23 The net transfer of better performing students from hinterland and rural schools to
Georgetown (and to President’s College in Region 4) should reduce hinterland progression rates and the R3, 4&11 rates could exceed 100% (or be closer to 100%). Alternative explanations could be even greater attrition in the more rural parts of Regions 3 and 4 or that 2003/04 repetition rates were higher than in 2004/05. This warrants further examination by the Ministry and discussion with Regions.
4.24 A serious implication for USE would be that students in the urban/coastal regions are
not continuing into secondary education.62
4.25 In summary, an average progression rate of 92% suggest that Guyana will have difficulty achieving the USE target that 75% of primary school leavers will have access to a five-year secondary education program. Poor primary learning outcomes and high attrition between Grade 6 and Grade 7 may already determine that many primary students lack the competencies to succeed in secondary schools. This could explain part of the lower male student participation in urban/coastal areas.
Student attendance
4.26 Chapter 2 examines Student attendance by region and level of schooling. Major observations include: • Female students have higher attendance than males at each level of education; • GSS average 80%, but Primary Tops and Community High Schools only 60%; • USE should include an attendance target.
4.27 Figure 4.5 shows the 2004/05 pattern of monthly attendance, by gender for 235 out of 348 secondary schools63. The black lines show numbers of sessions attended by gender, and the impact of flooding in December/January in that school year. The red line shows female attendance rates above male attendance rates (blue line) each month.
61 Update with 2004/05 data when available in the 2005/06 Statistical Digest. 62 There is no published data on Grade 6 students who leave Guyana for secondary education in other Caribbean countries. 63 With 159/240 Primary Tops, 17/24 CHS and 59/82 GSS, it is assumed that they “represent” all schools.

47
Figure 4.5
MONTHLY ATTENDANCE BY GENDER, 2004/05All Secondary School Types
0
100000
200000
300000
400000
500000
600000
700000
800000
900000
1000000
01S 02O 03N 04D 05J 06F 07M 08A 09M 10J
0%
10%
20%
30%
40%
50%
60%
70%
80%
90%
Amale Afem pcMAtt pcFAtt
4.28 Table 4.6 is the data set used for Figure 4.5. Male attendance exceeded 70% only in September and October 2004, while female rates exceed 70% in 7 months between September and June. Male attendance was 55% in December and 61% in January, with female attendance 61% and 66% respectively.
Table 4.6: Total Secondary Student Attendance by Gender and by Month, 2004/05 Month
Sessions Sept Oct Nov Dec Jan 05 Feb March April May June TOTAL
(a) M: attend 774532 687206 668069 202914 461946 490254 455108 550023 503000 581464 5395741 M: enroll 1036876 971591 964566 371562 756094 725759 719205 804197 783672 890351 8051321 %Attend 74.7% 70.7% 69.3% 54.6% 61.1% 67.6% 63.3% 68.4% 64.2% 65.3% 67.0% F: attend 832501 751736 733243 231159 521135 583460 511435 617379 575577 649881 6035657 F: enroll 1057574 991032 993279 380550 794216 760148 761874 832765 820134 909868 8331426 %Attend 78.72% 75.85% 73.82% 60.74% 65.62% 76.76% 67.13% 74.14% 70.18% 71.43% 72.44%
Source: MOE data. Attachment D5 (a) Total includes July attendance (mostly Grade 12) Attendance = sessions attended as a percentage of enrollment times the nominal number of sessions. Months are numbered 1=September through 10=June to facilitate sorting results by month. 4.29 Regional patterns by gender in Figure 4.6 reflect the aggregate trends in Table 4.6, with
some notable variations – Sessions attended are on the left-hand scale and the lines in the bottom half of Figure 4.6. The Coastal/Urban regions including Georgetown (R3, 4&11) have more sessions attended (black=Female; red=Male) except following the flooding when they took longer to recover. Regions 2, 5, 6&10 had more sessions until a seasonal downturn in March 2005. The hinterland regions (R1, 7, 8&9) were less affected by the lowland/coastal flooding but have fewer students resulting in fewer total sessions. R1, 7, 8&9 has more male students so that male and female sessions are approximately equal.

48
Figure 4.6
MONTHLY ATTENDANCE 2004/05 BY REGION
0
100000
200000
300000
400000
500000
600000
700000
800000
900000
1000000
01S 02O 03N 04D 05J 06F 07M 08A 09M 10J
0%
10%
20%
30%
40%
50%
60%
70%
80%
90%
100%
AM1789 AF1789 AM2560 AF2560 AM3411 AF3411
M1789 F1789 M2560 F2560 M3411 F3411
4.30 Attendance rates in the top half of Figure 4.6 (on the right-hand scale) show female attendance consistently higher than male attendance in the three regional groupings. Female attendance approached 80% in rural regions through most months, dropping to 70% in January and March. Male rates in those regions only reached or exceeded 70% in the first three months of the school year and in February and April.
4.31 If these patterns are broadly consistent from year to year, Guyana should encourage
Regional Departments to consider a more flexible school year, such as starting the school year in August and/or arranging schooling from Monday to Saturday in the early months to make up for time lost during flooding in December or January in lowland areas and low attendance in March due to high river levels in the hinterland.
4.32 Another factor affecting regional attendance rates is the differing mix of schools. R1, 7 8&9
Hinterland has few GSS, smaller schools and many Primary Tops. R2, 5, 6&10 has a mix of all types, while coastal/urban R3, 4&11 has most GSS with higher enrollment, especially of female students.

49
Figure 4.7 4.33 Being larger and urban, GSS
account for most students and most of the attendance sessions in Figure 4.7 (Female black lines; Male red lines). Primary Tops and CHS account for fewer than 100,000 student sessions for males and females in almost every month.
4.34 Female attendance exceeds male attendance in every month. In Attachment D5, attendance by male students in Primary Tops exceeded 60% in September 2004, while Female attendance exceeded 60% in September, October and February 2005. CHS had a similar pattern with December 2004 under 40% (flooding in R3, 4&11).
4.35 GSS, by contrast with CHS and primary tops, reported no month less than 60% and several months >75%. Monthly attendance rates are plotted in Attachment D5.
4.36 As these tables/graphs use individual schools data, Figure 4.8 can present the same data by size of school. This could also provide a check on the point at paragraph 4.27 about whether reported data are representative of all schools.
Figure 4.8
Monthly Attendance by Size of School
0.0
0.1
0.2
0.3
0.4
0.5
0.6
0.7
0.8
0.9
1.0
01SEP 02OCT 03NOV 04DEC 05JAN 06FEB 07MAR 08APR 09MAY 10JUN
001 101 301 601 901 ALL
Source: Attachment D5 (Att4500.XLS)
MONTHLY ATTENANCE BY SCHOOL TYPE
0
100000
200000
300000
400000
500000
600000
700000
Sept Oct Nov Dec Jan 05 Feb Mar Apr May June
AMPTop AFPTop AMCHS
AFCHS AMGSS AFGSS

50
4.37 If CXC does not include an attendance requirement for candidates, it would be difficult to see the average student meeting external examination requirements with less than 80% face-to-face contact time with their teachers64. Able students may have skills in self-directed learning, but should perform better with contact time with skilled, experienced teachers.
4.38 External examinations (CSEC) as a goal for USE may determine the Grade 11 calendar but that should not determine term dates for Nursery, Primary and lower Secondary classes. As suggested at 4.44, Regional Departments should have sufficient flexibility so that the school calendar in their region can be adjusted to maximize student instructional time.
4.39 Possible responses to seasonal variations in student attendance: •Option A: Some regions could start their school year at the beginning of August, or
operate Mondays through Saturdays in “dry” months, and adjust term dates to minimize the school weeks lost in “rainy” seasons, high river flows, flooding, planting and harvest seasons. This is not a cosmetic or “band-aid” solution, but an effective response to particular needs in some Regions. Other than community negotiations and information about approved school calendar, the effective school year and curriculum could be improved with no additional cost to Budget.
•Option B: A more radical option could be to use residential school facilities for intensive CSEC preparation courses during January-February, enabling students from smaller rural schools access to facilities such as science laboratories, resources and experienced teachers not otherwise available. There are budget implications – transporting students to and from the residential schools, the need to rearrange the school calendar for lower grade students in dormitories, and possibly combining in-service training/retraining for rural teachers in parallel with the CSEC preparatory courses.
Grade 7 to Grade 11 Progression
4.40 In Chapter 2, Table 2.11 presented data on progression from Grade 7 in 2001/02 school year to Grade 11 in 2005/06, by region and by gender. Table 4.7 presents cohort survival rates using the same data for the three broad regions used in this Review, as well as corresponding data for the 1997/98-2001/02 cohort.
Table 4.7: Grade 7 to Grade 11 Cohort Progression (Survival) Rates
Year Region Schools Males G07
FemaleG07
Male G11
FemaleG11
Male Students
Female Students
Total Students
05/06 R1789 118 1226 1121 193 246 3723 3736 7459 05/06 R2560 108 3465 3372 1185 1597 11925 12803 24728 05/06 R3411 112 4883 4474 1476 2011 16826 17563 34389 05/06 Guyana 338 9574 8967 2854 3854 32474 34102 66576 01/02 R1789 122 960 930 78 80 2750 2793 5543 01/02 R2560 135 3018 2916 1204 1651 11584 12151 23735 01/02 R3411 124 5072 4602 1558 2027 17476 17837 35313 01/02 Guyana 381 9050 8448 2840 3758 31810 32781 64591 97/98 R1789 109 751 701 57 80 2331 2277 4608 97/98 R2560 165 3044 3020 1087 1606 11430 12212 23642 97/98 R3411 143 4301 3936 1332 2053 16245 16758 33003 97/98 Guyana 417 8096 7657 2476 3739 30006 31247 61253
Source: MOE Statistical Digests. Attachment D6 (G7_G11_completion.xls)
64 Teacher absenteeism has greater impact because all children in the class are disadvantaged, and other grades may be disrupted by children present without a teacher. There is no published data on attendance.

51
4.41 Of 17,498 students in Grade 7 in 2001/02, some 6,708 or 38.3% were still present in Grade 11 in 2005/06 (tan cells). Comparable data for Grade 7 intake in 1997/98 (light green cells) showed that 41.9% of students continued. Part of the decline in the overall rate is the increased number of Grade 11 students who continued in Hinterland regions (R1, 7, 8&9) –from 158 in 2001/02 to 439 in 2005/06. Cells colored light yellow in Table 4.8 show R1, 7, 8&9 completion increased from 10.9% to 23.2% - a major USE achievement, but still well below the national average.
4.42 Decline in male and female completion
rates in Region 3, 4&11 should be of greater concern – Male completion was down from 36.2% in the 1997/98-2001/02 cohort to only 29.1% (pink cells) in 2005/06. Female rates in R3, 4&11 also declined (from 51.5% to 43.7%).
4.43 Elsewhere this Review asks whether the
declining participation is an economic /market (pull) factor or a curriculum/ competency (push) factor. The Ministry cannot control market forces but its USE strategies should respond to any educational factors which affect completion of secondary school.
CXC Examination outcomes
4.44 The SSEE commentary at paragraphs 4.12, 4.18 and 4.25 recommended an analysis of results to identify those competencies where students from rural schools under-perform. The same issues apply to CXC performance, especially as CXC outcomes are a major USE objective.
4.45 Tables 4.9 and 4.10 compare Guyana performance in English and Math over the past 8 years, and show the marked increase in total candidates since 2002. These tables update data reported in the GEAP Project Completion Report (December 2006) with 2007 scores. The percentage Grade I-III passes are also shown, as Grade III is the minimum standard for university admission.
4.46 At 70%, overall Grade I-IV passes in English may appear satisfactory, but Grade I-III passes were less than 50% in most years. Math performance should be of even more concern. In 2005, Guyana achieved 50% at Grades I-IV but only 30% at Grades I-III (the USE target for 2010 is 35%). CXC performance declined in 2006 and 2007.
4.47 There is a limitation in the NCERD analysis of CXC results – the analysis is of subject
entries rather than candidates – the USE objectives refer to 35% of secondary school leavers after five years of secondary education will have achieved CXC Grades 1-3 General Proficiency in Math and 40% achieving CXC Grades 1-3 in five subjects. The Ministry should request NCERD to report candidate performance against these USE outcomes.
Table 4.8 Cohort Survival Rates 2001/02 - 2005/06
Region M11/ M07
F11/ F07
All 1l /All 07
R1,7,8,9 20.10% 26.45% 23.23% R2,5,6,10 39.26% 54.77% 46.88% R3,4,11 29.10% 43.70% 36.05% Guyana 31.54% 45.62% 38.34%
1997/98 - 2001/02
Region M11/ M07
F11/ F07
All 1l /All 07
R1,7,8,9 10.39% 11.41% 10.88% R2,5,6,10 39.55% 54.67% 47.08% R3,4,11 36.22% 51.50% 43.52% Guyana 35.08% 49.08% 41.88%

52
Table 4.09 Table 4.10
Year English Entries Passes
%Grade 1-4
%Grade 1-3
2000 5546 3147 56.7% 25.8% 2001 5561 3564 64.1% 36.1% 2002 5474 3305 66.6% 34.5% 2003 7749 5275 68.1% 37.4% 2004 7791 5077 65.2% 33.2% 2005 8047 6429 77.9% 51.9% 2006 7608 5448 71.6% 39.5% 2007 8011 5824 72.7% 40.1%
Year Math
Entries Passes %Grade
1-4 %Grade
1-3 2000 4838 1944 40.2% 24.5% 2001 5020 1672 33.3% 19.6% 2002 4980 1480 38.7% 23.1% 2003 7450 3343 44.9% 24.8% 2004 7571 3401 44.9% 25.7% 2005 7739 4022 52.0% 30.2% 2006 7474 3241 43.4% 25.2% 2007 7841 3262 41.6% 23.9%
Figure 4.09 Figure 4.10
CXC ENGLISH 2000-2007
0
1000
2000
3000
4000
5000
6000
7000
8000
9000
10000
20002001200220032004200520062007
En
trie
san
dP
asse
s
0%
10%
20%
30%
40%
50%
60%
70%
80%
90%
100%
Per
cen
tP
ass
Entries Passes
%Grade1-4 %Grade1-3
CXC MATHS 2000-2007
0
1000
2000
3000
4000
5000
6000
7000
8000
9000
10000
2000 2001 2002 2003 2004 2005 2006 2007
En
trie
san
dP
asses
0%
10%
20%
30%
40%
50%
60%
70%
80%
90%
100%
Perc
en
tP
ass
Entries Passes %Grade1-4 %Grade1-3
Source: National Centre for Educational Resource Development (NCERD) Volume 1 September2007 (2007 results updating material from GEAP Project Completion Report, December 2006)
4.48 Performance against the 35% Guyana USE Objective in Table 4.11 ranges between 17% in 2002 and 30% in 2005. The measure uses the inferred total number of candidates from percentage of English A candidates who achieved Grade 1-4 passes, and calculates Math Grade 1-3 passes (shaded tan) as a percentage of the English A candidature (shaded green). NCERD should be able to refine this using individual candidate data, and also undertake analysis of gender, size of school and regional variations in performance.
4.49 Performance against the 40% of students achieving Grade 1-3 proficiency in five subjects is not being met. Guyana has 21,887 Grade 1-3 passes (Table 4.12) which is an average 2.73 passes if English A candidates in Table 4.11 are used as an approximation of total candidates. NCERD should be able to refine this measure.
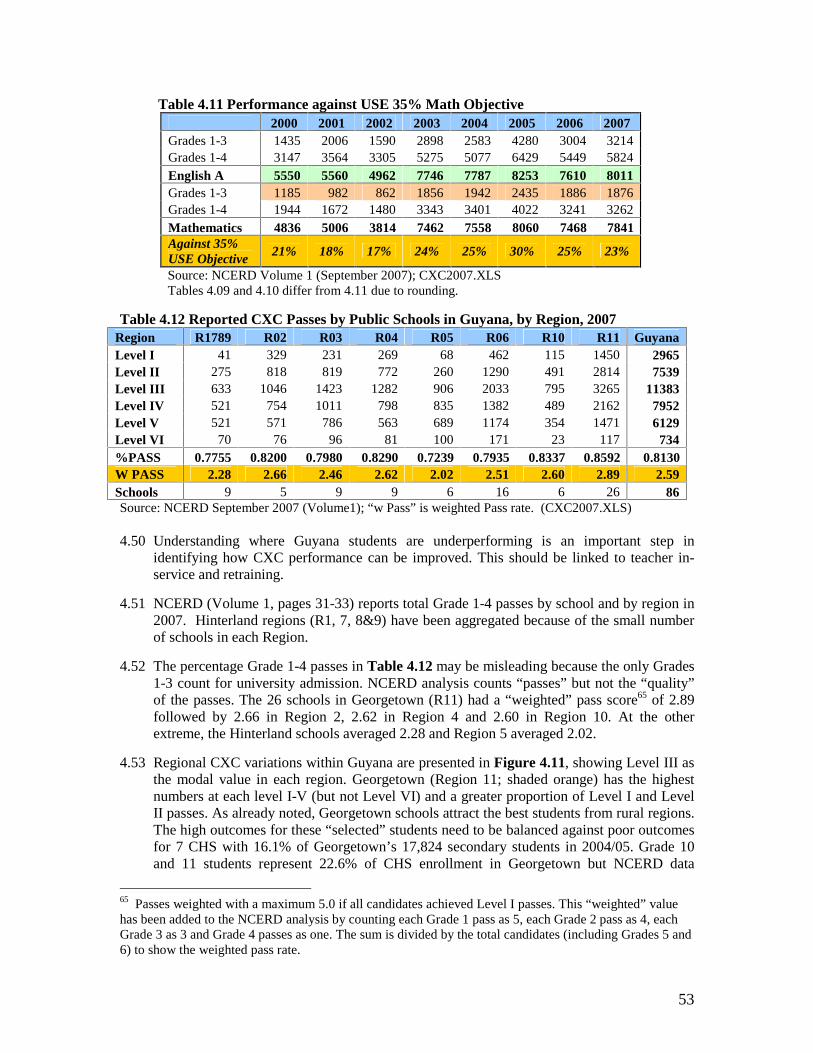
53
Table 4.11 Performance against USE 35% Math Objective 2000 2001 2002 2003 2004 2005 2006 2007
Grades 1-3 1435 2006 1590 2898 2583 4280 3004 3214 Grades 1-4 3147 3564 3305 5275 5077 6429 5449 5824 English A 5550 5560 4962 7746 7787 8253 7610 8011 Grades 1-3 1185 982 862 1856 1942 2435 1886 1876 Grades 1-4 1944 1672 1480 3343 3401 4022 3241 3262 Mathematics 4836 5006 3814 7462 7558 8060 7468 7841 Against 35% USE Objective
21% 18% 17% 24% 25% 30% 25% 23%
Source: NCERD Volume 1 (September 2007); CXC2007.XLS Tables 4.09 and 4.10 differ from 4.11 due to rounding.
Table 4.12 Reported CXC Passes by Public Schools in Guyana, by Region, 2007 Region R1789 R02 R03 R04 R05 R06 R10 R11 Guyana Level I 41 329 231 269 68 462 115 1450 2965 Level II 275 818 819 772 260 1290 491 2814 7539 Level III 633 1046 1423 1282 906 2033 795 3265 11383 Level IV 521 754 1011 798 835 1382 489 2162 7952 Level V 521 571 786 563 689 1174 354 1471 6129 Level VI 70 76 96 81 100 171 23 117 734 %PASS 0.7755 0.8200 0.7980 0.8290 0.7239 0.7935 0.8337 0.8592 0.8130 W PASS 2.28 2.66 2.46 2.62 2.02 2.51 2.60 2.89 2.59 Schools 9 5 9 9 6 16 6 26 86 Source: NCERD September 2007 (Volume1); “w Pass” is weighted Pass rate. (CXC2007.XLS) 4.50 Understanding where Guyana students are underperforming is an important step in
identifying how CXC performance can be improved. This should be linked to teacher in-service and retraining.
4.51 NCERD (Volume 1, pages 31-33) reports total Grade 1-4 passes by school and by region in 2007. Hinterland regions (R1, 7, 8&9) have been aggregated because of the small number of schools in each Region.
4.52 The percentage Grade 1-4 passes in Table 4.12 may be misleading because the only Grades 1-3 count for university admission. NCERD analysis counts “passes” but not the “quality” of the passes. The 26 schools in Georgetown (R11) had a “weighted” pass score65 of 2.89 followed by 2.66 in Region 2, 2.62 in Region 4 and 2.60 in Region 10. At the other extreme, the Hinterland schools averaged 2.28 and Region 5 averaged 2.02.
4.53 Regional CXC variations within Guyana are presented in Figure 4.11, showing Level III as the modal value in each region. Georgetown (Region 11; shaded orange) has the highest numbers at each level I-V (but not Level VI) and a greater proportion of Level I and Level II passes. As already noted, Georgetown schools attract the best students from rural regions. The high outcomes for these “selected” students need to be balanced against poor outcomes for 7 CHS with 16.1% of Georgetown’s 17,824 secondary students in 2004/05. Grade 10 and 11 students represent 22.6% of CHS enrollment in Georgetown but NCERD data
65 Passes weighted with a maximum 5.0 if all candidates achieved Level I passes. This “weighted” value has been added to the NCERD analysis by counting each Grade 1 pass as 5, each Grade 2 pass as 4, each Grade 3 as 3 and Grade 4 passes as one. The sum is divided by the total candidates (including Grades 5 and 6) to show the weighted pass rate.

54
indicate that no Georgetown CHS school presented students for CXC (or they transferred to a GSS to sit CXC). Region 6 had the second highest CXC subjects presented, and second highest number of passes at each level (except VI).
Figure 4.11
CXC 2007 PASSES BY LEVEL AND BY REGION
462
1290
2033
1382
1174
171
1450
2814
2162
1471
117
3265
0
500
1000
1500
2000
2500
3000
3500
Level I Level II Level III Level IV Level V Level VI
R1789 R02 R03 R04 R05 R06 R10 R11
4.54 From the data reported by NCERD for the 86 public secondary schools which presented CXC candidates in 2007, Table 4.13 ranks the schools by their weighted CXC score (see definition in 4.53), and other measures - average number of CXC subjects presented in 2007, percentage attendance (in 2004/05), percentage teachers trained (in 2004/05), and total CXC subjects in 2007. Schools are also reported in the three regional groupings (R1, 7, 8&9, R2, 5, 6&10 and R3, 4&11).
4.55 Better performing schools presented more CXC subjects, had better student attendance and a greater proportion of trained teachers. Schools with better than 2.0 weighted mean performance presented more CXC subjects performing schools, most had better than 80% attendance and over 60% teachers trained. Schools with better than 3.0 weighted performance presented more than twice the average 427 CXC subjects, over 90% attendance and more than 65% trained teachers. The three schools with >3.5 performance (shown as 4 in Table 4.12 and Figure 4.12) were: • Queens College (Georgetown; 899 entries, weight 4.18,but only 32.6% trained66); • Bishop’s High (Georgetown; 845 entries; weight 4.13, 53.3% trained); • New Amsterdam Multilateral (Region 6; 1004 entries; weight 3.54; 67.4% trained). Presidents College (Region 4) was fourth with 545 entries and mean weight 3.43. Figure 4.12 shows 137 schools (including Primary Tops) with no CXC entries in 2007.
4.56 NCERD should be able to use unit record student data to summarize performance by individual students at each school by the number of passes at Level III and above.
66 Check data reported for Queens College.
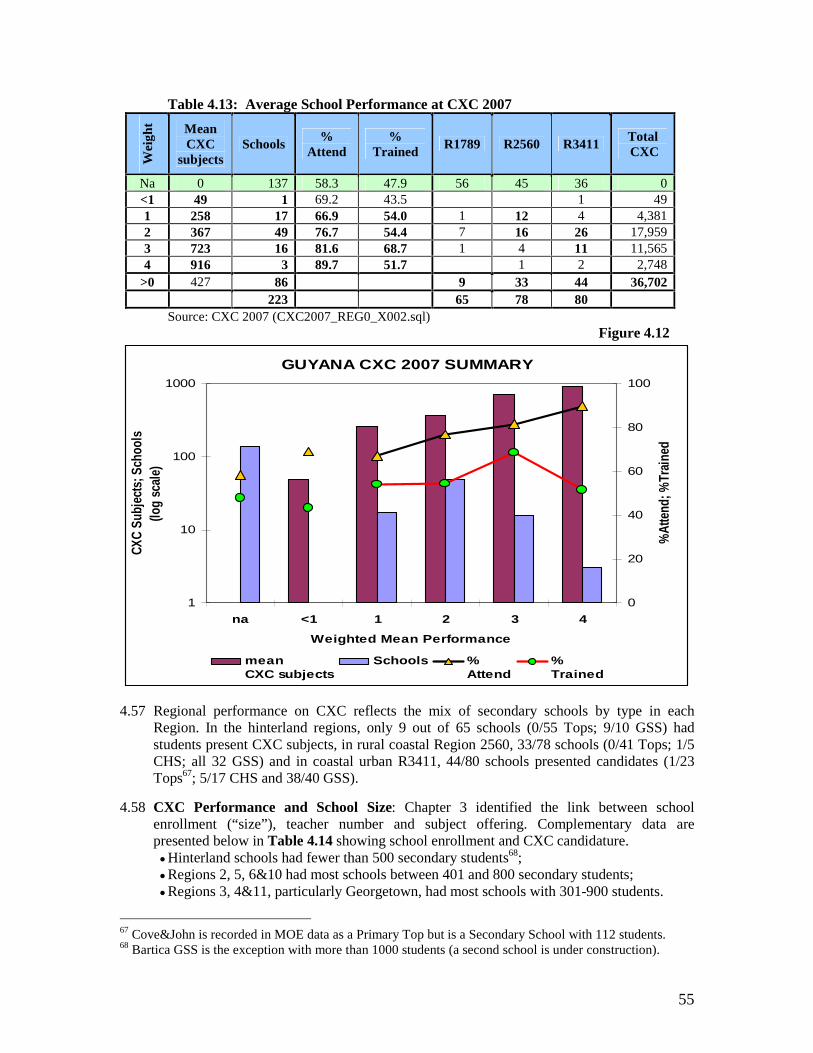
55
Table 4.13: Average School Performance at CXC 2007
Wei
ght Mean
CXC subjects
Schools %
Attend %
Trained R1789 R2560 R3411
Total CXC
Na 0 137 58.3 47.9 56 45 36 0<1 49 1 69.2 43.5 1 491 258 17 66.9 54.0 1 12 4 4,3812 367 49 76.7 54.4 7 16 26 17,9593 723 16 81.6 68.7 1 4 11 11,5654 916 3 89.7 51.7 1 2 2,748
>0 427 86 9 33 44 36,702223 65 78 80
Source: CXC 2007 (CXC2007_REG0_X002.sql) Figure 4.12
GUYANA CXC 2007 SUMMARY
1
10
100
1000
na <1 1 2 3 4
Weighted Mean Performance
CXC
Subj
ects
;Sch
ools
(log
scal
e)
0
20
40
60
80
100
%At
tend
;%Tr
aine
dmeanCXC subjects
Schools %Attend
%Trained
4.57 Regional performance on CXC reflects the mix of secondary schools by type in each Region. In the hinterland regions, only 9 out of 65 schools (0/55 Tops; 9/10 GSS) had students present CXC subjects, in rural coastal Region 2560, 33/78 schools (0/41 Tops; 1/5 CHS; all 32 GSS) and in coastal urban R3411, 44/80 schools presented candidates (1/23 Tops67; 5/17 CHS and 38/40 GSS).
4.58 CXC Performance and School Size: Chapter 3 identified the link between school enrollment (“size”), teacher number and subject offering. Complementary data are presented below in Table 4.14 showing school enrollment and CXC candidature. •Hinterland schools had fewer than 500 secondary students68;•Regions 2, 5, 6&10 had most schools between 401 and 800 secondary students; •Regions 3, 4&11, particularly Georgetown, had most schools with 301-900 students.
67 Cove&John is recorded in MOE data as a Primary Top but is a Secondary School with 112 students. 68 Bartica GSS is the exception with more than 1000 students (a second school is under construction).

56
4.59 Table 4.14 shows the distribution of the 86 schools with CXC candidates (in 2007) by the total school enrollment (in 2005) and by Region. The tan shaded cells show the concentration of schools in Regions 11 and 6.
Table 4.14: Distribution of Schools by Enrollment (2005) and by Region (grouped)
Region Reg N= Mean CXC
PercentAttend
Percent Trained
101 151 201 301 401 501 601 701 801 901 CXC
R1,7,8,9 R01 3 199 67.8 61.9 1 2 597R1,7,8,9 R07 2 328 74.3 83.7 1 1 655R1,7,8,9 R08 1 234 87.8 23.1 1 234R1,7,8,9 R09 3 192 78.8 38.1 1 1 1 575
2,5,6,10 R02 5 719 80.5 75.4 1 1 1 2 35942,5,6,10 R05 6 476 67.0 53.9 1 1 3 1 28582,5,6,10 R06 16 407 77.3 54.8 1 2 3 1 3 5 1 65122,5,6,10 R10 6 378 80.1 66.1 1 2 2 1 2267
R3,4,11 R03 9 485 78.1 61.5 2 1 3 3 4366R3,4,11 R04 9 418 63.2 60.6 1 1 2 2 2 1 3765R3,4,11 R11 26 434 79.4 49.9 3 4 7 4 4 3 1 11279
4.60 The cells in Table 4.15 show the numbers of trained graduate teachers by school enrollment and weighted CXC scores. Note the column showing Graduates as a percentage of trained teachers – in the three best performing schools, graduates are almost half the trained teachers.
Table 4.15: Trained Graduate Teachers by School Enrollment and CXC Weight (2007)
Wei
ght
Scho
ols
Mea
nE
nrol
led
2005
Mea
nC
XC
/Sch
ool
Per
cent
Att
end
Per
cent
Tra
ined
Gra
duat
e%
Tra
ined
101 151 201 301 401 501 601 701 801 901
0 1 445 49 69.2 43.5 20.0 21 17 526 258 66.9 54.0 13.7 1 2 10 10 6 1 22 49 558 367 76.7 54.4 16.1 0 1 1 12 7 36 18 27 11 43 16 676 723 81.6 68.7 22.9 2 17 13 23 18 2 74 3 589 916 89.7 51.7 46.8 7 11 11
86 0 1 2 23 36 59 58 57 13 13

57
Comparisons between Guyana and Other CXC Countries
4.61 In 2003, a comparison of cross-country performance based on 2001 CXC data was published in Monitoring educational performance in the Caribbean (World Bank Report 24337: Chart 4, page 35). That Report showed that Guyana’s secondary gross completion rate (GCR) fell behind most other Caribbean countries.
4.62 On CXC performance in Math and English, Guyana had the poorest performance of the nine countries reported in the 2001 data. Even with caveats about differences in the educations systems and St Kitts, St Vincent and Dominica having small numbers enrolled in the final year of secondary school, Guyana’s percentage passes in Math (blue bar) and English (red bar) in Figure 4.14 are the poorest.
Figure 4.14
CXC Maths and English pass rates, 2001
0.0 20.0 40.0 60.0 80.0 100.0
Guyana
Dom.Rep
Grenada
Jamaica
StVincent
Trinadad
Belize
StKitts
Dominica
Math English

58
4.63 Later data were not available to permit a comparison between Guyana schools performance and those of other Caribbean countries. Such analysis requires unit record data (for schools and for individual students) rather than subject averages. It would be more appropriate for NCERD to undertake such an analysis for at least English and Math.
4.64 If NCERD can construct a measure of Guyana performance against comparable Caribbean countries, it should take into account gross enrolment rates, Grade 11 as a percentage of Grade 7 enrolment, total numbers completing Grade 11 and the distribution of scores on each subject. In the above graph, the Dominican Republic had about 13 times the Guyana enrolment in the last year of secondary. Grenada, by contrast, had approximately one-quarter of the Guyana enrolment.
4.65 This analysis could be combined with some measure of the percentage of students achieving
Grade 3 or higher passes in at least five CXC subjects. This USE indicator for Guyana was only reported for two of the smallest Caribbean countries in 2001 (St Kitts & Nevis; Grenada). If English and Math are included in the five CXC subjects, this should focus greater attention on strategies to improve Math teaching, learning and outcomes in Guyana.
Summary of Challenges to Secondary Student Outcomes
4.66 This review has identified six challenges or threats to achieving USE targets. In the absence
of household expenditure data for Guyana, it is assumed that the two poorest population quintiles (the “bottom” 40%) do not continue and complete secondary education – rural areas for lack of opportunity and in urban areas from dissatisfaction/lack of relevance in the curriculum offered by schools which measure success in CXC outcomes. Access is the first curriculum challenge to the achievement of Universal Secondary Education.
4.67 The availability and skills of teachers is the second challenge to a USE curriculum.
Chapter 3 identified major differences in teacher quality (with qualification and training status the only available measures) by type of school (GSS, CHS, Primary Tops) and by the enrollment (“size”) of the school. In 2005/06, there were 124 “schools” offering secondary education in Hinterland Regions – these schools reported only nineteen (19) Math teachers from a total 291 teachers. Twelve of the 19 Math teachers were “trained”. The smaller the school, the fewer subject specialist teachers, and a majority of teachers were untrained.
4.68 Rural-urban differences in educational opportunity and performance occur for many
geographic and economic reasons which are outside the control of an Education Ministry. The third challenge to a USE curriculum is identification of the reasons for poor performance and staffing, administrative or organizational changes which could improve performance of students in rural schools.
4.69 Size of school and the concept of a minimum viable school curriculum are discussed in
previous Chapters. One strategy could be to improve the staffing and facilities so that schools attract more students and can demonstrate improved performance. Construction of more GSS in remote hinterland regions could be difficult to justify if the school cannot attract sufficient students to become viable.

59
4.70 Reducing the migration of the best SSEE students from rural areas to schools in
Georgetown is the fourth challenge to USE. In some hinterland Regions, the question for the Regional Education Office (and the community) is how to ensure viable secondary schools. Port Kaituma CHS (Region 1) had 18 students in Grade 10 in 2005/06 and a total of only 56 CXC subject entries in June 2007. Conversion to a GSS would be warranted if it improves enrollment, improves attendance and attracts better staffing. Bartica GSS (Region 7) presents a different challenge – it had 213 students in Grade 10 in 2005/06 but submitted only 241 CXC subject entries at June 2007. Waramadong GSS (also Region 7) had 74 Grade 10 students in 2005/06, submitted 414 CXC entries but only 53.6% achieved Grade 4 or higher.
4.71 In rural coastal areas, conversion of CHS to GSS and consolidation of Primary Tops as GSS
should help achieve USE, provided enrollment, attendance and staffing can create viable secondary schools.
4.72 In Chapter 6, hinterland regions spend more per secondary student and school boarding/
accommodation contribute to these higher costs. Attracting/retaining qualified teachers adds to the cost per student. Higher unit costs are unavoidable in small schools – if it is not feasible to attract more students, the management issue should be to spend available funds to maximize the educational outcomes for the existing students. Sending students to larger schools for special units of study and bringing itinerant/peripatetic teachers to the school for specialized instruction have been discussed as ways in which small schools can strengthen student outcomes.
4.73 The fifth USE challenge is improving primary education performance (SSEE outcomes
in Tables 4.2 and 4.3 above), and transition from primary to secondary education – so that all children can access quality secondary education. The sixth USE challenge is improving student attendance across all schools in Guyana.
Recommendations for further action
4.74 Without action on each of these challenges, secondary schools in Guyana cannot achieve
USE targets and produce competitive results for Guyana students at the CXC. In many cases, Guyana requires analysis of student performance by region, by gender, by size of school and by quality of available teachers.
4.75 Improving NCERD analysis of SSEE entries and outcomes (see 4.5, 4.10, 4.12, 4.18), MOE
analysis of Grade 6/7 transition, repetition rates, attendance and Grade 11 completion rates (see 4.20, 4.23, 4.31, 4.44), and NCERD analysis of unit record CXC data (see 4.49-4.53, 4.57, 4.63) would assist Regional Departments target improved student outcomes.
4.76 One immediate step could be inclusion of a Grade 7-11 student attendance as a USE target. 4.77 Improving qualifications and training of teachers are discussed in Chapter 3. Strategies
which improve teacher satisfaction will improve retention, teacher attendance and student outcomes.

60
Chapter 5: Schools and Infrastructure
5.1 This chapter builds upon issues of school size and viability in Chapter 1, trends in population and enrollments (Chapter 2), the number of qualified teachers (Chapter 3) and student learning outcomes (Chapter 4) to argue for some balance between investing in facilities and investing in teaching/learning. New schools are required, especially in lowland areas where primary “tops” can be consolidated as General Secondary Schools, and investment would be justified to upgrade existing facilities and convert CHS to GSS, to improve water/sanitation and to provide electricity.
5.2 New school construction is necessary but will not be sufficient to achieve USE. Unless
more students complete primary with basic skills to success in grades 7-11, low student “demand” for secondary education and a shortage of qualified teachers not the supply of school places will prevent Guyana achieving USE.
5.3 This review was not required to assess the condition of existing schools, or demand for rehabilitation of facilities. Success of the SSRP, GEAP and BEAMS projects in promoting community ownership and use of its schools, combined with preventative maintenance, should be encouraged. Minimum rather than “ideal” standards for facilities should be enforced for all public and private schools, especially in communities which lack the resources to maintain public facilities.
5.4 One important lesson from recent projects in Guyana is that construction and school
rehabilitation are accompanied by strategies to improve enrollment, improve attendance and reduce student “drop-out”. Attracting and retaining qualified teachers are discussed in Chapter 3 must complement strategies to increase student “demand”. Fast Track Initiatives in hinterland regions include construction of teacher housing. If these prove effective, there could be a case for construction of secondary teacher accommodation in localities where staffing is difficult.
5.5 The major change has been an increase in General Secondary School enrollments over the past decade – not through the construction of new schools, but a net shift of students from primary tops and CHS and an increase in average GSS enrollment (from 539 in 1995/96 to 551 in 2000/01 and to 580 in 2005/06). Table 5.1 presents these trends - the numbers of CHS and GSS have remained almost unchanged since 2001/02. The number of “Primary Tops” classes has declined but enrollments have remained around 10,000 students.
Table 5.1 Secondary Schools and Enrollments by Type of School, 1995/96 to 2005/06
1995/96 1996/97 1997/98 1998/99 1999/00 2000/01 2001/02 2002/03 2003/04 2004/05 2005/06
P.Tops (classes) 311 311 312 310 305 284 276 276 263 243 244
CHS (schools) 37 37 36 35 33 24 24 24 24 24 24
GSS (schools) 65 67 68 69 70 79 81 82 82 82 82
PTops (students) 15,056 13,439 13,162 12,376 12,653 11,267 10,531 10,170 9,916 10,133 10,300
CHS (students) 13,294 14,083 12,421 12,764 13,787 10,369 10,187 9,294 9,326 9,202 9,256
GSS (students) 35,015 34,521 35,670 36,776 36,055 43,526 43,873 42,960 46,149 46,303 47,585
SECONDARY 63,365 62,043 61,253 61,916 62,495 65,162 64,591 62,424 65,391 65,638 67,141 GSS%Secondary 55.3% 55.6% 58.2% 59.4% 57.7% 66.8% 67.9% 68.8% 70.6% 70.5% 70.9%
Source: MOE Statistical Digests. As for Table 2.1 (Chapter 2)

61
5.6 New school construction may include a redistribution of existing students rather than new capacity adding “new” students. Construction of two new schools with capacity for 800-1000 students does not add an additional 1600-2000 to the total enrollment. Two new schools, Diamond (Region 4) and a second GSS in Bartica (Region 7), will have smaller effect on total enrollments. Diamond should absorb students from some large Primary Tops and the second Bartica school will absorb students from Bartica GSS69.
5.7 The impact of new construction could be further reduced by the proposed Ministry policy on placement of students at Diamond – setting a high SSEE entry score is inconsistent with the need for a “local” high school to provide better education for existing students in Primary Tops. It is possible for a “comprehensive” secondary school to do both – with two Grade 7 classes with entry based on SSEE scores, and a further three or four classes for children who reside locally.
5.8 Students from other areas who are placed at Diamond on their SSEE entry do not add to
total enrollment – there is a corresponding reduction in enrollment at the school they would otherwise attend. If students with selected entry prevent all students in local Primary tops transferring to the new school, retention of smaller Primary Tops would be counter to both USE and the justification for building the Diamond school.
5.9 The impact of renovation and new construction is evident in the following extracts from the
SSRP Implementation Completion Report in 2005. The estimated 3,000+ “new student places” on enrollment may be over-stated if the MOE norm of 40 students per secondary classroom is used rather than students per class ratio (25.6 in 2004/05). The extent to which students move from Primary tops or CHS to new places in GSS also overstates the increase in GSS enrollment.
SECONDARY SCHOOL REFORM PROJECT: IMPLEMENTATION COMPLETION REPORT (June 2005)
Page 9: The outcome includes not only the improved learning and school physical environment at 12 pilot schools and 18 Emergency Repair Schools (ERS), but also a more equitable distribution of educational opportunities to students living in all regions of Guyana. Much of the growth in enrollment was facilitated by increases in the number of classrooms available in the schools as a result of the School Environment component of the project. Overall, physical improvements at the pilot schools and their conversion to GSS have resulted in a 39 percent increase in enrollment at the 12 pilots from 1996 to 2003, thus providing 2,029 more children access to general secondary schools and the full benefits of the lower and upper secondary education curriculum.
Page 10: The completion of emergency repairs at 18 secondary school facilities has provided space for 12,440 secondary students based on the MOE standard for number of students per classroom and square feet per student. This represents an increase of over 3,000 new student places spread out among the 18 schools. All regions, including the poorest, most isolated hinterland regions benefited, as there was at least one ERS school located in each region plus Georgetown.
5.10 The GEAP Project Completion Report (December 2006: page 12) noted that Project schools in Regions 6 and 10 had provided learning space for 6,705 learners, an increase of 2,940 places. As with the SSRP observation, many new places would be occupied by students in previously unsatisfactory classrooms and/or relocated from Primary tops and CHS.
69 Bartica GSS had 1,080 students in 2005/06 and was the largest school in Guyana.

62
5.11 Table 5.2 presents enrollment data for renovated schools and new construction undertaken by SSRP, BEAMS and GEAP Projects. The SSRP effects may be understated by increased enrollments prior to the 2000/01 school year. Conversion of Primary Tops to full GSS demonstrate that USE objectives can be achieved, provided the nominal benefits are not exaggerated.
5.12 It is the quality of student learning outcomes which are the real USE objectives, not the
more visible impact on enrollment. Improved learning may reduce repetition rates and lower total enrollment, thus understating benefits of increased grade progression. Chapter 4 uses a ratio of Grade 11 students to the Grade 7 intake four years earlier and this may offer a better measure of benefits from new construction and rehabilitation. Increased Grade 11 enrollment and CXC outcomes for Wisburg GSS justifies GEAP-funded construction.
Table 5.2: Summary of Official Direct Assistance (ODA): SSRP, GEAP, BEAMS Projects – Renovation and New Construction and reported Enrollment Data
Schools MOE
ENROL2000
MOE ENROL
2004
Stud 2004
Stud 2005 Male
Stud 2005 Fem.
Stud 2005
Change on 2000
SSRP(1) ERS 19 10,515 11,394 11,119 5,165 6,276 11,441 +926
SSRP(2) Pilots 12 6,316 7,197 7,269 3,421 3,675 7,096 +780
BEAMS(1) Renovation 5 3,196 1,981 2,771 1,152 1,278 2,430 -766
BEAMS(2) new construction 3 521 615 615 343 310 653 +132
GEAP(1) Rehabilitation 6 3,701 4,168 4,173 1,842 2,241 4,083 +382
GEAP(2) new construction 2 291 1,101 1,050 847 754 1301 +1,010
Government funded 2 871 1,427 1,427 686 741 1,427 +556
TOTAL Construction 49 22,323 24,838 25,345 12,115 13,655 25,780 +3,457
Source: MOE Summary (December 2007). See Attachment J 5.13 Consolidation of CHS had a major impact on apparent GSS enrollment “growth”. If
aggregate secondary enrollments are to stabilize and possibly decline after 2011/12 (see Chapter 2), Guyana can still make a major case for ongoing donor assistance in school construction – provided the justification is based on the quality of education offered and student learning outcomes. Feasibility studies will need to pay more attention to documenting baseline learning outcomes (in feeder Primary schools and in any Primary Tops or CHS being consolidated) so that evaluation of a new GSS at project completion is more detailed and comprehensive.
5.14 Providing a viable secondary education in “small” GSS requires special attention in national
and regional USE planning. In contrast to higher performance in Regions 2 and 5, only 13% of Region 1 and 11.5% of Region 8 students survived to Grade 11.70
5.15 As noted in Chapter 2, primary enrollments in hinterland regions have expanded at each age, and should increase further through EFA FTI activities. Increased access and improved quality in primary teaching and learning should increase demand for secondary education. These regions have mostly Amerindian populations in small, dispersed villages. Increased progression to secondary may require retaining secondary departments in many Primary
70 Only 2/150 boys at Paramakatoi GSS and 7/102 boys at Mahdia GSS in Region 8 reached Grade 11 in 2005/06 (<4%) – assuming that this is not a data error, the Regional USE plan needs to respond to the causes of this problem.

63
schools, operating a cluster of secondary departments as a multi-site secondary school (with secondary teachers appointed to the central secondary school not the “host” primary school), appointing peripatetic (itinerant) teachers, in Math especially, to support teachers in small schools, or the provision of more scholarships and secondary boarding school places.
5.16 As part of Regional Plans, communities in each locality should identify options which are
appropriate for their children. Boarding schools require greater capital expenditure and higher recurrent spending per student. Small dormitories attached to small CHS or GSS may give access to “some” secondary education, but not necessarily a “good” education. There may be savings in lower initial capital cost, but small dormitories cost more per student to operate in staffing, cleaning and utilities (especially if compared with a larger dormitory operating at near capacity).
Bartica Secondary School: The Government is committed to rebuilding the boys’ dormitory destroyed by fire in December 2007. There were only 26 boys (and 24 girls) boarding. The Government could turn disaster to advantage by constructing a larger dormitory than the one destroyed. Bartica GSS is currently the largest in Guyana, with a second GSS being constructed by the BEAMS Project.
For USE planning, would a larger dormitory provide better access to high quality secondary education for remote communities in Region 7?
5.17 An alternative to boarding facilities would be sufficient recurrent funding for teachers from the “central” secondary school to travel to satellite classes located in Primary Tops. There should be funding for students (and teachers) in satellite classes to travel to one location for selected whole school activities and to access specialist facilities such as science laboratories. As primary learning outcomes improve and enable more children to continue into secondary grades in General Secondary Schools, regional boarding school/s could focus on upper secondary grades with provision of specialist teachers and facilities to prepare students for CXC exams. Later entry to boarding may meet some of the reported Amerindian concerns and their reluctance to send younger children away from home.
5.18 Throughout this analysis, low students enrollment aggravates any effects of poverty and/or
isolation. School “size” is not only a descriptive attribute of a school, size directly affects the number/s of teachers appointed, their qualifications and skills, the quality of teaching and the quality of learning. If size of school is determined by population distribution, the challenge for Guyana is the level of resources that small schools will need IF 75% of children completing primary school are to have access to a quality 5-year secondary education program (USE Outcome 1 for 2010). Guyana must invest more per student in small schools. Teacher impact is discussed in Chapter 3, impact on learning in Chapter 4 and the financial impact of higher expenditure per student in Chapter 6.
5.19 Unlike staffing ratios, which suggest that a given enrollment needs an agreed number of
teachers to deliver a viable secondary curriculum, planning of school facilities has to be based on local considerations – the number of children in the community and distances students have to travel to a proposed school site. Regional departments need “local” plans, which also include renovation, upgrading or replacement of sub-standard facilities.
5.20 In the USE scenarios presented in Chapter 7 is has not been possible to model local factors.
With local audits of existing school facilities and numbers of children completing Primary

64
schools, Regional departments should nominate their priorities for GSS construction. The Ministry role should be to recommend national priorities for new construction, to identify whether external assistance is available, and to present a case to Government for new capital expenditure.
5.21 Georgetown presents particular planning problems – with 15,000 secondary students in 25
GSS (an average 598 students/GSS) and many of these schools on having inadequate facilities and located on small sites. In addition there are 7 CHS, with an average 409 students and a total of only 51 students (<2%) in Grade 11 in 2004/05, which require major investment if they are to be upgraded to GSS. Georgetown is supporting almost 18,000 students in 32 public secondary schools when it requires 15-20 “comprehensive” schools with adequate facilities and staffing.
5.22 Strengthening rural schools will reduce demand for Grade 7 placement in Georgetown, but
that is only a temporary solution. Consolidation of Primary Tops and CHS in Regions 3 and 4 to offer quality GSS education and reduce daily travel by students into Georgetown suggests that a Region “3+4+11” Strategy may be required. There is no simple strategy for consolidating and upgrading secondary schooling in Georgetown, but the opening of the new Diamond GSS in Region 4 presents an opportunity for a large school, with adequate staffing and new facilities, to offer a quality education which discourages students traveling into Georgetown. A 5-10 year plan to construct 5 new GSS in Georgetown (and eliminate a number of the smaller schools with poor facilities) should be examined.
5.23 The Baseline scenario in Chapter 7 includes the new Bartica and Diamond GSS, two
schools in 2008/09 (unlikely if planning has not already been completed and construction not yet started) and then one new school per annum. This capital program will not enable Guyana to achieve USE. The High Outcome scenario envisages construction of 12 new GSS (similar to what Guyana “achieved”, not necessarily by new construction, between 1999/2000 and 2002/03. See Table 5.1).
5.24 These are not forecasts – but an attempt to model what USE objectives could be achieved
if that investment was made and Guyana was successful in improving primary school outcomes, improving progression to Grade 7 (preferably in GSS), reducing repetition, improving student and teacher attendance, improving retention to Grade 11 and improving CXC outcomes and other competencies.
5.25 The three scenarios in Chapter 7 (table 7.3) estimate that Guyana needs 5 new GSS by 2012
to meet baseline demand, +8 GSS to meet the medium scenario and 12 new GSS to meet the high outcome scenario. These are not necessarily all “new” schools. This Review of USE suggests there are different combinations of new schools, upgrading CHS to GSS with some additional facilities, building student dormitories attached to existing rural GSS, or expanding facilities at existing GSS.
5.26 The Ministry and Regional Departments should provide a listing of all schools by their
current condition, classrooms and student capacity71. Each school requires an assessment of medium-term requirement for that school, using a scale from 1-to-20, to estimate the aggregate cost of proposed facilities plans.
71 School capacity = useable classrooms multiplied by 25 students per classroom. This is a more realistic estimate than 40 per classroom assumed in SSRP analysis.
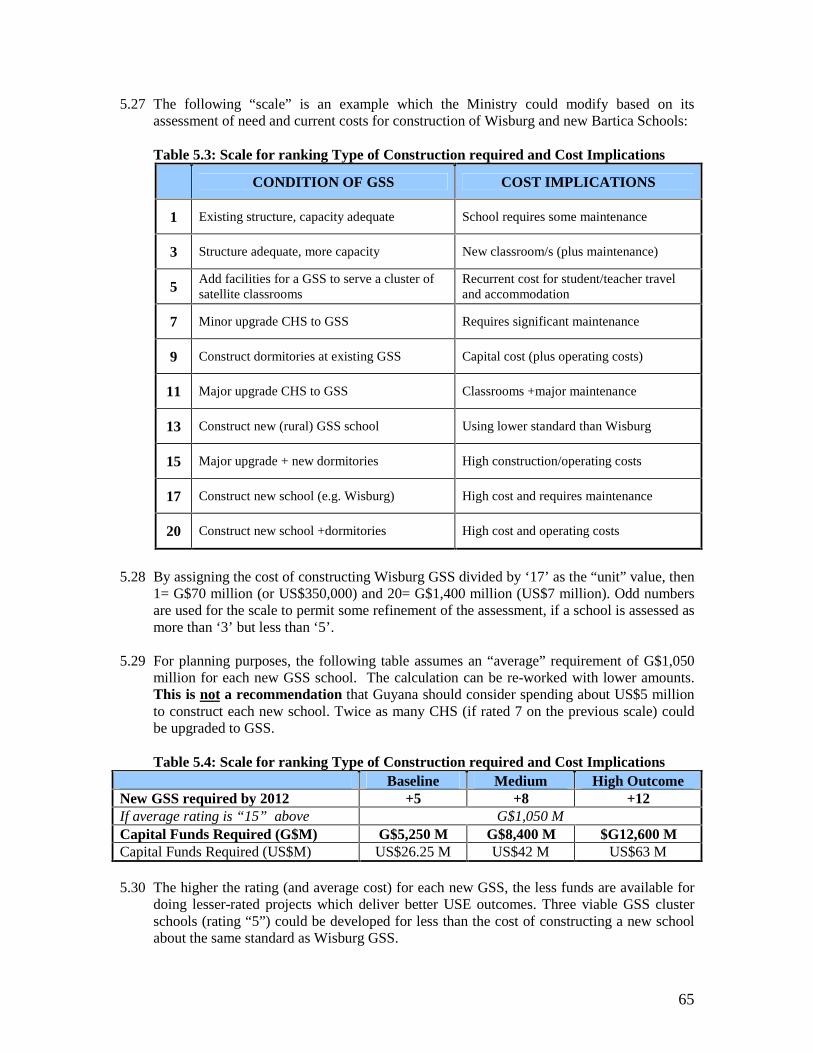
65
5.27 The following “scale” is an example which the Ministry could modify based on its assessment of need and current costs for construction of Wisburg and new Bartica Schools:
Table 5.3: Scale for ranking Type of Construction required and Cost Implications
CONDITION OF GSS COST IMPLICATIONS
1 Existing structure, capacity adequate School requires some maintenance
3 Structure adequate, more capacity New classroom/s (plus maintenance)
5Add facilities for a GSS to serve a cluster of satellite classrooms
Recurrent cost for student/teacher travel and accommodation
7 Minor upgrade CHS to GSS Requires significant maintenance
9 Construct dormitories at existing GSS Capital cost (plus operating costs)
11 Major upgrade CHS to GSS Classrooms +major maintenance
13 Construct new (rural) GSS school Using lower standard than Wisburg
15 Major upgrade + new dormitories High construction/operating costs
17 Construct new school (e.g. Wisburg) High cost and requires maintenance
20 Construct new school +dormitories High cost and operating costs
5.28 By assigning the cost of constructing Wisburg GSS divided by ‘17’ as the “unit” value, then 1= G$70 million (or US$350,000) and 20= G$1,400 million (US$7 million). Odd numbers are used for the scale to permit some refinement of the assessment, if a school is assessed as more than ‘3’ but less than ‘5’.
5.29 For planning purposes, the following table assumes an “average” requirement of G$1,050
million for each new GSS school. The calculation can be re-worked with lower amounts. This is not a recommendation that Guyana should consider spending about US$5 million to construct each new school. Twice as many CHS (if rated 7 on the previous scale) could be upgraded to GSS. Table 5.4: Scale for ranking Type of Construction required and Cost Implications
Baseline Medium High Outcome New GSS required by 2012 +5 +8 +12 If average rating is “15” above G$1,050 M Capital Funds Required (G$M) G$5,250 M G$8,400 M $G12,600 M Capital Funds Required (US$M) US$26.25 M US$42 M US$63 M
5.30 The higher the rating (and average cost) for each new GSS, the less funds are available for doing lesser-rated projects which deliver better USE outcomes. Three viable GSS cluster schools (rating “5”) could be developed for less than the cost of constructing a new school about the same standard as Wisburg GSS.

66
5.31 The primary purpose of this analysis is to encourage Regional Departments to assess their capital requirements on a school-by-school basis, to identify the community priorities and the best use of funds (if they became available). Upgrading CHS to GSS or consolidating Primary Tops as a GSS may be higher priorities than construction of fewer, high quality GSS schools.
5.32 The second purpose would be to encourage Regional Departments to identify smaller
projects which donors could finance, or encourage communities to find other sources of funding.
5.33 The more effective FTI (EFA) strategies are in hinterland regions, the greater the
requirement for providing better access to quality secondary school places for the greater number of students completing Grade 6. Retaining these children in a quality GSS within their region has the added benefit that overall education performance in that region should improve.
5.34 The final purpose is to reinforce the message that capital spending will not achieve USE
unless there is equivalent expenditure on ensuring schools are fully staffed with qualified teachers and have sufficient non-salary funding to support quality learning outcomes.
5.35 Guyana will need to match any capital investment with at least the same investment in retaining, refreshing, upgrading and certifying teachers. New construction may be more visible investment but quality teaching is the prerequisite for quality student outcomes.
5.36 As a postscript, patterns of expenditure in Chapter 6 indicate negligible investment in
maintenance of existing school facilities. New design, such as Wisburg GSS, may offer “low cost” maintenance. This should not be equated with “no cost” maintenance. Community investment in “preventative” maintenance should be encouraged in any physical school planning – and to increase community “ownership” and pride in its schools. There is another contradiction evident in Chapter 6 – most regions are spending more on school “security” than they are on “maintenance”. Community “use” of its school facilities may generate more support for maintaining and upgrading facilities and reduce the need “security”.

67
Chapter 6 Secondary Education Resources and Budgets
6.1 There are three approaches to education finance issues – a macro approach measuring education sector share of GDP and share of budget, an efficiency approach which measures expenditure per student and accounts for how available funds are spent and the examination of individual school planning and budgets. Chapter 6 presents a brief summary of published data on the three approaches to education finance – macro sector approach, per student efficiency approach and the whole school approach. This Chapter argues that Guyana needs a more radical approach if the broad USE objectives are to be achieved – and recommends steps towards such an outcomes approach.
6.2 Increasing sector share, increasing expenditure per secondary student and “whole” school planning will have little benefit until the focus is on USE objectives – students completing 5 years secondary schooling with competitive CXC outcomes. In calendar year 2005, Guyana spent G$13.287 billion on the education sector – with the result that 6,708 students were enrolled in Grade 11 in 2005/06 (43% of the population aged 15), and there were 7608 entries in CXC English in 200672. Chapter 7 presents several scenarios by which Guyana can improve its USE outcomes. Doubling national education expenditure to lift CXC outcomes to 75% of the cohort aged 15 or 16 is not a viable strategy.
6.3 Better use of current resources to improve prospects of more children reaching Grade 11 and CXC will require the strategies identified in Chapters 2, 3 and 4 – improving primary participation and completion rates, improving SSEE performance so that more children can continue to General Secondary Schools, improving student attendance from around 70% to 90%, and improving the quality and qualifications of all teachers. Guyana will require stronger secondary schools in each region (with boarding facilities in hinterland regions) and fewer, larger secondary schools in more densely-settled regions.
I. Measuring Education Shares of Budget and Gross Domestic Product
6.4 Table 6.1 and Figure 6.1 show an education share of national budget fluctuating in a band between 14.5% and 17.2%, and an education share of GDP around 8%.
Table 6.1: Education Expenditure and Share of Budget and GDP, 1999-2006 G$millions 1999 2000 2001 2002 2003 2004 2005 2006 Educ. Recurrent 5,150.6 5,866.1 7,407.3 8,488.3 8,977.8 9,813.8 10,336.2 Educ. Capital 1,725.0 3,661.1 3,889.0 2,009.1 2,363.1 2,274.0 2,950.9 Education Total 6,875.6 9,527.2 11,296.3 10,497.3 11,340.9 12,087.8 13,287.0 Education(-ODA) 5,936.6 6,929.9 8,275.6 9,065.2 10,106.9 10,707.9 11,316.30 Nat. Recurrent 41,909.8 48,443.1 47,166.0 44,876.2 51,249.0 54,708.3 56,664.5 61,853.0 National Capital 12,345.2 17,132.8 18,660.6 18,092.7 20,588.3 18,400.1 35,138.2 41,900.6 National Budget 54,255.0 65,575.9 65,826.6 62,968.9 71,837.3 73,108.4 91,802.6 103,753.6 GDP 120,668.0 130,013.0 133,404.0 117,762.0 144,064.0 156,358.0 164,964.8 179,437.6 Education %Budget 12.7% 14.5% 17.2% 16.7% 15.8% 16.5% 14.5% Education %GDP 5.7% 7.3% 8.5% 8.9% 7.9% 7.7% 8.1% ODA %Education 13.7% 27.3% 26.7% 13.6% 10.9% 11.4% 14.8%
Official Direct Assistance (ODA) includes SSRP, BEIP, GEAP, GBET, BEAMS and EFA FTI (from 2005); (Finance.xls)
Source: Budget Documents (reported in MOE Statistical Digests); 2006 Poverty Expenditure Tracking Report Table 2.2
72 Table 6.1 (note only G$11.316 billion if Official Direct Assistance is excluded), or G$7 billion on Primary and Secondary recurrent spending (Table 6.2), Table 4.10 for Grade 11 enrollment, Table 2.1 for inferred population, and Table 4.11 for CXC English entries.

68
6.5 Although a basis for international comparison, widely reported and used advocate for increased education expenditure, “share” measures may be misleading. These formulae work best when the Budget and GDP are increasing in real terms. More labor intensive sectors such as education and health are penalized if there are no real increases in Budget and GDP. Sector shares may appear to increase more when Budget or GDP decline but real education expenditure may have declined.
6.6 External project assistance has been a major contributor to education development – as high as 27% of total education expenditure in 2000 and 2001. In FY2005, it was 14.8%. Most external assistance is education capital expenditure.
Figure 6.1
Education Recurrent and Capital Expenditure 1999-2005 (G$000 current prices)
12.7%
17.2%14.5%
8.1%
-
4,000,000
8,000,000
12,000,000
0%
10%
20%
30%
%Bu
dget
and
%G
DP
Ed.Recurrent Ed.Capital Education % Budget Education % GDP
6.7 Figure 6.1 reports “current” prices. If adjusted for inflation, the columns would be flatter and possibly declining. Without consistent measures of inflation, the exchange rate against the US dollar is used as a proxy measure. The Guyana economy is heavily dependent on mineral and agricultural exports and imports most consumer goods, so the “exchange rate” may suitable most cases. One limitation is the US dollar also responds to international trade and capital flows which may not directly affect domestic prices in Guyana.
6.8 Sector shares encourage incremental increase and maintain a tension between the MOE role as a “bidding” agency and MOF role as the funding agency. Bidding agencies need to maximize their bid, in the knowledge that funds allocated will be less than those sought. The Education Ministry (and Regional Departments) can only implement new initiatives with external project assistance or by reducing funds available on already “under-funded” activities. The added constraint in the education sector is that teacher salaries dominate recurrent education expenditure – 86% in Primary and 75% in Secondary – leading to further “under-funding” of non-salaries spending.
6.9 Poverty Expenditure tracking reports (PETR) as part of the National Poverty Reduction Strategy identify those elements of the sector approach which are identified as “priority poverty spending” 73.
73 Poverty Expenditure Tracking Report (PETR): Basic education is all “priority poverty spending”.

69
II. Using Existing Education Budgets more Efficiently
6.10 (2) Efficiency measures attempt to combine line-item accounting by sector and by region to “describe” how sector funds are allocated. Table 6.2 shows average expenditure for 2004 and 200674. This is not a measure of the adequacy of funding - salaries are limited by the numbers of available staff and their qualifications. Primary and Secondary expenditure may be understated in some regions – due to differences in expenditure by region and in how some regions report their education spending.
Table 6.2: Reported Recurrent Education Expenditure, 2004-2006 (G$) Recurrent Expenditure 2004 2006
Primary 75 Salaries (a) 2,574,177,723 2,883,426,191Non-Salary 434,132,963 483,416,864
Secondary Salaries (a) 1,821,937,954 2,025,259,524Non-Salary (b) 599,327,193 704,511,356
Primary %Salaries 85.6% 85.6% % Other 14.4% 14.4%
Secondary %Salaries 75.2% 74.2% % Other 24.8% 25.8%
Source: MOF FreeBalance Financial Management System reports (aggregated from Regional Reports). See Attachment G for breakdown by Region and by Expenditure categories. (a) Salaries total plus Benefits and Allowances, and National Insurance. (b) Non-salary includes G$242m Subventions (#6301) for President’s College and Queen’s College.
6.11 Table 6.3 illustrates some limitations in the analysis of aggregated Regional reports. In Hinterland Regions (R1,7,8&9) salary on-costs76 were 16-18% of non-salary Primary recurrent expenditure, compared to 10% in Regions 5,6&10, and 8% in Regions 3,4 &11.
Table 6.3 Primary Education Expenditure shares by Category of Expenditure, 2004, 2006 FIN.
YEAR Regions On-costs
613 Security
628 Mainten. 624,625
Materials 622, 623
Other(nei)
Primary NonSalary
G$ million
2004 R1,7,8,9 18% 0.6% 2.9% 1.9% 2.8% 26.5% 395 2006 R1,7,8,9 16% 0.3% 4.6% 2.8% 2.9% 27.0% 472 2004 R2,5,6,10 10% 7.2% 3.5% 1.2% 0.8% 22.9% 1,162 2006 R2,5,6,10 10% 5.8% 4.9% 1.8% 0.4% 23.2% 1,267 2004 R3,4,11 8% 7.3% 6.9% 0.7% 2.7% 25.6% 1,451
2006 R3,4,11 8% 6.8% 5.7% 1.5% 2.5% 24.8% 1,628
2004 Guyana 10% 6.4% 5.0% 1.1% 2.0% 24.7% 3,008 2006 Primary 10% 5.5% 5.2% 1.8% 1.8% 24.5% 3,367
Source: MOF FreeBalance Financial Management System reports. Region 11 is Georgetown.
6.12 Some regions pay school/building maintenance (#6242, #6252, #6255) and utilities –telephone (#6271), electricity (#6272), water (#6273) – from Education Department Administration (401) central funds not from Nursery (402), Primary (403) or Secondary (404) allocations. Primary schools in R3411 spent about 7% of non-salary expenditure on security for schools (#6281). (Regions 256&10 allocated 6-7%; but R1789 less than 1%).
74 Comparable 2005 data were not available for this analysis. 75 Note Primary includes Secondary Departments (“Tops”); Secondary=CHS+GSS expenditure; 76 #6133 benefits and allowances.

70
6.13 Table 6.4 presents comparable data for secondary schools77, with contrasts in On-Costs and Security and Maintenance.
Table 6.4: Secondary Education Expenditure shares by Expenditure Category, 2004, 2006
FIN. YEAR
Regions On-costs 613
Security 628
Mainten.624,625
Materials 622, 623
Boarding629
Other 630
SecondaryNonSalary
G$ million
2004 R1,7,8,9 12% 1.0% 1.2% 2.1% 27% 1% 43.7% 143 2006 R1,7,8,9 14% 1.2% 0.3% 3.3% 34% 0% 53.2% 247 2004 R2,5,6,10 12% 5.7% 3.1% 1.4% 1% 0% 23.5% 761 2006 R2,5,6,10 10% 7.1% 2.7% 2.0% 2% 0% 24.2% 926 2004 R3,4,11 7% 5.2% 6.8% 0.9% 0% 15% 35.0% 1,517 2006 R3,4,11 7% 5.7% 5.4% 1.7% 0% 16% 35.8% 1,557 2004 Guyana 8% 5.1% 5.3% 1.1% 2% 10% 31.9% 2,421 2006 Secondary 9% 5.8% 4.0% 2.0% 4% 9% 33.4% 2,730
Source: MOF FreeBalance Financial Management System reports 6.14 If Residential costs (#6292) and block grants to President’s and Queen’s Colleges (#6301)
were excluded non-salary expenditure would be around 20% of secondary expenditure. Except for the distortions caused by residential expenditure and block grants, the shaded cells in Tables 6.3 and 6.4 show similarities in primary and secondary expenditure. Figures 6.2 and 6.3 use different formats highlight contrasts between regions (Primary) and non-salary expenditure type (Secondary).
Figure 6.2
Primary Non-Salary Expenditure by Region, 2004, 2006
0%
2%
4%
6%
8%
10%
12%
14%
16%
18%
20%
R1789 R1789 R2560 R2560 R3411 R3411
2004 2006 2004 2006 2004 2006
Per
cent
Pri
mar
yE
xpen
ditu
r
On-costs 613
Security628
Mainten.624,625
Materials622, 623
Other(nei)
higher allowances in hinterland regions
less security costs in hinterland regions
6.15 Regions are aggregated throughout this analysis to highlight contrasts but data for each Region are included in Attachments.
77 Secondary= GSS+CHS only; Primary Tops are included in Primary Expenditure.

71
Figure 6.3
Source: As for Tables 6.2 and 6.3.
6.16 In Table 6.5, for example, the Nursery, Primary and Secondary expenditure reported in detailed by Region are compared with Regional totals in the MOE Education Digest (measure a/c) and with “Education Delivery” (measure a/b). Regional data for the four hinterland regions (R1, 7, 8&9) show total Education Expenditure as 60-70% of total education expenditure reported nationally. Some regions report “education” expenditure such as “maintenance” in their Administrative budget.
Table 6.5: Comparing Combined Regional Budgets and Education Digest data, 2004
REGION [A] 2004 404NPS G$000
[B] 2004 Education Delivery G$000
2004 Buildings Furniture
G$000
[C] 2004 Education
(Digest) G$000
Measure [A/C]
Measure [A/B]
R1,7,8,9 613,932 881,738 118,052 999,790 61.0% 69.6% R2,5,6,10 2,336,260 2,566,410 91,783 2,658,193 88.0% 91.0% R3,4,11 3,659,069 4,785,555 126,782 4,912,337 74.0% 76.5% Guyana 6,609,260 8,233,703 336,617 8,570,320 77.0% 80.3%
6.17 Table 6.6 disaggregates Table 6.5 to show variations by regions. Georgetown (Region 11) expenditure is distorted by “national” expenditure by MOE, and is in marked contrast to adjacent Regions 3 and 4. President’s College is located in Region 4 but the block grant (“subvention”) appears in Ministry+Region 11. Understanding these differences is essential if per capita expenditure calculations are is consistent.
Boarding costs large part of hinterland
Subventions for President’s and Queen’s colleges

72
Table 6.6: Comparing Individual Regional Budgets and Education Digest data, 2004
REGION [A] 2004 404NPS G$000
[B] 2004 Education Delivery G$000
2004 Buildings Furniture
G$000
[C] 2004 Education
(Digest) G$000
Measure [A/C]
Measure [A/B]
01 210,062 272,609 37,462 310,071 68.0% 77.1% 02 487,514 545,051 16,077 561,128 87.0% 89.4% 03 720,672 789,630 27,970 817,600 88.0% 91.3% 04 1,013,453 1,067,110 26,705 1,093,815 93.0% 95.0% 05 434,940 482,954 20,981 503,935 86.0% 90.1% 06 808,031 877,219 17,073 894,292 90.0% 92.1% 07 180,780 282,592 21,499 304,091 59.0% 64.0% 08 51,495 100,999 20,586 121,585 42.0% 51.0% 09 171,595 225,538 38,505 264,043 65.0% 76.1% 10 605,775 661,186 37,652 698,838 87.0% 91.6% 11 1,924,943 2,928,815 72,107 3,000,922 64.0% 65.7%
Total 6,609,260 8,233,703 336,617 8,570,320 77.0% 80.3% Source: Attachment G
6.18 Expenditure per Student: Matching expenditure data with comparable enrollment data for approximately the same time period in a prerequisite for calculating expenditure per capita. Secondary education expenditure per capita should be used with caution. Apart from the above regional differences, there are two particular items which distort average expenditure per secondary student – boarding school costs in Regions 1, 2, 7, 8, 9 and 10, and subventions from the Ministry reported as Region 11 to Queen’s College (in Region 11) and President’s College (in Region 4)78.
6.19 Table 6.7 “adjusts” 2006 expenditure by apportioning administrative expenditure across Primary (including secondary students in Primary Tops) and Secondary (GSS+CHS). Calendar year 2006 expenditure is divided by the 2005/06 school year enrollment to calculate average expenditure per student in each Region.
Table 6.7 Per Capita Expenditure per Student by Level and by Region, 2006
REGION Primary
+Ptops 2006 [B] 2006
GSS+CHS [A] 2006
Secondary Impact
[(A)/(B)-1]
01 34,037 50,638 61,708 22% 02 37,775 45,304 47,716 5% 03 30,341 38,779 38,779 0% 04 26,893 39,405 39,405 0% 05 29,834 42,622 42,901 1% 06 24,633 37,209 37,213 0% 07 55,376 49,641 90,277 82% 08 34,737 57,375 107,251 87% 09 25,115 89,152 106,784 20% 10 44,503 67,930 70,317 4% 11 30,012 46,600 60,023 29%
GUYANA 30,742 45,160 51,686 14% Source: Region_Spending 2004-2006.XLS (Adjusted); FY0406_XRegSubProg_FEB2008.sql
78 Subventions G$240,428,000 represent 8.8% of 2006 Secondary expenditure (Sub-Program 404).

73
6.20 With the exception of Region 7 ($55,376 per “primary” student) and Region 10 (G$44,503), regions range between G$24,633 and G$37,775/student. Primary averages G$30,742 per student.
6.21 Secondary expenditure per student averages G$45,160 excluding residential costs and PC/QC subventions, and $51,686 per student including those costs. Note that the PC subvention is part of the Ministry budget and shown against Region 11 but the PC students are reported against Region 4 enrollment.
6.22 The last column in Table 6.7 is the percentage difference between Total Secondary Expenditure per student (a) and average expenditure excluding residential accommodation costs (#6292) and Subventions (#6301). The impact in Region 11 is less marked because the Subvention amount is spread across 15,245 GSS students and 2,824 CHS students. With fewer than a thousand students in Regions 8 and 9, small enrollment contributes to higher average expenditure per student. Given this level of expenditure, the effectiveness of secondary expenditure could be questioned given low secondary completion and few students with Grade I-III passes at CXC examinations.
6.23 Figure 6.4 graphs the data in Table 6.7, showing less variation across the regions in average expenditure per Primary student (including Tops) and the impact of small enrollment and residential costs on average expenditure per secondary student.
Figure 6.4
Adjusted PerCapita Expenditure, 2006
0
10,00020,000
30,000
40,000
50,000
60,000
70,000
80,000
90,000
100,000110,000
120,000
01 02 03 04 05 06 07 08 09 10 11
Regions
G$pe
rstu
dent
Primary+Ptops 2006
GSS+CHS2006 (b)
2006 (a)Secondary
Source: Region_Spending 2004-2006.XLS (Adjusted) 6.24 Student Residential costs: The impact of boarding/residential expenditure is illustrated
further in Figure 6.5, with the difference between Table 6.7 values and those in Figure 6.5 being that Table 6.7 has administrative expenditure allocated pro-rata. In both calculations, students in Primary “tops” are excluded (because their expenditure is reported in Primary expenditure). Georgetown (Region 11) is excluded.

74
Figure 6.5
Impact of Boarding on Average Cost per Secondary Student (GSS+CHS), 2006
0
20000
40000
60000
80000
100000
01 02 03 04 05 06 07 08 09 10
Region
G$
per
stu
den
t
0%
20%
40%
60%
80%
100%
Pri
mar
yT
op
s%
To
tal
Sec
on
dar
y
Including Boarding Excluding Boarding %Tops
Source: Region_Spending_2004_2006.xls (Boarding worksheet) 6.25 Secondary “boarding” or “dormitory” costs79 are necessary for access to secondary
education in hinterland regions – accounting for 51% of all Secondary education expenditure in Region 8, 49% in Region 7, 18% in Region 1 and 17% in Region 9.
6.26 Further analysis should be undertaken of cost structures for all residential facilities attached to schools, including secondary schools and colleges in Georgetown and Region 4 which receive students from primary schools in other Regions. This should not be read as an argument against or criticism of residential facilities – they are necessary, and will become even more so as a greater proportion of primary children in more remote regions complete primary education.
6.27 In regions where the distribution of population and primary students is dispersed, more secondary residential places in a centrally located school could be more effective than the construction of small General Secondary Schools. Small schools face difficulty in covering the whole curriculum, as well as attracting experienced and qualified teachers. The quality of the residential facilities, food, washing facilities and pastoral care/supervision should be reviewed, and upgraded – so that Amerindian and other isolated communities have confidence in sending their children “away” to school.
6.28 The unit cost of residential places declines as capacity and occupancy increase, making larger, better-quality facilities more efficient than many smaller facilities attached to isolated schools.
6.29 The Ministry does not collect data on boarding facilities as part of its annual data collection. While not recommending more reporting by schools and districts, Regional Education officials in Regions 1,7,8&9 (plus other Regions which maintain smaller facilities which many not be on the Budget, or with community resources) should advise on how improving the network and quality of residential facilities can contribute to better access to high quality secondary education.
79 Item #6292 Dietary in the MOF Chart of Accounts

75
6.30 Size of School and Student/Teacher Ratios: As discussed in Chapter 1, the number and distribution of “small” schools in Guyana leads to lower ratios of students per teachers. Together with low STR, fixed costs of operating schools spread across small numbers of students inflate average expenditure per student. Scenarios examined in Chapter 7 assume both increases in average school enrollment and improvement in STRs. Caution is required because school size and STR are “outcomes” and not input factors which can be determined through administrative policy.
6.31 With sparse population distribution in hinterland regions, small schools and higher costs per student are an inevitable “price” for providing access for all children. The educational planning issue should be to ensure that the higher price delivers good quality services, and this will require initiatives such as ensuring that “Primary Tops” have at least 35 students, and two trained and qualified teachers – one in English and one in Math. Alternatives such as clustering “tops” as satellite classes in a centrally located GSS or provision of residential accommodation may have even higher costs per student, but this expenditure is justifiable IF students progress to Grade 11 with quality CXC outcomes.
6.32 Consolidation of primary tops into GSS and upgrading CHS to GSS are discussed in
Chapter 5. Both remain important USE strategies and will require significant capital investment. If the result is an improvement in average school enrollment, improved STR, schools staffed by better qualified teachers and more students complete Grade 11 with good CXC results, the investment can be justified. Redistribution of existing students and teachers across fewer schools should be contingent on better quality learning outcomes.
6.33 Unqualified, Untrained Teachers: Even though teacher salaries including on-costs are approximately 86% in Primary schools and 75% in secondary schools (see Table 6.1 above), there should be a measure of the budget a Region would require if all teachers were qualified and trained. Table 6.8 (Primary) and Table 6.9 (Secondary) show required expenditure based on numbers of teachers and nominal salaries and allowances.
Table 6.8: Projected Primary Salary Expenditure versus Actual Salary Expenditure
PRIMARY TEACHERS includes Primary Tops
Nominal SALARIES +Allowances
Actual Budget (G$000)
2004/05 Trained Untrained Trained Untrained FY2004 FY2006 Graduate 136 6 199,891 5,995 Qualified 2333 1323 2,484,175 859,744 Unqualified 0 636 - 298,365
Salaries (6110) and on-costs (6130)
expenditure
Unfilled80 0 0 - - 2,266,629 2,541,927
4434 G$000 3,848,170 307,549 341,499
%Trained 55.7% Allowances: 13.3% 2,574,178 2,883,426Source: Attachment (includes analysis by Region)
6.34 Actual expenditure on Primary salaries and allowances is G$2.574-2.883 billion compared with nominal salaries of G$3.848 billion. This analysis suggests that approximately G$1 billion “saved” by employing unqualified and untrained Primary teachers could be used to upgrade teachers to “trained” and “qualified” status. Improving quality of Primary teaching is a prerequisite for achieving USE.
80 No data on unfilled positions was available for this analysis. Nominal salaries expenditure would be larger if all positions were filled by qualified and trained teachers.

76
6.35 The argument that each Region could use any annual “savings” to improve quality: - recruit qualified teachers, especially in English and Math for Primary Tops, - provide “on-the-job”/in-classroom/in-school training for qualified/untrained, - provide in-school or term-break courses which count towards qualification, - subsidize cost of travel by Primary Tops teachers to a centrally located GSS, - subsidize cost of travel by specialist GSS teachers to their “satellite” Primary Tops, - subsidize experienced/qualified GSS teacher participation in CXC marking, and - encourage the retention of existing teachers.
Table 6.9 Projected Secondary Salary Expenditure versus Actual Salary Expenditure
SECONDARY TEACHERS (GSS+CHS only)
Nominal SALARIES +Allowances
Actual Budget (G$000)
2004/05 Trained Untrained Trained Untrained FY2004 FY2006 Graduate 344 149 505,606 148,883 Qualified 1245 1025 1,325,674 666,091 Unqualified 0 165 - 77,406
Unfilled 0 0 - - 1,616,746 1,785,716
2928 G$000 2,723,660 205,192 209,172
1,821,938 1,994,888%Trained 54.3% Allowances: 13.3% Shortfall? -27%
Source: Attachment (includes analysis by Region) 6.36 The first six strategies should contribute to better student learning outcomes, greater
transition from Grade 6 to Grade 7, and from Primary Tops to GSS. The final strategy is aimed at reducing need to find and recruit more teachers than would otherwise be required.
6.37 Other strategies such as construction of teacher housing should continue, and justified as in paragraphs 6.35-6.36, as contributing to better learning, but not from the “salary saving” fund. The size of this fund should decline as the proportion of qualified/trained teachers increases – by which time the value of strategies 6.32 will have been demonstrated, and Regions see the value in funding activity from the local Budget.
III. Whole School Plans and Budgets
6.38 Regional analysis and regional plans in the previous section were identified as ways of improving local efficiency and applying savings to improve student learning outcomes. Guyana has demonstrated considerable success at the individual school level, through both the SSPP and GEAP Projects81. Through rehabilitation of existing facilities and the construction of new classrooms, education projects have been successful in mobilizing community “ownership” of schools and in generating financial and in-kind contributions.
6.39 Analysis of individual school budgets82, especially in comparing average expenditure per
student with national or regional average expenditure, require separate analysis of funds provided by the state and funds provided by the community. Where community funding meets a shortfall in provision by regional departments or the Ministry, local “success” disguises structural problems in education funding.
81 See for example SSRP Reports by Simon Fraser (December 2001, June 2002) 82 This is an application of micro-economic analysis, where the “school” is an individual firm or enterprise.

77
6.40 Increased school level initiatives will require better reporting of expenditure, including identification of locally-funded activity and activity funded from public funds. The best strategy would be for the Ministry to develop a simplified financial reporting format (a spreadsheet showing sources of funds as columns and type of expenditure by rows). Such reports would serve the dual purpose of informing the community how funds have been spent as well as allowing review of a selection of reports to estimate the community contribution as a percentage of whole-school budgets.
Summary and Recommendations
6.41 This Chapter combines the sector shares, expenditure analysis and whole school budget
information to describe how available funds are spent. It argues that Guyana needs a more radical approach if the broad USE objectives are to be achieved – by identifying what budget expenditure would be expected given the current distribution of teachers by qualifications and trained status83. Tables 6.8 and 6.9 each identify G$1 billion less spent on Primary and Secondary salaries (and on-costs) than appears necessary for the number of teachers employed. Even if this method overstates the “unallocated” funds, the question for planners should be – how can these funds be best utilized to improve student participation, student attendance, student completion and learning outcomes?
6.42 Improving the quality and qualifications of teachers was discussed in Chapters 3 and 4,
and this would be one step towards better outcomes. Reducing teacher attrition and improving attendance of students and teachers would be a further step towards better outcomes.
6.43 Community consultation on how to raise educational outcomes for all children should include discussion as to the best use of available funds. Consolidation of primary tops and upgrading of CHS to GSS is more likely to succeed if community-driven rather than imposed from above.
6.44 A parallel strategy is required to improve the efficiency of public schools – combining better qualified/trained teachers, improved Student/Teacher ratios, improved attendance, and marked improvements in the proportion of students completing Grade 11 with better learning outcomes.
6.45 Education has to compete with other sectors for the limited funds available from the national budget. Utilizing the pool of funds which should be available if schools were staffed by qualified and trained teachers should provide MOE with resources to improve teacher training and qualification, using student outcomes as the criterion for success.
6.46 At a national level, MOE and MOF should consider a joint agreement on the “minimum” recurrent resources required to staff and operate the “average” public school, with adjustments for regional differences, smaller enrollments and the availability of qualified teachers. Government initiatives to improve “quality” and implement USE should be additional to the minimum funding level.
83 This analysis could be improved if data on “unfilled” positions were included.

78
Chapter 7: GUYANA USE 2008-2012 7.1 This chapter examines three scenarios based on analysis in Chapters 2-6, provides a
costing of each scenario, and concludes with an assessment of sensitivity of assumptions in the larger budget and government context. The scenarios draw on the analysis of student enrollment (Chapter 2), teacher supply, attrition rates and qualifications (Chapter 3), student completion of primary Grade 6, progression to secondary Grade 7, attendance and student completion of secondary Grade 11 (Chapter 4), demand for new construction (Chapter 5) and 2004-2006 patterns of expenditure (Chapter 6).
7.2 Chapter 1 identified four strategies based on 9 Key Findings.
Four Strategies
Key Findings
Three Scenarios
Funding implications
Improve Primary Education participation and outcomes
• Improve Primary Completion Rates84
• Improve quality of Primary outcomes
Common to all three Scenarios, but medium and high outcomes unlikely without better Primary outcomes
To achieve USE, Guyana must invest in improving Primary education as well as investing in Secondary.
Improve transition from Primary to Secondary, especially to GSS85
• Primary graduates need skills to succeed in secondary grades
• More GSS places are required, in both hinterland and in urban communities
Improving Gross Enrollment Rate from 86% to 90% by 2012, and GSS share of total Secondary enrollment from 73% to 85%.
Increased investment in new GSS schools and places, matched with investment in teacher quality
Improve efficiency of secondary education
• Reduce grade repetition rates and improve retention to Grade 11
• Improve student attendance
• Increase secondary
school mean size
Improve Grade 7/11 survival from 40% to 52% (mostly in GSS);
GSS already have higher attendance (80%) but target should be 90%.
Mean STR increases from 20:1 to 26:1. Mean students per GSS increases from <600 to about 700.
Increased years in school more efficient than repeating and dropping out.
Improved attendance has gains with no added expenditure.
Larger schools and larger class sizes make better use of staffing.
Improve quality of teaching and learning
• Staff GSS with trained teachers qualified in subjects they are teaching86
Training current staff to lift proportion trained from 61% to 80%
Investment in existing teacher upgrading essential if quality and CXC outcomes are to improve
7.3 Achieving USE requires some balance between investment in new GSS and investment in improving the quality of teaching and learning if Guyana is to achieve its USE objectives – 75% of students completing 5 years secondary education leading to 40% achieving CXC
84 Using either the international measure (Grade 6 students as a percentage of population aged 11 years) or a simpler ratio of Grade 6 enrollment divided by Grade 1 enrollment (five years earlier). 85 See Table 1.3 for example – ratio of GSS enrollment to Primary enrollment in 2004/05 was Females 44.1% and Males 37.3%. Primary Tops and CHS do not provide satisfactory USE outcomes. 86 No data available on Teacher attendance, but investing in teachers should improve attendance and outcomes.

79
Grade 1-3 proficiency in five subjects. Demographic change in the Baseline scenario suggests that Guyana needs on average one new GSS over each of the next five years. The Medium and High outcome scenarios require on average two new GSS per year, with the “additional” school supporting the shift out of Primary Tops and CHS into GSS.
Three Scenarios
7.4 Three scenarios are presented – a baseline scenario which maintains the status quo through to 2012, a high outcome scenario which estimates the educational outcomes Guyana would have to achieve if it was to approach USE targets by 2012, and a “medium achievement” scenario which is assessed as achievable with strategic USE reforms and investments.
7.5 These scenarios are presented in Attachment G as a spreadsheet showing actual data collected and examined during field work in Guyana from mid-November through late December 2007, and the assumptions used for each scenario. Baseline assumptions and calculations are shaded yellow, the Medium assumptions are “tan” and the High Outcome assumptions are “gold”.
7.6 Table 7.1 presents the population and enrollment assumptions used in the three scenarios.
Table 7.1 Population and Secondary Enrolment Scenario Assumptions
ASSUMPTION Baseline Scenario
Medium Achievement
Scenario
High Outcome Scenario
A Population aged 12-16 B Population attrition 2% per annum 1% per annum 0.5% per annum C Population – attrition =A-B =A-B =A-B D Gross Enrollment Rate 86% constant GER+0.5% p.a. 90% by 2012 E Secondary Enrollment =C*D =C*D =C*D F GSS share Secondary 73% to 78% 74%to 79% 75% to 85% G Grade7 share Secondary 25% constant 25%to 24% 24.5% to 23% H Grade 7/11 survival 40% constant 40%to 45% 42% to 52% J CXC Candidates =Grade7*H =Grade7*H =Grade7*H
K3 Secondary Schools (N=) GSS 84 to 89 GSS 84 to 92 GSS 84 to 96 L3 GSS mean students (E/K3) 599 to 595 643 to 666 662 to 721
Source: Scenarios.XLS (January 2008)
7.7 The October 2002 Census population provides the demographic base for the projection, with cohorts below 12-16 progressing as the potential secondary school age population [A]. Because there are more children of pre-school and primary age, the potential secondary age population should increase from 75,363 aged 12-16 at the Census to 94,647 in 2008/09, before leveling off around 95,000 by 2011/12. This assumption is held constant for the three scenarios. Beyond 2012, secondary school age population may decline as smaller cohorts pass from primary to secondary.
7.8 Guyana is losing population. As the rate of net emigration is unknown, the baseline scenario uses an arbitrary assumption of 2% attrition per annum [B], giving a revised secondary school age population [C] baseline of 80,000-83,000. The high outcome scenario assumes only 0.5% attrition per annum, with a secondary school age population of 85,000-93,000. Population outflow is outside control of the Ministry and the Government.

80
7.9 Gross enrollment rate (GER) is a more critical assumption, with official enrollment data for October 2002 showing only 82.8% of the census population. GER may be inflated by under-age enrollment (11 year-olds in Grade 7, especially in Georgetown) and over-age enrollment (17+ years, especially in hinterland regions). Assuming 2% attrition per annum, Guyana would have a GER of 86% over the three years since the Census. The baseline scenario holds GER constant at 86%, while the high outcome assumption allows it to increase to 90% by 2011/12 [D]. The two solid black lines in Figure 7.1 show the probable range in population distribution from complete survival (and 100% GER) of the 2002 population to 2% per annum attrition and constant 86% GER (green circles).
Figure 7.1 Projected Population 12-16 years
0
20,000
40,000
60,000
80,000
100,000
120,000
2002/03 2003/04 2004/05 2005/06 2006/07 2007/08 2008/09 2009/10 2010/11 2011/12
Aged 12-16 Attrition2% Attrition1% Attrition0.5
Enroll 86%GER Enroll 89%GER Enroll 90%GER
7.10 If Guyana is to approach universal secondary education, more students have to progress from Primary to Secondary education and to remain in school to Grade 11. The baseline represents what would happen without intervention by government to improve participation, progression and secondary completion.
7.11 The geographic distribution of secondary school age students and the type of secondary
education available has major implications for USE. Assumption F observes the impact of SSRP, GEAP and BEAMS Projects with the general secondary schools share of total enrollment increasing from 50-60% through the 1990s, and reaching almost 71% by 2005/06. The projections [F] show the baseline scenario continuing to 78% by 2011/12 and the high outcome scenario increasing to 85%.
7.12 This is an “outcome” assumption – determined more by policies to consolidate Primary
Tops by construction of new GSS (in more densely settled areas of Regions 3 and 4), upgrading CHS in Georgetown to GSS and the construction of new schools. As noted in Chapter 5, new GSS in Bartica and Diamond are more likely to relocate children already enrolled rather than expand total enrollment. The major impact for USE is that students in GSS are more likely to reach Grade 11, enter and be successful at CXC examinations.

81
7.13 Progression from Primary Grade 6 to Secondary identifies a potential barrier to USE. There is also an effect of repetition in Grade 7 which may overstate “progression”.
7.14 The impact of the enrollment assumptions in Table 7.1 are presented in Table 7.2 as a range between 67,913 secondary students with the baseline assumptions and 81,408 with high outcome assumptions. The baseline assumes that 40% of Grade 7 students reach Grade 11 (close to 38.3% measure for the 2005/06 Grade 11), while the high outcomes assumption has 52% of Grade 7 in 2007/08 reaching Grade 11 in 2011/12.
Table 7.2 Projected Enrollment and CXC Candidature 2006/07-2011/12 SECONDARY STUDENTS 2004/05 2005/06 2006/07 2007/08 2008/09 2009/10 2010/11 2011/12
5 yearschange
Baseline 65,638 67,141 68,973 71,209 72,104 71,616 71,159 67,913 98.5%Medium 65,638 67,141 72,956 76,506 78,675 79,349 80,047 77,553 106.3%High Outcome 65,638 67,141 74,134 78,595 81,250 82,385 83,563 81,408 109.8%
CXC ENGLISH CANDIDATES
2004/05 2005/06 2006/07 2007/08 2008/09 2009/10 2010/11 2011/12 5 yearschange
Baseline (40%) 8,252 7,608 6,897 7,121 7,210 7,162 7,116 6,791 98.5%Medium (45%) 8,252 7,608 7,296 7,779 8,129 8,325 8,523 8,376 114.8%High (52%) 8,252 7,608 7,628 8,369 8,933 9,333 9,735 9,736 127.6%
Source: Scenarios.XLS. Actual CXC student numbers in 2007 were 8,011 and are overstated (include Private school students, Grade 10 students sitting CXC and students repeating CXC).
7.15 The less visible process is attrition during secondary grades. This Review has analyzed attrition by measuring progression from Grade 7 to Grade 11 (42% for the Grade 7 intake in 1997/98 and only 38% for the 2001/02 intake. For scenarios, the effect is summarized as Grade7 percentage of total Secondary (high attrition means Grade 7 share is larger; low attrition, Grade 7 is lower). Assumption G notes actual Grade 7 share at 27-28% (including repetition) in 2001/02 and 2004/05, with baseline assuming 25% and the high outcome share declining to 23%. Grade 11 survival [H] is assumed constant at 40% in the baseline, increasing to 45% in the Medium Improvement model, and to 52% in the High Outcome model.
Demand for Secondary Education:
7.16 As argued in Chapter 5, enrollments are driven by demand by students with competencies for secondary education rather than through construction to create additional school places. New construction is necessary to allow consolidation of Primary tops and to upgrade /convert CHS to GSS.
7.17 The population aged 12-16 years is estimated to increase from 75,400 at the 2002 Census to 83,200 in 2005/06 and to 97,200 in 2010/11 based on the progression of the larger cohort identified in Table 2.2 and assuming no net emigration. Projections are very sensitive to assumed attrition.
7.18 Projecting the mix of secondary students becomes more complicated – depending upon the location of existing Primary tops and distances to the next school. National enrollment cannot be divided by a “constant” to calculate the numbers of schools required. Baseline Scenario assumes a reduction in Primary tops from 244 in 2005/06 to 181 by 2011/12, while the High Outcomes scenario shows a more dramatic reduction in Primary Tops.

82
7.19 To improve curriculum and learning outcomes, average enrollment in all schools have to increase – in Primary tops from about 40 to around 60 if the schools are to have qualified teachers in English and Math, CHS from under 400 to 500-600 students (by which time they should become GSS), and GSS from under 600 students to 700+ students. The more effective schools increase their enrollment, the fewer “new” schools required.
7.20 New Schools? Guyana cannot achieve USE without construction of new GSS. Based on projected student numbers by type of school and the average enrollment per school for each of the three scenarios, Table 7.3 shows that the baseline would require one new GSS per annum. This may be by conversion and upgrading of an existing CHS or by new construction. Construction of a new school may take three to five years from the initial decision, depending on whether from Government funds or by borrowing. Table 7.3 Projected Requirement for Secondary Schools to 2011/12
SECONDARY SCHOOLS
2004/05 2005/06 2006/07 2007/08 2008/09 2009/10 2010/11 2011/12 5 years change
Baseline: Ptops 243 244 218 225 223 213 204 181 -37 Scenario CHS 24 24 20 20 18 17 15 12 -8
GSS 82 82 84 84 86 87 88 89 +5 Medium Ptops 243 244 228 230 224 211 200 178 -50 Scenario CHS 24 24 20 18 16 15 13 11 -9
GSS 82 82 84 84 86 88 90 92 +8 High Ptops 243 244 166 165 141 110 68 36 -130 Scenario CHS 24 24 20 18 15 13 11 9 -11
GSS 82 82 84 85 87 90 93 96 +12 Source: Scenarios.XLS. School numbers are calculated by dividing enrollment by assumed school “size”.
7.21 The high outcomes scenario assumes a major reduction in the number of Primary Tops and would require construction of 12 new GSS by 2011/12. Each new school has to be justified by local factors such as consolidation of primary tops, conversion of CHS, or increasing total number of secondary places. Some of the new GSS may include boarding facilities for hinterland regions – IF there is sufficient demand for boarding school places.
7.22 Guyana cannot achieve USE by the construction of new secondary schools – the capital investment requires equivalent recurrent investment to attract and retain qualified teachers, to improve student attendance and retention, to reduce grade repetition and to improve the number and quality of students completing primary education.
7.23 Teacher Demand and Supply: Guyana faces challenges in attracting and retaining qualified teachers (as well as improving teacher attendance). Teacher salaries and allowances represent more than three-quarters of education expenditure, so projected teacher numbers affect future budget expenditure.
7.24 Table 7.4 uses Student/Teacher Ratio (STR) to convert student enrollment demand into demand for teachers. The baseline approximates the 19.5 STR reported in 2005/06 compared with a 26.0 high outcome assumption. The medium assumption is approximately half way between these two. Fewer but better qualified teachers in Table 7.3 High Scenario combines improved efficiency and improved proportions trained.

83
7.25 With increasing average GSS enrollment (see assumption L3 in Table 7.1), larger enrollment enables schools to offer a wider curriculum with more students per class group. This improvement in efficiency reduces the total number of secondary teachers required, even though secondary enrollment in Guyana has increased by 9.8% and CXC candidature increased by 27.6% in Table 7.2.
Table 7.4 Projected Secondary Teachers (and Trained Teachers) to 2011/12 SECONDARY TEACHERS
2004/05 2005/06 2006/07 2007/08 2008/09 2009/10 2010/11 2011/12 5 years change
Baseline (STR=20) 3,392 3,437 3,448 3,560 3,605 3,580 3,557 3,395 98.5%Medium (STR=23) 3,392 3,437 3,558 3,643 3,659 3,606 3,557 3,371 94.7%High (STR=26) 3,392 3,437 3,530 3,572 3,532 3,432 3,342 3,131 88.7%
TRAINED TEACHERS
2004/05 2005/06 2006/07 2007/08 2008/09 2009/10 2010/11 2011/12 5 years change
Baseline (61%) 1,788 1,844 1,868 1,933 1,964 2,004 2,027 2,070 110.8%Medium (70%) 1,788 1,844 1,956 2,076 2,158 2,235 2,312 2,359 120.6%High (80%) 1,788 1,844 1,976 2,107 2,225 2,299 2,406 2,504 126.7%
7.26 Larger class groups and more students continuing to Grade 11 are not sufficient – student CXC outcomes require a major improvement in the quality of teaching. The proportion of trained teachers may be a “weak indicator” of student outcomes – in some subjects, a graduate in Math, Physics or Chemistry may be more important than whether the teacher is “trained”. Table 7.4 shows a large increase in “trained” teachers, by replacing teachers leaving with trained teachers and upgrading qualifications and skills of the existing teachers. Upgrading and certifying teachers through in-service courses, through distance education and residential schools (in “summer” and during “wet” months when student attendance is low) should be a core component of any USE Strategy.
7.27 The teacher retraining/certification process should be reinforced by improved salaries for “trained” teachers but no improvement for untrained teachers. Most of the increase in Table 7.5 comes from existing teachers being certified as “trained” – with an increase in monthly salary from G$47,709 to G$78,306 for non-graduate teachers and from G$73,483 to G$108,089 for graduate teachers. Allowances of 8% are added to all salaries, although these allowances are greater in hinterland Regions.
Table 7.5 Projected New Teachers and Secondary Recurrent Expenditure NEW TEACHERS
2005/06 2006/07 2007/08 2008/09 2009/10 2010/11 2011/12 5 years change
Baseline 56 24 65 31 40 23 43 +226 Medium 56 112 120 82 77 77 47 +515 High Outcome 56 132 131 118 74 107 98 +660
RECURRENT EXPENDITUREG$M (constant)87
2005/06 2006/07 2007/08 2008/09 2009/10 2010/11 2011/12 5 years change
Baseline 4,065 4,108 4,264 4,342 4,366 4,381 4,290 +4.43%Medium 4,065 4,278 4,471 4,585 4,641 4,704 4,631 +8.25%High Outcome 4,065 4,281 4,460 4,569 4,603 4,677 4,646 +8.53%
87 The analysis for Table 7.5 (and for Tables 6.8 and 6.9) assumes that annual salary is 12 time monthly salary. If multiple is less than 12, these calculations require revision.

84
7.28 Secondary Recurrent Expenditure in Table 7.5 assumes that G$1 is spent on non-salary
items (textbooks, school maintenance, travel, student accommodation) for every G$3 spent on teacher salaries and allowances. The “market” mechanism should be reinforced by real increases in teacher salaries. Secondary Recurrent Expenditure assumes 0.7% per annum increase in teacher salaries for trained secondary teachers (baseline), 1.5% per annum for the medium scenario and 2% per annum under the high outcome scenario. Untrained teacher salaries are not adjusted annually, as an incentive for teachers to upgrade their qualifications and become certified teachers.
7.29 Recurrent Expenditure increases by 4.4% in the baseline (from G$4,108 million to G$4,290 million), and from G$4,281 million to G$4,646 million or 8.5% under the high outcome strategy.
Secondary Recurrent Expenditure “Gap”
7.30 In financial year 2006, Guyana reported recurrent secondary expenditure of G$2,730 million (see Table 6.2), of which non-salary expenditure was 25.8%. Primary Tops expenditure is notincluded in reported secondary expenditure. Primary Tops represent 15.3% of total secondary enrollment (see Table 1.1), secondary expenditure including Primary Tops is assumed to be 10% above the reported recurrent expenditure to approximately G$3,000 million. With Baseline expenditure in Table 7.4 of G$4,065 million, there is a “gap” of approximately G$1,000 million between expenditure and what Guyana needs to support its current secondary education system.88
Sensitivity Analysis 7.31 The spreadsheet model reports the existing structural relationships between secondary
school age population, enrollment, transition rates from primary to secondary schools, repetition rates, student retention to Grade 11 and CXC examination outcomes. Changes can be made to one measure, and the impact of that change measured. Schools are a dynamic system so that a change on one measure may be offset by other changes.
7.32 Throughout this Review, and analysis of system performance data, average number of
students per school (average enrollment or school “size”) is the strongest predictor of secondary school outcomes. Rural students receiving secondary education in a “Primary Top” with fewer than 30 students, with one or two teachers who may have no qualification in the subjects they are teaching have no prospect of completing secondary school with a pass in five CXC subjects. Urban students attending a GSS with 600-900 students with 100+ students remaining to Grade 11 and with most teachers having some qualification in their teaching subject, should achieve five CXC passes.
7.33 If school “size” is the best predictor of secondary school outcomes, the major difference
between the Baseline and “High” scenario is the reduction in the number of small Primary Tops (and increasing average enrollment to 60 with trained teachers in Math and English for tops that remain) and increased enrollment in GSS. Efficiency in average class size and ratio of students per teacher have a “perverse” effect because the model shows that average recurrent expenditure per student declines. Better outcomes for less spending!
88 There would be Ministry expenditure on curriculum, management, planning, assessment/testing which could be attributed to “Secondary” education, as well as Regional Education Department expenditure, so the “gap” would be less than the G$1,000 million estimate.

85
7.34 Size may be a good predictor but there are exceptions – skilled teachers can achieve
exceptional results, possibly because they have students of above-average ability. Large schools such as Bartica Secondary do not perform as well, even with an above average percentage of “trained” teachers. One problem is that more students may have had inadequate primary education, more repeat Grade 7 or Grade 8, and insufficient students continue through to Grade 11.
7.35 Size can be modeled, and the analysis of students (Chapter 2), teachers (Chapter 3) and
learning outcomes (Chapter 4) in this Review has attempted to demonstrate “size” effects. 7.36 What could not be modeled was “average student attendance” because its effect on
average instructional time per student was not measurable. Guyana may be unique in that it collects and reports attendance details which have been reported in this Review. Improving student attendance by 10% (from 60% to 70% in CHS or from 80% to 90% in GSS) does not affect average school size, average class size or student teacher ratio. It may affect repetition rates, grade progression rates, retention to Grade 11 and CXC exam results. Teacher attendance data were not available and the impact of teacher attendance on student learning warrants further examination.
Five Risks
7.37 This Review concludes by identifying five “risks” which summarize the challenges facing Guyana. None of these are “new” issues but the summary may suggest where small steps can be taken towards the larger goal.
7.38 Risk 1: Do Nothing (Baseline Scenario) continuing poor attendance and high attrition
from schools, especially urban males with limited employment skills. Social costs of crime, violence and drugs and growing rather than declining prison populations can be more than offset by achieving USE objectives. Higher cost of smaller hinterland schools is unavoidable, but can be partially offset by greater efficiency gains in larger urban schools.
7.39 Risk 2: Failure to improve student attendance – better quality teaching and learning (and teacher attendance?) are pre-requisites for reduced repetition, better student attendance, completion to Grade 11 and at least Grade 3 CXC outcomes. Improving attendance is recommended, because it can contribute to improved outcomes without any additional recurrent expenditure. This should not be read as arguing for better “policing” of truancy – the quality of the teaching and learning should “compel” attendance.
7.40 Risk 3: Investing in new buildings without better teaching and learning. Scenarios use “trained” teachers as the measurable indicator of quality. Ensuring more teachers qualified in the subjects being taught is more difficult to measure. Higher average enrollment, more efficient use of trained teachers and increased salaries for trained teachers should contribute to better learning outcomes. Attracting and retaining qualified teachers may require additional expenditure.
7.41 Risk 4: Investing in Secondary without matching Primary investment so that quality Primary graduates have opportunity to achieve a good secondary education. Most of the untrained/unqualified teacher issues in secondary schools also apply to primary schools, but secondary schools cannot correct deficiencies in Grade 6 language or numeracy skills.

86
7.42 Risk 5: FTI investments in improving Primary outcomes in Hinterland regions without parallel initiatives to make quality secondary education accessible. This will include higher recurrent and capital costs in boarding schools, or the higher staffing and recurrent costs in an effective cluster GSS model can be developed.
7.43 Hinterland regions should exploit their advantages – creating an “elite” regional GSS which specializes in environmental and natural sciences, or in Amerindian culture and society, in Spanish and other languages, or in football, cricket and basketball. Every Primary graduate who attends their regional GSS contributes to stronger and more efficient education, and every urban student attracted to the elite regional GSS both improves the regional school and reduces pressure on urban GSS places.
7.44 Reluctance of some hinterland communities to allow young children to attend boarding schools plus the high costs of travel to and from remote communities is taken as given. Boarding schools must offer more than residential dormitories – parents require better pastoral care and supervision and better educational outcomes. For every student from a remote community completing Grade 11 with quality CXC outcomes, subsidies for travel to boarding schools would be a better investment than maintaining Primary Tops which can deliver few quality outcomes.
7.45 This Review suggests that using the geographic advantages of hinterland regions, including their “isolation” and environment, to create schools which can achieve similar outcomes to Bishops GSS or Queens College will attract good students from urban communities. Each Regional Education Department in the Hinterland should examine community priorities which would justify higher initial investment. The more successful the school in attracting and retaining students to Grade 11, the better the educational outcomes for all students and the better the return on the investment.
(end of Report)

87
ATTACHMENTS Attachment A1: Terms of Reference for Consultancy REVIEW, ANALYSIS AND COSTING OF POLICY ISSUES/PLANS IN SECONDARY EDUCATION IN GUYANA FOR INCLUSION IN THE EDUCATION SECTOR STRATEGY FOR 2008-2012 BACKGROUND In 2003 the Ministry of Education (MOE) began implementation of a five year strategic plan (2003-2007). A major objective of this plan was the achievement of Universal Secondary Education (USE). Specific USE related objectives in the plan included the conversion of Community High Schools (CHS) into General Secondary Schools (GSS), and the gradual amalgamation of Secondary Departments of Primary Schools into secondary schools. The plan also outlined some changes in the mechanism [previously only the Secondary School Entrance Examination (SSEE)] for allocating children to secondary schools and curriculum reform, including the implementation of a more technical/vocational program for secondary students as an alternative learning pathway. Many of these objectives were based on lessons learnt from two major secondary education projects: the Secondary School Reform Project (SSRP) funded by a loan from the World Bank and the Guyana Education Access Project funded by a grant from the United Kingdom’s Department for International Development (DFID). SSRP tested some of the policy objectives in 12 pilot schools in several regions of Guyana and GEAP built on this by testing it in two regions of Guyana. There has been some progress in the last five years, in achieving some of the objectives, especially in the conversion of CHS and, to a lesser extent, the amalgamation of Secondary departments. There has also been some work done on the review of curriculum and a policy document on secondary education has been prepared by senior education managers. However much remains to be done. In many cases conversion of schools has not been done according to the recommendations outlined in the two projects and the result has simply been a change in name without any real change in the program offered to students. In particular, the policies and strategies for the alternative pathway have been piloted in some schools but the policy document has not been officially approved. The Ministry has now embarked on the preparation of another five-year plan (2008-2012) and USE will remain a major objective, but it is paramount that the Ministry goes into this new plan with clearly articulated policies and plans and with a good estimate of the cost implication of these policies and plans. GENERAL OBJECTIVES OF THE CONSULTANCY It is against this background that the current consultancy is proposed. Under the continual guidance of the Bank team and the Chief Planning Officer of the Ministry of Education, the consultant is expected to carry out the following tasks: I. Review all relevant documentation on USE in Guyana. This should include, but are not
limited to, the Education Strategic Plan 2003-2007, major reports emanating from the SSRP and GEAP projects, and the Draft Secondary Education Policy document. The consultant should also review secondary education policy and programs in a few CARICOM states, and meet key MOE officials from Central Ministry and Regional Departments and Ministry of Finance to seek additional information, clarify issues etc.

88
II. Critically analyze the policies and plans proposed in the review of documentation and the discussions mentioned above and recommend preferred policies and pathways to MOE for achieving secondary education goals.
III. Run a simulation model to estimate the costs of the major alternative policy options and
provide recommendations to Government for the finalization of the secondary education policy for Guyana.
SPECIFIC OBJECTIVES OF THE CONSULTANCY Specifically the consultant will: I. Review all relevant documentation on USE in Guyana:
A. Summarize the (short and long term) goals for secondary education from the past five year strategic plan (2003-2007) and the secondary education goals for the strategic plan under discussion (2008-2012) i. Specify the goals of the past five year strategic plan (2003-2007) in
accordance with criteria for expanding access, improving quality, relevance, equity and effectiveness.
ii. Describe the goals under discussion for the five year strategic plan (2008-2013) in accordance with criteria for expanding access, improving quality, relevance, equity and effectiveness
iii. Evaluate the level of achievement of past and currently discussed five year strategic plans based on the criteria described. What is the gap between the current system and the goal?
B. Review of Government policies, past studies, and recommendations for
achieving USE, among them are the following: (A full list will be provided by the government.) i. Secondary School Reform Project (SSRP) – Implementation Completion
Report, Consultant Recommendation Report (Wolff). ii. Guyana Education Access Project (GEAP) iii. DFID consultancy reports from 2001 and 2005. iv. Fiscal Implications for Achieving the Proposed USE, A Note, 2001
(WB). v. Secondary education policy in a few CARICOM States (e.g. Jamaica,
Trinidad and Tobago). vi. Primary documents on secondary education with the multilateral
organizations vii. Interview with key informants from the Central Ministry, Regional
Departments and the Ministry of Finance for more information on secondary education strategies.
II. Develop alternative scenarios (based on the review under Objective I)
A. Critically analyze the policies, plans, and recommendations proposed in the review of documentation and interviews mentioned above
B. Synthesize the information and identify viable policy options for achieving USE. C. Propose pathways for achieving different policy options (alternative models)

89
III. Run a simulation model to estimate the costs of alternative models and provide
recommendations to government based on the fiscal implications. (see Annex for a sample template of simulation model) A. Estimate the cost of each alternative in the proposed policy B. Compare the cost required at the current policy option (baseline model) with the
costs of alternative models C. Run sensitivity analyses based on different political risks
Deliverables 1. The consultant is expected to present a detailed work plan (including methods) not later
than one week after contract signing. 2. The consultant will produce a draft report within the first four weeks of the
consultancy which should include preliminary results of Objectives I and II, and an indication of how the remainder of the consultancy will be carried out.
3. Simulation model estimating costs of alternative pathways based on politically
acceptable and realistic options. 4. A report which includes the preliminary results of Objective III should be presented by
week seven. Specifically, deliverables are organized in two phases. The final report should be presented at the end of the two month period.
All documents will be submitted in English in an editable, electronic version to the World Bank Team Leader and the Ministry of Education’s Chief Planning Officer. All deliverables will become the property of the World Bank upon payment according to the terms of this contract. Structure and Timeframe of the Consultancy It is estimated that this consultancy will be of two months duration. It could involve an international expert and a national person based in Guyana. The first phase of the consultancy combining Objectives 1 and 2 will span about four weeks and can be partially completed from the consultant’s home base. MOE will provide electronic or hard copies of the material relevant to Guyana. Part of the second phase covering Objective 3 will be spent in Guyana with a base in Georgetown but with some visits/meetings with regional officials. This phase will involve gathering of data to facilitate the costing exercise.

90
Attachment A2: References Caribbean Group for Cooperation in Economic Development (CGCED 1998) Caribbean Economic
Review 1998. (Report 17874)
Fraser, Simon (2001). Education Finance and Budget Reform. Report – Phase 3. (SSRP)
Fraser, Simon (2002). Education Finance and Budget Reform. Final Report – Phase 4. (SSRP)
Government of Guyana (2007), Guyana: 2006 Poverty Expenditure Tracking Report.
International Monetary Fund (IMF 2004). Heavily Indebted Poor Countries (HIPC) Initiative-
Statistical Update. Report 28394
Latham, Michael (2000), Primary-Secondary Transition Towards a unitary secondary education
system in Guyana, Guyana Education Access Project (GEAP).
Latham, Michael (2001). Secondary Education Finance Study (GEAP).
Ministry of Education (2002). Policy on Universal Secondary Education.
Ministry of Education, National Centre for Educational Resource Development (NCERD 2007a). Analysis
of SSEE/NGSA Results 1996-2007, Volume 1.
Ministry of Education, National Centre for Educational Resource Development (NCERD 2007b). Analysis
2000-2007 CXC General and Technical Proficiencies Results, Volume 1.
Ministry of Education, Planning Unit (MOE 2006), Digest of Education Statistics of Guyana 2004-2005.
Previous years’ Digests and draft 2005-06 Digest were also used.
Skoufias, Emmanuel (no date), Guyana Population Census 2002 (World Bank/spreadsheet)
Vegas, Emiliana and Petrow, Jenny (2008), Raising student learning in Latin America: the challenge
for the 21st century. World Bank
Wolff, Lawrence (2004), Independent Evaluation of the Secondary School Reform Project (SSRP).
Volumes 1 and 2.
World Bank (IDA 2002). Country Assistance Strategy. Report 24073-GUA.
World Bank (2002). Guyana Public Expenditure Review. Report 20151-GUA.
World Bank (2003). Monitoring educational performance in the Caribbean. Report 24337
World Bank (2007). Welcome to Guyana, Country Coordinating Office.

91
Attachment B: Core Issues for MOE Discussion 13 December 2007 Present: Mrs G Whyte-Nedd (Chief Education Officer), Mr R Tiwau (Deputy CEO Administration), Ms M Bovell (Assistant CEO Secondary), Mr N Khan (Assistant CEO Primary), Mrs D Singh (Assistant CEO Nursery), Mr H Grandison (Assistant CEO Inspections), Ms D Chapman (Deputy CEO Development), Mrs E Hamilton (Chief Planning Officer).
[A] RETAIN PRIMARY TOPS (as this is the only way in which many hinterland communities can access secondary education). In areas where Tops can be consolidated into a GSS they should be.
[B] STRENGTHEN PRIMARY TOPS – each should have one, preferably 2 trained teachers AND priority should be given to a trained English and a trained Math teacher. (In a system chronically? short of trained teachers, even more so in Math, it is difficult/impossible to justify appointing a Math teacher to a school with 30 students, when schools with 200+ students lack trained Math teachers. A third best option, is to provide special Math training to teachers in Tops Æ train them to be Math teachers, provided they are not pirated away to Regional Boarding Schools, GSS in Georgetown or even private schools in Georgetown)
[C] STRENGTHEN QUALITY AT REGIONAL BOARDING SCHOOLS, buildings,
staffing and recurrent resources, so that hinterland communities see value in sending students at Grade 8 or Grade 9 to the Regional School. Grade 10 may be too late for small school students to catch up and prepare for CXC.
[D] EXAMINE CASE FOR MORE, HIGH QUALITY BOARDING SCHOOLS IN
HINTERLAND REGIONS (yes, more expensive, but less per student than at President’s College?) – with good, qualified teachers, and good CXC outcomes, so that the best students at SSEE choose to stay in their region AND Georgetown/Region 3+4 students want places at these schools. Use the unique diversity of rural areas to enrich curriculum at such schools).
[E] ENCOURAGE LARGER RATHER THAN SMALLER DORMITORIES (Bartica
could be rebuilt for 100 students at marginal additional capital and recurrent cost – if fully utilized – supporting strategies [B] and [C] above. The test should be that educational quality and pastoral care encourage parents to choose this education in preference to going to Georgetown or remaining in a Primary Top. Scholarships for hinterland students should give priority to the Regional School rather than a Georgetown school.
[F] CHANGE THE STATUS OF GRADE 6 SSEE TO PUT MORE EMPHASIS ON
STUDENT LEARNING – secondary placement function can remain, provided Regions and schools use SSEE to improve the quality of their teaching and learning. . A more radical/disruptive alternative would be to extend all Primary schools to Grade 7, provided the Primary school gets specialist English and Math teachers so students can move to Regional GSS/other GSS for Grade 8. (This is applying proposal [B] to all Primary schools, with the added benefit that all Primary grades should benefit from a trained Math teacher!)
[G] GIVE SSEE A DIAGNOSTIC/REMEDIAL FUNCTION (see [F]) so that the weaker 20,
30, 40% have a reasonable prospect of succeeding at Secondary school. See [H] and [I] below.
[H] ASPIRING TO SECONDARY EDUCATION (USE Objective 1) SHOULD BE
COMPULSORY. There is a contradiction in compelling under-prepared, under-qualified,

92
disinterested students (especially urban males) to “attend” school if attendance is poor, they add to disciplinary problems at school, disrupt learning, AND have more likelihood of being suspended or expelled. Expulsion has the effect of giving a legal exemption from compulsory schooling!
[I] REVIEW THE INTERFACE BETWEEN SECONDARY SCHOOLS, PRACTICAL
TRAINING CENTERS AND TECHNICAL COLLEGES/ INSTITUTES. There should be a genuine and attractive alternative to CXC as an outcome from Secondary Education – with improved academic quality so that students can still present CXC in many of the 38 subjects examined. [This would have more merit than introducing compulsory 2 years National Service for all 15-year olds not attending (seriously) to their secondary education.]
[J] ACCELERATE THE TRANSFER OF COMMUNITY HIGH SCHOOLS TO GSS
SCHOOLS – not just in name, but in the quality of teachers and resources. [K] SECONDARY SCHOOL – WHERE I WANT TO BE? Improving attendance at school
must be a priority (for urban GSS as well as CHS and Primary Tops). This should be a focus for USE and for community-school improvement plans (SIPs). Interim targets should be 90% GSS and 80% CHS +Tops, with objective of increasing attendance to 95%GSS and 90%Others. Communities should look at local/environmental reasons for non-attendance – if it is seasonal (rainy season, high rivers, planting/harvest, test cricket) look at a more flexible school year – start in August, attend Monday/Saturday in some months (provided the Act does not make this illegal), offer some units of study during holidays using Regional Boarding School facilities if specialist science/computer facilities not available in schools.
[L] INCREASE FOCUS OF REGIONAL BOARDING SCHOOLS ON GRADES 10-11,
preparation for CXC. A simpler alternative may be to offer some units of study during holidays using Regional Boarding School facilities [see K] if specialist science and computer facilities not available in many schools.
[M] Other issues - TEACHER ATTENDANCE, TEACHER RENUMERATION/INCENTIVES,
RETAINING TEACHERS, RETRAINING/UPGRADING/QUALIFYING TEACHERS, RECRUITING NEW TEACHERS, PRIORITIES FOR NEW CONSTRUCTION, COMMUNITY OWNERSHIP OF SCHOOLS AND PREVENTATIVE MAINTENANCE

93
Attachment C: Briefing Note on USE Review for meeting with Minister 19 December 2007
1. Quality of teaching is the minimum requirement for quality USE. Investing resources in regional or district in-service training is the most efficient way of improving the teaching of Primary mathematics and in quality of teaching in Primary Tops and Community High Schools. SSEE and CXC results will not improve unless all children have acceptable competency in reading and moths.
2. Upgrading teachers improves the existing supply of teachers. These will remain the
bulk of Guyana teachers for the foreseeable future. If system can attract and retain Graduate teachers that is a bonus but in-school and in-service retraining of teachers offers more immediate and lasting benefits. Credit for training should be negotiated with UG and CPCE as a way of encouraging more teachers to upgrade their skills and qualifications.
3. Where practicable, the remaining 24 CHS should be upgraded to GSS. Improving
quality of teachers (points 1 and 2) is more important for upgrading than provision of new facilities. Consideration should be given to defining the core curriculum for which all secondary schools should have sufficient qualified teaching staff. Larger, better staffed and better equipped GSS can offer more CXC subjects beyond the core but all schools should deliver a quality core curriculum.
4. Academic education does not suit the majority of students who should complete 5
years secondary education. Secondary curriculum should include units/modules of study which could be delivered by Technical and Labor Colleges. Guyana cannot afford to equip facilities in secondary schools which are under-resourced, under-staffed, under-utilized or difficult to maintain.
5. Drop out in early years of secondary is a major educational and social issue. Points
1-4 above are important steps in attracting and retaining youth in school. Girls appear to perform better at SSEE and to progress to GSS. Guyana cannot afford to neglect schooling for youth. Sport (and possibly some cricket/football/ basketball sports high schools if sponsorship is available) should have a greater place in addition to the core curriculum (redefined in 3 and 4 above).
6. Primary tops should be consolidated into GSS where practicable (existing policy).
Where access and distance make consolidation unworkable, the strategy should be to aim for Grade 7 (and where necessary Grade 8) Primary Tops with 40+ students, and two trained secondary teachers. Training should be provided (regionally) in methods and content of Math teaching so that students at end Grade 7 (or Grade 8) can progress to the next grade in a GSS/boarding school.
7. Where Primary tops <40 are unavoidable, a trained secondary teacher should be
appointed to the Primary School (or to the nearest GSS and to spend one or two weeks each month at the school. One teacher could support 2-4 schools depending on distance and appropriate transport). This strategy should be complemented with Student and Teacher Study materials or other distance education. Higher levels of literacy are requires for effective distance education.
8. Primary tops as satellite classes in a regional GSS? This includes some of the above
strategies, plus provision for teachers and students in satellite schools participating in

94
“whole school” activities at times during the year. This could be combined with teacher in-service activities at the regional GSS while students are there using science, computer or other resources not available in remote classes.
9. Improving student attendance – each of the above initiatives should improve quality of
learning and encourage better attendance. Communities should discuss in SIPs how to improve attendance. This is a major inefficiency in Guyana’s education system. Reluctant learners should not be compelled to attend inadequate education offerings. The school calendar should give schools/regions sufficient flexibility so that time lost in rainy season, high river flows, flooding etc can be made up.
10. Capital works (from Budget and from borrowing) should target upgrading of existing
facilities, improving water/sanitation, provide access to electricity and preventative maintenance rather than construction of new schools. For any new school construction, up to ten other schools could be upgraded.
11. Improving efficiency – except where there is no alternative, small schools should be
encouraged to ensure that every child in their catchment area is enrolled and attending. This puts a greater requirement on Ministry and Regions to ensure that facilities reach minimum acceptable standards and that schools have sufficient trained staff. Improving teacher attendance is also part of improving efficiency.
Geoff Howse

95
Attachment D1: Summary of Guyana Performance on 15 Measures15 MEASURES HINTERLAND/RIVERINE RURAL/COASTAL URBAN/COASTAL
Region >> R01 R07 R08 R09 R02 R05 R06 R10 R03 R04 R11TOTALGuyana
C02 4451 2660 1577 3708 7876 8216 18445 6439 14998 24358 17699 1104271. Population age 6-11 2002and 2007 (age 1-6 in 2002) (a) P07 5270 2909 1851 4040 7450 7804 17930 6422 14136 24220 16630 108662
M2. Primary completed Gr.6%G1 in 1999/2000 (b) F
89.092.2
88.797.2
97.195.0
86.084.4
88.983.9
98.397.4
88.391.8
72.1102.6
88.492.7
91.191.0
87.096.0
88.292.6
N= 186 111 43 160 320 311 595 318 526 696 747 40133. Primary Teachers (2004/05)%Trained % 25.8 56.8 20.9 33.8 65.6 57.2 55 59.4 63.1 58 62.5 57.1%
N= 675 476 221 508 1167 1231 3044 989 2212 3353 3658 175344. SSEE entry%Grade5 2004/05 (c) % 89.2 87.5 97.8 73.7 86.9 91.1 89.6 87 82.8 91.9 92.8 89.0%
15.9 18.3 14.7 17.1 23.3 23 21.3 22.9 23.9 22.6 27.9 23.15. SSEE mean scoresMath + English
MathEngl. 14.1 16.2 13.8 15 19.1 18.2 17.6 20.1 19.6 19.2 25.2 19.7Gross 132%6. Primary/Secondary
Transition G7%G6 (d) Net 105%102%99.1%
153%87.7%
136%119%
105%95.9%
101%91.2%
99%89.4%
153%131%
100%81.7%
83.6%76.9%
131%*99%*
109%92.3%
C02 2386 1634 950 2461 5492 5389 12140 4091 10434 17317 13069 753637. Population age 12-16 (2002)and 2007 (aged 7-11 in 2002) P07 3665 2184 1324 3090 6498 6849 15105 5310 12478 20255 14844 91602
N= 861 1427 506 750 4063 3651 9381 3601 5157 3278 14896 475718. GSS: Enrollment 2005/06%Secondary % 36.7 79.4 54.3 36.9 81.8 72.3 87.7 75 64 38.9 84.8 71.3%
X= 430 714 253 250 813 608 586 720 573 468 596 5809. Mean GSS enrollment("size") GSS (number schools) Ns= 2 2 2 3 5 6 16 5 9 7 25 82
Nt= 102 65 40 87 250 242 470 280 366 450 926 327810. Secondary Teachers%Trained (2005/06) % 47.1 73.9 20 36.8 68 51.7 54.9 62.5 58.5 57.6 49.6 54.8%
M 60.6 70.7 67.6 74.4 75 57.8 73.2 77 66.3 55.9 75.8 69.2%11. Secondary Attendance%Attend (by gender) F 65.4 77.2 75.7 79.9 79.3 60.4 77.8 79.9 74.7 62.3 79.1 74.4%
M12. Attrition G9%G7 (e)F
42.2%58.8%
94.3%90.6%
66.7%78.1%
115%138%
72.5%76.9%
73.9%73.8%
80.3%85.7%
72.5%85.6%
57.4%71.4%
76.2%85.7%
86.6%*109%*
75.6%87.8%
M 8.4% 48.8% 1.6% 20.5% 47.0% 48.9% 34.3% 33.5% 31.1% 18.7% 35.1% 31.5%13. Secondary SurvivalG11(2005/06) %G7 (2001/02) F 17.7% 49.5% 20.4% 22.4% 73.2% 60.1% 45.8% 53.0% 45.9% 28.7% 51.9% 45.6%
597 655 234 575 3594 2858 6512 2267 4366 3765 11279 3670251.4 44 44.4 43.5 61 43.2 58.1 61.8 56.6 61.7 66.8 59.6
14. CXC result (2007)Level I-IIILevel I-IV
N=%N%N 77.6 66.4 66.7 72.4 82 72.4 79.4 83.4 79.8 82.9 85.9 81.3
15. Secondary Expenditureper Secondary Student (G$) (f)
G$m(G$)
104.84948,564
102.53657,897
50.12056,505
101.05643,976
198.41441,904
173.91536,995
362.71934,863
304.89472,370
281.92134,621
294.14834,593
1,066.92459,859
3029.07846,148

96
Notes on Attachment D1: Fifteen MeasuresFIFTEEN MEASURES
1 Population aged 6-11 years (a) Primary school-age population, using September 2002 Census data. The table shows numbers aged 6-11 at the Census(C02) and the population aged 1-6 (P07) who would be aged 6-11 in 2007. This method assumes no mortality and no netmigration. It is less reliable the greater the elapsed time after the population census.
2 Primary completion Grade6/Grade 1 (5 yearsearlier)
(b) This differs from Primary Completion Rate (Grade 6 enrollment divided by population age 11, final year of Primary).Grade 6 divided by Grade 1 five years earlier is a more accessible measure, is not distorted by “estimated” population, but maybe affected by grade repetition. A simpler measure is Grade 6 divided by current year Grade 1 as an approximate measure of“completion”, and gives each school community with an approximate measure of attrition. Note Female completion ratesexceed Male completion rates in most regions.
3 Primary teachers(percent trained)
The focus here is on the percentage of Primary teachers who are “trained”. Guyana total is 57.1 percent but is 20-35% in threeof the four “Hinterland” regions. Strengthening the quality of Primary teaching should be part of any strategy to achieveUniversal Secondary Education.
4 SSEE entry(as %Grade 5)
(c) Numbers entering the Secondary School Entrance Examination (SSEE) is expressed as a percentage of Grade 5 in theprevious year. With the exception of Region 9, most regions are within +/-5% of the national average (89%)
5 SSEE mean scoresMath and English (outcome)
Math and English are “foundation” subjects for success in secondary school. All four Hinterland regions have averages lessthat the national average (Math 23.1; English 19.7). Other Rural regions (R05, R06) also perform below the national average,as does R04 (but may be distorted by R04 students attending Georgetown schools).
6 Primary-Secondary transition(Grade 7/Grade 6 previous year)
(d) Grade 7 students divided by Grade 6 students the previous year give a “gross” measure of transition with a 109% nationalaverage. Grade 7 enrollment is overstated by high repetition in Grade 7. Excluding repeaters, the net transition rate is 92.3%.*Georgetown (R11) is overstated (and R04 is understated) because R04 primary students attend R11 secondary schools.
7 Population aged 12-16 years Secondary school age population is estimated using the same methodology as in 1(a) for Primary. The major difference is thatCensus population in 2002 had only 75,000 aged 12-16 years, compared with 91,600 aged 7-11 who would be aged 12-16 in2007. Net emigration during 2002-2007 would reduce potential population. Migration from rural to coastal urban areas wouldalso distort estimated school age population.
8 GSS enrollment(%Secondary)
If measure 7 gives 91,600 of secondary school age, only 47,571 were enrolled in GSS in 2005/06 (plus a further 19,000+ inCHS or Primary Tops). Increasing the GSS share is an important USE strategy if overall USE is to be achieved.
9 Mean GSS enrollment(“size”)
Many GSS have “small” enrollment and R08 and R09 average only 250 students. Students in schools with few students areless likely to reach Grade 11, and even less likely to achieve satisfactory CXC outcomes.
10 Secondary Teachers(% trained)
With only 54.8% of secondary teachers “trained” (but not necessarily in the subject/s they are teaching), Guyana cannot becompetitive at CXC examinations.
11 Secondary attendance(by gender and school type)
Male secondary students average 69% attendance; Female students 74% attendance. Attendance rates are higher in GSS butlower in CHS and Primary Tops. Improving attendance is an important step for improving learning outcomes.
12 Attrition (Grade 9/Grade 7) (e) 75.6% of male students and 87.8% of female students continue to Grade 9. Arresting attrition is a precondition of USE..
13 Secondary Survival (G11/G7) Only 31.5% of Grade 7 Males and 45.6% of Females appear to reach Grade 11 in 2005/06.
14 CXC Result (outcome) Only 59.6% of CXC entries are at Levels I-III plus a further 21.7% at Level IV. Teacher qualifications and improved studentattendance are conditions for achieving better CXC outcomes.
15 Secondary Expenditure(and expenditure per student)
(f) Total secondary expenditure is an input measure not an educational outcome measure. Care is required with reporting ofcapital expenditure, block grants to President and Queens Colleges. Includes estimated Primary Tops expenditure.

97
Attachment D2: Primary Completion using Grade 6 2005/06 Enrollment as percentage Grade 1 Enrollment in 2000/01Year Sex Reg01 Reg02 Reg03 Reg04 Reg05 Reg06 Reg07 Reg08 Reg09 Reg10 Reg11 Guyana R1789 R2560 R341105/06 G1 M 569 516 1126 1653 703 1387 267 146 424 583 1481 8855 1406 3189 426005/06 G1 F 503 527 1011 1571 612 1336 263 152 384 496 1486 8341 1302 2971 406805/06 G2 M 493 594 1141 1696 669 1617 289 132 378 576 1618 9203 1292 3456 445505/06 G2 F 457 556 1047 1587 664 1504 252 131 349 516 1574 8637 1189 3240 420805/06 G3 M 512 668 1185 1906 708 1694 264 139 407 576 1822 9881 1322 3646 491305/06 G3 F 558 634 1171 1836 711 1634 237 134 414 577 1776 9682 1343 3556 478305/06 G4 M 500 670 1247 1788 669 1604 219 121 385 575 1975 9753 1225 3518 501005/06 G4 F 458 641 1161 1674 674 1512 223 119 318 525 1864 9169 1118 3352 469905/06 G5 M 397 635 1180 1724 683 1665 264 115 411 558 1891 9523 1187 3541 479505/06 G5 F 402 638 1186 1635 716 1631 257 110 358 526 1892 9351 1127 3511 471305/06 G6 M 389 657 1235 1834 692 1614 260 102 271 538 1785 9377 1022 3501 4854
05/06 G6 F 347 605 1184 1748 669 1566 215 101 293 540 1767 9035 956 3380 4699
05/06 Z M 2860 3740 7114 10601 4124 9581 1563 755 2276 3406 10572 56592 7454 20851 2828705/06 Z F 2725 3601 6760 10051 4046 9183 1447 747 2116 3180 10359 54215 7035 20010 2717000/01 G1 M 391 769 1405 2018 743 1938 281 134 360 665 2026 10730 1166 4115 544900/01 G1 F 391 715 1376 1914 695 1851 212 106 308 617 1902 10087 1017 3878 519200/01 G2 M 424 691 1341 1880 717 1748 236 86 353 564 2174 10214 1099 3720 539500/01 G2 F 415 696 1264 1897 739 1614 217 80 333 490 1992 9737 1045 3539 515300/01 G3 M 422 654 1283 1773 669 1555 250 89 360 566 1942 9563 1121 3444 499800/01 G3 F 402 608 1198 1721 670 1516 233 87 334 571 1896 9236 1056 3365 481500/01 G4 M 389 565 1147 1545 678 1380 248 107 314 479 1895 8747 1058 3102 458700/01 G4 F 359 579 1073 1516 584 1353 234 92 297 466 1856 8409 982 2982 444500/01 G5 M 293 551 1082 1447 625 1271 201 62 315 450 1807 8104 871 2897 433600/01 G5 F 286 539 1012 1389 598 1272 220 55 247 401 1775 7794 808 2810 417600/01 G6 M 244 548 1035 1629 589 1282 186 88 284 389 1763 8037 802 2808 4427
00/01 G6 F 245 541 960 1560 547 1288 174 79 262 389 1608 7653 760 2765 4128
00/01 Z M 2163 3778 7293 10292 4021 9174 1402 566 1986 3113 11607 55395 6117 20086 2919200/01 Z F 2098 3678 6883 9997 3833 8894 1290 499 1781 2934 11029 52916 5668 19339 27909G6/Grade1 M 0.995 0.854 0.879 0.909 0.931 0.833 0.925 0.761 0.753 0.809 0.881 0.874 0.877 0.851 0.891G6/Grade1 F 0.887 0.846 0.860 0.913 0.963 0.846 1.014 0.953 0.951 0.875 0.929 0.896 0.940 0.872 0.905G6/Grade1 All 0.941 0.850 0.870 0.911 0.946 0.839 0.963 0.846 0.844 0.841 0.904 0.884 0.906 0.861 0.898MOE Statistical Bulletins2000/01, 2005/06 (Table22) (Primy_Completion.XLS)
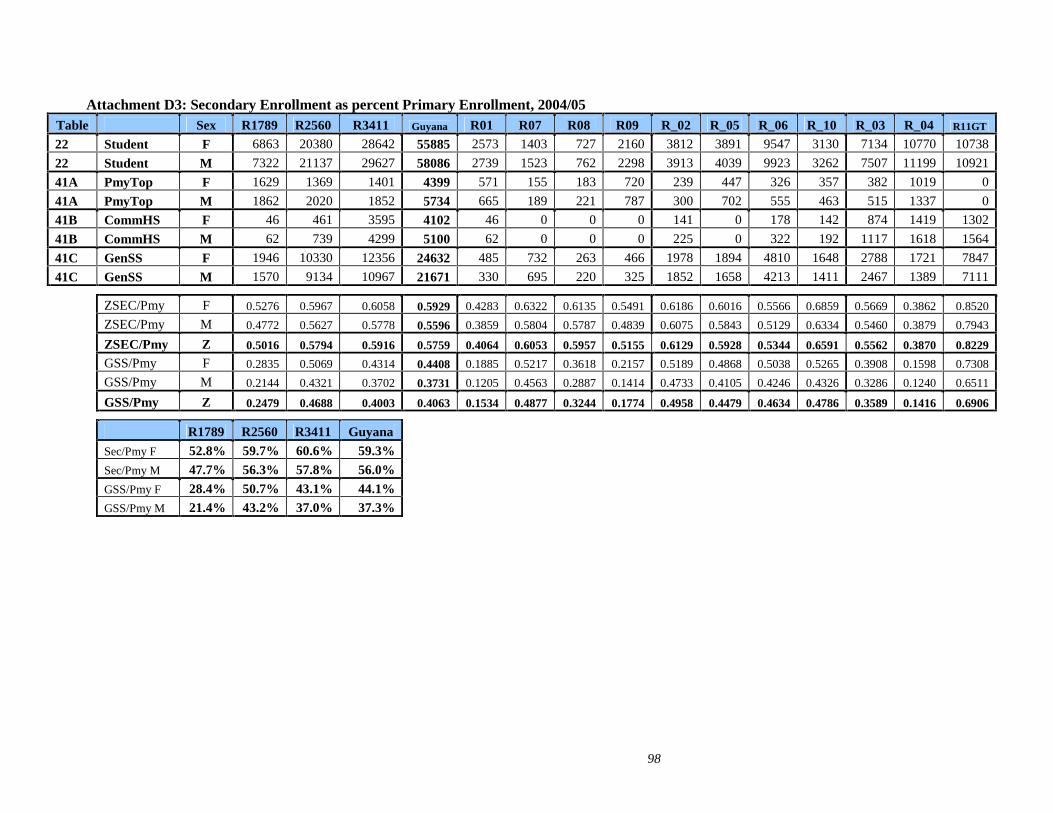
98
Attachment D3: Secondary Enrollment as percent Primary Enrollment, 2004/05Table Sex R1789 R2560 R3411 Guyana R01 R07 R08 R09 R_02 R_05 R_06 R_10 R_03 R_04 R11GT
22 Student F 6863 20380 28642 55885 2573 1403 727 2160 3812 3891 9547 3130 7134 10770 10738
22 Student M 7322 21137 29627 58086 2739 1523 762 2298 3913 4039 9923 3262 7507 11199 10921
41A PmyTop F 1629 1369 1401 4399 571 155 183 720 239 447 326 357 382 1019 0
41A PmyTop M 1862 2020 1852 5734 665 189 221 787 300 702 555 463 515 1337 0
41B CommHS F 46 461 3595 4102 46 0 0 0 141 0 178 142 874 1419 1302
41B CommHS M 62 739 4299 5100 62 0 0 0 225 0 322 192 1117 1618 1564
41C GenSS F 1946 10330 12356 24632 485 732 263 466 1978 1894 4810 1648 2788 1721 7847
41C GenSS M 1570 9134 10967 21671 330 695 220 325 1852 1658 4213 1411 2467 1389 7111
ZSEC/Pmy F 0.5276 0.5967 0.6058 0.5929 0.4283 0.6322 0.6135 0.5491 0.6186 0.6016 0.5566 0.6859 0.5669 0.3862 0.8520
ZSEC/Pmy M 0.4772 0.5627 0.5778 0.5596 0.3859 0.5804 0.5787 0.4839 0.6075 0.5843 0.5129 0.6334 0.5460 0.3879 0.7943
ZSEC/Pmy Z 0.5016 0.5794 0.5916 0.5759 0.4064 0.6053 0.5957 0.5155 0.6129 0.5928 0.5344 0.6591 0.5562 0.3870 0.8229
GSS/Pmy F 0.2835 0.5069 0.4314 0.4408 0.1885 0.5217 0.3618 0.2157 0.5189 0.4868 0.5038 0.5265 0.3908 0.1598 0.7308
GSS/Pmy M 0.2144 0.4321 0.3702 0.3731 0.1205 0.4563 0.2887 0.1414 0.4733 0.4105 0.4246 0.4326 0.3286 0.1240 0.6511
GSS/Pmy Z 0.2479 0.4688 0.4003 0.4063 0.1534 0.4877 0.3244 0.1774 0.4958 0.4479 0.4634 0.4786 0.3589 0.1416 0.6906
R1789 R2560 R3411 Guyana
Sec/Pmy F 52.8% 59.7% 60.6% 59.3%
Sec/Pmy M 47.7% 56.3% 57.8% 56.0%
GSS/Pmy F 28.4% 50.7% 43.1% 44.1%GSS/Pmy M 21.4% 43.2% 37.0% 37.3%

99
R01 R07 R08 R09 R_02 R_05 R_06 R_10 R_03 R_04 R11GT R4+11Sec/Pmy F 0.4283 0.6322 0.6135 0.5491 0.6186 0.6016 0.5566 0.6859 0.5669 0.3862 0.8520 0.6187Sec/Pmy M 0.3859 0.5804 0.5787 0.4839 0.6075 0.5843 0.5129 0.6334 0.5460 0.3879 0.7943 0.5886GSS/Pmy F 0.1885 0.5217 0.3618 0.2157 0.5189 0.4868 0.5038 0.5265 0.3908 0.1598 0.7308 0.4449
GSS/Pmy M 0.1205 0.4563 0.2887 0.1414 0.4733 0.4105 0.4246 0.4326 0.3286 0.1240 0.6511 0.3843

100
R01 R07 R08 R09 R02 R05 R06 R10 R03 R04 R11GT GuyanaGenSS F 485 732 263 466 1978 1894 4810 1648 2788 1721 7847 24632GenSS M 330 695 220 325 1852 1658 4213 1411 2467 1389 7111 21671GSS/Pmy F 18.8% 52.2% 36.2% 21.6% 51.9% 48.7% 50.4% 52.7% 39.1% 16.0% 73.1% 44.1%GSS/Pmy M 12.0% 45.6% 28.9% 14.1% 47.3% 41.0% 42.5% 43.3% 32.9% 12.4% 65.1% 37.3%

101
Attachment D4: Staffing and School Size
Table D4.1 presents data with schools grouped 1-150, 151-300, 301-450 etc., to show Grade 10-12 students as more than 30% of total enrollment in GSS>300 students, and Trained Graduate teachers more than 10% of all teachers in secondary schools with 301-750 students. The Table could indicate an organizational “boundary” for schools above/below 300 students. Less than half the teachers are trained, less than 10% are trained graduates and, upper secondary students represent less than 20% of enrollment. The regional distribution of secondary schools in Table D4.2 shows the concentration of small Primary Tops across all regions (except Georgetown).
Table D4.1: Secondary Schools by Size, Type, Grade10+ students and Teachers Trained
SIZ
E
Type
Mea
nS
ize
Stu
dent
s20
05/0
6
Gra
de10
+%
Tota
l
Gra
des
10,1
1,12
%Fe
mal
eTe
ache
rs
Tota
lTe
ache
rs
%Tr
aine
dTe
ache
rs
%G
radu
ate
Trai
ned
%U
nqua
lU
ntra
ined
Num
ber
Sch
ools
1 1PTop 30 6564 11.6% 763 57.6% 335 45.1% 3.6% 26.3% 2161 2CHS 53 106 3.8% 4 70.0% 20 35.0% 5.0% 0.0% 21 3GSS 102 102 28.4% 29 75.0% 4 25.0% 0.0% 25.0% 1
151 1PTop 198 2779 14.1% 392 70.5% 112 48.2% 2.7% 5.4% 14151 2CHS 239 1436 19.9% 286 69.4% 85 45.9% 3.5% 8.2% 6151 3GSS 198 992 20.4% 202 59.4% 64 42.2% 4.7% 3.1% 5301 1PTop 354 707 14.4% 102 68.0% 25 40.0% 0.0% 4.0% 2301 2CHS 388 2327 20.3% 473 76.3% 131 48.9% 6.9% 14.5% 6301 3GSS 391 7422 31.2% 2317 67.0% 409 54.5% 12.0% 3.7% 19451 2CHS 521 5207 22.3% 1159 80.0% 225 49.3% 12.9% 6.2% 10451 3GSS 540 9728 32.1% 3121 73.0% 519 56.5% 11.9% 2.9% 18601 3GSS 679 16977 33.5% 5692 66.7% 826 56.7% 11.9% 1.0% 25751 3GSS 822 7400 29.8% 2202 65.6% 326 64.4% 9.2% 4.0% 9901 3GSS 968 3870 31.2% 1206 66.5% 158 64.6% 7.0% 1.3% 4
1051 3GSS 1080 1080 33.2% 359 53.8% 39 92.3% 5.1% 7.7% 166697 27.4% 18307 67.9% 3278 54.8% 9.5% 5.9% 338Secondary
Table D4.2: Regional Distribution of Secondary Schools by Size and School Type Region
SIZE Type Schools 1 2 3 4 5 6 7 8 9 10 11
1 1PTop 216 36 20 19 27 15 12 16 17 38 16 01 2CHS 2 0 0 0 0 0 0 0 0 0 1 11 3GSS 1 0 0 0 0 0 0 1 0 0 0
151 1PTop 14 1 0 3 4 4 1 0 0 0 1 0151 2CHS 6 1 2 2 0 0 0 0 0 0 0 1151 3GSS 5 0 0 0 1 0 1 0 0 2 0 1301 1PTop 2 0 0 0 0 1 0 0 0 0 1 0301 2CHS 6 0 0 1 2 0 0 0 0 0 1 2301 3GSS 19 2 0 2 2 1 4 1 1 1 0 5451 2CHS 10 0 0 2 4 0 0 0 0 1 0 3451 3GSS 18 0 1 4 3 1 2 0 0 0 0 7601 3GSS 25 0 1 2 1 3 6 0 0 0 4 8751 3GSS 9 0 1 1 0 1 2 0 0 0 1 3901 3GSS 4 0 2 0 0 0 1 0 0 0 0 11051 3GSS 1 0 0 0 0 0 0 1 0 0 0 0Secondary 338 40 27 36 44 26 29 18 19 42 25 32
Table D4.3 School Size, Student Teacher Ratios and Percentage Teachers Trained, 2005/06

102
Size/50 Schools Students
Enrolled STR TrainedTeachers
Total Teachers
percentTrained
PrimaryTops CHS GSS
1 185 6358 17.7 159 359 44 45 35 25
151 25 5207 20.0 120 261 46 48 46 42
301 27 10456 18.5 297 565 53 40 49 55
451 28 14935 20.1 404 744 54 49 56
601 25 16977 20.6 468 826 57 57
751 9 7400 22.7 210 326 64 64
901 4 3870 24.5 102 158 65 65 1051 1 1080 27.7 36 39 92 92
304 66283 20.2 1796 3278 55 46 48 58
Size/50 Schools Students
Enrolled STR TrainedTeachers
Total Teachers
percentTrained
PrimaryTops CHS GSS
1 141 2700 12.2 100 221 45 45 43
51 34 2518 25.7 35 98 36 36 31
101 10 1140 28.5 24 40 60 64 25
151 11 1893 19.5 44 97 45 54 36 31
201 10 2235 19.6 54 114 47 39 54 50
251 4 1079 21.6 22 50 44 50 42
301 4 1366 19.5 40 70 57 60 56
351 13 4834 19.0 136 255 53 40 55 55
401 10 4256 17.7 121 240 50 39 54
451 7 3372 19.8 97 170 57 53 63
501 10 5266 20.8 135 253 53 48 56
551 11 6297 19.6 172 321 54 44 55
601 7 4397 19.5 147 226 65 65
651 6 3986 19.7 114 202 56 56
701 12 8594 21.6 207 398 52 52
751 4 3110 23.2 86 134 64 64
801 1 812 33.8 13 24 54 54
851 4 3478 20.7 111 168 66 66 901 2 1842 25.6 39 72 54 54
951 1 988 23.0 32 43 74 74
1001 1 1040 24.2 31 43 72 72 1051 1 1080 27.7 36 39 92 92
304 66283 20.2 1796 3278 55 46 48 58
Size/50 Schools Students
Enrolled STR TrainedTeachers
Total Teachers
percentTrained
PrimaryTops CHS GSS
1 210 11565 18.65 279 620 45 46 44 41
301 55 25391 19.4 701 1309 54 40 49 56
601 34 24377 21.16 678 1152 59 59
901 5 4950 25.13 138 197 70 70
304 66283 20.22 1796 3278 55 46 48 58
Source: MOE Statistics (GY0506_X004_Type.sql) Attachment D4

103
Attachment D5: Student Attendance
D5.1 Regional patterns by gender in Figure D5.1 reflect the aggregate trends in Table 4.6, with some notable variations – Sessions attended are on the left-hand scale and the lines in the bottom half of Figure 4.6. The Coastal/Urban regions including Georgetown (R3, 4&11) have more sessions attended (black=Female; red=Male) except following the flooding when they took longer to recover. Regions 2, 5, 6&10 had more sessions until a seasonal downturn in March 2005. The hinterland regions (R1, 7, 8&9) were less affected by the lowland/coastal flooding but have fewer students resulting in fewer total sessions. R1, 7, 8&9 has more male students so that male and female sessions are approximately equal.
Figure D5.1
MONTHLY ATTENDANCE 2004/05 BY REGION
0
100000
200000
300000
400000
500000
600000
700000
800000
900000
1000000
01S 02O 03N 04D 05J 06F 07M 08A 09M 10J
0%
10%
20%
30%
40%
50%
60%
70%
80%
90%
100%
AM1789 AF1789 AM2560 AF2560 AM3411 AF3411
M1789 F1789 M2560 F2560 M3411 F3411
D5.2 Attendance rates in the top half of Figure D5.1 and shown on the right-hand scale show female attendance consistently higher than male attendance in the three regional groupings. Female attendance approached 80% in rural regions through most months, dropping to 70% in January and March. Male rates in those regions only reached or exceeded 70% in the first three months of the school year and in February and April.
D5.3 If these patterns are broadly consistent from year to year, Guyana should encourage
Regional Departments to consider a more flexible school year, such as starting the school year in August and/or arranging schooling from Monday to Saturday in the early months to make up for time lost during flooding in December or January in lowland areas and low attendance in March due to high river levels in the hinterland.

104
D5.4 Another factor affecting regional attendance rates is the differing mix of schools. R1, 7 8&9 Hinterland has few GSS, smaller schools and many Primary Tops. R2, 5, 6&10 has a mix of all types, while coastal/urban R3, 4&11 has most GSS with higher enrollment, especially of female students.
Figure D5.2 D5.5 Being larger and urban, GSS
account for most students and most of the attendance sessions in Figure D5.2 (Female black lines; Male red lines). Primary Tops and CHS account for fewer than 100,000 student sessions for males and females in almost every month.
D5.6 Female attendance exceeds
male attendance in every month. In Table D5.1, Male attendance in Primary Tops exceeded 60% only in September 2004, Female attendance in September, October and February 2005. CHS had a similar pattern with December 2004 under 40% (flooding in R3, 4&11).
Table D5.1 Monthly attendance rates by Type of School and Gender, 2004/05 Sept Oct Nov Dec Jan 05 Feb Mar Apr May June 04/05 (a)
AMPTop 116,972 104,911 96,005 30,470 71,086 68,504 59,725 72,522 63,455 86,250 773,213 MPTop 60.6% 58.0% 55.1% 46.1% 49.9% 53.5% 50.5% 52.0% 48.8% 52.2% 53.5% AFPTop 93,172 83,072 77,891 26,963 55,464 58,722 49,578 60,845 53,245 71,270 633,093 FPTop 64.4% 61.1% 59.0% 54.9% 51.8% 61.0% 57.0% 58.9% 55.4% 59.6% 58.8% AMCHS 107,868 89,275 87,054 22,574 41,953 43,695 54,440 76,592 58,499 71,647 654,624 MCHS 67.7% 58.0% 57.6% 35.9% 44.8% 55.1% 48.9% 59.5% 50.8% 53.3% 54.9% AFCHS 87,127 77,571 75,055 20,526 36,991 38,313 51,308 63,590 54,047 63,871 569,391 FCHS 72.5% 66.2% 65.1% 42.9% 50.5% 59.3% 58.6% 62.7% 59.9% 61.7% 61.7% AMGSS 549,692 493,020 485,010 149,870 348,907 378,055 340,943 400,909 381,046 423,567 3,967,904 MGSS 80.3% 77.4% 75.9% 61.8% 67.1% 72.9% 69.6% 74.8% 70.7% 71.7% 73.3% AFGSS 652,202 591,093 580,297 183,670 428,680 486,425 410,549 492,944 468,285 514,740 4,833,173 FGSS 82.3% 80.1% 77.8% 64.8% 69.8% 81.2% 69.9% 78.5% 73.9% 75.0% 76.3%
Source: MOE data. (ATT4500.XLS) (a) Total includes July attendance (mostly Grade 12)
D5.7 In Table D5.1, months with more than 75% attendance are shaded gold, between 60% and 75% shaded tan, and 40% to 60% are shaded light green. In December, males attending CHS (mostly in R3, 4&11) recorded only 35.9% attendance. GSS, by contrast with CHS and primary tops, reported no month less than 60% and several months >75%. Figure D5.3 plots monthly attendance rates in Table D4.1.
MONTHLY ATTENANCE BY SCHOOL TYPE
0
100000
200000
300000
400000
500000
600000
700000
Sept Oct Nov Dec Jan 05 Feb Mar Apr May June
AMPTop AFPTop AMCHS
AFCHS AMGSS AFGSS

105
D5.8 As these tables/graphs use individual schools data, Figure D5.4 can present the same data by size of school.
Figure D5.3
PERCENTAGE ATTENANCE BY SCHOOL TYPE
0%
10%
20%
30%
40%
50%
60%
70%
80%
90%
100%
Sept Oct Nov Dec Jan 05 Feb Mar Apr May June
MPTop FPTop MCHS
FCHS MGSS FGSS
Figure D5.4
Monthly Attendance by Size of School
0.0
0.1
0.2
0.3
0.4
0.5
0.6
0.7
0.8
0.9
1.0
01SEP 02OCT 03NOV 04DEC 05JAN 06FEB 07MAR 08APR 09MAY 10JUN
001 101 301 601 901 ALL
Source: Att4500.XLS

106
Attachment D6A: School Age Population Profile 2004/05 by Region and GenderZONE Region Sex Age05 Age06 Age07 Age08 Age09 Age10 Age11 Age12 Age13 Age14 Age15 Age16 Age17
R1789 R01 F 69 332 433 432 396 386 391 434 265 213 179 81 64
R1789 R01 M 87 332 425 424 449 410 393 487 256 191 182 101 59
R1789 R07 F 32 186 248 218 259 220 252 239 197 178 148 96 17
R1789 R07 M 42 206 262 220 268 244 276 286 194 145 176 79 9
R1789 R08 F 42 139 128 108 131 107 117 107 100 88 63 35 8
R1789 R08 M 40 142 124 116 101 141 130 105 85 81 86 30 22
R1789 R09 F 211 317 328 286 314 303 357 418 228 253 187 88 56
R1789 R09 M 216 314 337 337 327 303 365 399 208 211 195 105 93
R1789 F 354 974 1137 1044 1100 1016 1117 1198 790 732 577 300 145
R1789 M 385 994 1148 1097 1145 1098 1164 1277 743 628 639 315 183
R2560 R02 F 124 547 630 689 624 667 605 430 496 486 403 328 141
R2560 R02 M 119 582 631 658 694 652 599 530 498 462 404 294 167
R2560 R05 F 151 555 636 662 682 656 699 566 465 376 349 222 213
R2560 R05 M 158 625 652 688 706 663 666 567 538 395 331 219 191
R2560 R06 F 311 1382 1607 1540 1738 1747 1468 1423 1068 947 847 514 269
R2560 R06 M 338 1469 1659 1713 1747 1778 1396 1309 1078 1010 784 481 251
R2560 R10 F 126 509 496 517 542 456 560 507 355 359 374 279 197
R2560 R10 M 117 532 512 533 583 476 581 455 374 364 341 228 232
R2560 F 712 2993 3369 3408 3586 3526 3332 2926 2384 2168 1973 1343 820
R2560 M 732 3208 3454 3592 3730 3569 3242 2861 2488 2231 1860 1222 841
R3411 R03 F 200 1011 1200 1151 1337 1287 1105 968 853 763 668 488 147
R3411 R03 M 237 1072 1244 1298 1341 1271 1205 917 863 793 715 450 200
R3411 R04 F 307 1571 1879 1767 1854 1871 1635 1187 942 931 611 240 134
R3411 R04 M 328 1584 1962 1873 1956 1887 1669 1353 1042 868 673 216 132
R3411 R11 F 375 1551 1761 1621 2031 2022 1932 1580 1768 1722 1606 1102 816
R3411 R11 M 358 1669 1771 1683 1931 2041 1952 1643 1546 1475 1572 1014 941
R3411 F 882 4133 4840 4539 5222 5180 4672 3735 3563 3416 2885 1830 1097
R3411 M 923 4325 4977 4854 5228 5199 4826 3913 3451 3136 2960 1680 1273Source: MOE Statistical Digest - Students enrolled 2004/05 PopAge45_001.sql; Zone is grouping of Regions used in USE Review; Region 11=Georgetown.Note: Age5 includes <6; Age11 includes secondary students <12; Age12 includesPrimary students<12; Age17 includes Secondary students>16 years.

107
Population at September 2002 Census (Age=Census+2 years) and Students Enrolled in 2004/05 by Zone, School Level and Gender
ZONE Level SexAge2
Age03 Age04 Age05 Age06 Age07 Age08 Age09 Age10 Age11 Age12 Age13 Age14 Age15 Age16 Age17 Age18
R1789 0Popul F 1451 1206 1272 1081 1267 1097 1036 1053 1168 1032 909 869 877 787 711 633 582
R1789 0Popul M 1516 1172 1303 1209 1188 1142 1097 1131 1204 1052 961 884 888 826 776 702 649
R1789 1Primary F 354 974 1137 1044 1100 1016 812 426
R1789 1Primary M 385 994 1148 1097 1145 1098 885 570
R1789 2PTop F 109 352 358 363 273 115 59
R1789 2PTop M 106 342 422 372 343 165 112
R1789 3CHS F 4 16 7 10 3 6
R1789 3CHS M 3 19 13 14 9 4
R1789 4GSS F 196 416 416 362 294 182 80
R1789 4GSS M 173 362 302 243 282 141 67
R2560 0Popul F 2980 2718 2934 3121 3551 3382 3499 3751 3695 3347 3158 2776 2732 2897 2711 2741 2510
R2560 0Popul M 3026 2889 3226 3279 3729 3563 3715 3830 3673 3393 3211 2928 2751 2931 2861 2586 2392
R2560 1Primary F 712 2993 3369 3408 3586 3526 2533 253
R2560 1Primary M 732 3208 3454 3592 3730 3569 2554 298
R2560 2PTop F 111 324 333 264 198 102 37
R2560 2PTop M 127 488 514 430 283 116 62
R2560 3CHS F 29 108 115 60 73 49 27
R2560 3CHS M 62 173 147 132 108 71 46
R2560 4GSS F 659 2241 1936 1844 1702 1192 756
R2560 4GSS M 499 1902 1827 1669 1469 1035 733
R3411 0Popul F 4276 4117 4474 4365 4899 4498 4659 5115 5141 4722 4464 4067 4075 4437 4167 3968 3729
R3411 0Popul M 4370 4198 4613 4481 5047 4816 4819 5295 5197 4803 4517 4256 4201 4496 4113 3973 3661
R3411 1Primary F 882 4133 4840 4539 5222 5180 3590 256
R3411 1Primary M 923 4325 4977 4854 5228 5199 3746 375
R3411 2PTop F 162 530 335 208 126 30 10
R3411 2PTop M 202 653 468 293 191 36 9
R3411 3CHS F 201 859 717 803 618 256 141
R3411 3CHS M 261 1030 939 853 801 279 136

108
R3411 4GSS F 719 2090 2511 2405 2141 1544 946
R3411 4GSS M 617 1855 2044 1990 1968 1365 1128
Source: As above. PopAge45_003.sql; Note: Age5 is <6; Age11 is <12; Age12 includesPrimary students<12; Age17 includes Secondary students>16 years.

109
Attachment D6B: AGGREGATE SECONDARY ENROLLMENT BY REGION BY GRADE AND BY GENDER: 1997/98-2001/02-2005/06 SURVIVAL 2001/02 - 2005/06
Year REG NN M07 F07 M08 F08 M09 F09 M10 F10 M11 F11 M12 F12 Male Fem. Total M11/M07 F11/F07 Z11/Z07
0506 R01 40 436 420 298 281 222 280 121 139 27 53 0 0 1104 1173 2277 8.41% 17.67% 12.88%
0506 R02 27 665 735 593 678 366 436 401 411 280 405 0 0 2305 2665 4970 46.98% 73.24% 59.62%
0506 R03 36 1196 1036 1037 998 795 782 640 682 384 497 0 0 4052 3995 8047 31.09% 45.89% 38.01%
0506 R04 44 1286 1210 1141 1060 903 863 552 651 289 384 40 56 4211 4224 8435 18.66% 28.66% 23.30%
0506 R05 26 717 664 612 540 511 510 432 466 262 339 0 0 2534 2519 5053 48.88% 60.11% 54.64%
0506 R06 30 1410 1366 1231 1273 995 1003 839 969 493 638 15 44 4983 5293 10276 34.28% 45.80% 39.95%
0506 R07 18 226 201 219 209 188 201 159 193 102 100 0 0 894 904 1798 48.80% 49.50% 49.15%
0506 R08 18 155 141 90 104 83 91 55 80 2 29 0 0 385 445 830 1.56% 20.42% 11.48%
0506 R09 42 409 359 402 303 306 297 160 188 62 64 1 3 1340 1214 2554 20.53% 22.38% 21.43%
0506 R10 25 673 607 524 564 399 441 345 459 150 215 12 40 2103 2326 4429 33.48% 52.96% 42.74%
0506 R11 32 2401 2228 2110 2239 1698 1852 1401 1680 803 1130 150 215 8563 9344 17907 35.10% 51.86% 43.27%
0506 ZGY 338 9574 8967 8257 8249 6466 6756 5105 5918 2854 3854 218 358 32474 34102 66576 31.54% 45.62% 38.34%
0102 R01 42 321 300 194 239 173 166 120 120 38 22 0 0 846 847 1693 18.10% 10.28% 14.15%
0102 R02 31 596 553 550 507 454 491 346 484 270 349 1 8 2217 2392 4609 52.53% 60.91% 56.95%
0102 R03 44 1235 1083 992 1052 978 982 777 726 413 521 0 0 4395 4364 8759 39.83% 55.19% 47.15%
0102 R04 48 1549 1340 1308 1143 995 919 769 741 235 290 26 43 4882 4476 9358 16.94% 24.56% 20.44%
0102 R05 29 536 564 565 591 499 496 447 475 305 371 0 0 2352 2497 4849 47.36% 62.46% 54.60%
0102 R06 46 1438 1393 1335 1277 1155 1117 914 938 509 728 0 0 5351 5453 10804 36.02% 50.98% 43.54%
0102 R07 19 209 202 175 163 169 166 137 148 16 24 0 0 706 703 1409 9.76% 17.91% 13.42%
0102 R08 19 128 142 46 65 62 58 63 54 10 12 0 0 309 331 640 9.80% 14.63% 11.96%
0102 R09 42 302 286 213 230 187 182 173 192 14 22 0 0 889 912 1801 5.09% 8.12% 6.59%
0102 R10 29 448 406 402 408 365 366 327 416 120 203 2 10 1664 1809 3473 25.37% 47.76% 35.97%
0102 R11 32 2288 2179 1843 2003 1751 2014 1364 1490 910 1216 43 95 8199 8997 17196 48.48% 67.15% 57.65%
0102 ZGY 381 9050 8448 7623 7678 6788 6957 5437 5784 2840 3758 72 156 31810 32781 64591 35.08% 49.08% 41.88%
97/98 R01 38 210 214 132 115 102 96 68 94 21 19 0 0 533 538 1071
97/98 R02 36 514 573 527 482 450 435 427 410 186 286 0 0 2104 2186 4290
97/98 R03 54 1037 944 873 883 692 677 688 672 301 486 0 0 3591 3662 7253
97/98 R04 53 1387 1181 1176 1052 981 893 795 761 243 351 25 34 4607 4272 8879
97/98 R05 34 644 594 565 588 520 510 436 491 170 333 0 0 2335 2516 4851
97/98 R06 64 1413 1428 1148 1255 942 1040 980 1046 556 726 3 3 5042 5498 10540
97/98 R07 17 164 134 197 184 106 125 125 120 19 25 0 0 611 588 1199
97/98 R08 17 102 82 99 103 61 72 34 49 3 12 0 0 299 318 617
97/98 R09 37 275 271 222 180 194 186 183 172 14 24 0 0 888 833 1721
97/98 R10 31 473 425 459 425 398 420 441 478 175 261 3 3 1949 2012 3961
97/98 R11 36 1877 1811 1784 1876 1863 1910 1704 1946 788 1216 31 65 8047 8824 16871
97/98 ZGY 417 8096 7657 7182 7143 6309 6364 5881 6239 2476 3739 62 105 30006 31247 61253
MOE enrollment data (Table 41A-C).
Grade 11 students compared with Grade7 four years earlier. Grade 7 in 2001/02compared with Grade 11 in 2005/06(turquoise shading).
Lime Green shading for 1997/97-2001/02 cohort.
Source: G7_G11_Completion.XLS(December 2007)

110
Attachment D7: SSEE Examination Results by Region, 2001/02-2006/07
GRADE 6 Fem% SSEE MATH ENGLISH SOCIAL SC SCIENCE MESSRegion Year
M6 F6 ENROL Enrol %G6 Entries mean stdev mean stdev mean stdev mean stdev TOTAL
Reg01 01/02 253 269 522 52% 69% 358 17.2 8.4 19.8 8.8 20.4 9.7 23.9 9.9 81.3
Reg02 01/02 476 520 996 52% 96% 959 24.9 14.6 24.1 12.6 24.9 13.6 28.1 13.7 102.0Reg03 01/02 1041 1023 2064 50% 91% 1871 25.0 14.0 23.6 12.0 25.3 13.6 27.8 13.4 101.7Reg04 01/02 1328 1319 2647 50% 106% 6326 25.0 14.2 25.3 13.1 25.7 13.6 28.4 13.5 104.4Reg11 01/02 1701 1638 3339 49%
Reg05 01/02 616 584 1200 49% 93% 1111 21.3 11.3 21.5 11.0 22.7 12.1 25.7 12.1 91.1
Reg06 01/02 1211 1243 2454 51% 95% 2336 20.6 11.9 20.6 11.1 21.5 12.3 24.6 12.7 87.2
Reg07 01/02 172 166 338 49% 104% 351 19.9 10.2 21.5 10.1 21.9 11.1 24.8 11.3 88.0
Reg08 01/02 73 63 136 46% 127% 173 11.0 6.2 13.3 8.5 14.0 8.0 15.2 8.1 53.4
Reg09 01/02 274 272 546 50% 75% 409 14.2 7.1 16.6 7.9 16.6 8.5 19.2 9.2 66.7
Reg10 01/02 351 382 733 52% 109% 798 23.8 11.5 24.8 11.2 26.7 12.3 29.7 12.1 105.0
TOTAL 01/02 7496 7479 14975 50% 98% 14692 23.2 13.4 23.3 12.3 24.1 13.2 27.0 13.2 97.6
Reg01 02/03 271 307 578 53% 82% 472 16.0 7.7 17.2 8.4 19.3 9.2 21.7 10.9 74.2
Reg02 02/03 504 535 1039 51% 98% 1021 24.3 12.7 25.3 11.9 26.1 12.9 30.9 15.3 106.6Reg03 02/03 1048 1033 2081 50% 93% 1942 24.7 12.9 24.5 12.0 25.5 12.9 29.9 15.2 104.6Reg04 02/03 1461 1398 2859 49% 101% 6090 24.4 13.2 26.2 12.7 26.3 12.7 30.5 14.7 107.4Reg11 02/03 1610 1534 3144 49%
Reg05 02/03 599 541 1140 47% 92% 1046 21.7 10.9 22.7 10.7 23.3 11.5 27.9 13.4 95.6
Reg06 02/03 1322 1291 2613 49% 92% 2414 21.6 11.4 22.1 11.1 23.1 11.9 27.4 14.4 94.1
Reg07 02/03 212 195 407 48% 101% 410 20.1 9.4 20.0 9.6 21.6 10.4 25.3 12.7 86.9
Reg08 02/03 80 70 150 47% 159% 239 11.7 8.6 12.3 9.2 14.5 10.6 16.1 11.8 54.6
Reg09 02/03 273 280 553 51% 82% 452 16.2 7.1 17.5 8.4 19.0 8.8 21.1 10.2 73.8
Reg10 02/03 374 416 790 53% 110% 871 24.5 11.1 25.6 10.9 26.5 11.1 31.6 13.3 108.0
TOTAL 02/03 7754 7600 15354 49% 97% 14858 21.6 13.2 22.6 13.0 23.3 13.3 27.2 15.7 94.7
Reg01 03/04 316 351 667 53% 76% 507 17.8 8.7 16.9 8.3 16.6 8.2 20.5 9.6 71.8
Reg02 03/04 582 561 1143 49% 101% 1154 24.9 14.1 22.0 11.6 24.0 13.6 27.7 14.8 98.6
Reg03 03/04 1162 1141 2303 50% 94% 2165 26.2 13.9 22.9 11.8 24.6 13.4 28.7 14.8 102.3

111
Reg04 03/04 1547 1587 3134 51% 102% 6668 26.1 14.0 24.3 12.9 25.5 13.7 28.9 14.8 104.8Reg11 03/04 1776 1647 3423 48%
Reg05 03/04 619 641 1260 51% 94% 1180 23.6 12.2 20.9 10.6 22.3 12.3 26.2 13.4 93.1
Reg06 03/04 1465 1381 2846 49% 93% 2639 22.3 12.4 20.1 11.1 20.8 12.4 24.5 13.8 87.7
Reg07 03/04 238 199 437 46% 99% 434 20.9 10.6 19.1 9.8 20.0 11.1 23.3 12.0 83.4
Reg08 03/04 125 102 227 45% 91% 206 14.8 6.9 14.2 7.9 14.1 6.5 17.3 8.8 60.3
Reg09 03/04 297 260 557 47% 95% 528 16.7 7.8 16.3 7.9 15.6 7.6 19.0 9.1 67.7
Reg10 03/04 344 395 739 53% 137% 1013 25.5 12.3 22.9 10.8 24.1 11.9 28.9 13.4 101.4
TOTAL 03/04 8471 8265 16736 49% 98% 16427 23.3 14.0 21.2 12.6 22.3 13.7 25.8 15.1 92.6
Reg01 04/05 331 342 673 51% 76% 512 20.8 9.8 19.7 10.2 17.3 8.6 20.4 9.9 78.1
Reg02 04/05 598 591 1189 50% 99% 1176 27.6 14.4 25.1 12.7 22.6 12.6 27.2 14.6 102.4Reg03 04/05 1153 1141 2294 50% 98% 2243 28.0 14.4 26.0 12.9 23.3 12.5 28.0 14.5 105.3Reg04 04/05 1668 1664 3332 50% 105% 7239 28.2 14.5 27.5 13.9 24.1 12.9 28.0 14.5 107.7Reg11 04/05 1830 1756 3586 49%
Reg05 04/05 680 711 1391 51% 93% 1294 26.1 13.2 24.2 12.5 21.1 11.3 25.5 13.3 96.8
Reg06 04/05 1506 1496 3002 50% 96% 2896 24.4 13.1 23.3 12.5 20.0 11.3 24.5 13.8 92.2
Reg07 04/05 212 197 409 48% 107% 439 24.3 10.4 22.5 11.1 19.6 10.1 23.8 10.8 90.0
Reg08 04/05 101 95 196 48% 119% 234 15.8 8.2 15.3 9.3 13.1 6.6 16.2 8.7 60.3
Reg09 04/05 319 292 611 48% 85% 519 20.7 10.2 19.3 9.8 16.6 8.6 21.0 10.0 77.5
Reg10 04/05 454 469 923 51% 113% 1042 28.7 13.1 27.0 12.5 24.2 11.9 29.1 13.4 108.9
TOTAL 04/05 8852 8754 17606 50% 100% 17594 26.7 13.9 25.4 13.2 22.3 12.3 26.6 14.1 100.9

112
GRADE 6 Fem% SSEE MATH ENGLISH SOCIAL SC SCIENCE MESSRegion Year
M6 F6 ENROL Enrol %G6 Entries mean stdev mean stdev mean stdev mean stdev TOTAL
Reg01 05/06 389 347 736 47% 74% 541 16.7 7.2 17.2 7.9 15.1 7.5 19.4 9.4 68.4
Reg02 05/06 657 605 1262 48% 105% 1322 23.0 11.9 23.1 11.7 21.3 11.9 27.3 14.3 94.7
Reg03 05/06 1235 1184 2419 49% 101% 2445 23.2 12.2 23.1 11.9 21.3 12.1 27.1 14.3 94.8
Reg04 05/06 1834 1748 3582 49% 105% 7500 24.5 12.8 25.6 12.6 22.9 12.4 28.0 14.1 100.9Reg11 05/06 1785 1767 3552 50%
Reg05 05/06 692 669 1361 49% 95% 1297 21.5 11.0 21.1 10.9 19.4 10.9 24.8 13.3 86.8
Reg06 05/06 1614 1566 3180 49% 98% 3122 21.3 11.0 21.3 11.0 19.3 11.0 25.0 13.7 86.7
Reg07 05/06 260 215 475 45% 103% 490 18.0 8.4 19.1 10.4 16.6 9.1 20.7 11.1 74.3
Reg08 05/06 102 101 203 50% 111% 225 14.2 5.9 15.0 6.8 13.2 6.2 16.9 7.6 59.4
Reg09 05/06 271 293 564 52% 91% 516 16.4 7.2 18.9 9.1 15.6 7.5 21.0 9.9 71.9
Reg10 05/06 538 540 1078 50% 100% 1082 23.3 10.6 23.9 10.7 22.2 11.2 27.7 12.7 97.0
TOTAL 05/06 9377 9035 18412 49% 101% 18540 22.6 11.9 23.2 11.9 21.0 11.8 26.3 13.8 93.1
Reg01 06/07 0 0 0 0 675 15.9 6.6 14.1 6.3 18.1 8.2 16.9 7.5 65.0
Reg02 06/07 0 0 0 0 1167 23.3 12.0 19.1 10.4 24.3 12.4 23.0 11.9 89.7
Reg03 06/07 0 0 0 0 2212 23.9 12.5 19.6 10.4 24.7 12.9 23.6 12.7 91.8
Reg04 06/07 0 0 0 0 3353 22.6 12.2 19.2 10.2 23.9 12.5 22.2 12.1 87.9
Reg11 06/07 0 0 0 0 3658 27.9 13.5 25.1 12.2 30.5 13.6 28.3 13.5 111.9Reg05 06/07 0 0 0 0 1231 23.0 11.4 18.2 9.4 23.4 12.0 22.2 11.3 86.8
Reg06 06/07 0 0 0 0 3044 21.3 11.8 17.6 10.0 21.9 12.4 21.1 12.1 81.8
Reg07 06/07 0 0 0 0 476 18.3 9.5 16.2 8.9 20.1 10.7 19.0 9.7 73.6
Reg08 06/07 0 0 0 0 221 14.7 6.4 13.8 7.1 18.8 9.3 16.5 8.2 63.8
Reg09 06/07 0 0 0 0 508 17.1 8.2 15.0 7.7 19.2 9.1 17.2 8.0 68.4
Reg10 06/07 0 0 0 0 989 22.9 11.1 20.1 10.4 25.6 12.4 24.2 12.2 92.8
TOTAL 06/07 0 0 0 0 18538 23.1 12.3 19.7 10.8 24.6 12.9 23.1 12.5 90.5
Source: NCERD Reports; enrollment from MOE Statistical Digests no data Reg04 includes Georgetown

113
Attachment E: Projected Demand and Supply of Teachers
E1 The demand for secondary education can be summarized as follows: � Demand flowing from age-structure of the population, improved primary education
participation, improved primary school learning outcomes, access issues in hinterland regions, improved transition from primary to secondary schools, and student placement/migration to Georgetown schools;
� Demand if CHSÆGSS and TopsÆ GSS improve completion/transfers. � Demand if secondary school attendance rates improve, and Grade 7 repetition is
reduced. This may not increase aggregate demand, but will compete with new enrollments for available teachers and classroom places;
� Demand, estimate of new enrollments in private schools which potentially reduce demand for places in public secondary schools;
� Demand, clarifying links between secondary schools, Practical Training Centers, technical education and commercial/business colleges which potentially reduce demand for places in secondary schools.
E2 Tables E1 (A-C) project national Grade 7 intake over the next five years, assuming a decline in population aged 12, from 19,600 in 2007 to 17,600 by 2011, a 0-2% impact of FTI initiatives in Hinterland Regions, Primary completion rates between 90-95%, primary-secondary transition rates of 93-95%, 0-2% impact from consolidation of Primary Tops, -1 to -3% drop out, 0-3% emigration, and 0-2% net transfer from public to private schools.
E3 The baseline assumptions have approximately 80% of the Grade 7 cohort enrolled, with total intake (shaded cells) declining from 15,800 in 2007 to 14,200 in 2011/12.
Table E1(A) Baseline GRADE7 Percent 2007 2008 2009 2010 2011 2012
Cohort 100 19600 19800 19500 19500 17600 17600
R1789 0% 19600 19800 19500 19500 17600 17600
PmyComp 91% 17836 18018 17745 17745 16016 16016
Pmy Æ Sec 93% 16587 16756 16502 16502 14894 14894
TopsÆ GSS 0% 16587 16756 16502 16502 14894 14894
Drop out -2% 16255 16420 16171 16171 14596 14596
Emigration -2% 15929 16091 15847 15847 14304 14304
Private? -1% 15769 15930 15688 15688 14160 14160
E4 Baseline assumptions are conservative – Grade 6/Grade 7 transfer Attachment D1 is 92%, there is no accurate measure of “drop-out”, and emigration may exceed 2% per annum. Better information about private schools will contribute to better planning for secondary education in Georgetown.
E5 The high assumptions assume zero emigration and only 1% drop-out. These result in 18,600 enrolled in 2007, and 16,700 by 2011, which represents almost 93% of the cohort.
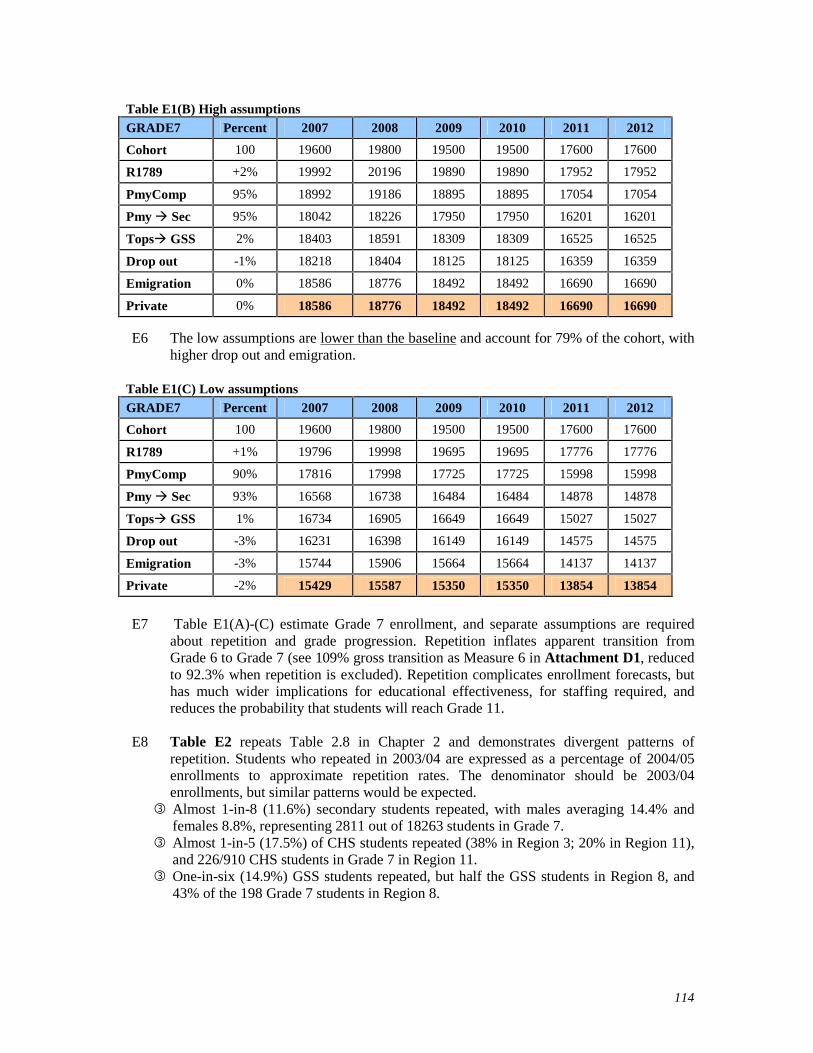
114
Table E1(B) High assumptions GRADE7 Percent 2007 2008 2009 2010 2011 2012
Cohort 100 19600 19800 19500 19500 17600 17600
R1789 +2% 19992 20196 19890 19890 17952 17952
PmyComp 95% 18992 19186 18895 18895 17054 17054
Pmy Æ Sec 95% 18042 18226 17950 17950 16201 16201
TopsÆ GSS 2% 18403 18591 18309 18309 16525 16525
Drop out -1% 18218 18404 18125 18125 16359 16359
Emigration 0% 18586 18776 18492 18492 16690 16690
Private 0% 18586 18776 18492 18492 16690 16690
E6 The low assumptions are lower than the baselineand account for 79% of the cohort, with higher drop out and emigration.
Table E1(C) Low assumptions GRADE7 Percent 2007 2008 2009 2010 2011 2012
Cohort 100 19600 19800 19500 19500 17600 17600
R1789 +1% 19796 19998 19695 19695 17776 17776
PmyComp 90% 17816 17998 17725 17725 15998 15998
Pmy Æ Sec 93% 16568 16738 16484 16484 14878 14878
TopsÆ GSS 1% 16734 16905 16649 16649 15027 15027
Drop out -3% 16231 16398 16149 16149 14575 14575
Emigration -3% 15744 15906 15664 15664 14137 14137
Private -2% 15429 15587 15350 15350 13854 13854
E7 Table E1(A)-(C) estimate Grade 7 enrollment, and separate assumptions are required about repetition and grade progression. Repetition inflates apparent transition from Grade 6 to Grade 7 (see 109% gross transition as Measure 6 in Attachment D1, reduced to 92.3% when repetition is excluded). Repetition complicates enrollment forecasts, but has much wider implications for educational effectiveness, for staffing required, and reduces the probability that students will reach Grade 11.
E8 Table E2 repeats Table 2.8 in Chapter 2 and demonstrates divergent patterns of
repetition. Students who repeated in 2003/04 are expressed as a percentage of 2004/05 enrollments to approximate repetition rates. The denominator should be 2003/04 enrollments, but similar patterns would be expected.
� Almost 1-in-8 (11.6%) secondary students repeated, with males averaging 14.4% and females 8.8%, representing 2811 out of 18263 students in Grade 7.
� Almost 1-in-5 (17.5%) of CHS students repeated (38% in Region 3; 20% in Region 11), and 226/910 CHS students in Grade 7 in Region 11.
� One-in-six (14.9%) GSS students repeated, but half the GSS students in Region 8, and 43% of the 198 Grade 7 students in Region 8.

115
Table E2 Secondary Grade Repetition Rates by Region R01 R07 R08 R09 R02 R05 R06 R10 R03 R04 R011 TOTAL R1789 R2560 R34110.20 0.03 0.43 0.12 0.09 0.09 0.10 0.15 0.18 0.08 0.24 0.15 17.6% 10.3% 18.3%0.22 0.00 0.21 0.09 0.04 0.05 0.11 0.09 0.11 0.09 0.18 0.12 12.4% 8.0% 14.2%0.16 0.01 0.04 0.16 0.03 0.05 0.12 0.07 0.11 0.10 0.17 0.12 10.7% 8.3% 13.9%0.18 0.00 0.14 0.07 0.03 0.13 0.14 0.06 0.11 0.14 0.13 0.11 8.4% 9.9% 12.5%0.06 0.02 0.00 0.04 0.00 0.01 0.04 0.00 0.03 0.01 0.01 0.02 3.1% 1.9% 1.5%0.17 0.01 0.18 0.09 0.03 0.06 0.08 0.05 0.09 0.07 0.12 8.8% 10.4% 6.3% 10.2%0.21 0.02 0.31 0.13 0.05 0.08 0.13 0.12 0.16 0.11 0.21 14.4% 14.9% 10.4% 17.0%0.22 0.03 0.16 0.10 0.11 0.03 0.01 0.02 0.00 0.03 0.00 6.8% 14.4% 3.9% 1.8%
0.38 0.07 0.20 17.5% 20.4%0.23 0.01 0.51 0.13 0.06 0.09 0.12 0.15 0.07 0.16 0.22 14.9% 17.3% 11.0% 17.8%
PTOPCHSGSS
%R10%R11
FemaleMale
2004/5%R07%R08%R09
Source: MOE Education Digest 2004/05
E9 Projected Enrollments: Tables E3(A)-(C) take the projected Grade 7 enrollments in the baseline, high and low assumptions in Tables 2.11(A)-(C). Constant grade progression is assumed to illustrate the impact through to Grade 11. Different rates could be included in the models. The total secondary enrollment would decline to around 61,500 by 2012 (baseline). Two columns are added to each projection – the Grade11/Grade7 ratio approximates Measure 13 in Attachment D1, with approximately 74% survival to Grade 11 by 2012. This is not the 75% USE objective, because Grade 11/Grade 6 graduates would be only 65%.
Table E3A Baseline Projection assuming 90% grade progression
0.90 Grade7 Grade8 Grade9 Grade10 Grade11 TOTAL G11/G7 G11/G6Z
2007 15769 14192 12773 11496 10346 64,576 65.6% 58.0%
2008 15930 14192 12773 11496 10346 64,737 64.9% 57.4%
2009 15688 14337 12773 11496 10346 64,640 65.9% 58.3%
2010 15688 14119 12903 11496 10346 64,552 65.9% 58.3%
2011 14160 14119 12707 11613 10346 62,945 73.1% 64.6%
2012 14160 12744 12707 11437 10452 61,500 73.8% 65.3%
Table E3B High Projection assuming 93% grade progression 0.93 Grade7 Grade8 Grade9 Grade10 Grade11 TOTAL G11/G7 G11/G6Z
2007 18992 17663 16426 15276 14207 82,564 74.8% 74.8%
2008 19186 17663 16426 15276 14207 82,758 74.0% 74.0%
2009 18895 17843 16426 15276 14207 82,648 75.2% 75.2%
2010 18895 17572 16594 15276 14207 82,545 75.2% 75.2%
2011 17054 17572 16342 15432 14207 80,608 83.3% 83.3%
2012 17054 15860 16342 15198 14352 78,807 84.2% 84.2%
E10 These projections assume reduced repetition but higher grade progression rates. Table E3B is close to the level required to achieve USE, with “repeating” students in existing enrollments being replaced by successful progression to the next grade, and all students in public secondary schools. This is not a USE planning target. Table EC is the low projection scenario, with approximately 15% attrition each year. The Grade 7 intakes assume 3% emigration per annum and 2% enrollment in private schools.

116
Table E3C Low Projection assuming 85% grade progression 0.85 Grade7 Grade8 Grade9 Grade10 Grade11 TOTAL G11/G7 G11/G6Z
2007 15429 13115 11147 9475 8054 57,220 52.2% 45.2%
2008 15587 13115 11147 9475 8054 57,378 51.7% 44.7%
2009 15350 13249 11147 9475 8054 57,276 52.5% 45.4%
2010 15350 13048 11262 9475 8054 57,188 52.5% 45.4%
2011 13854 13048 11090 9572 8054 55,618 58.1% 50.3%
2012 13854 11776 11090 9427 8137 54,284 58.7% 50.9%
E11 These three projections are summarized in Figure E1. Under the baseline assumptions, Grade 7 intakes are stable around 15,000 per annum with Grade 11 enrollment around 10,000. The high scenario assumes significant improvement in the number and quality of Grade 6 graduates, leading to both reduced repetition and higher grade progression rates. The low scenario has the same starting point as the baseline, but more pessimistic assumptions about students completing Grade 11.
Figure E1
Grade Projections 2007-2012
Baseline
High
Low
0
5000
10000
15000
20000
25000
2007
2008
2009
2010
2011
2012
0.93
2007
2008
2009
2010
2011
2012
0.85
2007
2008
2009
2010
2011
2012
Grade7 Grade8 Grade9 Grade10 Grade11
E12 USE 2008-2012 projections could build in assumptions about repetition ranging from 8-12% but this would be a strategic error for Ministry planning. USE strategic planning should examine ways to reduce repetition to less than 5%, saving student places, making better use of available trained teachers, and increasing the chances of more students completing secondary schooling to Grade 11. As discussed in the Overview and Chapter 1, secondary repetition should be rare if most students complete primary grades with the necessary language and math competencies. Upgrading qualifications and skills of existing teachers (Chapter 3) are thus an important step towards achieving competencies and reducing repetition.

117
Teacher Supply and Demand
E13 Six elements were considered in estimating the supply of and demand for teachers.
(1) Projected student enrollments identified as a range of projected Grade 7 enrollments (Tables E1A-E1C), assumptions about Grade repetition (Table E2) and projected enrollments ranging from as low as 55,000 (Table E3C) to in excess of 80,000 (Table E3B). There is no most likely projection but 70,000-75,000 would be a prudent planning range. Improved access and participation flowing from Fast Track Initiative activities in Hinterland regions, absorbing Primary Tops into the new Diamond GSS (Region 4), and conversion of CHS to GSS suggest higher enrollment, but there could be offset effects if repetition rates are reduced.
(2) Teacher Attrition/Loss rates: Chapter 3 examined 2004/05 teacher attrition. The apparent attrition rate of one percent may not be typical, and analysis of several years data is recommended.
Table E4A Positive Attrition Assumptions
POSITIVE 5% loss
Trained Recruit Gain/ Loss
Graduate -16 20 20 24 Qualified -74 80 80 86 TRAINED -92 100 100 108 Graduate -9 -20 5 -24 Qualified -56 -60 20 -96 UnQualified -10 -20 0 -30 UNTRAINED -80 -100 25 -155
Table E4A assumes uniform 5% loss per annum, 100 current teachers certified as “trained” annually and 125 new teachers are recruited. Most new teachers are “trained”.
The result is a net loss of 47 teachers (1.4%) per annum.
TEACHERS -172 0 125 -47
Table E4B Negative Attrition: A more pessimistic scenario assumes 10% attrition per annum, few existing teachers are certified as “trained” and that fewer new teachers are recruited annually. Net attrition of 264 teachers or 7.8% per annum is the result. “Untrained” teachers are still lost at a greater rate. Variations of these two models can be tested.
(3) Retraining of untrained teachers has been recommended as a critical USE strategy to improve the quality of teaching (in primary as well as secondary schools) so that student learning outcomes are improved. It is assumed that Guyana adopts a program which gives “untrained” classroom teachers credit for in-service professional development, summer schools, and external courses provided through CPCE or the University of Guyana. By definition, the increase in “trained teachers” is offset by a reduction in the number of “untrained teachers”.
(4) Recruitment of trained teachers is another USE strategy to improve quality by reducing the numbers of untrained secondary teachers in the system. The first model
NEGATIVE 10% loss
Trained Recruit Gain/ Loss
Graduate -31 10 10 -11 Qualified -148 40 40 -68 TRAINED -184 50 50 -84 Graduate -17 -10 10 -17 Qualified -111 -30 20 -121 UnQualified -19 -10 0 -29 UNTRAINED -159 -50 30 -179 TEACHERS -344 0 80 -264

118
assumes that 80% of new recruits are trained and qualified teachers, and the second model assumes 62.5% (50/80) are trained and qualified. Both models allow limited recruitment of untrained teachers – to accommodate situations where no trained teachers are available.
(5) Table E5A shows the combined effect of the above attrition and recruitment assumptions on provision of around 3,200 teachers, with a dramatic increase in the proportion of trained teachers from a current level around 55% to almost 80% by 2011/12 (see Figure E2).
Table E5A: Projected Impact of Positive/Low Attrition Assumptions 2001/02 2002/03 2003/04 2004/05 2005/06 2006/07 2007/08 2008/09 2009/10 2010/11 2011/12
Graduate 353 312 336 360 384 408 432 456
Qualified 1435 1484 1570 1656 1742 1828 1914 2000
TRAINED 1937 2001 1898 1790 1844 1952 2060 2168 2276 2384 2492
Graduate 152 174 150 126 102 78 54 30
Qualified 1171 1113 1017 921 825 729 633 537
UnQualified 281 194 164 134 104 74 44 14
UNTRAINED 1671 1727 1703 1605 1593 1438 1283 1128 973 818 663
Teachers 3608 3728 3601 3395 3437 3390 3343 3296 3249 3202 3155
%Trained 53.7% 53.7% 52.7% 52.7% 53.7% 57.6% 61.6% 65.8% 70.1% 74.5% 79.0% Source: MOE data 2000/01-2005/06 (discrepancy). Tchr_Supply.XLS
Figure E2
PROJECTED TEACHER SUPPLY: 2006-2012
34373155
0
500
1000
1500
2000
2500
3000
3500
4000
4500
5000
2001
/02
2002
/03
2003
/04
2004
/05
2005
/06
2006
/07
2007
/08
2008
/09
2009
/10
2010
/11
2011
/12
0%
10%
20%
30%
40%
50%
60%
70%
80%
90%
100%
TRAINED UNTRAINED Teachers %Trained
Source: Tchr_Supply.XLS
(6) Table E5B shows the impact of Negative/high attrition assumptions in Table E4B. The percentage “trained” continues to increase – because the untrained teachers are lost at a greater rate. This may be unrealistic.

119
Table E5B: Projected Impact of Negative/High Attrition Assumptions
2005/06 2006/07 2007/08 2008/09 2009/10 2010/11 2011/12
Graduate 312 301 290 279 268 257 246 Qualified 1484 1416 1348 1280 1212 1144 1076
TRAINED 1844 1760 1676 1592 1508 1424 1340 Graduate 174 157 140 123 106 89 72 Qualified 1113 992 871 750 629 508 387 UnQualified 194 165 136 107 78 49 20
UNTRAINED 1593 1414 1235 1056 877 698 519
Teachers 3437 3173 2909 2645 2381 2117 1853
%Trained 53.7% 55.5% 57.6% 60.2% 63.3% 67.3% 72.3% Source: MOE data 2000/01-2005/06 (discrepancy). Tchr_Supply.XLS
(7) Staffing allocation formulae: Just as high student repetition rates can affect demand for teachers, how efficiently teachers are used has a large effect on the demand. Improving staffing efficiency through more students in GSS allowing larger average class size and improved student/teacher ratios is both a better educational objective of USE and more efficient use of available trained staff. Table E6 shows how the existing supply of about 3,400 teachers could serve a wide range of student enrollments – by improving STR rather than employing more teachers.
Table E6 Teachers required at given STR
STR > 20 23 25 27 30 Students current unlikely
60,000 3,000 2,609 2,400 2,222 2,000 65,000 3,250 2,826 2,600 2,407 2,167 70,000 3,500 3,043 2,800 2,593 2,333 75,000 3,750 3,261 3,000 2,778 2,500 80,000 4,000 3,478 3,200 2,963 2,667
85,000 4,250 3,696 3,400 3,148 2,833
nnn (shaded cell) represents approximate teacher supply Source: Tchr_Supply.XLS
(8) The strategic recommendation for USE would be meet any increased enrollment
in Chapter 2 by improving STRs. Any short term costs in training “untrained” teachers (through an in-service rather than pre-service or full-time training model) should be offset by improved student and teacher attendance and a larger effective class size. USE strategies to upgrade CHS (with appropriate qualified staffing) and convert Primary Tops to GSS (where feasible) should lead to more efficient use of existing teachers.
(9) Expected mix of school types: The success of current USE strategies also affects mean school size. Note that in Table E7 that most CHS are converted to GSS and a large number of Primary Tops persist (but their mean size increases from 43 to 60 students, with specialist teaching staff).

120
Table E7 Schools required at Mean Enrollment
Mean Size 198 229 255 288 336
Students current unlikely
60,000 303 262 235 208 179 65,000 328 284 255 226 193 70,000 354 306 275 243 208 75,000 379 328 294 260 223 80,000 404 349 314 278 238 85,000 429 371 333 295 253 TYPE Changing School Type Mix
PmyTops 232 200 180 160 140 CHS 24 20 15 10 5GSS 82 90 95 100 105
TOTAL 338 310 290 270 250 N (shaded cell) approximates the number of secondary schools in bottom of table.
Source: Tchr_Supply.xls
E14 Managing existing and future staffing is shown in Chapter 3 to be central to achieving USE objectives. In Chapter 4 it is also central to better learning outcomes.

121
Attachment F: Teachers by Status and by Region Table F1: Secondary Teachers 2005/06 by Status and by Region
Status Master=Mistress
meanAGE Teachers 01 02 03 04 05 06 07 08 09 10 11
Headmaster 49 119 7 9 17 16 7 10 3 3 14 10 23Deputy Headmaster 49 67 4 8 10 9 13 5 18Head of Department 40 401 3 49 53 41 26 67 3 1 4 34 120Senior Master 42 210 2 17 20 27 16 33 5 1 1 13 75Senior Assistant Master 40 76 1 7 14 12 6 7 9 20Assistant Master 29 916 33 86 103 123 63 128 36 4 14 107 219Teacher Aide (trained) 42 1 1Temp. Qualified Master 22 1 1Temp. Assistant Master 53 15 1 1 1 12
Assistant Master 32 1 1Head of Department (a) 34 3 3Temp. Assistant Master 43 3 3Temp. Qualified Master 26 578 11 28 68 65 49 106 1 2 12 34 202Untrained Graduate 33 149 1 3 9 14 3 18 1 10 90Temp. Unqualified Master 26 301 14 22 33 44 22 52 2 12 24 76Acting Teacher 33 331 15 23 30 53 34 12 10 12 23 41 78Part Time Teacher 44 10 2 2 6Junior Teacher 26 7 7Pupil Teacher 19 79 3 3 10 6 13 26 5 2 7 1 3Teacher Aide 35 28 13 12 3
Teacher-in-charge 28 1 1
Secondary Teachers 3297 104 253 365 414 250 472 63 39 90 288 959
Trained (A1-B3) 1806 47 172 215 232 128 258 47 9 33 178 487Untrained (B4-C3) 1491 57 81 150 182 122 214 16 30 57 110 472
Percentage trained 54.8% 45% 68% 59% 56% 51% 55% 75% 23% 37% 62% 51%
Source: MOE statistical data for 3297 Secondary teachers in 2005/06. (STeach_StatusRegion_b.sql) (Teachers.XLS) Data for 3,297 teachers is 140 fewer than the 3,437 in the draft 2005/06 Statistical Digest.

122
TABLE F2: Teacher Data by Age, Region, School Type and Main Teaching Subject Number of Teachers by Age in 5-year groups
Region Prof Status
MeanAge
Number; percentage ns 16 21 26 31 36 41 46 51 56 61+
1789 MBD 41 10 3% 1 3 3 1 2
1789 TTC 33 126 43% 9 1 26 26 15 11 8 15 14 1
1789 UNO 20 82 28% 14 35 16 8 2 3 2 2
1789 Unt 31 78 26% 3 3 25 14 8 10 5 4 4 2
2560 MBD 34 60 5% 10 9 10 5 5 14 4 2 1
2560 TTC 32 676 54% 53 7 108 155 111 55 52 76 53 4 2
2560 UNO 23 453 36% 40 114 159 75 22 5 12 13 10 2 1
2560 Unt 30 74 6% 4 18 24 8 6 7 4 3
3411 MBD 41 150 9% 7 12 21 20 23 35 26 4 2
3411 TTC 33 784 45% 43 7 122 210 110 53 72 79 77 7 4
3411 UNO 26 733 42% 67 82 242 153 73 36 23 22 25 6 4
3411 Unt 34 71 4% 8 25 13 9 6 5 2 1 2 3297 250 249 724 712 396 213 218 270 220 29 16
TYPE
CH MBD 44 35 7% 1 2 3 2 6 11 7 2 1
CH TTC 35 192 41% 6 1 29 47 24 14 17 26 24 3 1
CH UNO 26 199 43% 14 18 86 37 17 6 3 3 11 2 2
CH Unt 33 42 9% 2 4 15 6 5 3 4 1 2
PR MBD 42 6 1% 1 1 2 1 1
PR TTC 38 192 42% 8 9 32 35 14 25 35 30 2 2
PR UNO 24 157 34% 17 38 50 25 7 4 7 6 1 1 1
PR Unt 30 101 22% 4 3 26 27 14 12 6 5 3 1
SE MBD 38 179 8% 16 19 30 23 23 38 24 4 2
SE TTC 31 1202 51% 91 14 218 312 177 91 90 109 90 7 3
SE UNO 25 912 38% 90 175 281 174 73 34 27 28 23 5 2
SE Unt 33 80 3% 1 21 21 9 8 9 4 5 23297 250 249 724 712 396 213 218 270 220 29 16
Subject
12ENG MBD 43 44 9% 2 2 5 5 6 14 8 2
12ENG TTC 34 261 56% 12 4 45 61 28 23 29 23 32 2 2
12ENG UNO 24 149 32% 10 36 56 20 9 6 2 3 7
12ENG Unt 37 10 2% 2 1 1 2 2 1 1
12MATH MBD 44 29 7% 3 4 7 8 5 2
12MATH TTC 34 228 55% 10 1 38 63 32 18 15 23 26 2
12MATH UNO 25 146 35% 8 32 48 26 17 5 5 3 2
12MATH Unt 27 9 2% 4 3 2
3Subjects MBD 38 96 7% 8 13 15 15 14 15 14 2
3Subjects TTC 33 697 51% 37 7 111 180 116 52 59 80 50 5
3Subjects UNO 27 509 37% 32 83 157 111 39 14 23 22 19 5 4
3Subjects Unt 32 75 5% 1 18 25 10 7 7 3 3 1
8Other MBD 37 51 5% 7 4 10 5 4 13 5 2 1
8Other TTC 31 400 38% 46 3 62 87 60 26 29 44 36 3 4
8Other UNO 22 464 44% 71 80 156 79 32 19 7 9 7 3 1
8Other Unt 32 129 12% 6 3 27 34 16 16 9 9 5 3 1 3297 250 249 724 712 396 213 218 270 220 29 16
Source: MOE Statistics (Tch56_x005.xls)

123
TABLE F3: Teacher Flows Data by School Type and Gender
Type 1PTop 1PTop 2CHS 2CHS 3GSS 3GSS Gender F M F M F M TOTAL
Schools 121 12 41 174TGT Trained Graduate 11 4 35 7 182 73 312TGU Graduate untrained 1 2 7 2 103 59 174TQT Trained Qualified 123 77 136 43 774 331 1484TQU Qualified untrained 93 66 138 52 484 280 1113TUN Unqualified Teacher 61 34 36 4 42 17 194Teachers 2005 289 183 353 108 1585 760 3278
TGradGrad New/Re-employed 1 0 0 0 2 1 4Grad Transfer (in) 7 4 8 1 32 7 59
TQual Qual New/Re-employed 2 0 1 0 9 3 15Quak Transfer (in) 26 11 16 1 66 35 155
TUN Untrained Teachers 41 24 13 10 131 73 292Teacher INFLOW 77 39 38 12 240 119 525TGrad Losses 0 0 0 0 5 2 7
Transfer (or not stated) 2 2 3 2 39 12 60TQual Losses 0 3 2 0 8 13 26
Transfer (or not stated) 10 18 13 13 100 44 198TUN Untrained Teachers 32 15 20 9 90 89 255Teacher OUTFLOW 44 38 38 24 242 160 546Teachers 2004 236 173 353 120 1567 788 3237Net Change Graduates 6 2 5 -1 -10 -6 -4Net Change Qualified Teachers 18 -10 2 -12 -33 -19 -54Net Change Unqualified 9 9 -7 1 41 -16 37Net Change 2004/2005 33 1 0 -12 -2 -41 -21
TCH05_003TRF.sql Caution: data covers only 174 schools (41/84 GSS)
TABLE F4: Teacher Flows Data by Region (Zone) and School Type
ZONE R1789 R2560 R3411 Guyana Type 1PTop 2CHS 3GSS 1PTop 2CHS 3GSS 1PTop 2CHS 3GSS 2005/06
Schools 114 1 9 75 5 32 53 18 41 348Mean Enrol 29 287 394 47 254 647 61 418 569 Grad/Trained 2 0 9 3 2 90 10 40 156 312Grad/Untrain 1 1 1 0 0 40 2 8 121 174Qual/Trained 47 2 76 78 37 518 75 140 511 1484Qual/Untrain 32 1 46 69 27 322 58 162 396 1113Unqualified 62 0 14 22 5 28 11 35 17 194Males 2005/06 84 2 67 52 26 334 47 80 359 1051Females 05/06 60 2 79 120 46 664 109 305 842 2227NewGradTrain 0 0 0 0 0 1 0 2 3NewGrad/Unt 0 0 0 0 9 2 1 4 16NewQualTrain 1 0 0 0 6 1 1 6 15NewQualUnt 3 16 9 5 63 6 5 40 147NewUnqualified 5 1 0 0 0 2 0 0 8

124
RempGradTrain 0 0 0 0 1 0 0 0 1RempGrad/Unt 0 0 0 0 1 0 0 0 1RempQualTrain 0 0 0 0 0 0 0 0 0RempQual/Unt 0 0 0 0 0 0 0 0 0RempUnqualified 0 0 0 0 0 0 0 0 0TransferGradT 2 1 3 1 14 6 8 24 59TransfGrad/Unt 0 0 0 0 2 0 3 9 14TransfQualTrain 6 5 10 2 43 21 15 53 155TransfQual/Unt 6 1 5 1 10 16 7 48 94Transf/Unqualif 8 0 3 0 0 0 1 0 12
Inflow Males 12 0 10 7 4 56 20 8 53 170Inflow Females 19 0 14 23 5 93 35 33 133 355ResignGradTrain 0 0 0 0 3 0 0 1 4ResignGrad/Unt 0 0 0 0 1 1 0 1 3ResignQualTrain 0 0 0 1 10 0 0 2 13ResignQual/Unt 0 0 0 2 22 0 1 11 36ResignUnqual 0 0 1 0 2 0 0 0 3RetireGradTrain 0 0 0 0 0 0 0 3 3RetireGrad/Unt 0 0 0 0 0 0 0 0 0RetireQualTrain 1 0 0 1 7 1 0 1 11RetireQual/Unt 0 0 0 1 0 0 0 1 2RetireUnqualif 0 0 0 0 0 0 0 0 0DismGradTrain 0 0 0 0 0 0 0 0 0DismGrad/Unt 0 0 0 0 0 0 0 0 0DismQualTrain 0 1 1 0 0 0 0 0 2DismQual/Unt 0 1 0 0 1 0 0 0 2DismUnqualified 0 1 0 0 0 0 0 0 1TransfGradTrain 0 0 0 0 4 0 1 4 9TransfGrad/Unt 0 0 0 0 1 0 0 1 2TransfQualTrain 2 5 5 0 25 3 4 7 51TransfQual/Unt 3 0 5 0 14 1 2 1 26Transf/Unqualif 6 1 1 0 3 0 0 0 11OtherGradTrain 0 0 0 1 10 4 3 33 51OtherGrad/Unt 0 0 0 1 5 0 1 13 20OtherQualTrain 9 5 2 4 44 7 18 58 147OtherQual/Unt 7 6 1 3 36 5 10 38 106OtherUnqualified 11 3 2 0 6 3 8 10 43
Losses Males 24 0 11 7 7 83 7 17 66 222Losses Females 15 0 12 11 7 111 18 31 119 324Males 2005/06 83 2 67 44 26 320 47 80 360 1029Females 05/06 61 2 79 99 46 645 109 305 841 2187Males 2004/05 95 2 68 44 29 347 34 89 373 1081Females 04/05 57 2 77 87 48 663 92 303 827 2156Source: MOE data (GY0506S_2008Zone.sql)

125
Attachment G: Education Finance
G1A: GUYANA EDUCATION BUDGET: BY REGION AND BY LINE ITEM. 2005, 2006, and Budget 2007 G$000
LineItem
Region01
Region02
Region03
Region04
Region05
Region06
Region07
Region08
Region09
Region10
Region11
Year 2005G$000
6111 36,517 106,305 239,444 198,262 112,242 93,532 24,007 8,748 33,160 143,704 266,043 1,261,9646112 35,935 179,375 228,378 351,289 157,432 365,601 68,915 9,481 38,910 184,811 689,335 2,309,4626113 1,132 49,173 103,847 145,889 70,359 149,950 19,159 6,872 25,484 75,379 205,477 852,7216114 582 4,620 3,045 2,911 1,523 5,155 326 608 1,310 3,586 26,863 50,5296115 87,126 26,728 78,559 80,698 49,832 76,287 30,331 20,313 52,080 52,750 101,697 656,4016116 0 681 0 0 0 0 0 1,016 0 0 3,918 5,6156117 655 35,519 0 0 0 0 0 0 120 276 40,454 77,0246131 1,749 9,793 6,914 11,914 2,708 11,353 2,785 861 2,490 4,000 28,324 82,8916132 0 0 0 0 0 0 0 0 0 0 0 06133 29,043 17,738 15,399 14,420 6,284 14,430 18,719 8,459 23,450 59,121 22,705 229,7686134 12,060 28,770 48,866 62,403 30,205 53,973 10,928 3,521 11,520 33,288 99,059 394,5936221 1,350 1,625 968 991 211 641 484 105 320 750 962 8,4076222 8,000 8,505 5,307 15,934 4,880 6,704 5,360 1,600 3,518 16,400 35,902 112,1106223 5,973 7,874 4,597 4,596 1,182 4,010 3,705 671 1,986 6,000 10,771 51,3656224 5,900 6,785 5,596 6,084 3,265 5,607 3,000 980 1,828 4,300 17,446 60,7916231 13,575 1,604 269 839 418 213 13,089 900 5,090 1,825 1,274 39,0966241 700 0 204 2,255 120 1,536 300 0 0 780 5,588 11,4836242 17,000 7,584 21,504 29,642 22,206 17,298 15,198 12,440 14,700 32,350 129,247 319,1696243 2,200 750 725 1,369 2,258 1,709 529 272 729 3,404 7,499 21,4446252 500 0 27 4,916 0 0 0 0 0 0 0 5,4436255 1,600 2,600 10,067 7,632 1,500 2,025 9,039 5,170 3,790 13,200 39,878 96,5016261 9,865 3,117 4,292 2,310 946 2,191 2,783 1,400 3,473 1,900 4,712 36,9896262 0 0 0 0 0 0 0 0 0 0 0 06263 100 20 15 0 2 0 0 80 182 0 99 4986264 2,124 190 392 113 497 348 569 0 1,097 1,349 2,090 8,7696265 8,182 100 0 858 62 158 7,877 4,125 770 1,000 0 23,1326271 360 1,399 509 711 233 700 755 0 220 950 3,344 9,1816272 0 12,499 6,970 8,200 4,785 23,000 4,984 60 1,624 1,680 40,939 104,7416273 0 2,274 4,010 2,087 1,383 2,500 209 0 0 1,666 12,311 26,4406281 12,858 27,858 38,941 106,833 5,252 77,986 6,429 852 1,135 50,038 121,478 449,6606282 200 239 1,006 189 264 890 297 490 318 1,000 6,152 11,0456283 396 350 1,894 5,411 1,173 555 263 0 135 2,671 13,190 26,0386284 1,544 1,470 5,408 3,983 4,728 6,157 5,539 300 1,290 2,240 4,401 37,0606291 5,426 1,300 2,526 2,796 2,187 2,055 2,885 920 1,050 2,400 6,025 29,570

126
6292 14,407 8,819 0 50 0 0 40,302 18,500 9,452 3,817 889 96,2366293 544 598 1,730 1,971 618 35 610 275 220 1,125 637 8,3636294 145 60 309 3,466 378 43 448 0 50 2,322 88 7,3096301 0 0 0 0 0 0 0 0 0 0 964,708 964,7086302 3,323 3,250 1,536 0 1,762 2,800 1,202 1,000 350 1,300 17,180 33,7036321 0 0 0 486 0 0 0 0 0 0 0 4866322 0 0 0 0 0 0 0 0 0 0 0Total 321,071 559,572 843,254 1,081,508 490,895 929,442 301,026 110,019 241,851 711,382 2,930,685 8,520,705
Source: BUDGET567.xls. Line item 6301 is subvention to Presidents College (Region 4) and Queens College (Region 11/Georgetown); Discrepancy in Region 2 ignored.
G1B: GUYANA EDUCATION BUDGET: BY REGION AND BY LINE ITEM, 2006, G$000
LineItem
Region01
Region02
Region03
Region04
Region05
Region06
Region07
Region08
Region09
Region10
Region11
2006 outcomeG$000
6111 40,760 127,789 253,992 222,542 130,382 114,246 27,541 14,101 38,199 172,218 307,156 1,448,9266112 44,235 199,280 250,779 388,028 165,780 379,956 77,541 5,952 46,802 197,938 724,792 2,481,0836113 771 43,107 113,479 160,439 80,045 183,483 22,778 9,405 39,915 60,438 182,420 896,2806114 654 4,778 3,082 2,707 1,436 4,354 341 654 1,882 3,550 27,742 51,1806115 94,755 46,670 73,619 82,737 49,751 76,828 31,289 22,780 40,609 51,179 106,606 676,8236116 0 0 0 0 0 1,936 0 974 0 867 7,158 10,9356117 730 0 0 0 0 0 0 0 20 338 51,184 52,2726131 2,591 4,015 9,908 7,855 3,299 9,610 1,589 403 2,412 3,740 20,400 65,8226132 0 0 0 0 0 0 0 0 0 0 0 06133 32,368 18,537 14,305 21,241 10,640 14,527 24,730 7,983 32,327 56,383 24,263 257,3046134 13,557 31,489 51,924 68,434 31,965 58,297 12,077 4,237 12,203 35,442 102,115 421,7406221 1,370 1,705 1,019 50 220 673 518 180 350 773 1,103 7,9616222 8,600 8,529 5,949 14,907 5,506 7,498 5,608 1,999 2,800 16,450 41,545 119,3916223 6,500 7,969 6,058 1,530 1,241 5,000 3,830 700 2,083 5,971 11,492 52,3746224 6,050 6,900 6,098 5,099 3,427 5,999 3,200 1,479 1,649 4,386 22,600 66,8876231 12,700 1,883 330 1,950 350 510 14,897 2,550 5,800 1,463 1,500 43,9336241 770 0 1,247 2,095 120 1,999 360 0 0 461 6,500 13,5526242 17,700 19,199 33,647 41,497 29,316 42,238 19,299 14,000 20,100 35,000 153,441 425,4376243 2,275 788 749 973 2,370 1,849 629 400 765 2,868 8,492 22,1586252 600 0 237 2,873 0 0 0 0 0 0 0 3,7106255 1,680 3,140 11,512 8,124 1,649 5,900 9,413 4,848 3,900 7,736 18,000 75,9026261 8,336 3,272 4,251 3,104 965 2,299 3,338 1,629 3,850 2,114 3,479 36,6376262 0 0 0 0 0 0 0 0 0 0 0 06263 105 21 20 0 29 0 0 100 210 0 134 6196264 1,910 199 515 161 873 400 500 0 1,340 1,400 3,600 10,898

127
6265 3,270 105 0 855 66 180 6,324 4,460 825 1,499 0 17,5846271 451 1,470 700 750 347 900 740 0 250 760 4,099 10,4676272 0 13,124 8,059 8,300 5,024 30,346 6,900 0 1,350 1,680 43,000 117,7836273 0 2,389 4,500 2,898 2,194 3,680 410 0 0 1,522 23,100 40,6936281 14,759 29,437 49,494 122,730 5,645 85,135 7,379 975 1,235 49,597 127,077 493,4636282 225 252 1,224 467 275 945 548 340 375 1,080 11,049 16,7806283 267 368 2,148 4,015 1,793 625 851 0 100 1,836 13,648 25,6516284 478 15,528 7,315 13,887 16,344 25,773 5,355 1,082 5,250 8,966 5,763 105,7416291 3,450 1,364 4,039 3,234 3,096 4,197 2,645 920 1,100 2,520 9,698 36,2636292 11,300 9,545 0 0 3,551 97 41,408 18,911 11,080 9,225 970 106,0876293 575 627 1,422 2,460 653 58 580 285 230 925 698 8,5136294 150 63 79 3,791 397 200 175 0 52 2,024 1,113 8,0446301 0 0 0 0 0 0 0 0 0 0 999,746 999,7466302 2,904 3,112 1,278 0 1,848 3,117 1,590 1,010 490 1,251 15,736 32,3366321 0 0 0 345 0 0 0 0 0 0 0 3456322 0 0 0 0 0 0 0 0 0 0 0Total 336,846 606,654 922,978 1,200,078 560,597 1,072,855 334,383 122,357 279,553 743,600 3,081,419 9,261,320
G1C: GUYANA EDUCATION BUDGET: BY REGION AND BY LINE ITEM, 2007 BUDGET, G$000LineItem
Region01
Region02
Region03
Region04
Region05
Region06
Region07
Region08
Region09
Region10
Region11
2007 BudgetG$000
6111 46,975 135,014 294,226 258,505 154,937 127,661 32,771 15,916 42,339 184,984 333,365 1,626,6936112 61,659 201,880 253,469 432,593 172,937 424,984 79,446 9,020 51,041 214,264 812,073 2,713,3666113 0 42,126 130,242 179,058 93,198 210,039 35,349 13,981 44,459 59,626 189,958 998,0366114 654 4,344 3,244 2,843 1,508 4,637 341 1,071 2,115 3,724 28,852 53,3336115 97,410 49,157 75,092 86,908 55,399 83,381 23,433 27,851 43,152 53,922 109,857 705,5626116 0 0 0 0 0 2,654 0 1,017 0 2,161 7,444 13,2766117 732 0 0 0 0 0 0 0 21 342 53,242 54,3376131 1,766 4,177 10,426 8,250 3,662 12,342 5,676 686 2,567 5,122 21,420 76,0946132 0 0 0 0 0 0 0 0 0 0 0 06133 61,349 25,000 20,560 29,453 14,385 27,677 30,003 11,983 40,616 73,211 36,353 370,5906134 17,194 32,634 58,800 71,875 35,443 62,468 11,990 5,293 13,969 36,696 105,382 451,7446221 1,452 1,756 1,200 500 250 700 550 200 380 820 1,230 9,0386222 8,650 9,745 6,400 15,000 5,500 8,000 5,900 2,100 3,740 17,500 44,520 127,0556223 6,900 8,200 6,560 2,900 1,320 5,500 4,000 800 2,210 6,140 12,090 56,6206224 6,200 7,400 6,480 5,100 3,700 7,000 3,400 1,700 2,100 4,700 24,954 72,7346231 12,200 2,000 420 950 350 600 15,800 1,180 6,000 1,623 1,600 42,7236241 800 0 1,524 2,780 400 3,600 500 0 0 768 6,500 16,872

128
6242 19,500 19,280 34,150 28,000 30,500 45,708 20,400 14,600 21,000 40,000 169,200 442,3386243 2,400 850 820 1,000 2,500 1,965 660 450 820 3,040 9,100 23,6056252 650 0 550 1,200 0 0 0 0 0 0 0 2,4006255 1,750 2,965 12,456 7,000 2,000 6,300 10,100 4,400 4,300 9,200 18,100 78,5716261 11,430 3,340 3,900 2,400 1,100 2,440 7,015 2,150 5,900 2,245 6,500 48,4206262 0 0 0 0 0 0 0 0 0 0 0 06263 117 25 22 15 35 0 9 120 258 0 150 7516264 2,000 240 500 180 555 430 500 0 1,300 1,485 3,780 10,9706265 3,700 110 0 920 475 200 6,700 4,500 900 770 0 18,2756271 470 1,570 1,980 780 368 1,060 1,010 300 310 820 4,400 13,0686272 0 17,900 8,718 8,800 6,531 32,346 5,076 1,000 2,000 1,850 45,500 129,7216273 0 3,715 4,854 2,900 2,733 4,000 283 0 0 1,720 24,100 44,3056281 14,759 29,448 53,610 125,622 6,268 84,160 8,709 1,552 2,500 50,003 127,078 503,7096282 225 280 1,400 755 295 1,000 580 550 400 1,120 15,150 21,7556283 284 390 2,400 4,400 1,690 700 1,150 0 160 2,188 17,867 31,2296284 500 14,040 22,427 13,008 18,112 29,680 5,910 2,500 10,276 8,750 2,369 127,5726291 3,700 1,450 4,000 3,200 2,440 2,900 2,200 1,000 1,166 2,700 7,750 32,5066292 13,900 10,510 0 175 5,820 4,200 47,702 26,000 12,515 12,347 1,333 134,5026293 600 640 1,800 2,285 700 65 650 300 230 930 885 9,0856294 170 75 350 4,030 400 210 480 0 52 2,250 240 8,2576301 0 0 0 0 0 0 0 0 0 0 1,007,871 1,007,8716302 6,268 3,113 1,500 0 1,850 3,310 6,491 1,200 11,116 1,300 21,000 57,1486321 0 0 0 900 0 0 0 0 0 0 0 9006322 0 0 0 0 0 0 0 0 0 0 09999 406,364 633,374 1,024,080 1,304,285 627,361 1,201,917 374,784 153,420 329,912 808,321 3,271,213 10,135,031

129
G2A: GUYANA EDUCATION BUDGET: BY REGION AND BY LINE ITEM. 2004, 2006 G$000
YEARR
EG
ION
SUB
PROG611Z
Salaries613Z
Oncosts 622Z 623Z624Z
Mainten-ance
625Z 626Z 627Z628Z
includesSecurity
629Zincludesboarding
630Zincludes
Subvention
2004 01 402N 15,746 3,713 1,575 625 3,450 150 2,122 0 30 350 6052004 01 403P 97,221 24,480 4,475 2,900 10,265 1,000 6,050 0 1,093 2,480 5942004 01 404S 19,988 4,698 1,500 400 1,737 0 1,475 0 47 493 8012004 02 402N 64,522 5,653 2,068 0 75 0 347 0 0 57 3242004 02 403P 197,311 23,992 5,222 0 170 0 884 0 27,858 140 3432004 02 404S 126,746 21,099 1,976 0 82 0 927 0 0 7,399 3202004 03 402N 122,689 10,159 829 0 5,877 953 367 1,082 9,912 0 02004 03 403P 290,704 30,546 1,602 0 8,054 4,383 2,416 3,781 1,970 0 02004 03 404S 194,073 18,813 723 0 2,896 3,786 577 2,804 1,677 0 02004 04 402N 190,189 19,769 4,352 0 7,835 754 607 1,985 24,632 901 1022004 04 403P 373,614 47,174 6,841 0 28,493 1,696 1,343 7,135 57,812 2,171 112004 04 404S 181,885 21,246 3,833 0 2,425 236 384 1,480 23,281 1,046 2212004 05 402N 64,379 5,572 140 0 3,992 0 89 989 1,213 108 842004 05 403P 194,148 19,587 1,300 164 13,756 0 586 1,219 1,234 391 4002004 05 404S 104,224 10,841 1,296 12 6,028 0 80 805 812 741 7482004 06 402N 136,678 11,204 1,771 6 1,866 767 257 0 6,727 310 2362004 06 403P 290,297 29,722 2,394 43 6,803 3,045 799 0 37,516 676 4272004 06 404S 211,026 25,328 2,453 211 7,713 996 363 0 26,940 983 4762004 07 402N 14,225 2,693 0 0 0 0 7 0 0 0 02004 07 403P 73,386 16,981 0 0 0 0 328 0 841 0 02004 07 404S 25,915 5,912 0 998 0 0 309 0 1,286 37,899 02004 08 402N 2,491 618 50 0 25 0 0 0 0 0 02004 08 403P 27,338 8,009 50 159 45 0 100 0 97 313 02004 08 404S 9,804 1,961 50 0 20 0 100 0 0 265 02004 09 402N 20,712 6,499 0 0 0 0 280 92 0 0 02004 09 403P 91,959 23,094 0 0 0 0 850 238 283 0 02004 09 404S 21,904 4,448 30 0 0 0 792 314 100 0 02004 10 402N 73,081 14,107 4,041 42 2,201 327 161 646 8,878 335 1172004 10 403P 214,807 44,706 5,031 150 10,262 6,413 1,061 1,459 17,358 292 2212004 10 404S 136,420 31,072 4,443 0 8,744 178 252 1,043 15,567 1,918 4412004 11 402N 183,470 15,987 4,563 0 35,401 9,155 195 7,427 26,656 209 4,2002004 11 403P 415,844 39,261 1,672 0 50,709 6,646 632 17,244 45,553 1,629 2,5632004 11 404S 584,760 59,776 9,519 0 75,975 17,400 1,540 19,472 54,594 1,767 231,1272004 99 402N 888,182 95,974 19,389 673 60,722 12,105 4,433 12,221 78,049 2,270 5,6672004 99 403P 2,266,629 307,549 28,588 3,416 128,557 23,183 15,049 31,076 191,614 8,091 4,5582004 99 404S 1,616,746 205,192 25,822 1,622 105,620 22,595 6,799 25,918 124,303 52,512 234,135
Item 6242 Maintenance Buildings may be reported in Administration Sub-Program (401A) not by Primary, Secondary etc.Primary Tops reported against Sub-Program 403P not 404S. Item 6301subvention to Presidents College (Region 4) and QueensCollege (Region 11/Georgetown)

130
YEARR
EG
ION
SUBPROG
611ZSalaries
613ZOncosts 622Z 623Z
624ZMainten-
ance625Z 626Z 627Z
628ZincludesSecurity
629Zincludesboarding
630Zincludes
Subvention2006 01 401A 4,734 976 6,845 10,250 390 0 4,840 451 15,206 675 02006 01 402N 22,004 5,762 2,560 50 300 0 740 0 0 150 502006 01 403P 125,128 28,802 9,425 1,950 20,140 1,680 6,601 0 673 3,050 1,9042006 01 404S 30,040 12,976 3,690 450 515 0 1,440 0 0 11,450 9502006 02 401A 8,449 1,611 4,481 1,883 19,470 3,140 1,675 16,982 32,522 1,621 2,3082006 02 402N 66,141 7,059 5,518 0 200 0 447 0 2,258 68 1402006 02 403P 205,945 28,969 10,354 0 227 0 782 0 5,212 160 482006 02 404S 141,088 16,403 4,751 0 90 0 693 0 5,655 9,686 6162006 03 401A 6,422 1,192 2,585 330 1,868 74 933 511 50,609 4,158 2422006 03 402N 148,512 13,432 3,927 0 9,435 1,068 699 2,425 1,974 231 2382006 03 403P 330,845 39,211 6,488 0 18,218 6,077 2,790 6,933 4,247 318 6102006 03 404S 209,172 22,303 5,915 0 6,344 4,294 364 3,259 3,430 715 1892006 04 401A 7,125 1,068 2,600 1,950 10,221 760 1,941 822 7,296 4,716 2562006 04 402N 218,274 21,666 5,083 0 12,127 2,022 892 2,872 37,510 331 162006 04 403P 443,290 49,691 6,525 0 19,681 2,243 1,270 6,558 65,562 527 732006 04 404S 167,751 23,067 6,502 0 3,767 1,053 13 1,578 30,652 120 02006 05 401A 8,203 1,807 8,859 253 3,004 1,649 1,933 7,565 24,175 7,230 1,7742006 05 402N 71,535 7,393 0 0 9,732 0 0 0 0 0 72006 05 403P 215,135 21,540 485 96 14,843 0 0 0 278 0 222006 05 404S 118,987 13,159 1,050 0 4,227 0 0 0 0 70 452006 06 401A 8,059 1,984 6,027 510 6,386 686 1,859 34,926 10,677 4,282 5982006 06 402N 151,160 13,836 2,972 0 9,444 2,081 357 0 10,175 70 7882006 06 403P 333,773 36,680 5,323 0 19,782 2,148 569 0 47,693 0 1,1552006 06 404S 259,301 28,755 4,849 0 9,833 886 93 0 37,569 0 5762006 07 401A 23,899 5,631 8,993 14,897 20,288 9,413 7,997 6,314 13,314 3,225 1,5902006 07 402N 15,047 4,505 1,237 0 0 0 59 257 0 0 02006 07 403P 91,100 19,539 1,712 0 0 0 589 253 219 0 02006 07 404S 29,444 8,722 1,214 0 0 0 1,517 1,225 775 41,408 02006 08 401A 3,932 999 4,358 425 14,400 4,848 5,267 0 2,397 1,205 1,0102006 08 402N 3,601 825 0 0 0 0 220 0 0 0 02006 08 403P 33,377 8,034 0 0 0 0 417 0 0 0 02006 08 404S 12,957 2,764 0 2,125 0 0 285 0 0 18,911 02006 09 401A 8,640 1,819 5,582 5,800 20,735 3,900 3,765 440 4,382 1,330 4902006 09 402N 27,118 13,262 300 0 0 0 400 130 0 0 02006 09 403P 95,180 20,742 300 0 0 0 860 200 472 0 02006 09 404S 36,489 11,120 700 0 130 0 1,200 830 2,158 11,080 02006 10 401A 5,927 1,231 5,117 1,332 2,529 270 2,840 2,059 7,653 2,362 5082006 10 402N 82,211 15,872 8,251 0 5,196 3,085 477 455 12,396 217 6762006 10 403P 217,880 43,162 6,748 132 23,949 693 1,069 740 20,737 383 282006 10 404S 180,510 35,300 7,464 0 6,656 3,688 627 707 22,716 9,707 39

131
2006 11 401A 9,194 909 4,688 780 279 0 3,249 993 2,432 9,168 1,4522006 11 402N 207,906 19,939 10,810 50 38,115 3,265 543 8,261 28,618 39 3,1212006 11 403P 450,274 45,130 12,185 0 41,296 4,968 200 19,216 40,870 80 2,3822006 11 404S 599,978 64,976 14,780 0 62,418 6,434 330 17,931 54,039 66 245,9722006 99 401A 94,585 19,227 60,135 38,410 99,570 24,739 36,299 71,064 170,663 39,972 10,2272006 99 402N 1,013,509 123,551 40,658 100 84,549 11,521 4,834 14,400 92,930 1,106 5,0352006 99 403P 2,541,927 341,499 59,545 2,178 158,135 17,808 15,147 33,901 185,962 4,518 6,2222006 99 404S 1,785,716 239,543 50,913 2,575 93,980 16,355 6,564 25,530 156,994 103,213 248,388
Table G3: Estimated Per Capita Expenditure by Region, 2006
REGION SUBPROG
SALARY+oncosts
G$
NON-SAL(excl 6301)
G$
2005/06Female
2005/06Males
Salary/student
NonSal/student
Total G$/Student
Regions 402N 92,123,636 6,453,539 1,550 1,584 29,395 2,059 31,454
1,7,8,9 403P 421,900,910 50,444,278 8,691 9,349 23,387 2,796 26,183
404S 144,511,226 102,053,075 2,139 1,691 37,731 26,646 64,377
Regions 402N 415,206,318 75,008,729 5,363 5,625 37,787 6,826 44,614
2,5,6,10 403P 1,103,084,158 163,655,961 21,456 22,994 24,816 3,682 28,498
404S 793,503,252 132,293,860 11,675 10,288 36,129 6,023 42,153
Regions 402N 629,729,278 173,671,233 7,872 8,142 39,324 10,845 50,169
3,4,11 403P 1,358,441,123 269,316,625 28,483 30,155 23,167 4,593 27,759
404S 1,087,245,046 229,736,853 16,309 15,049 34,672 7,326 41,998
All 402N 1,137,059,232 255,133,501 14,785 15,351 37,731 8,466 46,197
Regions 403P 2,883,426,191 483,416,864 58,630 62,498 23,805 3,991 27,796
404S 2,025,259,524 464,083,788 30,123 27,028 35,437 8,120 43,557
6,045,744,947 1,202,634,153 103,538 104,877 29,008 5,770 34,779
TOTAL Nursery 5,685,296 1,275,668 14,785 15,351 189 42 231@G$200 Primary 14,417,131 2,417,084 58,630 62,498 119 20 139
per USD Secondary 10,126,298 2,320,419 30,123 27,028 177 41 218Source: Per Capita.XLS MOE Subvention to President and Queen’s Colleges excluded from Expenditure.Enrollments are for 2005/06 school year (including PC and QC); USD exchange rateused as illustration only.Caution: School maintenanceexpendituremay beexcluded if reported in 401A not by Sub-Program.

132

133
Attachment H: Summary of ODA Project Assistance
REG Type School NameEmerg. RepairsSchools
SSRPPilots
BEAMSRenov.
BEAMSNew
GEAPRehab.
GEAPNew
GYCapital
MOEENROL
2000
MOEENROL
2004
Stud2004
Stud2005Male
Stud2005Fem.
R01 2CHS Port Kaituma SSRP1 X X X X X X 179 108 108 151 136R02 3GSS Anna Regina Multi SSRP1 X X X X X X 933 1,100 943 409 631R02 3GSS Aurora X X X BEAMS2 X X X 434 515 515 285 266R02 3GSS Abram Zuil SSRP1 X X X X X X 628 621 651 254 367R02 3GSS Cotton Field X SSRP2 X X X X X 976 988 1,062 517 471R03 2CHS St. John’s SSRP1 X X X X X X 488 402 402 207 147R03 3GSS Leguan SSRP1 X X X X X X 353 376 321 177 199R03 3GSS L’Aventure X SSRP2 X X X X X 357 491 476 237 254R03 3GSS Uitvlugt X SSRP2 X X X X X 532 566 597 264 302R04 1PTop Diamond X X X BEAMS2 X X X 87 100 100 58 44R04 2CHS Beterverwagting SSRP1 X X X X X X 800 479 480 329 268R04 2CHS Friendship SSRP1 X X X X X X 482 599 599 218 281R04 3GSS Annandale X SSRP2 X X X X X 500 595 579 235 360R04 3GSS Bladen Hall X X BEAMS1 X X X X 735 0 677 151 234R04 3GSS Covent Garden SSRP1 X X X X X X 557 707 508 243 464R05 3GSS Bygeval SSRP1 X X X X X X 0 772 772 289 352R05 3GSS Rosignol SSRP1 X X X X X X 620 495 595 254 369R05 3GSS Belladrum X SSRP2 X X X X X 600 588 588 337 251R05 3GSS Fort Wellington X SSRP2 X X X X X 321 358 358 188 163R06 3GSS Corentyne Comp. SSRP1 X X X X X X 621 802 802 331 438R06 3GSS Skeldon High X X X X GEAP1 X X 621 574 574 331 342R06 3GSS Skeldon Line Path X X X X GEAP1 X X 630 795 795 353 351R06 3GSS Tagore Memorial X X X X GEAP1 X X 670 708 795 334 372R06 3GSS Manchester X SSRP2 X X X X X 334 391 391 253 162R06 3GSS Tutorial Academy X x BEAMS1 X X X X 560 707 379 162 185R06 3GSS Vryman’s Erven X SSRP2 X X X X X 602 547 545 249 276R06 3GSS New Amsterdam Multi SSRP1 X X X X X X 687 568 568 280 382R07 3GSS Bartica SSRP1 X X BEAMS2 X X GYCAP 871 1,085 1,085 544 536R07 3GSS Waramadong X X X X X X GYCAP 0 342 342 142 205R08 3GSS Paramakatoi SSRP1 X X X X X X 235 404 362 150 254R09 3GSS St. Ignatius SSRP1 X X X X X X 337 347 360 163 197R10 2CHS Kwakwani SSRP1 X X X X X X 278 309 309 177 165R10 3GSS Christianburg Wismar X X X X GEAP1 X X 758 865 865 335 377R10 3GSS Linden Foundation X X X X X GEAP2 X 291 378 378 435 443R10 3GSS Mackenzie X SSRP2 X X GEAP1 X X 531 607 607 233 436R10 3GSS Silvercity X X X X GEAP1 X X 491 619 537 256 363R10 3GSS Wisburg X X X X X GEAP2 X 0 723 672 412 311R11 2CHS Lodge X X BEAMS1 X X X X 509 0 407 211 196R11 3GSS Campbellville SSRP1 SSRP2 X X X X X 760 867 867 425 442R11 3GSS St. John’s College SSRP1 X X X X X X 986 811 811 290 363R11 3GSS Charlestown SSRP1 X BEAMS1 X X X X 700 542 576 274 285R11 3GSS North Ruimveldt X X BEAMS1 X X X X 692 732 732 354 378R11 3GSS Tucville X SSRP2 X X X X X 0 541 541 271 270R11 3GSS Dolphin X SSRP2 X X X X X 577 714 714 347 367
19 12 5 *3 6 2 2 22,323 24,838 25,345 12,115 13,655
SSRP(1) ERS 19 10,515 11,394 11,119 5,165 6,276
SSRP(2) Pilots 12 6,316 7,197 7,269 3,421 3,675
BEAMS(1) Renovation 5 3,196 1,981 2,771 1,152 1,278
BEAMS(2) new construction 3* 521 615 615 343 310
GEAP(1) Rehabilitation 6 3,701 4,168 4,173 1,842 2,241
GEAP(2) new construction 2 291 1,101 1,050 847 754
Government funded 2 871 1,427 1,427 686 741
PROJECTS.XLS (list provided by MOE 4 Dec 2007); plus selected records from MOE Statistical Data (GY0506S_Projects.sql 5 Dec 2007)
Figure 5.2: SUMMARY OF ODA PROJECT ASSISTANCE (SSRP, BEAMS, GEAP) AND REPORTED ENROLLMENT

134
Attachment J: Summary of Baseline, Medium and High Outcomes ScenariosSECONDARYSTUDENTS
2002/03 2003/04 2004/05 2005/06 2006/07 2007/08 2008/09 2009/10 2010/11 2011/125 yearschange
Baseline 62,424 65,391 65,638 67,141 68,973 71,209 72,104 71,616 71,159 67,913 98.5%Medium 62,424 65,391 65,638 67,141 72,956 76,506 78,675 79,349 80,047 77,553 106.3%High Outcome 62,424 65,391 65,638 67,141 74,134 78,595 81,250 82,385 83,563 81,408 109.8%
CXC ENGLISHCANDIDATES
2002/03 2003/04 2004/05 2005/06 2006/07 2007/08 2008/09 2009/10 2010/11 2011/125 yearschange
Baseline (40%) 7,745 7,786 8,252 7,608 6,897 7,121 7,210 7,162 7,116 6,791 98.5%Medium (45%) 7,745 7,786 8,252 7,608 7,296 7,779 8,129 8,325 8,523 8,376 114.8%High (STR=52%) 7,745 7,786 8,252 7,608 7,628 8,369 8,933 9,333 9,735 9,736 127.6%
SECONDARYTEACHERS
2002/03 2003/04 2004/05 2005/06 2006/07 2007/08 2008/09 2009/10 2010/11 2011/125 yearschange
Baseline(STR=20) 3,392 3,437 3,448 3,560 3,605 3,580 3,557 3,395 98.5%Medium(STR=23) 3,392 3,437 3,558 3,643 3,659 3,606 3,557 3,371 94.7%High (STR=26) 3,392 3,437 3,530 3,572 3,532 3,432 3,342 3,131 88.7%
TRAINEDTEACHERS
2002/03 2003/04 2004/05 2005/06 2006/07 2007/08 2008/09 2009/10 2010/11 2011/125 yearschange
Baseline (61%) 1,788 1,844 1,868 1,933 1,964 2,004 2,027 2,070 110.8%Medium (70%) 1,788 1,844 1,956 2,076 2,158 2,235 2,312 2,359 120.6%High (80%) 1,788 1,844 1,976 2,107 2,225 2,299 2,406 2,504 126.7%
NEWTEACHERS
2002/03 2003/04 2004/05 2005/06 2006/07 2007/08 2008/09 2009/10 2010/11 2011/125 yearschange
Baseline 56 24 65 31 40 23 43 226

135
Medium 56 112 120 82 77 77 47 515High Outcome 56 132 131 118 74 107 98 660
RECURRENTEXPENDITUREG$M (constant)
2002/03 2003/04 2004/05 2005/06 2006/07 2007/08 2008/09 2009/10 2010/11 2011/125 yearschange
Baseline 4,065 4,108 4,264 4,342 4,366 4,381 4,290 4.43%Medium 4,065 4,278 4,471 4,585 4,641 4,704 4,631 8.25%High Outcome 4,065 4,281 4,460 4,569 4,603 4,677 4,646 8.53%
EXPENDITUREPer TEACHERG$000 (constant)
2002/03 2003/04 2004/05 2005/06 2006/07 2007/08 2008/09 2009/10 2010/11 2011/125 yearschange
Baseline 1,183 1,191 1,198 1,204 1,220 1,232 1,264 6.1%Medium 1,183 1,202 1,227 1,253 1,287 1,322 1,374 14.3%High Outcome 1,183 1,213 1,249 1,294 1,341 1,399 1,484 22.4%
EXPENDITUREPer STUDENTG$000 (constant)
2002/03 2003/04 2004/05 2005/06 2006/07 2007/08 2008/09 2009/10 2010/11 2011/125 yearschange
Baseline 60.544 59.560 59.880 60.218 60.964 61.567 63.169 6.1%Medium 60.544 58.638 58.440 58.277 58.488 58.765 59.714 1.8%High Outcome 60.544 57.746 56.747 56.234 55.872 55.970 57.071 -1.2%
EXPENDITUREPer STUDENTUS$ (constant)
2002/03 2003/04 2004/05 2005/06 2006/07 2007/08 2008/09 2009/10 2010/11 2011/125 yearschange
Baseline 303 298 299 301 305 308 316 6.1%Medium 303 293 292 291 292 294 299 1.8%High Outcome 303 289 284 281 279 280 285 -1.2%

136