Embed Size (px)
Citation preview
LEE ET AL. VOL. 5 ’ NO. 6 ’ 4373–4379 ’ 2011
www.acsnano.org
4373
May 26, 2011
C 2011 American Chemical Society
Universal Parameters for CarbonNanotubeNetwork-Based Sensors: CanNanotube Sensors Be Reproducible?Byung Yang Lee,† Moon Gyu Sung,† Joohyung Lee,† Ku Youn Baik,† Young-Kyun Kwon,‡ Moon-Sook Lee,§
and Seunghun Hong†,^,*
†Department of Physics and Astronomy, Seoul National University, Seoul 151-747, Korea, ‡Department of Physics and Research Institute for Basic Sciences, KyungHee University, Seoul 130-701, Korea, §Samsung Advanced Institute of Technology, Yongin-si, Gyeonggi-do 446-712, Korea, and ^Department of Biophysics andChemical Biology, Seoul National University, Seoul 151-747, Korea
Carbon nanotubes (CNTs) have beenextensively studied due to their re-markable electrical and mechanical
properties.1 Especially, sensors with field-effect transistor (FET) structures using CNTsand CNT networks as a channel have beenwidely utilized for various sensing applica-tions.2 However, sensors with CNT channelssuffer from irregularity in their individualelectrical and mechanical properties. Thisirregularity originates from diverse sources,for example, from the different synthesisprocess of CNTs,3,4 chirality distribution,5
and variation of device contact resistance.6
This inherent irregularity of the individualCNT devices results in unpredictable andhighly irregular behavior of CNT-based sen-sors, impeding their practical applicationsand commercialization.7,8 In many cases,one cannot even reproduce the sensingresults reported in the literature quantitatively.Herein, we report the study of the uni-
versal parameters which enable us to quan-tify and even predict the sensing behaviorsof diverse CNT network-based sensors. Toexplain these parameters, we propose atheoretical model where the target mol-ecules are adsorbed onto the CNT surfacesvia the Langmuir isotherm process andthe conductance of the sensor transducerchanges via capacitive coupling or chargetransfer. The validity of the model has beenconfirmed by sensing experiments onmercury (Hg2þ) and ammonium (NH4
þ)ions using a number of CNT network-based sensors. Considering that the un-predictable characteristics of CNT net-work-based sensors have been holdingback their practical applications, thiswork should be a major breakthrough inCNT network-based sensor research andopen various practical applications such
as environmental safety and medicaldiagnostics.
RESULTS AND DISCUSSION
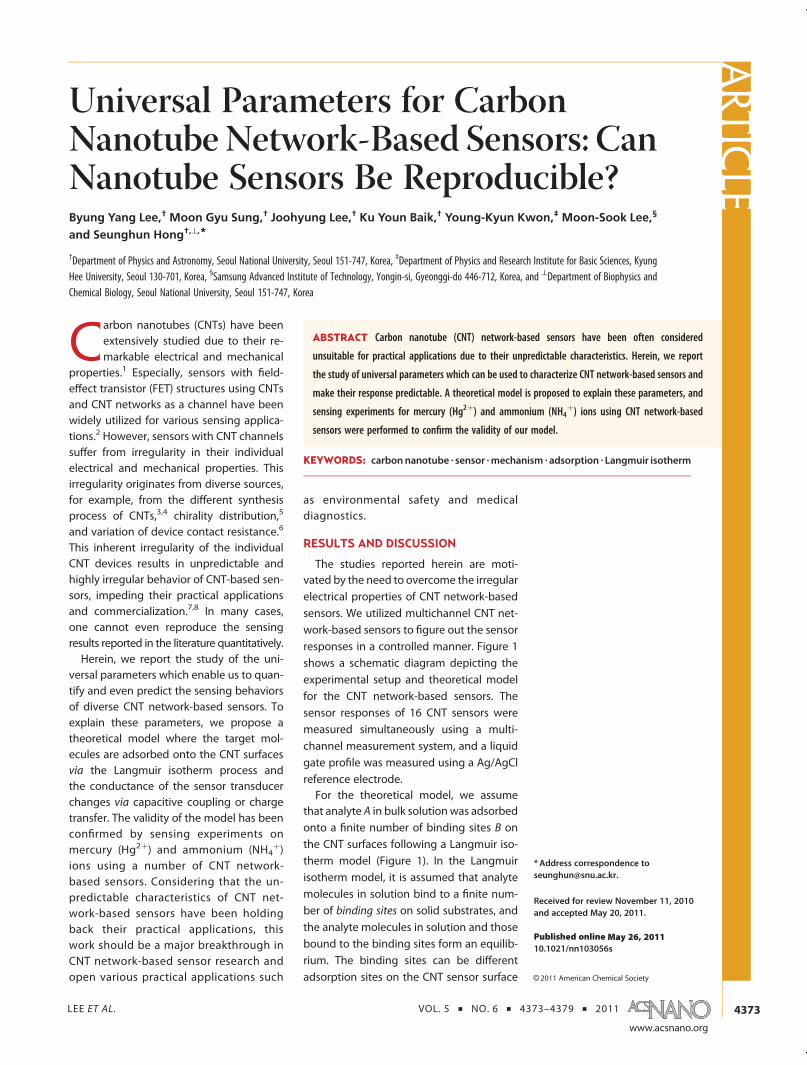
The studies reported herein are moti-vated by the need to overcome the irregularelectrical properties of CNT network-basedsensors. We utilized multichannel CNT net-work-based sensors to figure out the sensorresponses in a controlled manner. Figure 1shows a schematic diagram depicting theexperimental setup and theoretical modelfor the CNT network-based sensors. Thesensor responses of 16 CNT sensors weremeasured simultaneously using a multi-channel measurement system, and a liquidgate profile was measured using a Ag/AgClreference electrode.For the theoretical model, we assume
that analyte A in bulk solutionwas adsorbedonto a finite number of binding sites B onthe CNT surfaces following a Langmuir iso-therm model (Figure 1). In the Langmuirisotherm model, it is assumed that analytemolecules in solution bind to a finite num-ber of binding sites on solid substrates, andthe analyte molecules in solution and thosebound to the binding sites form an equilib-rium. The binding sites can be differentadsorption sites on the CNT sensor surface
* Address correspondence [email protected].
Received for review November 11, 2010and accepted May 20, 2011.
Published online10.1021/nn103056s
ABSTRACT Carbon nanotube (CNT) network-based sensors have been often considered
unsuitable for practical applications due to their unpredictable characteristics. Herein, we report
the study of universal parameters which can be used to characterize CNT network-based sensors and
make their response predictable. A theoretical model is proposed to explain these parameters, and
sensing experiments for mercury (Hg2þ) and ammonium (NH4þ) ions using CNT network-based
sensors were performed to confirm the validity of our model.
KEYWORDS: carbonnanotube . sensor .mechanism . adsorption . Langmuir isotherm
ARTIC
LE
LEE ET AL. VOL. 5 ’ NO. 6 ’ 4373–4379 ’ 2011
www.acsnano.org
4374
depending on the type of the CNT sensor. For example,the binding sites on common CNT-based gas sensors aregas adsorption sites on bare CNT surfaces.9�11 In the caseof specific biosensors based on CNT FETs, specific recep-tor molecules fixed on CNT surfaces work as bindingsites.12 Let [A], [B], [AB], and [B]max represent the con-centration of analytes in bulk solution, the surface densityof binding sites on CNT networks, the surface density ofadsorbed analyte molecules, and the maximum surfacedensity of binding sites on CNT networks, respectively.Then, the surface density of adsorbed analytes can beexpressed following a Langmuir isotherm (Figure 1b) like
[AB] ¼ [B]max � [A][A]þ 1=K
(1)
with equilibrium constant K = k1/k�1, where k1 and k�1
are the association and dissociation constants, respec-tively.13 Since CNTs respond to analytes only within thedistance of Debye length in ionic solutions due to thescreening effect,14 we can assume that the sensor re-sponse of our sensors is mostly due to the analytesadsorbed onto the CNT channels.Although a previous report showed that charge
carriers can transport ballistically in individual CNTs,15
CNT network-based channels are usually composed ofmultiple CNTs overlapping on each other to formjunctions. In this case, we can expect rather diffusivecharge transport due to the short mean free paths.Thus, we can ignore any coherent gating effect andassume that the current change ΔI in the channel isaffected by the adsorbed analyte concentration [AB] onCNT surfaces via electric coupling like
ΔI ¼ GL � ΔVA � gLVds � ΔqAC0
¼ gLVds � qA[AB]C0
¼ gLVds � qAC0
[B]max � [A][A]þ 1=K
(2)
where GL represents the liquid gate transconductance;ΔVA the liquid potential change around the CNTscaused by the adsorbed analyte molecules; gL thenormalized transconductance defined by gL ≈ GL/Vds;ΔqA the total electric charge contributed by the ad-sorbed analyte molecules to the CNTs; qA the electriccharge contributed by the unit surface density of theadsorbed analyte molecules to the CNTs; and C0 is thecoupling constant between the analyte molecules andCNT surfaces.Previous reports show the two most common me-
chanisms about how charged analytes near the CNTsurface can affect the conductance of CNT networkchannels: electric field gating16 and direct chargetransfer.17 In the case of electric field gating, chargedanalytes near CNTs may exert electric fields on the CNTchannels, giving a gating effect just like in field-effecttransistors. In this case, C0 represents the capacitivecoupling between the charged analytes and the CNTchannels. On the other hand, adsorbed analytes maydirectly transfer electrical charges onto the CNTs via
direct contact. In this case, C0 is determined by theelectronegativity of the adsorbed analyteswith respectto that of CNTs. In both cases, qA and C0 are determinedby the type of analytes and should not be affected bythe CNT device structures.From eq 2, the sensor response, defined as the
conductance change (ΔG = ΔI/Vds) with respect toinitial conductance G0, becomes
ΔG
G0¼ gL
G0
� �� qA
C0[B]max � [A]
[A]þ 1=K(3)
It is worth mentioning several important aspects ofthis equation. First, gL/G0 represents the electricalcharacteristics of the CNT device and should be in-dependent of the analyte species. It can be estimatedby simple electrical measurement on the CNT devicewithout performing actual sensing experiments. Sec-ond, (qA/C0)[B]max and K represent the electric coupling
Figure 1. Schematic diagram depicting the measurement setup and our theoretical model. (a) CNT network channel isconnected by source and drain electrodes. The electrodes were covered with photoresist (PR) to minimize the leakagecurrents through the solution. A liquid cell was formed to confine the solution. (b) For theoretical modeling, we assume thatanalytes A get adsorbed to the binding sites B on the CNT surface via the Langmuir isotherm process with equilibriumconstant K (=k1/k�1), and only those adsorbed molecules AB generate the sensor response,ΔG/G0.ΔG/G0 vs log[A] is plottedaccording to the Langmuir isotherm (inset:ΔG/G0 vs [A]). The sensor responsehas a linear response regionwhose center valueis at [A] = 1/K.
ARTIC
LE
LEE ET AL. VOL. 5 ’ NO. 6 ’ 4373–4379 ’ 2011
www.acsnano.org
4375
and the adsorption properties of the analyte moleculesonto CNT-based sensor surfaces, respectively. Consid-ering [B]max as a constant, both can be determined onlyby the analyte type and do not depend on the CNTdevice structures or nanotube chirality.In a previous report, we showed that the sensor
response can be expressed in linear form to logarith-mic concentration in certain range of concentration.18
In this linear response region, we can write
ΔG
G0∼ 14log10 e
gLG0
� �� qA
C0[B]max � [log10[A]þ log10(e
2K)]
(4)
If we set x = log10[A] and y = ΔG/G0, the equationbecomes
y ∼ R[x � γ] (5)
where
R � 14log10e
gLG0
� �� qAC0[B]max
!
and γ(t�log10(e2K)) represent the slope and x-inter-
cept of the sensor response graph, respectively, asindicated in Figure 1b.These variables were verified with a multichannel
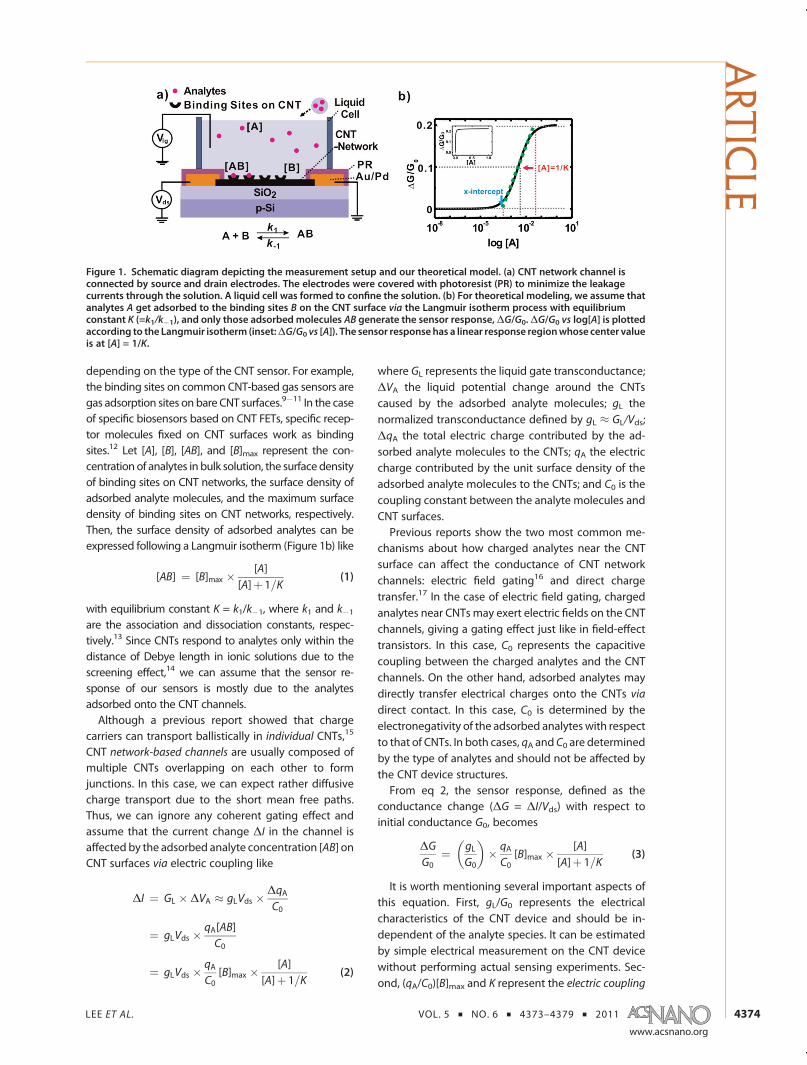
measurement system, which enabled us to applyidentical environmental change to 16 CNT network-based sensors on a single substrate (Figure 2a). Theatomic force microscopy (AFM) topography image in
Figure 2b shows one of the CNT network channels.Here, the CNT channel consists of a rather uniformmonolayer of CNTs resulted from the “self-limiting”mechanism during CNT adsorption, where the already-adsorbed CNTs impede the adsorption of additionalCNTs. This “self-limiting” mechanism is advantageousfor obtaining rather uniform arrays of CNT channels.13,19
However, it also should be mentioned that previousworks show that the surface density of adsorbed CNTsprepared by our process has some distribution aroundthe monolayer coverage following the log-normaldistribution.20,21 Such a distribution may cause a slightvariation of surface binding site density and channelconductance of the CNT devices. Furthermore, even forthe devices with uniform CNT density, the conduc-tance of the devices shows some distribution due tothe variation of the network connectivity.2
Sincewe utilized single-walled CNT (swCNT) solutioncontaining both semiconducting and metallic CNTs,the assembled CNT network channels consisted ofboth semiconducting and metallic current paths.17
Our multichannel CNT junctions exhibited a log-nor-mal distribution in G0, which is typical for percolatingconductive networks (Figure 2c).20,22 In the case of theliquid gate transconductance GL, they exhibited aboutone order wider distribution. The junction exhibited anegative liquid gate transconductance at a small gatebias, which is a typical p-type semiconducting behaviorof CNT channels under ambient conditions. The gating
Figure 2. Characterization of CNT newtork-based sensors. (a) Optical micrograph of a chip containing 16 CNT network-basedsensors. (b) AFM topography image of a typical CNT devicewithout PR passivation layer on Au electrodes. The surface densityof the adsorbed single-walled CNTs (swCNTs) is∼4 #/μm2. The unit #/μm2 represents the number of CNTs in a unit substratearea of 1 μm2.19 (c) Distribution of initial conductance G0 and liquid gate transconductance GL for 21 CNT network-basedsensors. G0 exhibited a log-normal distribution, while GL exhibited a rather random distribution. (d) Distribution of thenormalized transconductance gL/G0, a characteristic for each CNT device. It exhibited a log-normal distribution.
ARTIC
LE
LEE ET AL. VOL. 5 ’ NO. 6 ’ 4373–4379 ’ 2011
www.acsnano.org
4376
effect data show the on�off current ratio of 1.7 with asignificant off current due to the metallic paths in theCNT network (Figure S4 in Supporting Information).Figure 2d shows the normalized transconductance gL/G0, which is a characteristic parameter for each CNTdevice, independent of the target molecular species. Ithas a log-normal distribution over a rather broad rangedue to some variations in CNT network channels, suchas the number of semiconducting paths and CNTnetwork connectivity.For actual sensing experiments, multiple sensors
were exposed to the analyte with the concentrationsof 35.3 pM to 5.23 mM in the case of mercury ions(Hg2þ, HgCl2 in DI water) and 1 μM to 100 mM in thecase of ammonium ions (NH4
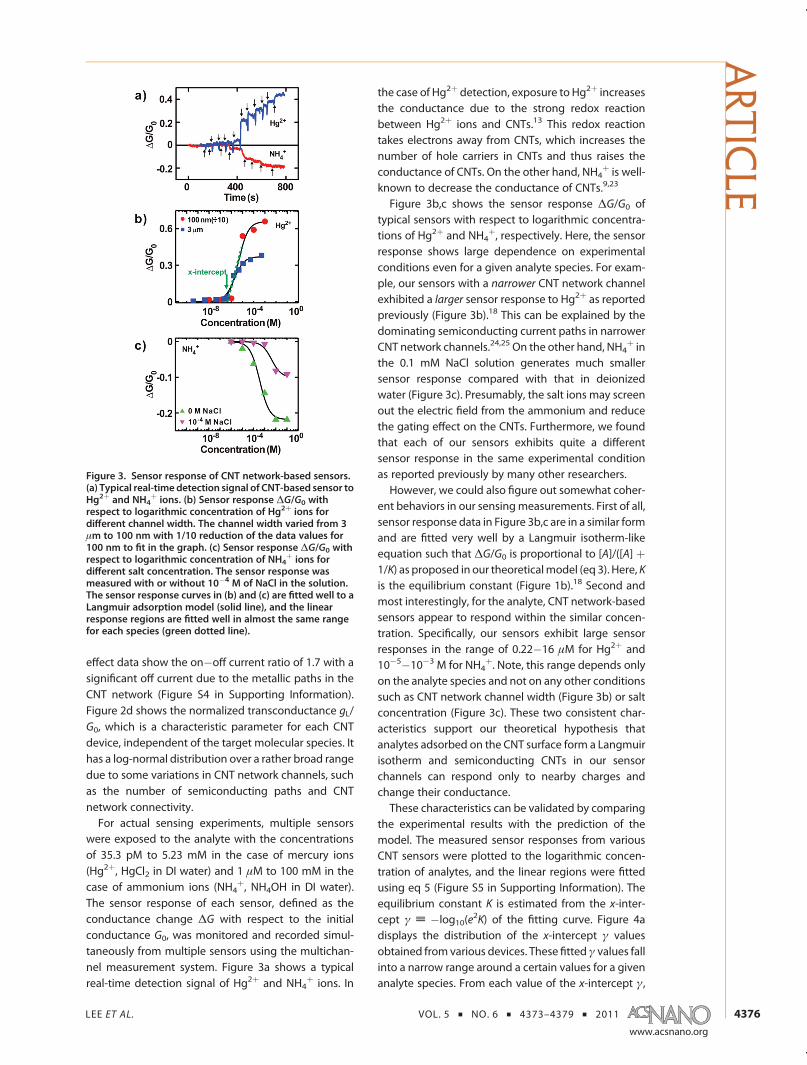
þ, NH4OH in DI water).The sensor response of each sensor, defined as theconductance change ΔG with respect to the initialconductance G0, was monitored and recorded simul-taneously from multiple sensors using the multichan-nel measurement system. Figure 3a shows a typicalreal-time detection signal of Hg2þ and NH4
þ ions. In
the case of Hg2þ detection, exposure to Hg2þ increasesthe conductance due to the strong redox reactionbetween Hg2þ ions and CNTs.13 This redox reactiontakes electrons away from CNTs, which increases thenumber of hole carriers in CNTs and thus raises theconductance of CNTs. On the other hand, NH4
þ is well-known to decrease the conductance of CNTs.9,23
Figure 3b,c shows the sensor response ΔG/G0 oftypical sensors with respect to logarithmic concentra-tions of Hg2þ and NH4
þ, respectively. Here, the sensorresponse shows large dependence on experimentalconditions even for a given analyte species. For exam-ple, our sensors with a narrower CNT network channelexhibited a larger sensor response to Hg2þ as reportedpreviously (Figure 3b).18 This can be explained by thedominating semiconducting current paths in narrowerCNT network channels.24,25 On the other hand, NH4
þ inthe 0.1 mM NaCl solution generates much smallersensor response compared with that in deionizedwater (Figure 3c). Presumably, the salt ions may screenout the electric field from the ammonium and reducethe gating effect on the CNTs. Furthermore, we foundthat each of our sensors exhibits quite a differentsensor response in the same experimental conditionas reported previously by many other researchers.However, we could also figure out somewhat coher-
ent behaviors in our sensingmeasurements. First of all,sensor response data in Figure 3b,c are in a similar formand are fitted very well by a Langmuir isotherm-likeequation such that ΔG/G0 is proportional to [A]/([A] þ1/K) as proposed in our theoreticalmodel (eq 3). Here, Kis the equilibrium constant (Figure 1b).18 Second andmost interestingly, for the analyte, CNT network-basedsensors appear to respond within the similar concen-tration. Specifically, our sensors exhibit large sensorresponses in the range of 0.22�16 μM for Hg2þ and10�5�10�3 M for NH4
þ. Note, this range depends onlyon the analyte species and not on any other conditionssuch as CNT network channel width (Figure 3b) or saltconcentration (Figure 3c). These two consistent char-acteristics support our theoretical hypothesis thatanalytes adsorbed on the CNT surface form a Langmuirisotherm and semiconducting CNTs in our sensorchannels can respond only to nearby charges andchange their conductance.These characteristics can be validated by comparing
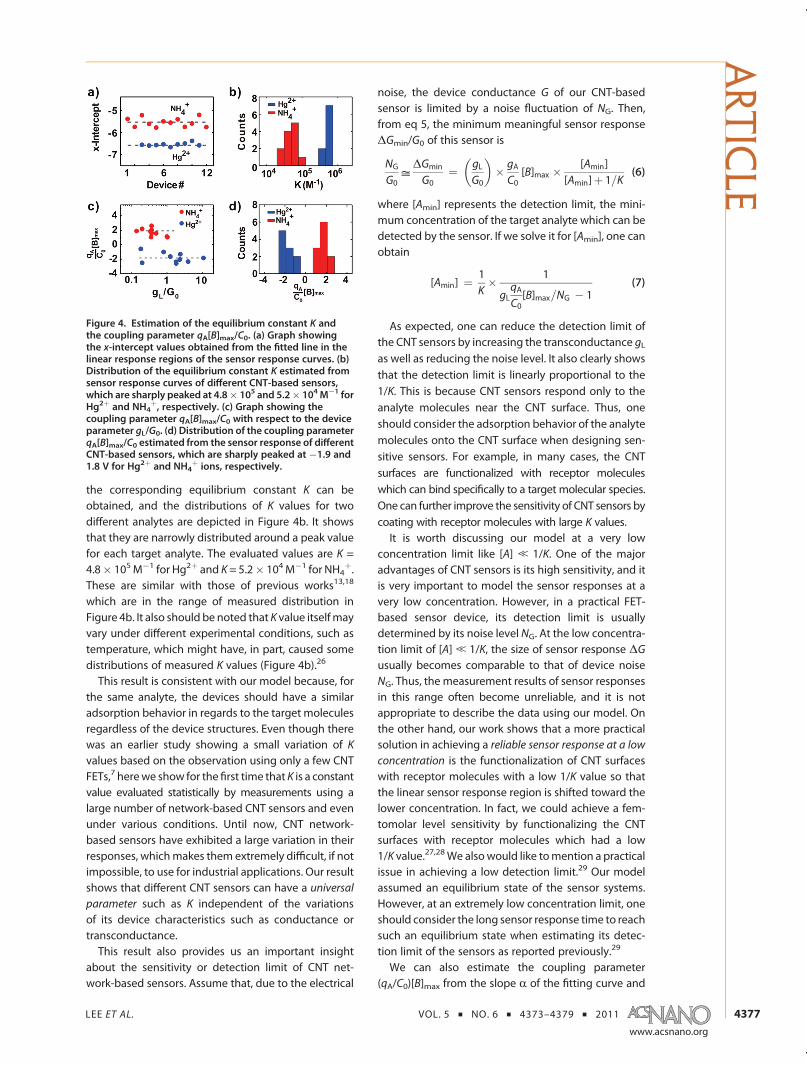
the experimental results with the prediction of themodel. The measured sensor responses from variousCNT sensors were plotted to the logarithmic concen-tration of analytes, and the linear regions were fittedusing eq 5 (Figure S5 in Supporting Information). Theequilibrium constant K is estimated from the x-inter-cept γ t �log10(e
2K) of the fitting curve. Figure 4adisplays the distribution of the x-intercept γ valuesobtained from various devices. These fittedγ values fallinto a narrow range around a certain values for a givenanalyte species. From each value of the x-intercept γ,
Figure 3. Sensor response of CNT network-based sensors.(a) Typical real-time detection signal of CNT-based sensor toHg2þ and NH4
þ ions. (b) Sensor response ΔG/G0 withrespect to logarithmic concentration of Hg2þ ions fordifferent channel width. The channel width varied from 3μm to 100 nm with 1/10 reduction of the data values for100 nm to fit in the graph. (c) Sensor response ΔG/G0 withrespect to logarithmic concentration of NH4
þ ions fordifferent salt concentration. The sensor response wasmeasured with or without 10�4 M of NaCl in the solution.The sensor response curves in (b) and (c) are fitted well to aLangmuir adsorption model (solid line), and the linearresponse regions are fitted well in almost the same rangefor each species (green dotted line).
ARTIC
LE
LEE ET AL. VOL. 5 ’ NO. 6 ’ 4373–4379 ’ 2011
www.acsnano.org
4377
the corresponding equilibrium constant K can beobtained, and the distributions of K values for twodifferent analytes are depicted in Figure 4b. It showsthat they are narrowly distributed around a peak valuefor each target analyte. The evaluated values are K =4.8� 105M�1 for Hg2þ and K = 5.2� 104M�1 for NH4
þ.These are similar with those of previous works13,18
which are in the range of measured distribution inFigure 4b. It also should be noted that K value itselfmayvary under different experimental conditions, such astemperature, which might have, in part, caused somedistributions of measured K values (Figure 4b).26
This result is consistent with our model because, forthe same analyte, the devices should have a similaradsorption behavior in regards to the target moleculesregardless of the device structures. Even though therewas an earlier study showing a small variation of Kvalues based on the observation using only a few CNTFETs,7 herewe show for the first time that K is a constantvalue evaluated statistically by measurements using alarge number of network-based CNT sensors and evenunder various conditions. Until now, CNT network-based sensors have exhibited a large variation in theirresponses, whichmakes them extremely difficult, if notimpossible, to use for industrial applications. Our resultshows that different CNT sensors can have a universal
parameter such as K independent of the variationsof its device characteristics such as conductance ortransconductance.This result also provides us an important insight
about the sensitivity or detection limit of CNT net-work-based sensors. Assume that, due to the electrical
noise, the device conductance G of our CNT-basedsensor is limited by a noise fluctuation of NG. Then,from eq 5, the minimum meaningful sensor responseΔGmin/G0 of this sensor is
NG
G0=ΔGmin
G0¼ gL
G0
� �� gA
C0[B]max � [Amin]
[Amin]þ 1=K(6)
where [Amin] represents the detection limit, the mini-mum concentration of the target analyte which can bedetected by the sensor. If we solve it for [Amin], one canobtain
[Amin] ¼ 1K� 1
gLqAC0[B]max=NG � 1
(7)
As expected, one can reduce the detection limit ofthe CNT sensors by increasing the transconductance gLas well as reducing the noise level. It also clearly showsthat the detection limit is linearly proportional to the1/K. This is because CNT sensors respond only to theanalyte molecules near the CNT surface. Thus, oneshould consider the adsorption behavior of the analytemolecules onto the CNT surface when designing sen-sitive sensors. For example, in many cases, the CNTsurfaces are functionalized with receptor moleculeswhich can bind specifically to a target molecular species.One can further improve the sensitivity of CNT sensors bycoating with receptor molecules with large K values.It is worth discussing our model at a very low
concentration limit like [A] , 1/K. One of the majoradvantages of CNT sensors is its high sensitivity, and itis very important to model the sensor responses at avery low concentration. However, in a practical FET-based sensor device, its detection limit is usuallydetermined by its noise level NG. At the low concentra-tion limit of [A] , 1/K, the size of sensor response ΔGusually becomes comparable to that of device noiseNG. Thus, the measurement results of sensor responsesin this range often become unreliable, and it is notappropriate to describe the data using our model. Onthe other hand, our work shows that a more practicalsolution in achieving a reliable sensor response at a lowconcentration is the functionalization of CNT surfaceswith receptor molecules with a low 1/K value so thatthe linear sensor response region is shifted toward thelower concentration. In fact, we could achieve a fem-tomolar level sensitivity by functionalizing the CNTsurfaces with receptor molecules which had a low1/K value.27,28We alsowould like tomention a practicalissue in achieving a low detection limit.29 Our modelassumed an equilibrium state of the sensor systems.However, at an extremely low concentration limit, oneshould consider the long sensor response time to reachsuch an equilibrium state when estimating its detec-tion limit of the sensors as reported previously.29
We can also estimate the coupling parameter(qA/C0)[B]max from the slope R of the fitting curve and
Figure 4. Estimation of the equilibrium constant K andthe coupling parameter qA[B]max/C0. (a) Graph showingthe x-intercept values obtained from the fitted line in thelinear response regions of the sensor response curves. (b)Distribution of the equilibrium constant K estimated fromsensor response curves of different CNT-based sensors,which are sharply peaked at 4.8� 105 and 5.2� 104M�1 forHg2þ and NH4
þ, respectively. (c) Graph showing thecoupling parameter qA[B]max/C0 with respect to the deviceparameter gL/G0. (d) Distribution of the coupling parameterqA[B]max/C0 estimated from the sensor response of differentCNT-based sensors, which are sharply peaked at �1.9 and1.8 V for Hg2þ and NH4
þ ions, respectively.
ARTIC
LE
LEE ET AL. VOL. 5 ’ NO. 6 ’ 4373–4379 ’ 2011
www.acsnano.org
4378
the measured device parameter gL/G0 through(qA/C0)[B]max = R/[(1/4log10e)(gL/G0)]. Figure 4c showsthe estimated coupling parameter (qA/C0)[B]max forthe devices with different values of device parametergL/G0. Significantly, it turns out that for the sameanalyte, the estimated (qA/C0)[B]max values are almostidentical from CNT devices with different gL/G0. Itverifies the validity of our theoretical model.Figure 4d shows the distributions of the coupling
parameter (qA/C0)[B]max for two different analytesmea-sured by various CNT devices. They are sharply peakedaround�1.9 V for Hg2þ and 1.8 V for NH4
þ. It indicatesthat the coupling parameter (qA/C0)[B]max is mainlydetermined by analyte species even for CNT network-based sensors with different initial conductance andtransconductance values as predicted in our theoreti-cal model.In our model (eq 3), the sensor response ΔG/G0 at
the analyte concentration [A] is determined by threemajor parameters: device parameter gL/G0, couplingparameter (qA/C0)[B]max, and equilibrium constant K.We demonstrated that CNT sensors exhibited almostidentical values of (qA/C0)[B]max and K for the analyte.The normalizationmethod for nanowire-based sensors
using liquid gate transconductance introduced byIshikawa et al. is also consistent with the linear relation-ship between sensor response and one of our para-meters, gL/G0.
30 With these three parameters, one cannow quantitatively predict the sensor response ofversatile CNT-based sensors before performing actualsensing experiments.In summary, the CNT network-based sensors with
different device characteristics (e.g., conductance,transconductance, etc.) exhibited almost identical va-lues of the equilibrium constant K and the couplingparameter (qA/C0)[B]max for the analyte. These twoparameters can be universal parameters which canbe used to quantify the sensing behaviors of versatileCNT network-based sensors independent of differentdevice structures or nanotube chiralities. Furthermore,we can quantitatively predict the sensor responseusing our model and the measured device parametergL/G0, which should enable reliable sensor signal pro-cessing. Our work should provide an important theo-retical framework in understanding the mechanism ofCNT network-based sensors and, eventually, allow usto produce reliable and predictable sensor devices forpractical applications.
METHODSWe have utilized a previously reported directed assembly
method to fabricate our swCNT network-based devices (FigureS1 in Supporting Information).21,22 Two different shapes of CNTnetwork patterns were fabricated. One has the width of 3 μmand the length of 2 μm, and the other has the width of 100 nmand the length of 2 μm. First, 3 μm wide line patterns ofphotoresist (AZ5214) and 100 nm wide line patterns of e-beamresist (PMMA) were created on SiO2 substrate via photolitho-graphy and e-beam lithography, respectively.18,24 When thepatterned substrate was placed in the hydrophobic octadecyl-trichlorosilane (OTS) solution (1:500 v/v in hexane), OTS mol-ecules were patterned on SiO2 substrate. After removing theresist, the patterned substrate was dipped into CNT solution(0.05 mg mL�1) in dichlorobenzene. In this case, the OTSmolecular layer blocked the CNT adsorption, and the CNTs wereassembled only onto the bare SiO2 region. Metal electrodeswere formed by photolithography, successive thermal evapora-tion of 10 nm Pd and 20 nm Au, and lift-off process. Afterward,the electrodes were passivated with photoresist (AZ5214) toimpede any electrochemical reaction with the bulk solution atthe surface of the electrodes. Then, a polypropylene liquid cellwas attached around the CNT array region to keep the liquidenvironment containing electrolytes. The final sensor chip hadan array of 16 CNT network-based sensors. The sensor re-sponses ofmultiple CNT sensors weremeasured simultaneouslyusing amultichannelmeasurement system (Figures S2 and S3 inSupporting Information). The measurement system consistsmainly of a sample holding jig, power supply, switch array,multiplexer, and a digital multimeter (DMM). A liquid gateprofile of our CNT devices was measured using a Ag/AgClreference electrode (Figure S4 in Supporting Information).16,31
A bias voltage (Vds) of 0.1 Vwas applied between the source anddrain electrodes for sensor response and liquid gate measure-ments. To get liquid gate transconductance, the liquid-gatedvoltage Vlg was swept cyclically between�0.3 and 0.3 Vwith thesource�drain voltage of Vds = 0.1 V. The gate voltage sweepwas
restricted to a rather low bias voltage to minimize possibleelectrochemical reaction and leakage currents between thereference electrode and the solution.31,32
Acknowledgment. This work was supported by the NRFgrant (No. 2011-0000390) and Samsung Electronics. S.H. ac-knowledges support from the Converging Research CenterProgram (No. 2010-k001138) and the WCU program.
Supporting Information Available: Supplementary methodsand additional details on fabrication method, electrical char-acterization, functionalization methods, and supplementaryfigures. This material is available free of charge via the Internetat http://pubs.acs.org.
REFERENCES AND NOTES1. Baughman, R. H.; Zakhidov, A. A.; de Heer, W. A. Carbon
Nanotubes;The Route toward Application. Science 2002,297, 787–792.
2. Lee, B. Y.; Seo, S. M.; Lee, D. J.; Lee, M.; Lee, J.; Cheon, J.-H.;Cho, E.; Lee, H.; Chung, I.-Y.; Park, Y. J.; et al. BiosensorSystem-on-a-Chip Including CMOS-Based Signal Proces-sing Circuits and 64 Carbon Nanotube-Based Sensors forthe Detection of a Neurotransmitter. Lab Chip 2010, 10,894–898.
3. Xia, Y.; Ma, Y.; Xing, Y.; Mu, Y.; Tan, C.; Mei, L. Growth andDefect Formation of Single-Wall Carbon Nanotubes. Phys.Rev. B 2000, 61, 11088–11092.
4. Teo, K. B. K.; Lee, S.-B.; Chhowalla, M.; Semet, V.; Binh, V. T.;Groening,O.; Castignolles,M.; Loiseau,A.; Pirio,G.; Legagneux,P.; et al. Plasma Enhanced Chemical Vapour DepositionCarbon Nanotubes/Nanofibres;How Uniform Do TheyGrow? Nanotechnology 2003, 14, 204–211.
5. Arnold, M. S.; Green, A. A.; Hulvat, J. F.; Stupp, S. I.; Hersam,M. C. Sorting Carbon Nanotubes by Electronic StructureUsing Density Differentiation. Nat. Nanotechnol. 2006, 1,60–65.
ARTIC
LE
LEE ET AL. VOL. 5 ’ NO. 6 ’ 4373–4379 ’ 2011
www.acsnano.org
4379
6. Appenzeller, J.; Knoch, J.; Derycke, V.; Martel, R.; Wind, S.;Avouris, P. Field-Modulated Carrier Transport in CarbonNanotube Transistors. Phys. Rev. Lett. 2002, 89, 126801.
7. Abe, M.; Murata, K.; Ataka, T.; Matsumoto, K. CalibrationMethod for a Carbon Nanotube Field-Effect TransistorBiosensor. Nanotechnology 2008, 19, 045505.
8. Nair, P. R.; Alam, M. A. Screening-Limited Response ofNanoBiosensors. Nano Lett. 2008, 8, 1281–1285.
9. Kong, J.; Franklin, N. R.; Zhou, C. W.; Chapline, M. G.; Peng,S.; Cho, K. J.; Dai, H. J. Nanotube Molecular Wires asChemical Sensors. Science 2000, 287, 622–625.
10. Li, J.; Lu, Y.; Ye, Q.; Cinke, M.; Han, J.; Meyyappan, M. CarbonNanotube Sensors for Gas and Organic Vapor Detection.Nano Lett. 2003, 3, 929–933.
11. Maeng, S; Moon, S.; Kim, S.; Lee, H.-Y.; Park, S.-J.; Kwak, J.-H.;Park, K.-H.; Park, J.; Choi, Y.; Udrea, F.; et al. Highly SensitiveNO2 Sensor Array Based on Undecorated Single-WalledCarbon Nanotube Monolayer Junctions. Appl. Phys. Lett.2008, 93, 113111.
12. Besteman, K.; Lee, J.-O.; Wiertz, G. M.; Heering, H. A.;Dekker, C. Enzyme-Coated Carbon Nanotubes as Single-Molecule Biosensors. Nano Lett. 2003, 3, 727–730.
13. Kim, T. H.; Lee, J.; Hong, S. Highly Selective EnvironmentalNanosensors Based on Anomalous Response of CarbonNanotube Conductance to Mercury Ions. J. Phys. Chem. C2009, 113, 19393–19396.
14. Kim, J. P.; Lee, B. Y.; Hong, S.; Sim, S. J. Ultrasensitive CarbonNanotube-Based Biosensors Using Antibody-BindingFragments. Anal. Biochem. 2008, 381, 193–198.
15. Javey, A.; Guo, J.; Wang, Q.; Lundstrom, M.; Dai, H. BallisticCarbon Nanotube Field-Effect Transistors. Nature 2003,424, 654–657.
16. Rosenblatt, S.; Yaish, Y.; Park, J.; Gore, J.; Sazonova, V.;McEuen, P. L. High Performance Electrolyte Gated CarbonNanotube Transistors. Nano Lett. 2002, 2, 869–872.
17. Bradley, K.; Briman, M.; Star, A.; Grüner, G. Charge Transferfrom Adsorbed Proteins. Nano Lett. 2004, 4, 253–256.
18. Lee, M.; Lee, J.; Kim, T. H.; Lee, H.; Lee, B. Y.; Park, J.; Jhon,Y. M.; Seong, M.-J.; Hong, S. 100 nm Scale Low-NoiseSensors Based on Aligned Carbon Nanotube Networks:Overcoming the Fundamental Limitation of Network-Based Sensors. Nanotechnology 2010, 21, 055504.
19. Im, J.; Huang, L.; Kang, J.; Lee, M.; Lee, D. J.; Rao, S. G.; Lee,N. K.; Hong, S. “Sliding Kinetics” of Single-Walled CarbonNanotubes on Self-Assembled Monolayer Patterns: BeyondRandom Adsorption. J. Chem. Phys. 2006, 124, 224707.
20. Rammal, R.; Lemieux, M.-A.; Tremblay, A.-M. S. Commenton “ε Expansion for the Conductivity of a Random ResistorNetwork”. Phys. Rev. Lett. 1985, 54, 1087.
21. Lee, M.; Im, J.; Lee, B. Y.; Myung, S.; Kang, J.; Huang, L.;Kwon, Y.-K.; Hong, S. Linker-Free Directed Assembly ofHigh-Performance Integrated Devices Based on Nano-tubes and Nanowires. Nat. Nanotechnol. 2006, 1, 66–71.
22. Lee, B. Y.; Heo, K.; Bak, J. H.; Cho, S. U.; Moon, S.; Park, Y. D.;Hong, S. Scalable Assembly Method of Vertically-Sus-pended and StretchedCarbonNanotubeNetwork Devicesfor Nanoscale Electro-Mechanical Sensing Components.Nano Lett. 2008, 8, 4483–4487.
23. Bradley, K.; Gabriel, J. C. P.; Briman, M.; Star, A.; Gruner, G.Charge Transfer from Ammonia Physisorbed on Nano-tubes. Phys. Rev. Lett. 2003, 91, 218301.
24. Lee, M.; Noah, M.; Park, J.; Seong, M.-J.; Kwon, Y.-K.; Hong, S.Textured Network Devices: Overcoming FundamentalLimitations of Nanotube/Nanowire Network-Based De-vices. Small 2009, 5, 1642–1648.
25. Lee, M.; Baik, K. Y.; Noah, M.; Kwon, Y.-K.; Lee, J.-O; Hong, S.Nanowire and Nanotube Transistors for Lab-on-a-ChipApplications. Lab Chip 2009, 9, 2267–2280.
26. Wang, Z.; Yu, X.; Pan, B.; Xing, B. Norfloxacin Sorption andIts Thermodynamics on Surface-Modified Carbon Nano-tubes. Environ. Sci. Technol. 2010, 44, 978–984.
27. Kim, T. H.; Song, H. S.; Jin, H. J.; Lee, S. H.; Namgung, S.; Kim,U. K.; Park, T. H.; Hong, S. “Bioelectronic Super-Taster”Device Based on Taste Receptor-Carbon Nanotube HybridStructures, Lab Chip 2011, DOI: 10.1039/C0LC00648C.
28. Kim, T. H.; Lee, S. H.; Lee, J.; Song, H. S.; Oh, E. H.; Park, T. H.;Hong, S. Single-Carbon-Atomic-Resolution Detection ofOdorant Molecules Using a Human Olfactory Receptor-Based Bioelectronic Nose. Adv. Mater. 2009, 21, 91–94.
29. Nair, P. R.; Alam, M. A. Theoretical Detection Limits ofMagnetic Biobarcode Sensors and the Phase Space ofNanobiosensing. Analyst 2010, 135, 2798–2801.
30. Ishikawa, F.; Curreli, M.; Chang, H. K.; Chen, P. C.; Zhang, R.;Cote, R. J.; Thompson, M. E.; Zhou, C. A Calibration Methodfor Nanowire Biosensors to Suppress Device-to-DeviceVariation. ACS Nano 2009, 3, 3969–3976.
31. Minot, E. D.; Janssens, A.M.; Heller, I.; Heering, H. A.; Dekker,C.; Lemay, S. G. Carbon Nanotube Biosensors: The CriticalRole of the Reference Electrode. Appl. Phys. Lett. 2007, 91,093507.
32. Koh, J.; Yi, M.; Lee, B. Y.; Kim, T. H.; Lee, J.; Jhon, Y. M.; Hong,S. Directed Assembly of Carbon Nanotubes on Soft Sub-strates for Use as a Flexible Biosensor Array. Nanotechnol-ogy 2008, 19, 505502.
ARTIC
LE