Embed Size (px)
Citation preview

Universal Electronics Inc.
6101 Gateway Drive,
Cypress, CA 90630
Phone 714.820.1000
www.uei.com
Universal Electronics Inc.
giving you the power
2004 Annual Report


Today’s home is more complex than ever.
As new technologies continue to diversify
our lives, Universal Electronics simplifies
our interactions with the devices and digital
media we come in contact with everyday.
By enabling us to control it all.
Now, with just the touch of a button, we
can not only watch video clips from the last
family reunion, but also stream them from
the computer to the big screen in the
family room. We can play our favorite party
music from our PC and crank up the volume
through the surround sound stereo down-
stairs at the same time. We can even send
a slideshow of our recent fishing trip directly
to the living room plasma TV from the laptop
in the bedroom.
Simply. Seamlessly. Effortlessly.

The Pelham’s Situation The Pelham’s technology and entertainment needs are anything but complicated. They simply
want to operate their televisions and stereo system using a single control — without any added complexity or fancy techno
bells and whistles. Denise and her husband want what little technology they own to make their life more pleasurable, not
more complicated. No strangers to academia, the Pelhams may love to read, but would certainly rather focus on the works
of Hemingway and Tolstoy instead of a thick instruction manual.
The Pelham’s Environment Richard and Denise Pelham, both retired educators, live in a charming home in Greenwich, a
suburban English neighborhood of London — the same house they’ve lived in for more than 30 years. They’re both classical
music buffs (Richard loves Beethoven and Brahms, Denise adores the opera) but definitely not what one would describe as
typical home theater enthusiasts. Their traditionally furnished home is equipped with just the basics — a stereo, which gets
more use than any other Consumer Electronics device in the house, and two TVs, one in the living room and one in the master
bedroom. When they’re not listening to selections from their vast classical music collection, the Pelhams like to watch old
movies and news to stay current on what’s going on in the world.
The Pelham’s Solution UEI offers just the kind of solution the Pelhams are looking for — including a One For All®
Indoor Antenna, Wireless Audio Video Sender, and Universal Remote Control. The One For All antenna will ensure that
the Pelhams enjoy crystal-clear signal reception and enhanced picture quality every time they watch TV. The One For All
Wireless Audio/Video Sender will distribute all audio and video equipment signals to anywhere in their home. That way,
Richard and Denise can watch the same movie — or enjoy the same orchestral performance — from different rooms in
their home. No wiring is required. The signals simply go through walls and ceilings. And because the sender has a built-
in remote control extender, their choice of viewing and listening is as simple as a keystroke. The One For All Universal
Remote Control is ergonomically designed for easy accessibility, with features like a navigation island that enables the
Pelhams to simply thumb through the keys they use most often.
Keeping it simple.

The Fleming’s Situation With so many devices in their home — and one hand usually on a juice box or a leash — the Flemings
would certainly benefit from the power and convenience of a single universal control point for that “free” hand. With their living
room cluttered enough already, the last thing Patrick and Tanya need is to have to hunt for six different remote controls. Still,
they want maximum accessibility and flexibility in their entertainment choices. The Flemings need an easy and effective way to
control their entire home entertainment environment and accommodate their very busy lifestyle.
Bringing order to
a chaotic household.
The Fleming’s Environment Patrick and Tanya Fleming live in a suburb of St. Louis, Missouri with their two children, 7-year-old
Samantha and 5-year-old Matthew , and a golden retriever Stella. Their home is contemporary and open, though the family room
and playroom are often cluttered with toys and gadgets. The Flemings own a number of technology and entertainment devices that
are utilized by everyone, often simultaneously: digital cable, broadband internet, VCR, DVD, PVR/DVR, and a video game console.
From the den, Patrick monitors the stock market on TV while sending e-mails to his colleagues. In the living room, Samantha
watches “The Incredibles” on DVD for the 20th time, while the DVR records Oprah for Tanya to watch after she puts Matthew
down for an afternoon nap. In her precious spare time, Tanya manages to run an online consulting business from the home office.
The Fleming’s Solution UEI’s revolutionary Kameleon display technology is uniquely designed to provide effortless ease-
of-control anywhere the Flemings want to enjoy home entertainment. Its unique and stylish graphical user interface, which
utilizes “Intelligent Illumination,” simplifies matters by displaying only the active device keys and hiding inactive functions —
making it ideal for parents like Patrick and Tanya, who have lots to do and very little time to spare. Powered by Kameleon,
OrionTM is the ultimate family-friendly universal remote, combining all the benefits of touch-screen simplicity with push-
button familiarity. It’s also the perfect choice for today’s most advanced home entertainment applications, many of which can
be found in the Fleming’s home. With just the touch of a button, thanks to UEI’s world-class database and patented macro
capabilities, Tanya can now get Samantha’s movie started while putting Oprah on hold and setting up a weekly recording of
“The Apprentice”. And she can do it all effortlessly.

The Chang’s Environment Roger and Michelle Chang, who just moved into their stunning new home in Manhattan Beach,
California are early adopters in every sense of the term. A husband and wife graphic design team, their lives revolve around all
the coolest new technology. They have installed everything from broadband to Wi-Fi in their home, and will settle for nothing less
than the very latest plasma TV, matching portable mp3 players and the slimmest digital camera cell phones. The high-end home
theater equipment in their home is not only state-of-the-art, but resembles a work of art. And their home computers are reposi-
tories of their vast collection of digital pictures and music.
The Chang’s Solution NevoSL is a powerful universal controller that intuitively delivers complete audio visual and digital
media control for the networked home. The benefit of NevoSL is that it automatically discovers all the digital media content
that is stored on the home network. Which means that, with just the touch of a button, Michelle can access music from her
PC and listen to it through speakers in the living room — or send a slideshow of vacation photos to the plasma TV in the
game room. NevoSL displays a high-resolution color touchscreen, with a user-friendly control interface that is customizable
through NevoStudio, a simple PC software application. Thanks to UEI’s world-class IR code database for device control
and upgradeability, NevoSL is compatible with virtually any new device Roger or Michelle bring into the home. Combined
with NevoLink™, an network-addressable intelligent bridge that enables multi-room device control, NevoSL provides an
ideal way for the Changs to enjoy all their entertainment devices and diverse digital media preferences.
The Chang’s Situation Roger and Michelle’s tastes in digital entertainment are as distinct as night and day. He’s a jazz aficionado.
She’s a hip hop groupie at heart. On occasion, they’ll give into each other’s preferences and switch from Dizzy Gillespie in the
den to Snoop Dogg in the living room. But they want to be able to better integrate all this technology and content in their home.
They are seeking complete audio/visual and digital media control from the palm of their hand. That way, anytime they want to, they
can play any song, view any digital picture, and watch any movie from any room in the house.
Enjoying media,
their way.

Revenues ( in millions)
2002 $103.9 2003 $120.5 2004 $158.4
To Our Shareholders,
Universal Electronics has been a leader in wireless control for over 18 years. While we have diligently analyzed
home controls and applied our technology to develop new products to pursue new markets and customers, we have
maintained prudent controls to continue to strengthen our financial position. Using this strategy throughout the
years, we have weathered economic changes and proven the theory that strong companies become even stronger
during challenging economic times.
This past year UEI validated this theory again. We have reaped the benefits of our new product developments
worldwide with strong retail sales, expansion of our worldwide original equipment manufacturer (OEM) business,
and the continued strengthening of customer relationships across our entire business. The 2004 financial results
certainly attest to the fact that our long-term efforts have paid off.
Strategy delivers a year of strong revenue and earnings growth.
Net sales for the year-ended December 31, 2004 were $158.4 million compared to $120.5 million for the year-
ended December 31, 2003. We delivered gross margin of 38.9 percent for the full year. 2004 operating income
increased to $13.5 million and grew an impressive 58 percent compared to last year. Net income for the year 2004
was $9.1 million, or $0.65 per diluted share, compared to $6.3 million, or $0.45 per diluted shared, for the year 2003.
We have a solid financial foundation with a strong balance sheet. After investing in our business, including the
SimpleDevices acquisition for $12.5 million and the repurchase of 495,000 shares for approximately $6.7 million, we
closed the year with $42.5 million in cash and cash equivalents—and we accomplished this while carrying zero debt.
Diluted Earnings Per Share ( in dollars)
A key strategic acquisition increases product diversification.
Our October 2004 acquisition of SimpleDevices Inc. furthers our strategic vision for delivering seamless digital
media connectivity, whether the user is at home, in the car or on the go. SimpleDevices’ multimedia connectivity
software has generated widespread interest among industry-leading customers in the automotive, home entertain-
ment and wireless networking industries. This embedded software extends UEI’s technology delivery options,
furthering our strategy of becoming the interface for the connected home. As broadband and wireless become
increasingly ubiquitous in the home, our comprehensive connectivity solutions will help consumers make the most
of their growing digital media collection.
UEI has the power.
Throughout our history, UEI has built an extensive intellectual property (IP) portfolio and delivers the power in our
products. As of December 31, 2004 the following statistics were true and they have undoubtedly grown by the time
you are reading this letter.
• UEI has 137 patents issued or pending.
• UEI has a database of more than 204,000 infrared codes and counting.
• UEI has intelligent software, enabling users to seamlessly connect their digital media to consumer electronic devices.
• UEI has intelligent middleware, enabling users to customize, schedule, and synchronize specific content to
designated devices.
Patents (issued & pending)( As of December 31, )
Database (device functions)
( As of December 31, )2002 $0.42 2003 $0.45 2004 $0.65 2002 143,004 2003 117,476 2004 204,828
2002 80 2003 101 2004 137

UEI’s new technology leads wireless home networking.
Wireless home networking is one of today’s fastest growing trends, and UEI’s introduction of Nevo 2.0® in July 2004
expanded our capabilities in the connected home like never before. Combining UEI’s connectivity software and patent
portfolio with the Universal Plug-n-Play (UPnP™) standard, 802.11 wireless networking protocol, Nevo 2.0 extends
UEI’s leading position in control technology to include solutions for the rapidly growing number of broadband and Wi-
Fi-enabled homes. Nevo 2.0 enables users to not only identify, manage and control digital media content across their
home network, but also to control a wide range of home theater and electronic products through a single interface.
In July 2004, we announced that Hewlett Packard (HP) had selected Nevo 2.0 to power the HP iPAQ Mobile
Media Application. Nevo technology enables mobile users to wirelessly download music, pictures and video or stream
digital medial to their HP iPAQ rx3000 series handheld devices. The alliance with HP is one result of UEI’s extensive
efforts to provide mobile media to consumers embracing the wireless digital lifestyle. By extending Nevo with new
media management features designed for broadband and networked homes, we will empower consumers to enjoy
their digital entertainment effortlessly through a single control point.
Looking ahead, we continue to expand our market reach.
In 2005 and beyond, we are excited about leveraging our industry-leading connectivity software and IP to continue
to expand the markets we serve. In January 2005, at the largest consumer electronics trade shows — the International
Consumer Electronics Show in Las Vegas and the Integrated Systems Europe Show in Amsterdam — we unveiled
NevoSL® our customizable, digital-media handheld solution. By mid-2005 NevoSL will be launched into the custom
installer, or CEDIA, marketplace, expanding our reach even further. This is an important market to penetrate, as
Parks & Associates, a leading consumer electronics consultancy, estimates that the CEDIA market spent approxi-
mately $200 million on remote control products in 2004 and is expected to spend $250 million in 2005.
Overall, the outlook for the industries we serve is very promising. New devices, such as DVD, PVR, and HDTV, as
well as advanced set-top boxes, are bringing phenomenal entertainment options to our homes. Consumer adoption of
digital media continues at record pace. And while all of these new devices and growing collections of digital media are
creating great excitement, they are also introducing a certain level of confusion into the increasingly connected home.
As the home technology environment becomes increasingly complex, we remain committed to delivering solutions to
help simplify people’s ability to access their devices and their digital media — whenever and wherever they want.
In closing, I would like to thank everyone who continues to make our success possible — our board of directors,
dedicated employees, worldwide partners and shareholders. At UEI we are excited about the future, and are confident
that the best is yet to come.
Sincerely,
Paul Arling
Chairman & Chief Executive Officer
Devices(in millions) Source: Parks Associates
20022.50.2
Year (projected)HDTV (Flat & Projected)DVR
20034.12.8
20045.78.1
20059.4
14.1
200615.621.7
200723.030.0
Digital Photography (prints in billions) Source: PMA Camera/Camcorder
Year (projected)
Music Downloading Forecast Source: Digital Music: Analysis & Forecast
20020.0
Year (projected)HH DownloadingTracks (in millions)
20030.5
20045.4
20057.0
200618.0
200725.8
200844.9
200953.2
20022.2
2003 3.4
2004 5.4
20057.7
200610.6

Universal Electronics Inc. 2004 Annual Report 21
21
29
30
46
47
48
50
52
72
73
74
76
Business of Universal Electronics Inc.
Selected Consolidated Financial Data
Management’s Discussion and Analysis of Financial Condition and Results of Operations
Consolidated Balance Sheets
Consolidated Income Statements
Consolidated Statements of Stockholders’ Equity
Consolidated Statements of Cash Flows
Notes to Consolidated Financial Statements
Controls and Procedures
Supplementary Data
Report of Independent Registered Public Accounting Firm
Corporate Information
Financial Review
Universal Electronics Inc. was incorporated under the laws of Delaware in 1986 and began operations in 1987. The principal
executive offices are located at 6101 Gateway Drive, Cypress, California 90630. As used herein, the terms “we”, “us” and
“our” refer to Universal Electronics Inc. and its subsidiaries unless the context indicates to the contrary.
Universal Electronics Inc., based in Southern California, develops firmware, software and turnkey solutions designed to enable
consumers to wirelessly connect and control devices and digital media in an increasingly complex home environment. Our primary
markets include original equipment manufacturers (OEMs) in consumer electronics and personal computing, as well as multiple
system operators in the cable and satellite subscription broadcasting markets. Over the past 17 years, we have developed a broad
portfolio of patented technologies and the industry’s leading database of home connectivity software that we license to our cus-
tomers, including many leading Fortune 500 companies. In addition, we sell our universal wireless control products and other audio/
visual accessories through our European headquarters in The Netherlands, and to distributors and retailers in Europe, Asia, Latin
America, South Africa, Australia, New Zealand, the Middle East, and Mexico under the One For All® brand name. More information
about us can be obtained at www.uei.com.
The matters discussed in this Annual Report should be read in conjunction with the consolidated financial statements. Certain
statements contained herein may constitute forward-looking statements within the meaning of the Private Securities Litigation
Reform Act of 1995. These statements involve a number of risks, uncertainties and other factors that could cause actual results
to differ materially, as discussed more fully herein. See, “Factors That May Affect Financial Condition and Future Results”.
General Business Information
We have developed a broad line of easy-to-use, pre-programmed universal wireless control products that are marketed principally
for home video and audio entertainment equipment through various channels of distribution, including retail, private label, OEMs,
cable and satellite service providers, and companies in the computing industry. We believe that universal wireless controls can
operate virtually all infrared (“IR”) remote controlled TVs, VCRs, DVD players, cable converters, CD players, audio components and
satellite receivers, as well as most other infrared remote controlled devices worldwide.
Beginning in 1986 and continuing today, we have compiled an extensive library that covers nearly 204,000 individual device
functions and over 2,400 individual consumer electronic equipment brand names. Our library is regularly updated with new IR
codes used in newly introduced video and audio devices. All such IR codes are captured from the original manufacturer’s remote
control devices or written specifications to ensure the accuracy and integrity of the database. Our proprietary software and know-
how permit IR codes to be compressed before being loaded into our products. This provides significant cost and space effici-
encies that enable us to include more codes and features in the memory space of the wireless control device than are included
in similarly priced products of our competitors. We have developed a patented technology that provides the capability to easily
upgrade the memory of the wireless control device by adding IR codes from our library that were not originally included.
On October 1, 2004, we acquired SimpleDevices Inc. for approximately $12.8 million in cash including direct acquisition
costs, plus a performance-based payment of our unregistered common stock to be paid in the future, if certain financial objec-
tives are achieved. SimpleDevices, based in San Mateo, California, develops software and firmware solutions that can enable
devices such as TVs, set-top boxes, stereos, automotive audio systems and other consumer electronic products to wirelessly
connect and interact with home networks and interactive services to deliver digital entertainment and information.
Products
We introduced our first product, the One For All®, in 1987. Since then our product lines have grown. Our family of products
includes universal standard and touch screen remote controls, wireless keyboards, game controllers, antennas, various audio/
video accessories, as well as custom and customizable microcontrollers that include our library of IR codes, proprietary software,
and digital media control software. We also earn revenue by licensing our library of IR codes and proprietary software. These
products cover a broad spectrum of suggested prices and performance capabilities. We sell our customized products to
international retailers and distributors, consumer electronic accessory suppliers, private label customers, computing and
software companies, OEMs, cable operators and satellite service providers. Additionally, our products are sold to third-parties,
who resell the products under the One For All® brand name and/or their customers’ respective private label brands. Our pro-
ducts are capable of controlling a multitude of audio and video devices, including, but not limited to TVs, VCRs, DVD players,
cable converters, CD players, satellite receivers, laser disc players, amplifiers, tuners, turntables, cassette players, digital audio
tape players, surround sound systems, digital media systems, and most home automation control modules.
Business of Universal Electronics Inc.

Universal Electronics Inc. 2004 Annual Report 21
Universal Electronics Inc. was incorporated under the laws of Delaware in 1986 and began operations in 1987. The principal
executive offices are located at 6101 Gateway Drive, Cypress, California 90630. As used herein, the terms “we”, “us” and
“our” refer to Universal Electronics Inc. and its subsidiaries unless the context indicates to the contrary.
Universal Electronics Inc., based in Southern California, develops firmware, software and turnkey solutions designed to enable
consumers to wirelessly connect and control devices and digital media in an increasingly complex home environment. Our primary
markets include original equipment manufacturers (OEMs) in consumer electronics and personal computing, as well as multiple
system operators in the cable and satellite subscription broadcasting markets. Over the past 17 years, we have developed a broad
portfolio of patented technologies and the industry’s leading database of home connectivity software that we license to our cus-
tomers, including many leading Fortune 500 companies. In addition, we sell our universal wireless control products and other audio/
visual accessories through our European headquarters in The Netherlands, and to distributors and retailers in Europe, Asia, Latin
America, South Africa, Australia, New Zealand, the Middle East, and Mexico under the One For All® brand name. More information
about us can be obtained at www.uei.com.
The matters discussed in this Annual Report should be read in conjunction with the consolidated financial statements. Certain
statements contained herein may constitute forward-looking statements within the meaning of the Private Securities Litigation
Reform Act of 1995. These statements involve a number of risks, uncertainties and other factors that could cause actual results
to differ materially, as discussed more fully herein. See, “Factors That May Affect Financial Condition and Future Results”.
General Business Information
We have developed a broad line of easy-to-use, pre-programmed universal wireless control products that are marketed principally
for home video and audio entertainment equipment through various channels of distribution, including retail, private label, OEMs,
cable and satellite service providers, and companies in the computing industry. We believe that universal wireless controls can
operate virtually all infrared (“IR”) remote controlled TVs, VCRs, DVD players, cable converters, CD players, audio components and
satellite receivers, as well as most other infrared remote controlled devices worldwide.
Beginning in 1986 and continuing today, we have compiled an extensive library that covers nearly 204,000 individual device
functions and over 2,400 individual consumer electronic equipment brand names. Our library is regularly updated with new IR
codes used in newly introduced video and audio devices. All such IR codes are captured from the original manufacturer’s remote
control devices or written specifications to ensure the accuracy and integrity of the database. Our proprietary software and know-
how permit IR codes to be compressed before being loaded into our products. This provides significant cost and space effici-
encies that enable us to include more codes and features in the memory space of the wireless control device than are included
in similarly priced products of our competitors. We have developed a patented technology that provides the capability to easily
upgrade the memory of the wireless control device by adding IR codes from our library that were not originally included.
On October 1, 2004, we acquired SimpleDevices Inc. for approximately $12.8 million in cash including direct acquisition
costs, plus a performance-based payment of our unregistered common stock to be paid in the future, if certain financial objec-
tives are achieved. SimpleDevices, based in San Mateo, California, develops software and firmware solutions that can enable
devices such as TVs, set-top boxes, stereos, automotive audio systems and other consumer electronic products to wirelessly
connect and interact with home networks and interactive services to deliver digital entertainment and information.
Products
We introduced our first product, the One For All®, in 1987. Since then our product lines have grown. Our family of products
includes universal standard and touch screen remote controls, wireless keyboards, game controllers, antennas, various audio/
video accessories, as well as custom and customizable microcontrollers that include our library of IR codes, proprietary software,
and digital media control software. We also earn revenue by licensing our library of IR codes and proprietary software. These
products cover a broad spectrum of suggested prices and performance capabilities. We sell our customized products to
international retailers and distributors, consumer electronic accessory suppliers, private label customers, computing and
software companies, OEMs, cable operators and satellite service providers. Additionally, our products are sold to third-parties,
who resell the products under the One For All® brand name and/or their customers’ respective private label brands. Our pro-
ducts are capable of controlling a multitude of audio and video devices, including, but not limited to TVs, VCRs, DVD players,
cable converters, CD players, satellite receivers, laser disc players, amplifiers, tuners, turntables, cassette players, digital audio
tape players, surround sound systems, digital media systems, and most home automation control modules.
Business of Universal Electronics Inc.
21
29
30
46
47
48
50
52
72
73
74
76
Business of Universal Electronics Inc.
Selected Consolidated Financial Data
Management’s Discussion and Analysis of Financial Condition and Results of Operations
Consolidated Balance Sheets
Consolidated Income Statements
Consolidated Statements of Stockholders’ Equity
Consolidated Statements of Cash Flows
Notes to Consolidated Financial Statements
Controls and Procedures
Supplementary Data
Report of Independent Registered Public Accounting Firm
Corporate Information
Financial Review

Universal Electronics Inc. 2004 Annual Report 2322 Universal Electronics Inc. 2004 Annual Report
Each of our wireless control devices is designed to simplify the use of video, audio and other devices. To appeal to the mass
market, the number of buttons is minimized to include only the most popular functions. Our remotes are also designed for ease
of set-up. For most of our products, the consumer simply inputs a four-digit code for each video or audio device to be controlled.
Each remote contains a RAM, a ROM, or a combination of ROM and EEPROM chips. The RAM, ROM and EEPROM combination
products allow the remote to be upgraded with additional codes, one of our patented features. We also adopted a flash-based
chip architecture that eliminates the need for EEPROM. Another patented ease of use feature we offer in several of our
products is our user programmable macro key. This feature allows the user to program a sequence of commands onto a single
key, to be played back each time that key is subsequently pressed.
By providing our wireless control technology in many forms, including finished products and microcontrollers on which our
software is embedded, we can meet the needs of our customers, enabling those who manufacture or subcontract their manufac-
turing requirements to use existing sources of supply and more easily incorporate our technology.
During 2004, we continued our product innovation by launching several new products based on the two new technology platforms
developed in 2002: Nevo™, an embedded solution that transforms any electronic display (such as a PDA) into a sophisticated and
easy-to-use wireless home control and automation device, and Kameleon™, a revolutionary display technology that provides ease of
use by illuminating only the keys needed to control each entertainment device. We also have a new line of audio and video acces-
sories including digital antennas, signal boosters, television brackets, and audio and video cleaning products.
Distribution and Customers
Our products are sold to a wide variety of customers in numerous distribution channels. In the United States, we sell our products
and/or license our proprietary technology to cable operators, satellite service providers, private label customers, consumer elec-
tronics accessory manufacturers and companies in the computing industry for resale under their respective brand names. In
addition, we sell our wireless control products and license our proprietary technologies to OEMs for use in their products. We
have also licensed certain of our proprietary technology to third parties and our One For All® brand name to a third party who in
turn sells the products directly to certain domestic retailers. Outside of the United States, we sell remotes, other wireless control
devices, and certain accessories under the One For All® and certain other brand names under private labels to retailers, and to
other customers, through our international subsidiaries and distributors. We also sell our products and/or license our proprietary
technology to OEMs, cable operators and satellite service providers internationally.
For the year ended December 31, 2004, we had sales to one customer, Comcast Communications, Inc., that represented more
than 11% of our net sales for the year.
We provide subscription broadcasters, namely cable operators and satellite service providers both domestically and inter-
nationally, with our wireless control devices and integrated circuits on which our software is embedded, to support the demand
associated with the deployment of digital set-top boxes and increased services. We also sell our universal wireless control
devices and integrated circuits, on which our software is embedded, to OEMs that manufacture cable converters and satellite
receivers for resale with their products.
We continue to pursue further penetration of the more traditional consumer electronics/OEM markets. Customers in these
markets generally package our wireless control devices for resale with their audio and video home entertainment products
(e.g. TVs, DVD and CD players, VCRs, personal digital media recorders, etc.). We also sell customized chips, which include our
software and/or customized software packages, to these customers. Growth in this line of business has been driven by the pro-
liferation and increasing complexity of home entertainment equipment, emerging digital technology, the increase in multimedia
and interactive internet applications, and the increase in the number of OEMs. Additionally, we supply our Nevo® technology, an
embedded system software for home control, to an OEM in the computing space.
We continue to place significant emphasis on expanding our sales and marketing efforts to subscription broadcasters and
OEMs in Asia, Latin America and Europe. We will continue to add new sales people, as required, to support anticipated sales
growth in these markets over the next few years. In addition, we continue to improve on our development processes to increase
cost savings and to provide more timely delivery of our products to our customers.
In the international markets, One For All® brand name products accounted for 32.1%, 30.4%, and 26.3% of our sales for the
years ended December 31, 2004, 2003, and 2002, respectively. Throughout 2004, we continued our retail sales and marketing
efforts in Europe, Australia, New Zealand, South Africa, the Middle East, Mexico and selected countries in Asia and Latin America.
We have seven international subsidiaries, Universal Electronics B.V., established in The Netherlands, One For All® GmbH and
Ultra Control Consumer Electronics GmbH, both established in Germany, One For All® Iberia S.L., established in Spain, One For
All® (UK) Ltd., established in the United Kingdom, One For All® Argentina S.R.L., established in Argentina, and One For All®
France S.A.S., established in France. We use third party distributors in countries where we do not have subsidiaries.
Consumer Service and Support
We provide domestic and international consumer support to our various universal remote control marketers, including manufac-
turers, cable and satellite providers, retail distributors, and audio and video original equipment manufacturers through our auto-
mated “InterVoice” system. Live agent help is also available through certain programs. We continue to review our programs to
determine their value in enhancing and improving the sales of our products. As a result of this continued review, some or all of
these programs may be modified or discontinued in the future and new programs may be added. In March 2003, our largest
consumer service and support customer notified us that as a result of a merger, it would conduct all of its consumer service and
support activities internally and ceased using the our services during the second quarter of 2003. Revenues from this customer
for consumer service and support amounted to $0, $0.8 million, and $3.4 million in 2004, 2003 and 2002, respectively.
Raw Materials and Dependence on Suppliers
We utilize third-party manufacturers and suppliers in Asia, Mexico and the United States to produce our wireless control products.
The number of third party manufacturers or suppliers that provided us in excess of 10% of our manufacturing services and/or
components was two, three, and two for 2004, 2003 and 2002, respectively. In 2004, Computime and Samsung collectively
represented 38.7% of our manufacturing services and components. In 2003, Computime, Jetta, and Samsung collectively repre-
sented 45% of our manufacturing services and components. In 2002, Jetta and Samsung collectively represented 27% of our
manufacturing services and components. As in the past, we continue to evaluate alternative and additional third-party manu-
facturers and sources of supply.
During 2004, we continued to diversify our suppliers and maintain duplicate tooling for certain of our products. This has
allowed us to stabilize our source for products and negotiate more favorable terms with our suppliers. In addition, where we can,
we use standard parts and components, which are available from multiple sources. To continue to reduce our dependence on
suppliers, we continue to seek additional sources of integrated circuit chips to help reduce the potential for manufacturing and
shipping delays. In addition, we have included flash microcontroller technology in some of our products. Flash microcontrollers
can have shorter lead times than standard microcontrollers and may be reprogrammed if necessary, thus potentially reducing
excess or obsolete inventory exposure.
Patents, Trademarks and Copyrights
We own a number of United States and foreign patents related to our products and technology, and have filed domestic and
foreign applications for other patents that are pending. We had a total of 137 issued and pending patents at the end of 2004,
an increase from 101 at the end of 2003. The life of our patents range from approximately four to eighteen years. We have also
obtained copyright registration and claim copyright protection for certain of our proprietary software and libraries of IR codes.
Additionally, the names of most of our products are registered or are being registered as trademarks in the United States Patent
and Trademark Office and in most of the other countries in which such products are sold. These registrations are valid for a
variety of terms ranging up to 20 years and may be renewed as long as the trademarks continue to be used and are deemed by
management to be important to our operations. While we follow the practice of obtaining patent, copyright and trademark registra-
tions on new developments whenever advisable, in certain cases, we have elected common law trade secret protection in lieu of
obtaining such protection.
Seasonality
Historically, our business has been influenced by the retail sales cycle, with increased sales in the last half of the year and the
largest proportion of sales occurring in the last quarter. This pattern is expected to continue and the impact will fluctuate as the
sales mix varies between consumer and business.
See the “Supplementary Data” section on page 73 for further details regarding our quarterly results.
Competition
Our principal competitors in the international retail and private label markets for our wireless controls include Philips, Thomson,
and Sony as well as various manufacturers of wireless controls in Asia. Our primary competitors in the OEM market are the
original equipment manufacturers themselves and wireless control manufacturers in Asia. The SimpleDevices OEM product lines
compete in part with those of Mediabolic, Digital 5, and Bridgeco. In the subscription broadcasting business line, we compete
with various distributors in the United States and several of the larger set-top manufacturers, including Motorola and Scientific-
Atlanta. The NevoSL® product, which is scheduled for release in the second quarter of 2005, will compete in the custom elec-
tronics installation market against Crestron, AMX, RTI, Universal Remote Control, Philips, and many others. We compete in our

Universal Electronics Inc. 2004 Annual Report 2524 Universal Electronics Inc. 2004 Annual Report
markets on the basis of product quality, product features, price, intellectual property, and customer and consumer support.
We believe that we will need to continue to introduce new and innovative products to remain competitive and to obtain and
retain competent personnel to successfully accomplish our future objectives. Certain of our competitors have significantly larger
financial, technical, marketing and manufacturing resources than we do, and there can be no assurance that we will remain
competitive in the future.
Engineering, Research and Development
During 2004, our engineering efforts focused on modifying existing products and technologies to improve features, lower
costs, and develop measures to protect our proprietary technology and general know-how. We continue to regularly update
our library of IR codes for new features and devices introduced worldwide. Our library contains over 168,000 IR data codes, an
increase from just over 141,000 data codes in 2003. We also continue to explore ways to improve our software to pre-program
more codes into our memory chips and to simplify the upgrading of our wireless control products.
Additionally, our product development efforts focused on new and innovative wireless control and interface solutions resulting
in the launch of new retail SKUs based on the Kameleon interface technology. We also broadened our product portfolio with solu-
tions that addressed emerging technology sectors like home media distribution and home automation. These advanced technology
development efforts focused on both industry-based standards as well as specific universal extensions that maximized the end-
user experience utilizing a set of heterogeneous protocols and technologies that exist in the modern home today. This
environment is driving the need for simplification of these new protocols and devices, since they were originally engineered and
targeted towards the enterprise customer. We created Nevo® product offerings to simplify and manage the end user’s experience
interacting with devices in the home — devices that may span over a decade, including traditional IR based devices, and the more
complex TCP/IP consumer electronic devices utilizing both open and proprietary protocols.
We also developed technologies aimed at unifying the traditional and emerging technologies that are encountered within a
home. This allows consumers to deploy our solutions ranging from a simple IR based audio-visual stack to a modern digital
media management experience allowing access to digital content such as music, pictures and videos.
SimpleDevices’ development was focused on the discovery of new, technologically advanced knowledge and more complete
solutions to customer needs, the conceptual formulation and design of possible alternatives, as well as the testing of process
and product cost improvements. If successful, these efforts will enable SimpleDevices to provide customers with reductions in
design cycle times, lower costs, and improvements in integrated circuit design, product quality and overall functional perfor-
mance. Additionally, these efforts will enable SimpleDevices to further penetrate existing markets, pursue new markets
effectively and expand the business.
Our personnel are involved with various industry organizations and bodies, which are in the process of setting standards for
infrared, radio frequency, power line, telephone and cable communications and networking in the home. There can be no assurance
that any of our research and development projects will be successfully completed.
Our expenditures on engineering, research and development were:
(in millions) 2 0 0 4 2 0 0 3 2 0 0 2
Research & Development $ 5.9 $ 4.7 $ 4.5
Engineering 2.9 1.7 1.4
Total Engineering, Research & Development $ 8.8 $ 6.4 $ 5.9
Environmental Matters
We believe we have materially complied with all currently existing federal, state and local statutes and regulations regarding
environmental standards and occupational safety and health matters to which we are subject. During the years ended December
31, 2004, 2003 and 2002, the amounts incurred in complying with federal, state and local statutes and regulations pertaining to
environmental standards and occupational safety and health laws and regulations did not materially affect our earnings or financial
condition. However, future events, such as changes in existing laws and regulations or enforcement policies, may give rise to addi-
tional compliance costs that could have a material adverse effect upon our capital expenditures, earnings or financial condition.
We are committed to developing an infrastructure to support the control of hazardous substances. A fully integrated system
with controls in product design and purchasing is being implemented internally.
We continue to work closely with our contract manufacturing base to move these manufacturers toward becoming Sony
Green Partners and already work with one fully certified Green Partner. Our goal is to provide a choice of two options to our
customers: Green and Non-Green. The Green option will be fully compliant with the RoHS (Restriction on Hazardous Substances)
requirements defined by the EEC with tolerances defined at the component level. All Green production processes will be segre-
gated physically from standard production processes to eliminate the possibility of contamination. We will offer subsets of the
full Green requirement to accommodate the broad spectrum of customer needs.
Employees
At December 31, 2004, we employed approximately 296 employees, of whom 104 were in engineering and research and
development, 59 in sales and marketing, 46 in consumer service and support, 30 in operations and warehousing and 57 in
executive and administrative staff. None of our employees are subject to a collective bargaining agreement or represented
by a union. We consider our employee relations to be good.
International Operations
Financial information relating to our international operations for the years ended December 31, 2004, 2003 and 2002 is
included in “Notes to Consolidated Financial Statements — Note 17”.
Available Information
Our Internet address is www.uei.com. We make available free of charge through our Internet website our annual report on Form
10-K, our quarterly reports on Form 10-Q, our current reports on Form 8-K and any amendments to these reports as soon as
reasonably practical after we electronically file such reports with the Securities and Exchange Commission. These reports can
be found on our website under the caption “SEC Filings” on the Investor page. Investors also can obtain copies of our SEC
filings from the SEC website at www.sec.gov.
Properties
Our headquarters is located in Cypress, California. We utilize the following office and warehouse facilities:
Location Purpose or Use Square Feet Status
Cypress, California Corporate headquarters, warehouse, 30,768 Leased, expires Dec. 31, 2005
engineering, research and development
Twinsburg, Ohio Consumer and customer call center 8,509 Leased, expires Jul. 31,2005
Enschede, Netherlands International headquarters and call center 18,292 Leased, expires Sep. 1, 2007
San Mateo, California SimpleDevice headquarters 9,000 Leased, expires Oct. 31, 2005
In addition to the facilities listed above, we lease space in various international locations, primarily for use as sales offices.
See “Notes to Consolidated Financial Statements — Note 12” for additional information regarding our obligations under leases.
Legal Proceedings
On November 15, 2000, we filed suit against Universal Remote Control Inc. alleging that Universal Remote has infringed
certain of our patents. On January 31, 2005, we announced resolution of this lawsuit by stating that the parties had entered into
a Confidential Settlement Agreement in which Universal Remote Control agreed to license certain of our remote control patents.
On November 19, 2002, we filed suit against Intrigue Technologies, Inc., which was amended on February 13, 2004, alleging
that Intrigue Technologies has infringed certain of our patents. In addition, Intrigue Technologies filed suit against us seeking
a judgment to declare certain of our patents invalid, unenforceable and void and also alleging that we have violated federal
antitrust laws with respect to our patent enforcement. On November 29, 2004, the parties announced that they had settled the
various lawsuits when they entered into a Confidential Settlement Agreement which set forth an overall business relationship in
which Logitech (Intrigue’s parent company) has licensed certain our technologies to be used in the Logitech Harmony line of
advanced remote controls.

Universal Electronics Inc. 2004 Annual Report 2726 Universal Electronics Inc. 2004 Annual Report
In 2002, one of our subsidiaries (One For All® S.A.S.) brought an action against a former distributor of the subsidiary’s products
seeking a recovery of accounts receivables. At December 31, 2004, the amounts due of $2.2 million is recorded as a long term
asset in “other assets”. The distributor filed a counterclaim against our subsidiary seeking payment for amounts allegedly owed for
administrative and other services rendered by the distributor for our subsidiary. In January 2005, the parties agreed to include claims
between the distributor and two of our other subsidiaries, namely, Universal Electronics BV, One For All® Iberia SL, such that the
proceeding covers all claims and counterclaims between the various parties. These additional claims involve nonpayment for
products and damages resulting from the wrongful termination of agency agreements. At this time, each of the subsidiaries
disagrees with the allegations of the former distributor and has vigorously defended itself against the counterclaims. These
proceedings are still in preliminary stages and the court appointed expert has not yet finalized his report to the court.
In 2003, an ex-employee of one of our subsidiaries brought an action against our subsidiary seeking damages in the amount
of approximately $191,000 for wrongful termination. The subsidiary disagreed with these allegations and vigorously defended
itself against this claim. In January 2005, judgment was rendered for the ex-employee awarding him approximately $26,000 in
damages. In February 2005, the ex-employee filed a notice of appeal. It is our intention to seek a settlement of this matter with
the ex-employee. If a settlement is not possible, our subsidiary will again vigorously defend itself.
On January 7, 2004, James D. Lyon, Trustee for the bankruptcy estate of Computrex, Inc. (“Trustee”) filed an action against
us alleging that we received preferential treatment in connection with certain payments made on our behalf by Computrex. We
have not yet answered this complaint and will not need to do so as this action is currently in abeyance while the Trustee appeals
an adverse ruling against it in another matter having facts similar to those in the Trustee’s action against us. If and when we
answer, we intend to deny all of the material allegations made against us and defend this matter vigorously.
There are no other material pending legal proceedings, other than litigation that is incidental to the ordinary course of our busi-
ness, to which we or any of our subsidiaries is a party or of which our respective property is the subject. We do not believe that any
of the claims made against us in any of the pending matters have merit and, except for the employment matter of which we intend
to seek settlement, we intend to vigorously defend ourselves against them. However, no assurances can be made as to the outcome
of any of these matters, nor can we estimate the range of potential losses to us, except that with respect to all pending employment
litigation matters, we have recorded a loss contingency of approximately $191,000 as of December 31, 2004.
We maintain directors’ and officers’ liability insurance which insures our individual directors and officers against certain claims
such as those alleged in the above lawsuits, as well as attorney’s fees and related expenses incurred in connection with the
defense of such claims.
Submission of Matters to a Vote of Security Holders
No matters were submitted to a vote of security holders during the fourth quarter of our fiscal year through the solicitation of
proxies or otherwise.
Executive Officers of the Registrant
The following table sets forth certain information concerning our executive officers as of March 14, 2005:
Name Age Position
Paul D. Arling 42 Chairman of the Board and Chief Executive Officer
Robert P. Lilleness 38 President and Chief Operating Officer
J. Stewart Ames 46 Senior Vice President of Sales, Product Development and Marketing
Paul J.M. Bennett 49 Senior Vice President, Managing Director, Europe
Richard A. Firehammer, Jr. 47 Senior Vice President, General Counsel and Secretary
Bernard J. Pitz 44 Senior Vice President, Chief Financial Officer, and Treasurer
Paul D. Arling is our Chairman and Chief Executive Officer. He joined us in May 1996 as Chief Financial Officer and was named
to our Board of Directors in August of 1996. He was appointed President and COO in September 1998, was promoted to Chief
Executive Officer in October of 2000 and appointed as Chairman in July 2001. From 1993 through May 1996, he served in various
capacities at LESCO, Inc. (a manufacturer and distributor of professional turf care products). Prior to LESCO, he worked for
Imperial Wall coverings (a manufacturer and distributor of wall covering products) as Director of Planning, and The Michael Allen
Company (a strategic management consulting company) where he was employed as a management consultant. He obtained a BS
degree from the University of Pennsylvania and an MBA from the Wharton School of the University of Pennsylvania.
Robert P. Lilleness joined us as President and Chief Operating Officer in May 2001. Prior to joining us, he served as Vice
President of Product Management and Marketing at Trilogy Software Inc. from June 1998 to May 2001 (a privately held com-
pany that develops and markets e-business software). Before Trilogy, he worked for Microsoft Corporation (NASDAQ: MSFT) from
February 1993 to May 1998, in a number of marketing, management, and operational roles for networking and server products,
including Windows NT Server and the Microsoft Back Office. Prior to working for Microsoft, he served as an auditor for Ernst
and Young in Zurich, Switzerland. He received his undergraduate degree from the University of Puget Sound and holds an MBA
from Harvard University.
J. Stewart Ames has been our Senior Vice President of Sales since January 1999. Prior to this position, he served as our Vice
President of Subscription Broadcasting Sales from June 1997 to January 1999, directing the United States based sales force in
selling universal wireless control products to multiple system operators. Before joining us in January 1991, he worked for three
years as Sales Manager for Calmold, (a plastic injection molder in Southern California), managing its sales force and selling
injection molding capacity for three factories to a variety of OEM businesses. Prior to Calmold, he held sales and sales manage-
ment positions at Spirol International, (a manufacturer of specialty metal fasteners, assembly equipment and metal stampings),
over a period of seven years. He received a BS Degree in Biology from Bates College in Lewiston, Maine.
Paul J.M. Bennett has been our Managing Director and a Senior Vice President, Managing Director, Europe since July 1996.
Prior to joining us, he held various positions at Philips Consumer Electronics over a seven year period, first as Product Marketing
Manager for the Accessories Product Group, initially set up to support Philip’s Audio division, and then as head of that division.
He was educated at Terenure College and the College of Commerce in Dublin and completed his studies at University College,
where he gained a Bachelor of Commerce Degree.
Richard A. Firehammer, Jr., Esq. has been our Senior Vice President since February 1999. He has been our Company’s General
Counsel since October 1993 and Secretary since February 1994. He was our Vice President from May 1997 until August 1998.
He was outside counsel to us from September 1998 until being rehired in February 1999. From November 1992 to September
1993, he was associated with the Chicago, Illinois law firm, Shefsky & Froelich, Ltd. From 1987 to 1992, he was with the law
firm, Vedder, Price, Kaufman & Kammholz in Chicago, Illinois. He is admitted to the Bars in the State of Illinois and the State of
Ohio. He is also a certified public accountant. He received a BS degree from Indiana University and a JD degree from Whittier
College School of Law.
Bernard J. Pitz joined us as Senior Vice President and Chief Financial Officer and Treasurer in November 2003. On February 17,
2005, we issued a press release and filed a Form 8-K to announce Mr. Pitz’s resignation, effective March 1, 2005. Effective March 1,
2005, (and on March 7, 2005 we filed a Form 8-K announcing this agreement) Mr. Pitz agreed that he would continue his employ-
ment with us through March 31, 2005 to assist us in the completion of the annual audit of our financial statements for the year-
ended December 31, 2004, including Sarbanes-Oxley compliance matters, and in the preparation and filing of our Annual Report
on Form 10-K for the year ended December 31, 2004. Prior to joining us, he served as Vice President of Finance for the worldwide
frequency control business at Corning Incorporated. Prior to Corning, he spent 15 years at Motorola beginning in corporate audit
and then progressing into positions of increasing responsibility in accounting and finance, including joint venture development in
Latin America. While living in Beijing, China he served as the Senior Division Controller of the Greater China Cellular Subscriber
Division. He started his career as an auditor for Touche Ross & Co. in Chicago, Illinois. He received his undergraduate degree in
accounting from Northern Illinois University and has passed the CPA examination. He holds an MBA from the University of Chicago
Graduate School of Business where he studied at both the Chicago campus and in Barcelona Spain.

Universal Electronics Inc. 2004 Annual Report 29
Selected Consolidated Financial Data
Year Ended December 31, 2 0 0 4 2 0 0 3 2 0 0 2 2 0 0 1 2 0 0 0
(in thousands, except per share data)
Net sales $ 158,380 $ 120,468 $ 103,891 $ 119,030 $ 124,740
Operating income $ 13,540 $ 8,573 $ 6,981 $ 16,009 $ 18,242
Net income $ 9,113 $ 6,267 $ 5,939 $ 11,286 $ 11,601
Earnings per share:
Basic $ 0.67 $ 0.46 $ 0.43 $ 0.82 $ 0.84
Diluted $ 0.65 $ 0.45 $ 0.42 $ 0.78 $ 0.78
Shares used in calculating
earnings per share:
Basic 13,567 13,703 13,790 13,844 13,743
Diluted 14,100 14,007 14,163 14,523 14,941
Gross margin 38.9% 38.4% 40.1% 41.2% 41.3%
Operating margin 8.6% 7.1% 6.7% 13.4% 14.6%
Selling, general, administrative,
research and development expenses
as a % of sales 30.3% 31.3% 33.4% 27.8% 26.7%
Net income as a % of sales 5.8% 5.2% 5.7% 9.5% 9.3%
Return on average assets 6.8% 5.5% 6.1% 12.0% 13.9%
Working capital $ 75,081 $ 82,191 $ 71,457 $ 67,422 $ 58,323
Ratio of current assets
to current liabilities 3.1 3.7 5.3 5.5 3.5
Total assets $ 140,285 $ 126,167 $ 100,016 $ 94,705 $ 93,766
Cash and cash equivalents $ 42,472 $ 58,481 $ 18,064 $ 14,170 $ 9,309
Short-term investments — — $ 22,500 $ 20,100 $ 11,500
Long-term debt — — $ 41 $ 104 $ 163
Stockholders’ equity $ 103,881 $ 95,171 $ 83,237 $ 79,702 $ 70,353
Book value per share (a) $ 7.66 $ 6.89 $ 6.17 $ 5.78 $ 5.10
Ratio of liabilities to liabilities
and stockholders’ equity 26.0% 24.6% 16.8% 15.8% 25.0%
(a) Book value per share is defined as stockholders’ equity divided by common shares issued, less treasury stock.
A factor that affected the comparability of information between 2002 and 2001 was our implementation of Statement of Financial Accounting Standards (“SFAS”) No.
142 on January 1, 2002, which requires that goodwill no longer be amortized. In addition, the comparability between 2004 and 2003 is affected by the acquisition of
SimpleDevices Inc. in the fourth quarter of 2004.
28 Universal Electronics Inc. 2004 Annual Report
Market for Registrant’s Common Equity, Related Stockholder Matters and Issuer Purchases of Equity Securities
Our common stock trades on the National Market of The NASDAQ Stock Market under the symbol UEIC.
The following table sets forth, for the periods indicated, the high and low reported sale prices for our common stock, as reported
on the National Market of The NASDAQ Stock Market:
2 0 0 4 2 0 0 3
High Low High Low
First Quarter $ 13.33 $ 12.26 $ 10.75 $ 9.01
Second Quarter 17.94 12.60 14.25 9.15
Third Quarter 18.80 14.57 14.00 11.00
Fourth Quarter 19.43 16.60 13.84 11.30
The following table sets forth, for the periods indicated, our total stock repurchases, average price paid per share, and the
maximum number of shares that may be purchased under our plans or programs:
Total Number of Maximum Number
Shares Purchased of Share May
as Part of Publicly Yet be Purchased
Total Number of Average Price Announced Plans Under the Plans
Period Shares Purchased Paid per Share or Programs or Programs
1/1/04 - 1/31/04 55,090 $ 12.99 55,090 1,399,174
2/1/04 - 2/29/04 76,000 12.72 76,000 1,323,174
3/1/04 - 3/31/04 162,200 12.73 162,200 1,160,974
4/1/04 - 4/30/04 69,900 13.00 69,900 1,091,074
5/1/04 - 5/31/04 68,600 14.18 68,600 1,022,474
6/1/04 - 6/30/04 3,500 14.55 3,500 1,018,974
7/1/04 - 7/31/04 — — — 1,018,974
8/1/04 - 8/31/04 — — — 1,018,974
9/1/04 - 9/30/04 10,517 16.36 10,517 1,008,457
10/1/04 - 10/31/04 — — — 1,008,457
11/1/04 - 11/30/04 — — — 1,008,457
12/1/04 - 12/31/04 49,191 17.15 49,191 959,266
Total 494,998 $ 13.53 494,998
We repurchased shares during the year ended December 31, 2004 under an ongoing systematic program to manage the dilution
created by shares issued under employee stock plans and also to return cash to stockholders. This program authorizes repur-
chases in the open market. During the year ended December 31, 2003 our Board of Directors authorized $1.5 million for future
repurchases of outstanding common stock. During the fourth quarter of 2004, we purchased 49,191 shares for an average
purchase price of $17.15.
Our stockholders of record on March 14, 2005 numbered approximately 105. We have never paid cash dividends on our
common stock, nor do we intend to pay any cash dividends on our common stock in the foreseeable future. We intend to retain
our earnings, if any, for the future operation and expansion of our business. In addition, the terms of our revolving credit facility
limit our ability to pay cash dividends on our common stock. See Management’s Discussion and Analysis of Financial Condition
and Results of Operations — Liquidity and Capital Resources” and Notes to Consolidated Financial Statements-Note 7.”

Universal Electronics Inc. 2004 Annual Report 31
We have developed a broad line of pre-programmed universal wireless control products and audio-video accessories that are
marketed to enhance home entertainment systems. Our channels of distribution include international retail, U.S. retail, private
label, OEMs, cable and satellite service providers, and companies in the computing industry. We believe that our universal remote
control database is capable of controlling virtually all infrared remote (“IR”) controlled TVs, VCRs, DVD players, cable converters,
CD players, audio components and satellite receivers, as well as most other infrared remote controlled devices worldwide.
Beginning in 1986 and continuing today, we have compiled an extensive library of over 168,000 IR codes that cover nearly
204,000 individual device functions and over 2,400 individual consumer electronic equipment brand names. Our library is
regularly updated with new IR codes used in newly introduced video and audio devices. All such IR codes are captured from the
original manufacturer’s remote control devices or manufacturer’s specifications to ensure the accuracy and integrity of the data-
base. We have also developed patented technologies that provide the capability to easily upgrade the memory of the wireless
control device by adding IR codes from the library that were not originally included.
Beginning in 2002, we began selling our Nevo® 1.0 software embedded on our chip to a third-party supplier of personal
digital assistant devices (PDAs). Nevo 2.0® was launched in July of 2004. Building on this platform, we expect to use Nevo 2.0®
technology in a new product named “NevoSL®” which we expect to ship in the second quarter of 2005. NevoSL® is a universal
controller that delivers complete audio, visual and Wi-Fi digital media control for the networked home.
From October 1, 2004 through December 31, 2004, we acquired over 99% of the outstanding shares of SimpleDevices, Inc.
(SimpleDevices) for approximately $12.8 million in cash, including direct acquisition costs, plus a performance-based payment of
our unregistered common stock to be paid in the future if certain financial objectives are achieved. This has not been reflected as
part of the purchase price as of December 31, 2004 since it is not probable that the performance metrics will be met.
The value we received from this acquisition relates primarily to SimpleDevices’ unique capabilities, as well as their complete
and in-process technology. SimpleDevices has developed connected-device technology solutions that link the home computer and
the Internet to existing consumer electronic devices in the home and car. The company provides Universal Plug and Play (UPnP)-
compatible software to transform common home devices into “connected” devices — that is, allow them to find, control and share
entertainment media across a home network. UPnP is an architecture for pervasive peer-to-peer network connectivity of intelli-
gent appliances, wireless devices, and PCs of all form factors. It is designed to bring standards-based connectivity to ad-hoc or
unmanaged networks whether in the home, in a small business, public spaces, or attached to the Internet. UPnP is a distributed,
open networking architecture that leverages TCP/IP and the Web technologies to enable seamless proximity networking in
addition to control and data transfer among networked devices in the home, office, and public spaces.
The following is a description of the significant research and development projects that were under development at the
acquisition date which comprised the aggregate IPR&D charge of $240,000:
SimpleWare™ Platforms SimpleWare™ Platforms include SimpleCenter™, SimpleDevice™, and SimpleSync™. These platforms
are core software products for SimpleDevices, Inc. These Platforms provide flexible, standards-based software development kits
and applications. The development kits enable OEMs to create customized device applications for different market demo-
graphics. SimpleWare™ Platform products and services include connected-device software, media server solutions, USB
hardware reference designs, and content service solutions. The SimpleWare™ Platforms had been introduced into the market,
were generating revenue, and had reached technological feasibility at the date of the acquisition, and were classified as
core/developed technology. The IPR&D related to SimpleWare™ Platforms includes research and development efforts underway
to significantly enhance certain features of this software. The associated IPR&D charge for this technology is $200,000.
SimpleWare Extensions SimpleWare™ Extensions include MediaShare, MediaSkins, MediaProvisioning, MediaExplorer, Digital
Rights Management, and Ripping. SimpleWare™ Extensions are add-ons to the core software products, SimpleWare™ Platforms.
The IPR&D related to SimpleWare™ Extensions includes research and development efforts underway to significantly enhance
certain features of these add-ons. The associated IPR&D charge for this technology is $40,000.
Management’s Discussion and Analysis and Financial Condition and Results of Operations
30 Universal Electronics Inc. 2004 Annual Report
Basis for In-Process R&D Valuation Assumptions
As noted above, the projects in development as of the acquisition date are expected to reach technological feasibility over a
period of approximately six to twelve months subsequent to the acquisition date. Cash flows from the sale of software incor-
porating these technologies are expected to extend through the year 2009 and are forecasted using a product life cycle approach.
Factors considered in estimating cash flows include historical margin levels, budgeted margin levels, the migration of the
acquired core/developed technology through subsequent advancements, the estimated life of the underlying technologies in
each of the products, and the value contribution estimated to be associated with the technology and industry norms. In
general, the estimated margins utilized in the valuation are reflective of the margins historically realized by SimpleDevices.
Also reflective of historical experience, the margins are expected to increase over the product life cycle. The expectation for
future selling, general and administrative expenses likewise are reflective of historical experience and the assumptions used
in SimpleDevices’ enterprise valuation model. Research and development costs were forecasted for each IPR&D project
based upon the costs required to bring the product to fruition and the additional costs associated with maintaining the
product technology.
The expected operating margins for the IPR&D were reduced for contributory assets, including assessments for capital
expenditures and working capital employed, as well as a return on both the tangible assets and the identified intangibles
valued in the purchase price allocation.
The free cash flows (net of the various charges discussed above) generated by the in-process technologies in future
periods were discounted to their net present value by applying a reasonable discount rate. The discount rate applied to the
individual technologies was 24%. This discount rate reflects a “risk premium” of 2% over the weighted average cost of
capital (WACC) of 22% computed for SimpleDevices. The WACC was determined based upon an analysis that considered
selected industry data. The WACC represents a blended, after-tax cost of debt and equity, and was calculated using a capital
asset pricing model.
Through the date of this report, there have been no events or changes in circumstances that suggest the assumptions
used in the valuation of the IPR&D were not reasonable. SimpleDevices has continued its development of the in-process
technologies and anticipates deploying these technologies in end-products in a timeframe and manner consistent with the
projections used for valuation purposes.
Identifiable Intangibles and Goodwill
As discussed above, a portion of the SimpleDevices purchase price was allocated to identifiable intangibles and goodwill .
Goodwill has an assigned value of approximately $7.1 million. The identifiable intangibles consist of core/developed tech-
nology, engineering service agreements and trademarks and trade names. As with the IPR&D, the values of these assets were
determined using a Future Income approach, in context of the business enterprise value of SimpleDevices.
The trademark and trade name assets were assigned values as of the acquisition date of approximately $840,000. These
assets will be amortized on a straight-line basis over their estimated useful lives of 10 years. The core/developed technology
and engineering service agreements assets were assigned values as of the acquisition date of approximately $1,630,000 and
$370,000, respectively. These assets will be amortized on a straight-line basis over their estimated useful lives of 5 years.
The matters discussed in this Annual Report should be read in conjunction with the consolidated financial statements.
Certain statements contained herein may constitute forward-looking statements within the meaning of the Private Securities
Litigation Reform Act of 1995. These statements involve a number of risks, uncertainties and other factors that could cause
actual results to differ materially, as discussed more fully herein. See “Factors That May Affect Financial Condition and Future
Results” in this Annual Report. In addition, more information about risk factors that could affect our business and financial
results is included in the section entitled “Factors That May Affect Financial Condition and Future Results” below.
Critical Accounting Policies and Estimates
The preparation of financial statements in conformity with accounting principles generally accepted in the United States of
America requires us to make estimates and judgments that affect the reported amounts of assets and liabilities, disclosure
of contingent assets and liabilities at the date of the financial statements and the reported amounts of revenues and ex-
penses during the reporting period. On an on-going basis, we evaluate our estimates and judgments, including those related
to revenue recognition, allowance for sales returns and doubtful accounts, warranties, inventory valuation, business combi-
nation purchase price allocations, review for impairment of long-lived assets, intangible assets and goodwill , and income
taxes. Actual results may differ from the estimates. These estimates may be adjusted as more information becomes available
and any adjustment could be significant.

Universal Electronics Inc. 2004 Annual Report 33
We believe the following critical accounting policies affect our more significant judgments and estimates used in the pre-
paration of our consolidated financial statements.
Revenue recognition We recognize revenue on the sale of products and services when delivery has occurred (title and risk of
loss have passed to the customer), there is persuasive evidence of an arrangement, the sales price is fixed or determinable,
and collectibility is reasonably assured. We record a provision for estimated sales returns and allowances on product sales in
the same period as the related revenues are recorded. The provision for sales returns requires significant estimates and judg-
ment. These estimates are based on historical sales returns, analysis of credit memo data and other known factors. The pro-
vision recorded for estimated sales returns and allowances is deducted from gross sales to arrive at net sales in the period the
related revenue is recorded. Sales allowances reduce gross accounts receivable to arrive at accounts receivable, net in the
same period the related receivable is recorded.
We recognize revenue and profit as work progresses on long-term, fixed price contracts using the percentage-of-completion
method which requires significant judgment and estimates by management as to the extent of progress towards completion
of the contract. When applying the percentage-of-completion method, we rely on estimates of total expected contract revenue
and labor hours. We follow this method because reasonably dependable estimates of the revenue and labor applicable to various
stages of a contract can be made. Recognized revenue and profit are subject to revisions as the contract progresses to com-
pletion. Revisions to revenue and profit estimates are charged to income in the period in which the facts that give rise to the
revision become known and losses are accrued when identified.
Accounts receivable We maintain allowances for doubtful accounts for estimated losses resulting from the inability of our
customers to make required payments. We specifically analyze accounts receivables and historical bad debts, customer credit,
current economic trends and changes in customer payment trends when evaluating the adequacy of the allowance for doubtful
accounts. If the financial condition of our customers were to deteriorate, resulting in an impairment of their ability to make
payments, additional allowances may be required.
Inventories Inventories consist of wireless control devices, including universal remote controls, wireless keyboards, antennas, and
related component parts (including integrated circuits) and are valued at the lower of cost or market. Cost is determined using the
first-in, first-out method. We carry inventory in amounts necessary to satisfy certain of our customers’ inventory requirements on a
timely basis. New product innovations and technological advances may shorten a given product’s life cycle. We continually monitor
the inventory status to control inventory levels and dispose of any excess or obsolete inventories on hand. We write down our in-
ventory for estimated obsolescence or unmarketable inventory equal to the difference between the cost of inventory and the
estimated market value based upon our best estimates about future demand and market conditions. If actual market conditions
are less favorable than those projected by management, additional inventory write-downs may be required.
Business Combinations We are required to allocate the purchase price of acquired companies to the tangible and intangible
assets acquired and liabilities assumed, as well as IPR&D, based on their estimated fair values. The total purchase price of
SimpleDevices, which was approximately $12.8 million, including direct acquisition costs, has been allocated to the net assets
acquired based on estimated fair values. Such valuations require management to make significant estimates and assumptions,
especially with respect to intangible assets. The significant purchased intangible assets recorded by us include customer con-
tracts, developed and core technology and trade names. The fair values assigned to the identified intangible assets are discussed
in detail in Note 20 to the Consolidated Financial Statements.
Critical estimates in valuing certain intangible assets include but are not limited to: future expected cash flows from customer
contracts, customer lists, distribution agreements, and acquired developed technologies and patents; expected costs to develop
IPR&D into commercially viable products and estimating cash flows from projects when completed, brand awareness and market
position, as well as assumptions about the period of time the brand will continue to be used in our product portfolio, and dis-
count rates. Our estimates of fair value are based upon assumptions believed to be reasonable, but which are inherently un-
certain and unpredictable and, as a result, actual results may differ from estimates.
32 Universal Electronics Inc. 2004 Annual Report
Valuation of long-lived assets and other intangible assets We assess the impairment of long-lived assets and other intangible
assets whenever events or changes in circumstances indicate that their carrying value may not be recoverable. Factors con-
sidered important which could trigger an impairment review include the following: (1) significant underperformance relative to
historical or projected future operating results; (2) significant changes in the manner of our use of the assets or strategy for
our overall business; (3) significant negative industry or economic trends; (4) significant decline in our stock price for a
sustained period; and (5) a significant variance between our market capitalization relative to net book value. When we deter-
mine that the carrying value may not be recoverable based upon the existence of one or more of the above indicators of
impairment, and based on the carrying value of the asset being more than the undiscounted cash flows, we measure an
impairment based on the projected discounted cash flow method using a discount rate determined by our management to be
commensurate with the risk inherent in our current business model. In assessing the recoverability, we must make assumptions
regarding estimated future cash flows and other factors to determine the fair value of the respective assets. If these estimates
or their related assumptions change in the future, we may be required to record impairment charges not previously recorded.
Goodwill We evaluate the carrying value of goodwill as of December 31 of each year and between annual evaluations if
events occur or circumstances change that would more likely than not reduce the fair value of the reporting unit below its
carrying amount. Such circumstances could include, but are not limited to: (1) a significant adverse change in legal factors or
in business climate, (2) unanticipated competition, or (3) an adverse action or assessment by a regulator. In performing the
impairment review, we determine the carrying amount of each reporting unit by assigning assets and liabilities, including the
existing goodwill, to those reporting units. A reporting unit is defined as an operating segment or one level below an operating
segment (referred to as a component). A component of an operating segment is deemed a reporting unit if the component
constitutes a business for which discrete financial information is available and segment management regularly reviews the
operating results of that component. To evaluate whether goodwill is impaired, we compare the fair value of the reporting unit
to which the goodwill is assigned to the reporting unit’s carrying amount, including goodwill . We determine the fair value of
each reporting unit using the present value of expected future cash flows for that reporting unit. If the carrying amount of a
reporting unit exceeds its fair value, then the amount of the impairment loss must be measured. The impairment loss would be
calculated by comparing the implied fair value of reporting unit goodwill to its carrying amount. In calculating the implied fair
value of reporting unit goodwill, the fair value of the reporting unit is allocated to all of the other assets and liabilities of that
unit based on their fair values. The excess of the fair value of a reporting unit over the amount assigned to its other assets and
liabilities is the implied fair value of goodwill. An impairment loss would be recognized when the carrying amount of goodwill
exceeds its implied fair value.
Income Taxes As part of the process of preparing our consolidated financial statements, we estimate our income taxes in
each of the taxing jurisdictions in which we operate. This process involves estimating our actual current tax expense together
with assessing any temporary differences resulting from the different treatment of certain items, such as the timing for recog-
nizing expenses, for tax and financial reporting purposes. These differences may result in deferred tax assets and liabilities,
which are included in our consolidated balance sheet. We are required to assess the likelihood that our deferred tax assets,
which include net operating loss carryforwards and temporary differences that are expected to be deductible in future years, will
be recoverable from future taxable income or other tax planning strategies. If recovery is not likely, we must provide a valuation
allowance based on our estimates of future taxable income in the various taxing jurisdictions, and the amount of deferred taxes
that are ultimately realizable. The provision for tax liabilities involves evaluations and judgments of uncertainties in the interpre-
tation of complex tax regulations by various taxing authorities. In situations involving tax related uncertainties, we provide for
deferred tax liabilities when we believe such liabilities are probable. Actual results could differ from our estimates.

Universal Electronics Inc. 2004 Annual Report 35
Results of Operations
The following table sets forth our results of operations expressed as a percentage of net sales for the periods indicated.
Year Ended December 31, 2 0 0 4 2 0 0 3 2 0 0 2
Net sales 100.0% 100.0% 100.00%
Cost of sales 61.1 61.6 59.9
Gross profit 38.9 38.4 40.1
Research and development expenses 3.7 3.9 4.3
Selling, general and administrative expenses 26.6 27.4 29.1
Operating income 8.6 7.1 6.7
Interest income 0.5 0.5 0.6
Other income (expense), net (0.4) 0.3 0.2
Income before income taxes 8.7 7.9 7.5
Provision for income taxes 2.9 2.7 1.8
Net income 5.8% 5.2% 5.7%
Year Ended December 31, 2004 Compared to Year Ended December 31, 2003
Consolidated Net sales for the year ended December 31, 2004 were $158.4 million, an increase of 31% compared to
$120.5 million for the same period last year. Net income for 2004 was $9.1 million or $0.67 per share (basic) and $0.65
per share (diluted) compared to $6.3 million or $0.46 per share (basic) and $0.45 per share (diluted) for 2003.
Net sales in our business lines (subscription broadcasting, OEM, and computing companies) were approximately 62% of
net sales for 2004 compared to 58% for 2003. Net sales in our business lines for 2004 increased by 40% to $97.6 million
from $69.7 million in 2003. Net sales to subscription broadcasting service providers and OEMs for 2004 increased by 40%
to $96.6 million from $68.9 million in 2003. The increase in sales resulted from an increase in the volume of remote control
sales, which was partially offset by lower prices. The increase in volume was attributable to the continued deployment of
advanced function set-top boxes by service operators. These advanced functions include personal video recording (PVR),
video-on-demand (VOD), and high definition (HD) television. We expect that the deployment of advanced function set-top
boxes by service operators will continue into the foreseeable future as penetration for each of the functions cited
continues to increase.
Net sales in our consumer lines (One For All® international retail, private label, and direct import) accounted for approxi-
mately 38% of net sales for 2004 compared to 42% for 2003. Our net sales for 2004 from our consumer lines were $60.8
million, an increase of 20% from net sales of $50.8 million in 2003. Of this increase, One For All® international retail sales for
2004 increased by 39% to $50.8 million from $36.6 million in 2003. About $4.5 million of this increase was related to favorable
foreign exchange rate movements, as both the Euro and British Pound strengthened compared to the U.S. Dollar. The remaining
improvement in international retail sales was due to an increase in sales of our Sky-branded digital accessories, One For All®
remote controls, and audio-video accessories. Private label sales for 2004 decreased by 27% to $6.8 million from $9.3 million
in 2003 due to a decline in the volume of Kameleon sales. United States direct import licensing and product revenues for 2004
decreased by 33% to $3.2 million from $4.8 million in 2003 due to a decline in the volume of Kameleon sales. We expect that
sales in our consumer lines will continue to be driven by strength in international retail sales.
Gross profit for 2004 was $61.6 million compared to $46.3 million for 2003. Gross profit as a percent of sales for 2004
was 38.9% compared to 38.4% for 2003. The increase is primarily attributable to the strengthening of the Euro and British
Pound compared to the U.S. Dollar, which resulted in an increase of approximately $4.1 million profit and added 1.5% to the
gross profit rate. This increase was partially offset by increased inventory write-downs of $0.9 million which contributed to a
0.5% reduction in the gross profit rate. In addition, the increase in gross profit rate was partially offset by OEM sales, which
generally have a lower gross profit rate, being a larger percentage of our total business. We expect gross profit rates to
remain near recent levels in 2005.
34 Universal Electronics Inc. 2004 Annual Report
Research and development expenses increased 25% from $4.7 million in 2003 to $5.9 million in 2004. The increase is
related to our continued expansion of the Nevo® platform, and the development of audio-video accessories for sale in our retail
channel. In addition, IPR&D of $0.2 million related to the SimpleDevices acquisition was expensed in the fourth quarter of
2004. We expect research and development expense to continue in an upward trend in 2005.
Selling, general and administrative expenses increased 28% from $33.0 million in 2003 to $42.2 million in 2004. Approxi-
mately $2.3 million of this increase was attributable to Sarbanes-Oxley compliance efforts, $1.7 million to appreciation of the
Euro relative to the U.S. Dollar, $1.5 million to increased performance-based employee bonuses, $0.9 million to the acquisition
of SimpleDevices, $0.8 million to freight costs, and $0.7 million to non-Sarbanes-Oxley related professional services costs. We
expect that selling, general and administrative expenses will increase from 2004 levels during 2005 due in part to the full-year
impact of SimpleDevices and an increase in variable expenses related to increased sales volume.
In 2004, we recorded $0.7 million of interest income compared to $0.6 million for 2003. This increase is due to higher
money market rates in Europe, an investment in a certificate of deposit, and a higher average cash balance.
In 2004, other expense, net was $0.5 million as compared to $0.3 million of other income, net for 2003. Approximately $0.4
million of expense was the result of our write-down of an investment in a private company, and $0.2 million of expense resulted
from foreign currency exchange losses. The results for 2003 included a foreign currency exchange gain of $0.3 million.
We recorded income tax expense of $4.6 million in 2004 compared to $3.2 million in 2003. Our estimated effective tax
rate was 33.6% in 2004, and 34.0% in 2003. We expect that our tax rate will rise in 2005 to around 36% as a larger per-
centage of profits are earned in higher tax rate countries.
SimpleDevices, Inc. Transaction
We accounted for the acquisition of SimpleDevices by the purchase method of accounting. As a result, we allocated the
purchase price of the acquisition based on the fair value of the assets acquired and the l iabil it ies assumed. Significant
portions of the SimpleDevices purchase price were identified as intangible assets. We employed valuation techniques
which reflect guidance from the American Institute of Certified Public Accountants’ Practice Aid Series entitled “Assets
Acquired in a Business Combination to Be Used in Research and Development Activities: A Focus on Software, Electronic
Devices, and Pharmaceutical Industries” on approaches and procedures to be followed in developing allocations to ac-
quired in-process research and development (“IPR&D”).
The final purchase price allocation includes our identification of $240 thousand of IPR&D. This allocation represents
the estimated fair value, based upon risk-adjusted cash flows, of SimpleDevices’ IPR&D projects. At the date of acquisition,
the development of these projects had not yet reached technological feasibility and the IPR&D had no alternative future
uses. Accordingly, we expensed these costs as research and development in the quarter ended December 31, 2004. The
remaining SimpleDevices purchase premium was al located to identif iable intangibles, which are being amortized over
various periods ranging from 5 to 10 years, as well as goodwill .
SimpleDevices recorded net sales of $0.8 million and a pretax loss of $0.5 million during the period between October 1,
2004 (acquisition date) and December 31, 2004. Sales consisted primarily of engineering services related to the develop-
ment of hardware utilized by SimpleDevices’ customers to run the SimplePlatforms software. In addition, SimpleDevices also
generated revenue customizing their software products to customers’ specific needs. Sales attributable to SimpleDevices are
included in our Business category when we discussed consolidated results. The results of SimpleDevices have been included
since the date of acquisition and are described below.
Gross profit was $0.3 million, or 39.5% of sales.
Research and development expenses were $0.2 million, which represents the expensing of in-process technology as a result
of the acquisition.
Selling, general and administrative expenses were $0.6 mill ion, which consisted primarily of engineering payroll and
benefits costs.
We anticipate that sales generated as a result of software customization and engineering services will begin to decline as
a percent of total sales as software licensing fees and the associated maintenance fees begin to increase. We also anticipate
that gross profit and gross profit as a percent of sales will increase as this shift occurs.

Universal Electronics Inc. 2004 Annual Report 37
Year Ended December 31, 2003 Compared to Year Ended December 31, 2002
Net sales for the year ended December 31, 2003 were $120.5 mill ion, an increase of 16% over the net sales of $103.9
million for the same period last year. Net income for 2003 was $6.3 million or $0.46 per share (basic) and $0.45 per share
(diluted) compared to $5.9 million or $0.43 per share (basic) and $0.42 per share (diluted) for 2002.
Net sales in our business lines (subscription broadcasting and OEM) increased by $1.7 million, or 2.5%, to $69.7 million in
2003 from $68.0 million in 2002. Net sales to subscription broadcasting service providers and OEMs increased by $4.3 million,
or 6.6%, to $68.9 million in 2003 from $64.6 million in 2002. Direct and OEM sales to subscription broadcasting service pro-
viders in the United States and in Europe, where additional geographic penetration was achieved, accounted for a significant
portion of the increase. Net sales in the business lines were approximately 58% of net sales in 2003 compared to 65% in 2002.
Net sales from the consumer lines (One For All® international retail , private label, and direct import) increased $14.9
million, or 42%, to $50.8 million in 2003 from $35.9 million in 2002. Of this increase, the One For All® international retail
sales increased $9.3 million, or 34%, to $36.6 million in 2003 from $27.3 million in 2002. Reasons for the increase included
Sky branded retail products sold in the U.K., Kameleon sales (particularly in Germany and Spain) and appreciation of the Euro
relative to the U.S. dollar. Private label sales increased by $2.1 million, or 29%, to $9.3 million in 2003 from $7.2 million in
2002 due to the success of the Kameleon product line which was introduced in late 2002. United States direct import
licensing and product revenues increased by $3.4 million or 250% to $4.8 million in 2003 from $1.4 million in 2002 due to
the success of the Kameleon product line which was introduced into this channel in early 2003. Net sales in the consumer
lines accounted for approximately 42% of total 2003 net sales compared to 35% in 2002.
Gross profit was $46.3 million or 38.4% of net sales in 2003 as compared to $41.7 million or 40.1% of net sales in 2002.
Gross profit as a percent of sales in 2003 was lower primarily due to price pressure in the subscription broadcasting service
line, which resulted from consolidation within the industry. Other factors contributing to the decline in the gross profit percen-
tage included changes in mix and inventory write-downs which included $0.4 million related to the Mosaic product line in the
fourth quarter of 2003.
Research and development expenses increased to $4.7 million in 2003 from $4.5 million in 2002, primarily due to general
cost increases. Resources have been realigned from core technology to advanced technology products, thus allowing a greater
investment in future products while holding overall expenses relatively constant. Total research and development expenditures
are expected to increase more significantly in 2004.
Selling, general and administrative expenses increased to $33.0 million in 2003 from $30.2 million in 2002. Of this in-
crease, $1.3 million was attributable to increased employee bonuses. Other increases were related to the appreciation of the
Euro relative to the U.S. dollar and costs associated with changes in staffing such as severance, recruiting, and relocation.
Other income, net increased to $0.3 million in 2003 from $0.2 million in 2002. The increase was attributable to an increase
in the gain on foreign currency transactions of $0.3 million offset by a patent settlement of $0.2 million that occurred in 2002.
Income tax expense increased to $3.2 million in 2003 from $1.9 million in 2002. The increase in the effective tax rate to 34%
in 2003 from 24% in 2002 is primarily related to a decrease in research and development credits in 2003 as compared to 2002.
Liquidity and Capital Resources
Our principal sources of funds are from operations. Cash provided by operating activities for 2004 was $4.0 million as com-
pared to $19.2 million in 2003. The decrease in cash flow from operations is primarily due to an increase in accounts receivable
and accounts payable as well as accrued expenses increasing by a lesser amount in 2004 as compared to 2003 offset partially
by the increase in net income.
On October 1, 2004, we acquired SimpleDevices for approximately $12.8 million in cash including direct acquisition costs,
plus a potential performance-based payment of our unregistered common stock to be paid in the future if certain future
financial objectives are achieved, which has not been reflected as part of the purchase price as of December 31, 2004 since it
is not probable the objectives will be met.
Capital expenditures in 2004, 2003, and 2002 were $2.7 million, $2.5 million, and $2.1 million, respectively. Annual capital
expenditures relate primarily to acquiring product tooling each year. We are currently evaluating our existing and future infor-
mation system requirements, and may make a significant investment to upgrade our systems in 2005.
During the second quarter of 2002, we completed an acquisition of certain multimedia protocol technologies from a soft-
ware development company for $0.8 million. These technologies enable custom wireless control solutions for home entertain-
ment hardware and software applications.
36 Universal Electronics Inc. 2004 Annual Report
In September, 2003, we terminated our $15.0 million unsecured revolving credit agreement with Bank of America National
Trust and Savings Association. On September 15, 2003, we entered into a three-year $15.0 million unsecured revolving credit
agreement (the “Credit Facility”) with Comerica Bank (“Comerica”). Under the Credit Facility with Comerica, the interest payable
is variable and is based on the bank’s cost of funds or the LIBOR rate plus a fixed margin of 1.25%. The interest rate in effect
as of December 31, 2004 using the LIBOR Rate option plus a fixed margin of 1.25% was 3.67%. We pay a commitment fee
ranging from zero to a maximum rate of 1/4 of 1% per year on the unused portion of the credit line depending on the amount
of cash investment retained with Comerica during each quarter. Under the terms of this Credit Facility, dividend payments are
allowed up to 100% of net income of the prior fiscal year period to be paid within 90 days of such prior year, and we are subject
to certain financial covenants related to our net worth, quick ratio, and net income. Amounts available for borrowing under this
Credit Facility are reduced by the outstanding balance of import letters of credit. As of December 31, 2004, we had no amounts
outstanding under this credit facility and no outstanding import letters of credit. Furthermore, as of December 31, 2004, we
are in compliance with all financial covenants required by the Credit Facility.
In 2004 we purchased 494,998 shares of our common stock at a cost of $6,695,130. We purchased 84,437 and 584,845
shares of our common stock in open market purchases in 2003 and 2002, respectively, at a cost of $963,168 and $5,273,611,
respectively. We hold these shares as treasury stock, and they are available for reissue by us. Presently, except for using a
small number of these treasury shares to compensate our outside board members, we have no plans to distribute these shares,
although we may change these plans if necessary to fulfil l our on-going business objectives. We have authority under the
Credit Facility to acquire up to 1,500,000 shares of our common stock in market purchases. Between the date of execution of
the Credit Facility and December 31, 2004, we have purchased 540,734 shares of our common stock leaving 959,266 remaining
shares authorized for purchase under the credit facility. In 2005 we may continue to purchase shares of our common stock if
conditions are favorable.
During 2004, we received proceeds of approximately $1,885,000 from the exercise of stock options granted to our employees,
as compared to approximately $3,343,000 and $1,334,000 during 2003 and 2002, respectively.
Historically, our working capital needs have typically been greatest during the third and fourth quarters when accounts
receivable and inventories increase in connection with the fourth quarter holiday selling season. At December 31, 2004,
we had $75.1 mill ion of working capital as compared to $82.2 at December 31, 2003. The decrease in working capital
during these periods is principally due to the cash purchase of SimpleDevices. The following summarizes our obligations at
December 31, 2004 and the effect such obligations are expected to have on our liquidity and cash flow in future periods.
Payments Due by Period
December 31, 2004 (In thousands) Total Less Than 1 year 1-3 years 4-5 years After 5 years
Contractual Obligations
Long-Term Debt $ — $ — $ — $ — $ —
Capital Lease Obligations — — — — —
Operating Lease Obligations 3,285 1,442 1,379 464 —
Purchase Obligations — 1,245 — — —
Other Obligations — — — — —
Total $ 3,285 $ 2,687 $ 1,379 $ 464 $ —
At December 31, 2004, we did not have any bank guarantees that provided for payment by the bank to our suppliers in the
event of non-payment for transactions with suppliers in the ordinary course of business.
It is our policy to carefully monitor the state of our business, cash requirements, and capital structure. We believe that
funds generated from our operations and available from our borrowing facility will be sufficient to fund current business
operations as well as anticipated growth at least through the end of 2005; however, there can be no assurance that such
funds will be adequate for that purpose.

Universal Electronics Inc. 2004 Annual Report 39
New Accounting Pronouncements
In May 2003, the FASB issued SFAS No. 150, “Accounting for Certain Financial Instruments with Characteristics of both
Liabilities and Equity”. SFAS 150 establishes new standards for how an issuer classifies and measures certain financial in-
struments with characteristics of both liabilities and equity. SFAS 150 is effective for financial instruments entered into or
modified after May 31, 2003 and otherwise is effective at the beginning of the first interim period beginning after June 15,
2003, except for certain mandatorily redeemable non-controlling interests. The adoption of SFAS 150 did not have a material
effect on our financial position, results of operations, or cash flows.
In November 2004, the FASB issued SFAS No. 151, “Inventory Costs — An Amendment of ARB No. 43, Chapter 4” (“SFAS
151”). SFAS 151 amends the guidance in ARB No. 43, Chapter 4, “Inventory Pricing,” to clarify the accounting for abnormal
amounts of idle facility expense, freight, handling costs, and wasted material (spoilage). Among other provisions, the new rule
requires that items such as idle facility expense, excessive spoilage, double freight, and rehandling costs be recognized as
current-period charges regardless of whether they meet the criterion of “so abnormal” as stated in ARB No. 43. Additionally,
SFAS 151 requires that the allocation of fixed production overheads to the costs of conversion be based on the normal capacity
of the production facilities. SFAS 151 is effective for fiscal years beginning after June 15, 2005, and we are required to adopt
this standard in the fourth quarter of 2005, beginning on October 1, 2005. We are currently evaluating the effect that the
adoption of SFAS 151 will have on our consolidated results of operations and financial condition, but do not expect SFAS 151
to have a material impact.
In December 2004, the FASB issued SFAS No. 153, “Exchanges of Nonmonetary Assets — An Amendment of APB Opinion
No. 29, Accounting for Nonmonetary Transactions” (“SFAS 153”). SFAS 153 eliminates the exception from fair value measurement
for nonmonetary exchanges of similar productive assets in paragraph 21(b) of APB Opinion No. 29, “Accounting for Nonmonetary
Transactions,” and replaces it with an exception for exchanges that do not have commercial substance. SFAS 153 specifies
that a nonmonetary exchange has commercial substance if the future cash flows of the entity are expected to change signifi-
cantly as a result of the exchange. SFAS 153 is effective for the fiscal periods beginning after June 15, 2005 and we are
required to adopt the standard in the fourth quarter of 2005, beginning on October 1, 2005. We are currently evaluating the
effect that the adoption of SFAS 153 will have on our consolidated results of operations and financial condition, but do not
expect it to have a material impact.
In December 2004, the FASB issued SFAS 123R, “Share Based Payment”. SFAS 123R requires companies to expense the
value of stock options and similar awards. This statement is a revision of SFAS 123, “Accounting for Stock-Based Compensation”
and supersedes APB Opinion No. 25, “Accounting for Stock Issued to Employees”, and its related implementation guidance.
SFAS 123R requires a public entity to measure the cost of employee services received in exchange for an award of equity
instruments based on the grant-date fair value of the award (with limited exceptions). That cost will be recognized over the
period during which an employee is required to provide service in exchange for the award — the requisite service period (usually
the vesting period). No compensation cost is recognized for equity instruments for which employees do not render the requisite
service. SFAS 123R will significantly change existing accounting practice and will have a material effect on our reported earnings.
SFAS 123R is effective as of the beginning of the first Annual period that begins after June 15, 2005, with early adoption en-
couraged. The pro forma disclosures previously permitted under SFAS 123 will no longer be an alternative to financial state-
ment recognition. We are required to adopt SFAS 123R in our first quarter of fiscal 2006, beginning January 1, 2006. Under
SFAS 123R, we must determine the appropriate fair value model to be used for valuing share-based payments, the amortiza-
tion method for compensation cost, and the transition method to be used at date of adoption. The transition methods include
prospective and retroactive adoption options. Under the retroactive options, prior periods may be restated either as of the beginning
of the year of adoption or for all periods presented. The prospective method requires that compensation expense be recorded
for all unvested stock options and restricted stock at the beginning of the first quarter of adoption of SFAS 123R, while the
retroactive methods would record compensation expense for all unvested stock options and restricted stock beginning with the
first period restated. We are evaluating the requirements of SFAS 123R, and we expect that the adoption of SFAS 123R will have
a material impact on our consolidated results of operations and earnings per share. We have not yet determined the method of
adoption or the effect of adopting SFAS 123R, and we have not determined whether the adoption will result in amounts that are
similar to the current pro forma disclosures under SFAS 123.
38 Universal Electronics Inc. 2004 Annual Report
Factors That May Affect Financial Condition and Future Results
Forward Looking Statements We caution that the following important factors, among others (including but not limited to factors
discussed below or above in the “Management’s Discussion and Analysis of Financial Condition and Results of Operations,” as well
as those factors discussed elsewhere in this Annual Report, or in our other reports filed from time to time with the Securities and
Exchange Commission), could affect our actual results and could contribute to or cause our actual consolidated results to differ
materially from those expressed in any of our forward-looking statements. The factors included here are not exhaustive. Further,
any forward-looking statement speaks only as of the date on which such statement is made, and we undertake no obligation to
update any forward-looking statement to reflect events or circumstances after the date on which such statement is made or to
reflect the occurrence of unanticipated events. New factors emerge from time to time, and it is not possible for management to predict
all such factors, nor can we assess the impact of each such factor on the business or the extent to which any factor, or combina-
tion of factors, may cause actual results to differ materially from those contained in any forward-looking statements. Therefore,
forward-looking statements should not be relied upon as a prediction of actual future results.
While we believe that the forward looking statements made in this report are based on reasonable assumptions, the actual
outcome of such statements is subject to a number of risks and uncertainties, including the failure of our markets to continue
growing and expanding in the manner we anticipated; the failure of our customers to grow and expand as we anticipated; the
effects of natural or other events beyond our control, including the effect a war or terrorist activities may have on the Company
or the economy; the economic environment’s effect on us and our customers; the growth of, acceptance of and the demand for
our products and technologies in various markets and geographical regions, including cable, satellite, consumer electronics,
retail and interactive TV and home automation, not materializing as we believed; our inability to add profitable complementary
products which are accepted by the marketplace; our inability to continue to maintain our operating costs at acceptable levels
through our cost containment efforts; our inability to realize tax benefits from various tax projects initiated from time to time;
our inability to maintain the strength of our balance sheet; our inability to continue selling our products or licensing our tech-
nologies at higher or profitable margins; the failure of the various markets and industries to grow or emerge as rapidly or as
successfully as we believed; the lack of continued growth of our technologies and product lines addressing the market for
digital media; our inability to obtain orders or maintain our order volume with new and existing customers; the possible dilutive
effect our stock option program may have on our earnings per share and stock price; our inability to continue to obtain adequate
quantities of component parts or secure adequate factory production capacity on a timely basis; and other factors listed from
time to time in our press releases and filings with the Securities and Exchange Commission.
Dependence upon Key Suppliers Most of the components used in our products are available from multiple sources; however,
we have elected to purchase integrated circuit components used in our products, principally our wireless control products,
and certain other components used in our products, from two main sources, each of which provides in excess of ten percent
(10%) of the microprocessors used in our products. We have identified alternative sources of supply for these integrated
circuit components. However, there can be no assurance that we will be able to continue to obtain these components on
a timely basis. We generally maintain some inventories of our integrated chips, which could be used in part to mitigate, but
not eliminate, delays resulting from supply interruptions. An extended interruption, shortage or termination in the supply of any
of the components used in our products, or a reduction in their quality or reliability, or a significant increase in prices of com-
ponents, would have an adverse effect on our business, results of operations and cash flows.
Dependence on Foreign Manufacturing Third-party manufacturers located in foreign countries manufacture a majority of
our wireless controls. Our arrangements with our foreign manufacturers are subject to the risks of doing business abroad,
such as import duties, trade restrictions, work stoppages, political instability, foreign currency exchange rate fluctuations,
and other factors, which could have a material adverse effect on our business, results of operations and cash flows. We
believe that the loss of any one or more of our manufacturers would not have a long-term material adverse effect on our
business, results of operations and cash flows, because numerous other manufacturers are available to fulfill our require-
ments; however, the loss of any of our major manufacturers could adversely affect our business until alternative manufacturing
arrangements are secured.

Universal Electronics Inc. 2004 Annual Report 41
Potential Fluctuations in Quarterly Results Our quarterly financial results may vary significantly depending primarily upon
factors such as the timing of significant orders, the timing of our new product offerings and those of our competitors and the
loss or acquisition of any significant customers. Historically, our business has been influenced by the retail sales cycle, with
increased sales in the last half of the year and the largest proportion of sales occurring in the last quarter. Factors such as
quarterly variations in financial results could adversely affect the market price of our common stock and cause it to fluctuate
substantially. We (i) may from time to time increase our operating expenses to fund greater levels of research and development,
increase our sales and marketing activities, develop new distribution channels, improve our operational and financial systems
and broaden our customer support capabilities; (ii) may incur significant operating expenses associated with any new acquisi-
tions; and (iii) may incur significant operating expenses in our efforts to comply with various government regulations. To the
extent such expenses precede or are not subsequently followed by increased revenues, our business, operating results,
financial condition and cash flows will be materially adversely affected.
We may experience significant fluctuations in future quarterly operating results that may be caused by many factors, in-
cluding demand for products, introduction or enhancement of products by us and our competitors, the loss or acquisition of
any significant customers, market acceptance of new products, price reductions by us or our competitors, mix of distribution
channels through which products are sold, level of product returns, mix of customers and products sold, component pricing,
mix of international and domestic revenues, foreign currency exchange rate fluctuations and general economic conditions.
In addition, as a strategic response to changes in the competitive environment, we may from time to time make certain pricing or
marketing decisions or acquisitions that could have a material adverse effect on our business, results of operations or financial
condition. As a result, we believe period-to-period comparisons of our results of operations are not necessarily meaningful and
should not be relied upon as an indication of future performance.
Due to all of the foregoing factors, it is likely that in some future quarters our operating results will be below the expectations of
public market analysts and investors. In such event, the price of our common stock would likely be materially adversely affected.
Dependence on Consumer Preference We are susceptible to fluctuations in our business based upon consumer demand for
our products. We believe that our success depends in substantial part on our ability to anticipate, gauge and respond to such
fluctuations in consumer demand. However, it is impossible to predict with complete accuracy the occurrence and effect of any
such event that will cause such fluctuations in consumer demand for our products. Moreover, we caution that any increases in
sales or growth in revenue that we achieve may be transitory and should by no means be construed to mean that such increases
or growth will continue.
Demand for Consumer Service and Support We have continually provided domestic and international consumer service and
support to our customers to add overall value and to help differentiate us from our competitors. In March 2003, our largest
customer notified us that as a result of a merger, it would conduct all of its consumer service and support activities internally
and cease using our services commencing the second quarter of 2003. Consequently, revenue for consumer service and support
from this customer has ceased. In light of this, we have reviewed our domestic service and support group and are marketing our
expertise in this area to other potential customers. To date, we have not obtained any new customers, and there can be no as-
surance that we will be able to attract new customers in the future. In addition, if other customers decide to cease using this
service, we would be unable to offset costs associated with providing this service, resulting in a significant adverse effect on
our financial condition, results of operations and cash flows.
Dependence Upon Timely Product Introduction Our ability to remain competitive in the wireless control products market will
depend in part upon our ability to successfully identify new product opportunities and to develop and introduce new products
and enhancements in a timely and cost effective basis. There can be no assurance that we will be successful in developing
and marketing new products or in enhancing our existing products, or that such new or enhanced products will achieve con-
sumer acceptance, and, if achieved, will sustain that acceptance, that products developed by others will not render our products
non-competitive or obsolete or that we will be able to obtain or maintain the rights to use proprietary technologies developed
by others which are incorporated in our products. Any failure to anticipate or respond adequately to technological develop-
ments and customer requirements, or any significant delays in product development or introduction, could have a material
adverse effect on our Company’s financial condition, results of operations and cash flows.
In addition, the introduction of new products may require the expenditure of a significant amount of funds for research and
development, tooling, manufacturing processes, inventory and marketing. In order to achieve high volume production of any
new product, we may have to make substantial investments in inventory and expand our production capabilities.
Dependence on Major Customers The economic strength and weakness of our worldwide customers affect our performance.
We sell our wireless control products and proprietary technologies to private label customers, original equipment manufacturers,
and companies involved in the subscription broadcasting industry. We also supply our products to our wholly owned, non-U.S.
subsidiaries and to independent foreign distributors, who in turn distribute our products worldwide, within Europe, Asia, South
Africa, Australia, and Argentina currently representing our principal foreign markets. During 2004 and 2003, we had sales to
one customer that amounted to more than ten percent of our net sales for the respective period. In addition, for the same periods,
we had sales to a customer and its sub-contractors, that when combined, exceeded 10% of net sales for the respective period.
The future loss of these customers or any key customer, either in the United States or abroad, due to the financial weakness
or bankruptcy of any such customer or our inability to obtain orders or maintain our order volume with our major customers,
may have an adverse effect on our financial condition, results of operations and cash flows.
SimpleDevices Inc. On October 1, 2004, we acquired SimpleDevices Inc. for approximately $12.8 million in cash including
direct acquisition costs, plus a performance-based payment of our unregistered common stock to be paid in the future, if
certain financial objectives are achieved. SimpleDevices, a privately held company based in San Mateo, California, develops
software and firmware solutions that can enable devices such as TVs, set-top boxes, stereos, automotive audio systems and
other consumer electronic products to wirelessly connect and interact with home networks and interactive services to deliver
digital entertainment and information. While it is our current belief that this acquisition will be accretive in 2005, such success
will depend upon (i) our ability to bring SimpleDevices’ products to market in a timely and cost effective manner; (ii) the market
accepting SimpleDevices’ products and technology to the extent anticipated by us; (iii) our ability to integrate SimpleDevices’
products and business into our own product offerings and business in a cost effective manner; and (iv) our ability to control
the overall costs associated with SimpleDevices in the manner we anticipate. The failure of any of these items could have a
material effect on our financial condition, results of operations and cash flows.
Internal Investments During 2004 we hired individuals to develop and market additional products that are part of the Nevo®
platform family. In addition, outside resources were used, and will continue to be used, to develop these products. Furthermore,
there are certain minimum inventory purchases associated with these products. Since software based media control products
are a departure from our traditional business, there is greater risk associated with the sales plans of these products.
Competition The wireless control industry is characterized by intense competition based primarily on product availability, price,
speed of delivery, ability to tailor specific solutions to customer needs, quality and depth of product lines. Our competition is
fragmented across our product lines, and, accordingly, we do not compete with any one company across all product lines. We
compete with a variety of entities, some of which have greater financial and other resources. Our ability to remain competitive in
this industry depends in part on our ability to successfully identify new product opportunities and develop and introduce new
products and enhancements in a timely and cost effective basis, as well as our ability to identify and enter into strategic alliances
with entities doing business within the industries we serve. There can be no assurance that we and our product offerings will be
and/or remain competitive or that any strategic alliances, if any, which we enter into will achieve the type, extent and amount of
success or business that we expect or hope to achieve.
Patents, Trademarks, and Copyrights The procedures by which we identify, document and file for patent, trademark, and
copyright protection are based solely on engineering and management judgment, with no assurance that a specific filing will
issue, or if issued, will deliver any lasting value to us. There is no assurance that rights granted under any patent will provide
competitive advantages to us or will be adequate to safeguard and maintain our proprietary rights. Moreover, the laws of
certain countries in which our products are or may be manufactured or sold may not offer protection on such products and
associated intellectual property to the same extent that the U.S. legal system may offer.
In our opinion, our intellectual property holdings and the engineering, production, and marketing skills and experience of
our personnel are of equal importance to our market position. We further believe that none of our businesses are dependent
to any material extent upon any single patent, copyright, trademark, or trade secret.
40 Universal Electronics Inc. 2004 Annual Report

Universal Electronics Inc. 2004 Annual Report 4342 Universal Electronics Inc. 2004 Annual Report
Some of our products include or use technology and/or components of third parties. While it may be necessary in the future
to seek or renew licenses relating to various aspects of such products, we believe that, based upon past experience and in-
dustry practice, such licenses generally could be obtained on commercially reasonable terms; however, there is no guarantee
that such licenses could be obtained on such terms or at all . Because of technological changes in the wireless and home
control industry, current extensive patent coverage, and the rapid rate of issuance of new patents, it is possible certain com-
ponents of our products and business methods may unknowingly infringe upon patents of others.
Potential for Litigation As is typical in our industry and the nature and kind of business in which we are engaged, from
time to time various claims, charges and litigation are asserted or commenced by third parties against us or by us against third
parties, arising from or related to product liability, infringement of patent or other intellectual property rights, breach of warranty,
contractual relations or employee relations. The amounts claimed may be substantial, but they may not bear any reasonable
relationship to the merits of the claims or the extent of any real risk of court awards assessed against us or in our favor.
We maintain directors’ and officers’ liability insurance which insures our individual directors and officers against certain
claims such as those alleged in the above lawsuits, as well as attorney’s fees and related expenses incurred in connection with
the defense of such claims.
Effects on Universal Electronics Inc. Due to International Operations
The risks of doing business internationally could adversely affect our sales, operations, earnings and cash flows due to a
variety of factors, including, but not limited to:
• changes in a country’s or region’s economic or political conditions, including inflation, recession, interest rate fluctuations
and actual or anticipated military conflicts;
• currency fluctuations affecting sales, particularly in the Euro and British Pound, which contribute to variations in sales of
products and services in impacted jurisdictions and also affect our reported results expressed in U.S. dollars;
• currency fluctuations affecting costs, particularly the Euro, British Pound and the Chinese Yuan, which contribute to
variances in costs in impacted jurisdictions and also affect our reported results expressed in U.S. dollars;
• longer accounts receivable cycles and financial instability among customers;
• trade regulations and procedures and actions affecting production, pricing and marketing of products;
• local labor conditions, customs, and regulations;
• changes in the regulatory or legal environment;
• differing technology standards or customer requirements;
• import, export or other business licensing requirements or requirements relating to making foreign direct investments,
which could affect our ability to obtain favorable terms for components or lead to penalties or restrictions;
• difficulties associated with repatriating cash generated or held abroad in a tax-efficient manner and changes in tax laws;
• fluctuations in freight costs and disruptions at important geographic points of exit and entry; and;
• natural and medical disasters.
General Economic Conditions General economic conditions, both domestic and foreign, have an impact on our business and
financial results. The global economy remains uncertain. As a result, individuals and companies may delay or reduce expendi-
tures. Weak global economic conditions and/or softness in the consumer and telecommunications sector could result in lower
demand for our products, resulting in lower sales, earnings, and cash flows.
Terrorism and Acts of War Terrorism and acts of war (wherever occurring throughout the world) may cause damage or dis-
ruption to us, our employees, facilities, partners, suppliers, distributors, resellers or customers, which could significantly impact
our revenue, costs, expenses, and financial condition. The terrorist attacks that have taken place and continue to take place
throughout the world have created many economic and political uncertainties, some of which may materially harm our business
and results of operations. The potential for future terrorist attacks, the national and international responses to terrorist attacks
or perceived threats to national security and other actual or potential conflicts or acts of war, including the ongoing military
operations in Iraq and Afghanistan, have created many economic and political uncertainties that could adversely affect our
business, results of operations and stock price in ways that we cannot presently predict. In addition, as a multi-national company,
actions taken against or by the United States may impact our business. We are predominately uninsured for losses and inter-
ruptions caused by terrorist acts and acts of war.
Impact of Oil Prices We have an exposure to oil prices in two forms. The first is in the prices of the oil-based materials that we
use in our products, which are primarily the plastics and other components that we include in our finished remotes and audio-
video accessories. The second form is in the cost of delivery and freight, which would be passed on by the carriers that we
use in the form of higher rates. We record freight-in as cost of sales, and freight-out in operating expenses. Rising oil prices may
have an adverse effect on cost of sales and operating expenses.
Leased Property We leased all of the properties used in our business, and during 2005, our properties located in Cypress
California, Twinsburg Ohio, and San Mateo California will expire. We are currently negotiating new or renewal leases for each
of these properties and we believe that new or renewed leases will be entered into before the current leases expire and that
when entered into, the leases will be satisfactory for our needs and purposes. However, we can give no assurance that we will
enter into the new or renewal leases or that, if entered into, the new lease terms will be similar to the existing terms or that
the terms of any such new or renewal leases will not have a significant and material adverse effect on our financial condition,
results of operations, and cash flows.
Technology changes in wireless control We currently derive substantial revenue from the sales of wireless remote controls
based on infrared (IR) technology. Other control technologies exist or could be developed that could compete with IR. If other
technology gains acceptance and starts to be integrated into home electronics devices currently controlled through our IR
remote products, sales of our current line of IR based products may decrease.
Failure to Retain and Recruit Key Personnel Would Harm Our Ability to Grow and Meet Key Objectives Our ability to
achieve significant revenue growth in the future will depend, in part, on our success in recruiting and retaining highly skilled
technical, managerial, sales, and marketing personnel. Our corporate office, including our advanced technology engineering
group is based in Southern California, where the high cost of living makes it difficult to attract talent from outside the region
and may also put pressure on overall employment expenses.
We have also experienced difficulties in attracting qualified, technical personnel in our advanced technology software group.
The loss of services of any of our key personnel, the inability to retain and attract qualified personnel in the future, or delays in
hiring required personnel, particularly engineering and sales personnel, could make it difficult to meet key objectives, such as
timely and effective product introductions.
Change in Competition and Pricing We rely on third-party manufacturers to build our universal wireless control products,
based on our extensive IR code library and patented technology. Price is always an issue in winning and retaining business.
If customers become increasingly price sensitive, new competition could arise from manufactures who decide to go into direct
competition with us or from current competitors who perform their own manufacturing. If such a trend develops, we could ex-
perience downward pressure on our pricing or lose sales, which could have a material adverse effect on our financial condition
and results of operations.
More Complex Products Could Increase Our Support Costs Our Kameleon® and Nevo® lines of products have more features
and are more complex than our older products and therefore may require more end-user technical support. For our Nevo® product
line, we currently rely, and intend to continue to rely, on the distributor or dealers to provide first line technical support to the
end-users. However, we provide the second level of technical support for bug fixes and other issues at no additional charge.
Therefore, as the mix of our products includes Nevo® and other more complex product lines, support costs could increase,
which would have an adverse effect on our financial condition and results of operations.
Transportation Costs We ship product from our foreign manufacturers via ocean and air transport. However, it is sometimes
difficult to forecast swings in demand and, therefore, products may be shipped via air which is more costly than ocean ship-
ments. Often, we cannot recover the increased cost of airfreight from our customers. The inability to predict demand swings
can increase the cost of freight which could have a material adverse effect on our product margins.

Universal Electronics Inc. 2004 Annual Report 4544 Universal Electronics Inc. 2004 Annual Report
Our Proprietary Technologies May Include Design or Performance Defects and May Not Achieve Their Intended Results We produce highly complex products that incorporate leading-edge technology, including hardware, firmware, and software.
Firmware and software may contain bugs that can unexpectedly interfere with operations. There can be no assurance that
our testing programs will be adequate to detect all defects, either defects in individual products or defects that could affect
numerous shipments, which might interfere with customer satisfaction, reduce sales opportunities, or increase returns. An
inability to cure a product defect or the cost to repair a defect could result in the failure of a product line, temporary or per-
manent withdrawal from a product or market, damage to our reputation, inventory costs, or product reengineering expenses,
any of which could have a material impact on revenues, margins, and net income.
Acquisitions We may, from time to time, pursue acquisitions of businesses, products or technologies that complement or
expand our existing business, including those that could be material in size and scope.
Acquisitions involve a number of risks, including the diversion of management’s attention from day-to-day operations to the
assimilation of the operations and personnel of the acquired companies and the incorporation of acquired operations, customer
bases, products or technologies. Such acquisitions could also have adverse short-term effects on our operating results, and
could result in dilutive issuances of equity securities, the incurrence of debt and the loss of key employees. In addition,
business acquisitions must be accounted for as purchases and, because most technology-related acquisitions involve the
purchase of significant intangible assets, these acquisitions typically result in substantial amortization charges and charges for
acquired research and development projects, which could have a material adverse effect on our results of operations. There
can be no assurance that any such acquisitions will occur or, if such acquisitions do occur, the acquired businesses, customer
bases, products or technologies will generate sufficient revenue to offset the associated costs or effects.
Outlook
Our focus is to build technology and products that make the consumer’s interaction with devices and content within the home
easier and more enjoyable. The pace of change in the home is increasing. The growth of new devices, such as DVD players,
PVR/DVR technologies and home theater solutions, to name only a few, has transformed control of the home entertainment
center into a complex challenge for the consumer. The more recent introduction and projected growth of digital media tech-
nologies in consumers’ lives will further increase this complexity. We have set out to create the interface for the connected
home, building a bridge between the home devices of today and the networked home of the future. We intend to invest in new
products and technology, particularly in the connected home space, which will expand our business beyond control of devices
to the control of and access to content, such as digital media, to enrich the entertainment experience.
We will continue enhancing our leadership position in our core business by developing custom products for our subscription
broadcasting, OEM, retail, and computing customers, growing our capture expertise in existing infrared technology and emerging
radio frequency standards, adding to our portfolio of patented or patent pending technologies and developing new platform
products. We also are developing new ways to enhance remote controls and other accessory products.
During 2004, we continued to develop new products featuring our Kameleon® interface technology, a display technology that
provides ease of use by illuminating only the keys needed to control each entertainment device. We also continued develop-ment of our Nevo® technology, an embedded solution that transforms an electronic display (such as HP’s iPaq Pocket PC) into
a sophisticated and easy-to-use wireless home control and automation device. We are continuing to seek ways to integrate
these platform technologies into other forms and devices. Nevo 2.0® was launched in July of 2004 as a feature on a series of
HP’s handheld devices. Building on this platform, we will use Nevo 2.0® technology in a new product named “NevoSL”® which
we expect to ship in the second quarter of 2005. This product is designed for use in the home. In addition, we are working on
product line extensions to One For All® audio/video accessories which include digital antennas, signal boosters, television
brackets and A/V cleaning products.
We are also seeking ways to increase our customer base worldwide, particularly in the areas of subscription broadcasting,
OEM, and One For All® international retail. We will continue to work on strengthening existing relationships by working with
customers to understand how to make the consumer interaction with products and services within the home easier and more
enjoyable. We intend to invest in new products and technology to meet our customer needs now and into the future.
SimpleDevices has developed connected-device technology solutions that link the home computer and the Internet to existing
consumer electronic devices in the home and car. The company provides UPnP-compatible software to power and connect
devices, new media applications to make devices unique, and hardware reference designs. The SimpleWare™ technology in-
cludes intelligent software for customizing, scheduling, and synchronizing specific content to designated devices. This means
that the technology can adapt to new products and emerging technology trends — from playing MP3 files on the home stereo
and in the car to streaming movies to the TV and the Internet-connected alarm clock. In addition to capitalizing on the growing
adoption of Wi-Fi technology, these products also leverage the exploding popularity of digital media.
In 2005, we will evaluate acceptable acquisition targets and strategic partnership opportunities in our core business lines as
well as in the networked home marketplace. We caution, however, that no assurance can be made that any suitable acquisition
target or partnership opportunity will be identified and, if identified, that a transaction can be consummated. Moreover, if con-
summated, no assurance can be made that any such acquisition or partnership will profitably add to our operations.
Quantitative and Qualitative Disclosures About Market Risk
We are exposed to various market risks, including interest rate and foreign currency exchange rate fluctuations. We have
established policies, procedures and internal processes governing our management of market risks and the use of financial
instruments to manage our exposure to such risks. The interest payable under our revolving Credit Facility with our bank is
variable and based on either (i) the bank’s cost of funds or (ii) the LIBOR rate plus a fixed margin of 1.25%; the rate is affected
by changes in market interest rates. At December 31, 2004, we had no borrowings on our credit line. The interest rate in effect
on the credit line as of December 31, 2004 using the LIBOR Rate option plus a fixed margin of 1.25% was 3.67%.
At December 31, 2004 we had wholly owned foreign subsidiaries in The Netherlands, United Kingdom, Germany, France,
Argentina and Spain. Sales from these operations are typically denominated in local currencies including Euros, British Pounds
and Argentine Pesos, thereby creating exposures to changes in exchange rates. Changes in local currencies exchange rates
relative to the U.S. Dollar, and in some cases, to each other, may positively or negatively affect our sales, gross margins, net
income and retained earnings. From time to time, we enter into foreign currency exchange agreements to manage our exposure
arising from fluctuating exchange rates that affect cash flows. Contract terms for the foreign currency exchange agreements
normally last less than six months. We do not enter into any derivative transactions for speculative purposes. The sensitivity of
earnings and cash flows to variability in exchange rates is assessed by applying an approximate range of potential rate fluctu-
ations to our assets, obligations and projected results of operations denominated in foreign currencies. Based on our overall
foreign currency rate exposure at December 31, 2004, we believe that movements in foreign currency rates could have a material
affect on our financial position. We estimate that if the exchange rates for the Euro and the British Pound relative to the U.S.
Dollar fluctuate 10% from December 31, 2004, first quarter 2005 net income and cash flows would fluctuate by approximately
$0.1 million and $3.0 million, respectively. We estimate that if the exchange rates for the Euro and the British Pound relative to
the U.S. Dollar fluctuate 10% from December 31, 2004, net income and cash flows for the year ending December 31, 2005
would fluctuate by approximately $1.5 million and $5.0 million, respectively.
The value of our net balance sheet positions held in foreign currencies can also be impacted by fluctuating exchange rates.
It is difficult to estimate the impact of fluctuations on reported income, as it depends on the opening and closing rates as well
as the average net balance sheet positions held in a foreign currency. We routinely forecast what these net balance sheet
positions may be and we take steps to minimize exposure as management deems appropriate.
As a result of the foregoing factors (discussed under this caption “Quantitative And Qualitative Disclosures About Market
Risk” and above under the caption “Factors That May Affect Financial Condition And Future Results”), as well as other variables
that affect our operating results, past financial performance should not be considered a reliable indicator of future performance,
and investors should not use historical trends to anticipate results or trends in future periods.
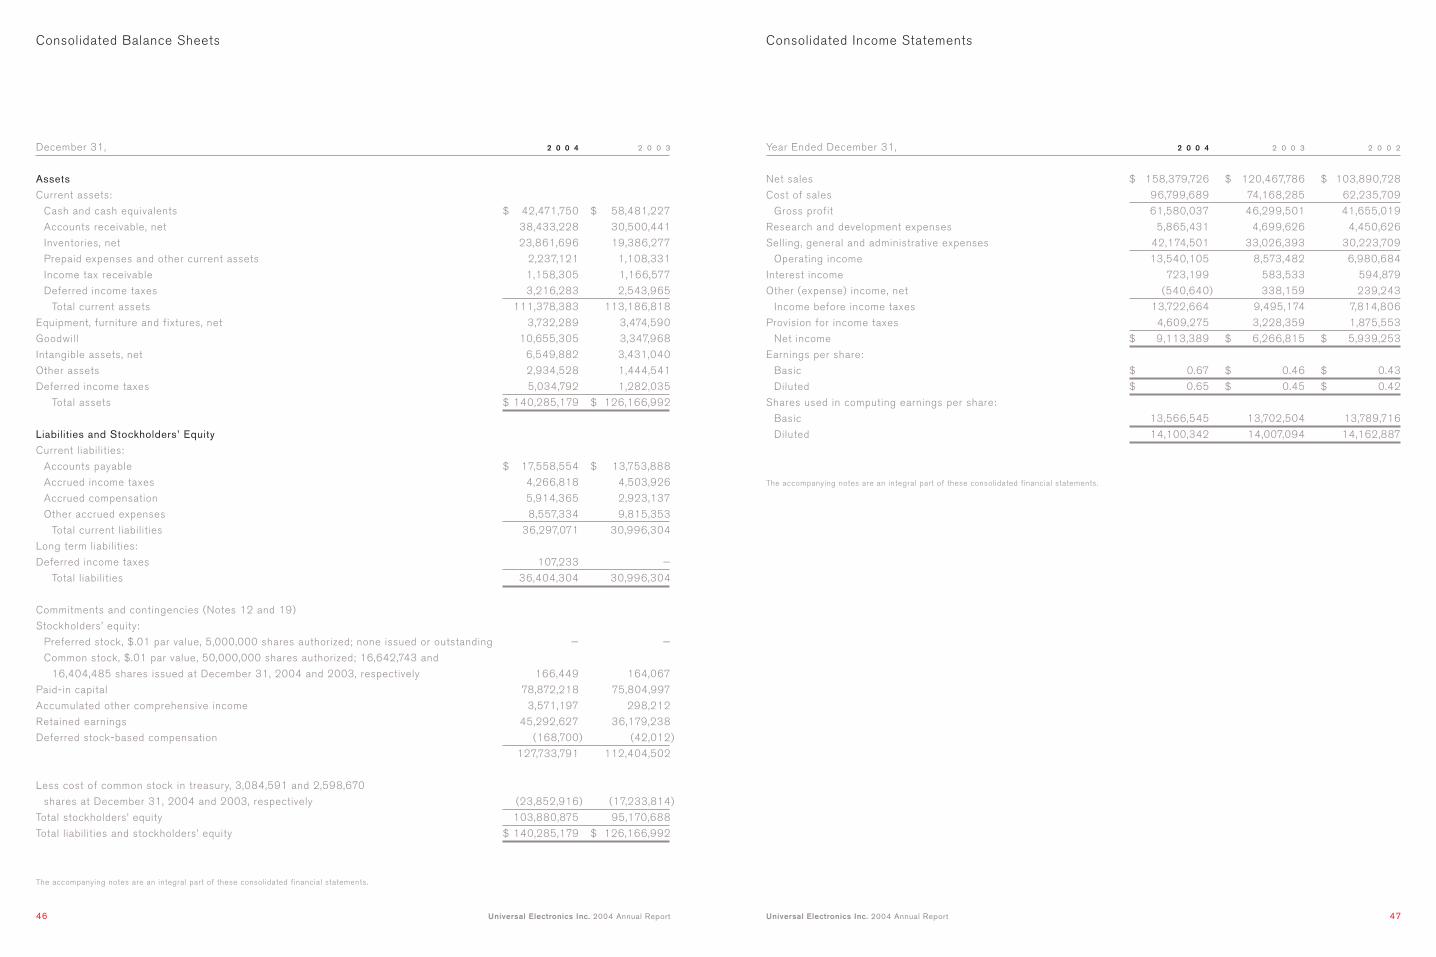
Universal Electronics Inc. 2004 Annual Report 47
Consolidated Balance Sheets
December 31, 2 0 0 4 2 0 0 3
Assets
Current assets:
Cash and cash equivalents $ 42,471,750 $ 58,481,227
Accounts receivable, net 38,433,228 30,500,441
Inventories, net 23,861,696 19,386,277
Prepaid expenses and other current assets 2,237,121 1,108,331
Income tax receivable 1,158,305 1,166,577
Deferred income taxes 3,216,283 2,543,965
Total current assets 111,378,383 113,186,818
Equipment, furniture and fixtures, net 3,732,289 3,474,590
Goodwill 10,655,305 3,347,968
Intangible assets, net 6,549,882 3,431,040
Other assets 2,934,528 1,444,541
Deferred income taxes 5,034,792 1,282,035
Total assets $ 140,285,179 $ 126,166,992
Liabilities and Stockholders’ Equity
Current liabilities:
Accounts payable $ 17,558,554 $ 13,753,888
Accrued income taxes 4,266,818 4,503,926
Accrued compensation 5,914,365 2,923,137
Other accrued expenses 8,557,334 9,815,353
Total current liabilities 36,297,071 30,996,304
Long term liabilities:
Deferred income taxes 107,233 —
Total liabilities 36,404,304 30,996,304
Commitments and contingencies (Notes 12 and 19)
Stockholders’ equity:
Preferred stock, $.01 par value, 5,000,000 shares authorized; none issued or outstanding — —
Common stock, $.01 par value, 50,000,000 shares authorized; 16,642,743 and
16,404,485 shares issued at December 31, 2004 and 2003, respectively 166,449 164,067
Paid-in capital 78,872,218 75,804,997
Accumulated other comprehensive income 3,571,197 298,212
Retained earnings 45,292,627 36,179,238
Deferred stock-based compensation (168,700) (42,012)
127,733,791 112,404,502
Less cost of common stock in treasury, 3,084,591 and 2,598,670
shares at December 31, 2004 and 2003, respectively (23,852,916) (17,233,814)
Total stockholders’ equity 103,880,875 95,170,688
Total liabilities and stockholders’ equity $ 140,285,179 $ 126,166,992
The accompanying notes are an integral part of these consolidated financial statements.
46 Universal Electronics Inc. 2004 Annual Report
Consolidated Income Statements
Year Ended December 31, 2 0 0 4 2 0 0 3 2 0 0 2
Net sales $ 158,379,726 $ 120,467,786 $ 103,890,728
Cost of sales 96,799,689 74,168,285 62,235,709
Gross profit 61,580,037 46,299,501 41,655,019
Research and development expenses 5,865,431 4,699,626 4,450,626
Selling, general and administrative expenses 42,174,501 33,026,393 30,223,709
Operating income 13,540,105 8,573,482 6,980,684
Interest income 723,199 583,533 594,879
Other (expense) income, net (540,640) 338,159 239,243
Income before income taxes 13,722,664 9,495,174 7,814,806
Provision for income taxes 4,609,275 3,228,359 1,875,553
Net income $ 9,113,389 $ 6,266,815 $ 5,939,253
Earnings per share:
Basic $ 0.67 $ 0.46 $ 0.43
Diluted $ 0.65 $ 0.45 $ 0.42
Shares used in computing earnings per share:
Basic 13,566,545 13,702,504 13,789,716
Diluted 14,100,342 14,007,094 14,162,887
The accompanying notes are an integral part of these consolidated financial statements.

Universal Electronics Inc. 2004 Annual Report 49
Consolidated Statements of Stockholders’ Equity
Accumulated Other Deferred
Common Stock Issued Common Stock In Treasury Paid-In Comprehensive Retained Stock-Based
Shares Amount Shares Amount Capital Income (Loss) Earnings Compensation Totals
Balance at December 31, 2001 15,729,928 $ 157,299 (1,943,304) $ (10,972,821) $ 68,657,346 $ (1,804,670) $ 23,973,170 $ (308,093) $ 79,702,231
Comprehensive income:
Net income 5,939,253 5,939,253
Currency translation adjustment 64,588 64,588
Total comprehensive income 6,003,841
Shares issued for employee retirement plan 28,139 281 362,637 362,918
Purchase of treasury shares (584,845) (5,273,611) (5,273,611)
Stock options exercised 243,139 2,432 1,331,818 1,334,250
Shares issued to Directors 6,836 98,030 98,030
Forfeited restricted stock grants (24,214) (38,805) 63,019 —
Income tax benefit related to the exercise of non-qualified stock options 1,009,181 1,009,181
Balance at December 31, 2002 16,001,206 160,012 (2,521,313) (16,270,646) 71,322,177 (1,740,082) 29,912,423 (147,044) 83,236,840
Comprehensive income:
Net income 6,266,815 6,266,815
Currency translation adjustment 2,038,294 2,038,294
Total comprehensive income 8,305,109
Shares issued for employee retirement plan 32,807 328 359,858 360,186
Purchase of treasury shares (84,437) (963,168) (963,168)
Stock options exercised 370,472 3,727 3,339,021 3,342,748
Shares issued to Directors 7,080 105,032 105,032
Stock-based compensation 341,382 341,282
Income tax benefit related to the exercise of non-qualified stock options 442,659 442,659
Balance at December 31, 2003 16,404,485 $ 164,067 (2,598,670) (17,233,814) 75,804,997 298,212 36,179,238 (42,012) 95,170,688
Comprehensive income:
Net income $ 9,113,389 9,113,389
Currency translation adjustment $ 3,272,985 3,272,985
Total comprehensive income 12,386,374
Shares issued for employee retirement plan 29,615 296 430,465 430,761
Purchase of treasury shares (494,998) (6,695,130) (6,695,130)
Stock options exercised 208,643 2,086 1,883,044 1,885,130
Restricted stock grants 348,523 (348,523) —
Shares issued to Directors 9,077 76,028 (76,028) —
Stock-based compensation 221,835 221,835
Income tax benefit related to the exercise of non-qualified stock options 481,217 481,217
Balance at December 31, 2004 16,642,743 $ 166,449 (3,084,591) $ (23,852,916) $ 78,872,218 $ 3,571,197 $ 45,292,627 $(168,700) $ 103,880,875
The accompanying notes are an integral part of these consolidated financial statements.
48 Universal Electronics Inc. 2004 Annual Report

Universal Electronics Inc. 2004 Annual Report 5150 Universal Electronics Inc. 2004 Annual Report
Consolidated Statements of Cash Flows
Year Ended December 31, 2 0 0 4 2 0 0 3 2 0 0 2
Cash provided by operating activities:
Net income $ 9,113,389 $ 6,266,815 $ 5,939,253
Adjustments to reconcile net income to net cash
provided by operating activities:
Depreciation and amortization 3,093,630 3,357,748 3,702,248
Provision for doubtful accounts 160,975 392,447 886,332
Provision for inventory write-downs 3,787,952 2,890,029 678,333
Deferred income taxes 349,571 (849,390) 698,726
Tax benefit from exercise of stock options 481,217 442,659 1,009,181
Shares issued for employee benefit plan 430,761 360,186 362,918
Employee and Director stock-based compensation 221,835 446,314 98,030
Loss on disposal of fixed assets 191,645 — —
Write-off of in-process R&D 240,000 — —
Write down of investment in private company 357,518 — —
Other — (3,214) (10,831)
Changes in operating assets and liabilities (net of acquisition):
Accounts receivable (6,062,432) (1,144,941) 4,059,104
Inventory (7,311,143) (6,229,794) (455,045)
Prepaid expenses and other assets (2,699,613) (657,544) (249,792)
Accounts payable and accrued expenses 2,213,681 11,006,067 (257,007)
Accrued income and other taxes (578,091) 2,967,405 (292,604)
Net cash provided by operating activities 3,990,895 19,244,787 16,168,846
Cash provided by (used for) investing activities:
Acquisition of equipment, furniture and fixtures (2,657,575) (2,470,170) (2,124,474)
Payments for business acquired, net of cash acquired (12,753,798) — (132,000)
Acquisition of intangible assets (1,146,576) (847,623) (1,682,894)
Purchases of short-term investments — (22,000,000) (14,700,000)
Sale of short-term investments — 44,500,000 12,300,000
Net cash provided by (used for) investing activities (16,557,949) 19,182,207 (6,339,368)
Cash provided by (used for) financing activities:
Payments on note payable — (41,414) (62,700)
Proceeds from stock options exercised 1,885,130 3,342,748 1,334,250
Treasury stock purchased (6,695,130) (963,168) (5,273,611)
Net cash provided by (used for) financing activities (4,810,000) 2,338,166 (4,002,061)
Effect of exchange rate changes on cash 1,367,577 (348,128) (1,933,625)
Net (decrease) increase in cash and cash equivalents (16,009,477) 40,417,032 3,893,792
Cash and cash equivalents at beginning of year 58,481,227 18,064,195 14,170,403
Cash and cash equivalents at end of year $ 42,471,750 $ 58,481,227 $ 18,064,195
Supplemental Cash Flow Information — Income taxes paid were $4,534,530, $1,145,973 and $1,492,108 in 2004, 2003 and
2002, respectively.
The accompanying notes are an integral part of these consolidated financial statements.
Supplemental Schedule of Non-Cash Investing Activities
We purchased over 99% of the outstanding shares of SimpleDevices for $12,753,798, net of cash acquired (Note 20). In conjunc-
tion with the acquisition, assets acquired and liabilities assumed were as follows:
Fair value of assets acquired $ 13,612,866
Cash paid for capital stock, net 12,760,513
Liabilities assumed $ 852,353
The accompanying notes are an integral part of these consolidated financial statements.

Universal Electronics Inc. 2004 Annual Report 53
revenue and labor hours. We follow this method because reasonably dependable estimates of the revenue and labor applicable
to various stages of a contract can be made. Recognized revenue and profit are subject to revisions as the contract progresses
to completion. Revisions to revenue and profit estimates are charged to income in the period in which the facts that give rise to
the revision become known and losses are accrued when identified.
Foreign Currency Translation and Foreign Currency Transactions Financial statements of foreign subsidiaries, for which
the functional currency is the local currency, are translated into U.S. dollars using the exchange rate at each balance sheet date
for assets and liabilities and a weighted average exchange rate for each period for statement of income items. Adjustments
resulting from translating foreign functional currency financial statements into U.S. dollars are included in the foreign currency
translation adjustment, a component of accumulated other comprehensive income in stockholders’ equity.
Transaction gains and losses generated by the effect of changes in foreign exchange rates on recorded assets and liabilities
denominated in a currency different from the functional currency of the applicable entity are recorded currently in other income/
expense (Note 14). The portions of inter-company accounts receivable and accounts payable that are not intended for settle-
ment are translated as described in the preceding paragraph.
Cash and Cash Equivalents Cash and cash equivalents include cash accounts and all investments purchased with initial
maturities of three months or less. We maintain cash and cash equivalents with various financial institutions. These financial
institutions are located in many different geographical regions. We mitigate our exposure to credit risk by placing our cash and
cash equivalents with high quality financial institutions.
Investments Included in other assets, as of December 31, 2004 and December 31, 2003, is a cost investment in a private
company with a carrying value of $3,000 and $360,518, respectively. We account for this investment, which does not have a
readily determinable fair value, using the cost method. Our investment is less than 20%, we are unable to exercise significant
influence over the investee, and we are not a primary beneficiary. Under the cost method, investments are carried at cost and
adjusted only for other-than-temporary declines in fair value and distributions of earnings or additional investments. We performed
an impairment review during the year ended December 31, 2004 and determined that there was an other-than-temporary decline
in the value of our investment. Accordingly, the value of the investment was written down by $357,518 to its estimated net
realizable value and the loss was recorded in other (expense) income, net.
Inventories Inventories consisting of wireless control devices, including universal remote controls, wireless keyboards,
antennas, and related component parts, are valued at the lower of cost or market. Cost is determined using the first-in,
first-out method. We carry inventory in amounts necessary to satisfy certain of our customers’ inventory requirements in a
timely basis. New product innovations and technological advances may shorten a given product’s life cycle. We continually
monitor the inventory status to control inventory levels and dispose of any excess or obsolete inventories on hand. We write
down our inventory for estimated obsolescence or unmarketable inventory equal to the difference between the cost of inventory
and the estimated market value based upon our best estimates about the future demand and market conditions. If actual market
conditions are less favorable than those projected by management, additional inventory write-downs may be required.
Inventory write-downs in 2004 totaled approximately $3.8 million, with approximately $1.0 million recorded in the fourth
quarter. Inventory write-downs in 2003 and 2002 totaled $2.9 million and $0.7 million, respectively.
Equipment, Furniture and Fixtures Equipment, furniture and fixtures are recorded at cost. Depreciation is provided using the
straight-line method over the estimated useful lives of the assets. Tooling and equipment are depreciated over two to seven
years. Furniture and fixtures are depreciated over five to seven years. Leasehold improvements are amortized over two to five
years, which represent the shorter of their useful lives or the terms of the related leases. When assets are retired or other-
wise disposed of, the cost and accumulated depreciation are removed from the appropriate accounts and any gain or loss is
included in current income.
Long-Lived Assets and Other Intangible Assets Other intangible assets consist principally of distribution rights, patents,
trademarks and trade names, and developed and core technologies. Capitalized amounts related to patents represent external
legal costs for the application and maintenance of patents. Intangible assets are amortized using the straight-line method
over their estimated period of benefit, ranging from five to ten years. We assess the impairment of long-lived assets and other
intangible assets whenever events or changes in circumstances indicate that the carrying value may not be recoverable.
52 Universal Electronics Inc. 2004 Annual Report
Note 1. Description of Business
Universal Electronics Inc. (the “Company”), based in Southern California, develops firmware and turnkey solutions as well as
software designed to enable consumers to wirelessly connect, control and interact with an increasingly complex home en-
vironment. The company’s primary markets include original equipment manufacturers (OEMs) in consumer electronics and
personal computing, as well as multiple system operators in the cable and satellite subscription broadcasting markets. Over
the past 17 years, the company has developed a broad portfolio of patented technologies and the industry’s leading database
of home connectivity software that it licenses to its customers, including many leading Fortune 500 companies. In addition,
UEI sells its universal wireless control products and other audio/visual accessories through its European headquarters in The
Netherlands, and to distributors and retailers in Europe, Asia, Latin America, South Africa and Australia/New Zealand under the
One For All® brand name.
As used herein, the terms “we”, “us” and “our” refer to Universal Electronics Inc. and its subsidiaries unless the context
indicates to the contrary.
Note 2. Summary of Significant Accounting Policies
Principles of Consolidation The consolidated financial statements include the accounts of the Company and its subsi-
diaries. All intercompany accounts and significant transactions have been eliminated in the consolidated financial state-
ments. Between October 1 and December 31, 2004, we acquired over 99% of the outstanding shares of SimpleDevices Inc.
The results of SimpleDevices’ operations have been included in the consolidated financial statements as of and for the
period from the date of acquisition to December 31, 2004 (Note 20).
Estimates and Assumptions The preparation of financial statements in conformity with accounting principles generally
accepted in the United States of America requires us to make estimates and judgments that affect the reported amounts of
assets and liabilities, disclosure of contingent assets and liabilities at the date of the financial statements and the reported
amounts of revenues and expenses during the reporting period. On an on-going basis, we evaluate our estimates and judg-
ments, including those related to revenue recognit ion, al lowance for sales returns and doubtful accounts, warranties,
inventory valuation, business combination purchase price allocations, review for impairment of long-lived assets, intangible
assets and goodwill, contingencies, and income taxes. Actual results may differ from the estimates. These estimates may be
adjusted as more information becomes available and any adjustment could be significant.
Revenue Recognition We recognize revenue on the sale of products when delivery has occurred (title and risk of loss have
passed to the customer), there is persuasive evidence of an arrangement, the sales price is fixed or determinable, and collec-
tibility is reasonably assured. We record a provision for estimated sales returns and allowances on product sales in the same
period as the related revenues are recorded. These estimates are based on historical sales returns, analysis of credit memo
data and other known factors. The provision recorded for estimated sales returns and allowances is deducted from gross
sales to arrive at net sales in the period the related revenue is recorded. Sales allowances reduce gross accounts receivable
to arrive at accounts receivable, net in the same period the related receivable is recorded. We have no obligations after
delivery of our products other than warranty (Note 19).
We also license our intellectual property (including our patented technologies) trade secrets, trademarks, and database of
infrared codes. We record license revenue when our customers ship products incorporating our intellectual property, persuasive
evidence of an arrangement exists, the sales price is fixed or determinable, and collectibility is reasonably assured.
We generate service revenue as a result of providing consumer support programs, through our call centers, to some of our
customers. These service revenues are recognized when performed, persuasive evidence of an arrangement exists, the sales price
is fixed or determinable, and collectibility is reasonably assured.
We account for revenue under software licensing arrangements involving significant production, modification or customiza-
tion of software in accordance with SOP 81-1, “Accounting for Performance of Construction-Type and Certain Production-Type
Contracts”. We recognize revenue and profit as work progresses on long-term, fixed price contracts using the percentage-of-
completion method. When applying the percentage-of-completion method, we rely on estimates of total expected contract
Notes to Consolidated Financial Statements

Advertising Advertising costs are expensed as incurred. Advertising expense was $1,248,735, $1,105,916 and $1,319,653,
for the years ended December 31, 2004, 2003 and 2002, respectively.
Shipping and Handling Costs We record shipping and handling costs in selling, general and administrative expenses.
Shipping and handling costs amounted to $4,978,906, $3,917,665 and $3,525,127 for the years ended December 31, 2004,
2003 and 2002, respectively. Amounts charged to customers for shipping and handling are included in net revenues.
Derivatives Our foreign currency exposures are primarily concentrated in the Euro and British Pound. We do not enter into
financial instruments for speculation or trading purposes. Depending on the predictability of cash flows of each operating
currency, we periodically enter into foreign currency exchange contracts with contract terms normally lasting less than six
months to protect against the adverse effects that exchange-rate fluctuations may have on foreign-currency-denominated trade
receivables and other assets and liabilities. These derivatives have not qualified for hedge accounting. The gains and losses on
both the derivatives and the foreign-currency-denominated trade receivables are recorded as transaction adjustments in other
income. Such contracts involve the risk of non-performance by the counterparty, which could result in a material loss.
During 2004 we entered into a small amount of foreign currency exchange contracts that did not qualify for hedge
accounting which resulted in a net gain of approximately $5 thousand. We had no foreign currency exchange contracts or
other derivatives outstanding at December 31, 2004 and 2003.
During 2003 we periodically invested in 30 day Dual Currency Deposits which required us to convert the invested amount
to another currency at the end of the contract period in the event certain changes occurred in foreign currency exchange
rates. No such investments were made in 2004 and none were outstanding at December 31, 2004 and 2003.
Stock-Based Compensation We apply the intrinsic value method to account for stock-based compensation in accordance
with the provisions of Accounting Principles Board Opinion No. 25, “Accounting for Stock Issued to Employees”. Therefore,
no compensation expense for the year-ended December 31, 2004, 2003, and 2002 has been recognized for our fixed stock
option plans as options have been granted at fair market value on the date of the grant. We adopted the disclosure-only
requirements of SFAS No. 123, “Accounting for Stock-Based Compensation”, as amended by SFAS No. 148, “Accounting for
Stock-Based Compensation – Transition and Disclosure.”
We have provided below, the pro forma disclosures of the effect on net income and earnings per share as if SFAS No. 123
had been applied in measuring compensation expense for all periods presented. The following table illustrates, pursuant to
SFAS No. 123, as amended by SFAS No. 148, the effect on net income and related earnings per share, had compensation
cost for stock-based compensation plans been determined based on the fair value method prescribed under SFAS No. 123.
Year Ended December 31, 2 0 0 4 2 0 0 3 * 2 0 0 2
Net income
As reported $ 9,113,389 $ 6,266,815 $ 5,939,253
Less: Total stock-based employee compensation expense determined under
fair value based method for all awards, net of related tax effects (2,227,061) (2,809,503) (3,220,579)
Pro forma $ 6,886,328 $ 3,457,312 $ 2,718,674
Basic earnings per share:
As reported $ 0.67 $ 0.46 $ 0.43
Pro forma $ 0.51 $ 0.25 $ 0.20
Diluted earnings per share:
As reported $ 0.65 $ 0.45 $ 0.42
Pro forma $ 0.49 $ 0.25 $ 0.19
The fair value of options at date of grant was estimated using the Black-Scholes model. The following assumptions were used
for the grants in 2004, 2003, and 2002, respectively: risk-free interest rate of approximately 3.01%, 3.00%, and 3.64%; ex-
pected volatility of approximately 65.51%, 62.95%, and 66.34%; expected life of five years for 2004, 2003 and 2002; and the
common stock will pay no dividends. The per share weighted average grant date fair values of the options granted in 2004,
2003 and 2002 were $7.94, $5.87 and $7.14, respectively.
*Stock compensation and the resulting pro forma net income and earnings per share for the years ended December 31, 2003
and 2002 have been revised to reflect the effect of forfeitures of stock options.
Universal Electronics Inc. 2004 Annual Report 5554 Universal Electronics Inc. 2004 Annual Report
Factors considered important which could trigger an impairment review include the following: (1) significant underperformance
relative to expected historical or projected future operating results; (2) significant changes in the manner of our use of the
assets or strategy for the overall business and (3) significant negative industry or economic trends. When we determine that
the carrying value may not be recoverable based upon the existence of one or more of the above indicators of impairment,
and based on the carrying value of the asset being more than the undiscounted cash flows expected to be generated from
that asset and its eventual disposition, we measure an impairment based on projected discounted cash flows using a discount
rate commensurate with the risk inherent in our current business model. In assessing recoverability, we must make assump-
tions regarding estimated future cash flows and other factors to determine the fair value of the respective assets.
Goodwill We evaluate the carrying value of goodwill as of December 31 of each year and between annual evaluations if
events occur or circumstances change that would more likely than not reduce the fair value of the reporting unit below its
carrying amount. Such circumstances could include, but are not limited to: (1) a significant adverse change in legal factors or
in business climate, (2) unanticipated competition, or (3) an adverse action or assessment by a regulator. In performing the
impairment review, we determine the carrying amount of each reporting unit by assigning assets and liabilities, including the
existing goodwill, to those reporting units (Note 3). A reporting unit is defined as an operating segment or one level below an
operating segment (referred to as a component). A component of an operating segment is deemed a reporting unit if the
component constitutes a business for which discrete financial information is available and segment management regularly
reviews the operating results of that component. To evaluate whether goodwill is impaired, we compare the fair value of the
reporting unit to which the goodwill is assigned to the reporting unit’s carrying amount, including goodwill. We determine the
fair value of each reporting unit using the present value of expected future cash flows for that reporting unit. If the carrying
amount of a reporting unit exceeds its fair value, then the amount of the impairment loss must be measured. The impairment
loss would be calculated by comparing the implied fair value of reporting unit goodwill to its carrying amount. In calculating
the implied fair value of reporting unit goodwill, the fair value of the reporting unit is allocated to all of the other assets and
liabilities of that unit based on their fair values. The excess of the fair value of a reporting unit over the amount assigned to
its other assets and liabilities is the implied fair value of goodwill. An impairment loss would be recognized when the carrying
amount of goodwill exceeds its implied fair value.
We conducted annual impairment reviews as of December 31, 2004, 2003, and 2002. Based on the analysis performed
in 2004, 2003, and 2002 we determined that each reporting unit’s fair value exceeded its carrying amount, and therefore
concluded that there was no indication of impairment loss.
Income Taxes Income tax expense includes U.S. and international income taxes. We record deferred tax assets and deferred tax
liabilities on our balance sheet for expected future tax consequences of events that have been recognized in different periods
for financial statement purposes versus tax return purposes. We provide an estimated valuation allowance for net deferred tax
assets when it is considered more likely than not that a portion of such net deferred tax assets will not be recovered.
Capitalized Software Costs We account for capitalized software costs in accordance with SFAS No. 86, “Accounting for the
Costs of Computer Software to be Sold, Leased, or Otherwise Marketed.” Costs incurred internally in creating a computer
software product are expensed when incurred as research and development until technological feasibility has been established.
We have determined that technological feasibility for our products is reached when a working model is completed. Once
technological feasibility is established, software costs are capitalized until the product is available for general release to
customers and is then amortized using (i) the ratio that current gross revenues for a product bear to the total of current
anticipated future gross revenues from that product or (ii) the straight-line method over the remaining estimated economic
life of the product, whichever is greater. Capitalized software costs are stated at cost, net of accumulated amortization.
Unamortized capitalized software costs were $552,000 and $361,000 as of December 31, 2004 and 2003, respectively. The
Company capitalized $345,387, $0, and $320,292 for the years ended December 31, 2004, 2003, and 2002, respectively,
and amortized $154,565, $90,000, and $52,500 for the years ended December 31, 2004, 2003, and 2002, respectively. The
straight-line amortization period for capitalized software costs is 5 years. The developed software is considered incidental to
our products (Note 3).
Research and Development We account for research and development costs in accordance with SFAS No. 2, “Accounting for
Research and Development Costs”. Research and development includes costs such as salaries, employee benefits, supplies and
materials, which are expensed as incurred.

Universal Electronics Inc. 2004 Annual Report 57
Note 3. Goodwill and Other Intangible Assets
We are composed of two operating segments (Note 17). Under the requirements of SFAS 142, the unit of accounting for
goodwill is at a level of reporting referred to as a “reporting unit”. SFAS 142, paragraph 30 defines a reporting unit as either (1)
an operating segment – as defined in SFAS 131, paragraph 10 “Disclosures about Segments of an Enterprise and Related
Information” or (2) one level below an operating segment – referred to as a component. Our domestic and international com-
ponents are “reporting units” within the operating segment “Core Business”. SimpleDevices is the other operating segment and
is a “reporting unit” as well. Goodwill for the domestic operations was generated from the acquisition of a remote control company
in 1998. Goodwill for international operations resulted from the acquisition of remote control distributors in the UK in 1998,
Spain in 1999 and France in 2000. The Company acquired SimpleDevices in 2004 resulting in additional goodwill.
Goodwill information for each reporting unit is as follows (in thousands):
Dec. 31, 2004 Dec. 31, 2003
Core Business Segment
Domestic $ 1,191 $ 1,191
International 2,318 2,157
3,509 3,348
SimpleDevices 7,146 —
Total Goodwill $ 10,655 $ 3,348
The increase in international goodwill was due to currency translation adjustments.
Information regarding our other intangible assets are as follows (in thousands):
Dec. 31, 2004 Dec. 31, 2003
Carrying amount:
Distribution rights $ 405 $ 2,974
Patents 3,945 3,295
Trademark and trade names 979 160
Developed and core technology 2,410 780
Capitalized software 849 503
Other 470 1,049
Total carrying amount $ 9,058 $ 8,761
Accumulated amortization:
Distribution rights $ 54 $ 2,594
Patents 1,463 1,228
Trademark and trade names 75 67
Developed and core technology 429 273
Capitalized software 297 143
Other 190 1,025
Total accumulated amortization $ 2,508 $ 5,330
Net carrying amount:
Distribution rights $ 351 $ 380
Patents 2,482 2,067
Trademark and trade names 904 93
Developed and core technology 1,981 507
Capitalized software 552 360
Other 280 24
Total net carrying amount $ 6,550 $ 3,431
56 Universal Electronics Inc. 2004 Annual Report
Reclassifications Certain prior year amounts have been reclassified to conform to the presentation utilized in the year ended
December 31, 2004.
New Accounting Pronouncements In May 2003, the FASB issued SFAS No. 150, “Accounting for Certain Financial Instru-
ments with Characteristics of both Liabilities and Equity”. SFAS 150 establishes new standards for how an issuer classifies
and measures certain f inancial instruments with characterist ics of both l iabi l i t ies and equity. SFAS 150 is effective for
financial instruments entered into or modified after May 31, 2003 and otherwise is effective at the beginning of the first
interim period beginning after June 15, 2003, except for certain mandatorily redeemable non-controlling interests. The adoption
of SFAS 150 did not have a material effect on our financial position, results of operations, or cash flows.
In November 2004, the FASB issued SFAS No. 151, “Inventory Costs—An Amendment of ARB No. 43, Chapter 4” (“SFAS
151”). SFAS 151 amends the guidance in ARB No. 43, Chapter 4, “Inventory Pricing,” to clarify the accounting for abnormal
amounts of idle facility expense, freight, handling costs, and wasted material (spoilage). Among other provisions, the new rule
requires that items such as idle facility expense, excessive spoilage, double freight, and rehandling costs be recognized as
current-period charges regardless of whether they meet the criterion of “so abnormal” as stated in ARB No. 43. Additionally,
SFAS 151 requires that the allocation of fixed production overheads to the costs of conversion be based on the normal capacity
of the production facilities. SFAS 151 is effective for fiscal years beginning after June 15, 2005 and we are required to adopt
this standard in the fourth quarter of 2005, beginning on October 1, 2005. We are currently evaluating the effect that the
adoption of SFAS 151 will have on our consolidated results of operations and financial condition but do not expect SFAS 151
will have a material impact.
In December 2004, the FASB issued SFAS No. 153, “Exchanges of Nonmonetary Assets—An Amendment of APB Opinion
No. 29, Accounting for Nonmonetary Transactions” (“SFAS 153”). SFAS 153 eliminates the exception from fair value measure-
ment for nonmonetary exchanges of similar productive assets in paragraph 21(b) of APB Opinion No. 29, “Accounting for
Nonmonetary Transactions,” and replaces it with an exception for exchanges that do not have commercial substance. SFAS
153 specifies that a nonmonetary exchange has commercial substance if the future cash flows of the entity are expected to
change significantly as a result of the exchange. SFAS 153 is effective for the fiscal periods beginning after June 15, 2005
and we are required to adopt the standard in the fourth quarter of 2005, beginning on October 1, 2005. We are currently
evaluating the effect that the adoption of SFAS 153 will have on our consolidated results of operations and financial condition
but do not expect it will have a material impact.
In December 2004, the FASB issued SFAS 123R, “Share Based Payment”. SFAS 123R requires companies to expense the
value of stock options and similar awards. This statement is a revision of SFAS 123, “Accounting for Stock-Based Compensation”
and supersedes APB Opinion No. 25, “Accounting for Stock Issued to Employees”, and its related implementation guidance.
SFAS 123R requires a public entity to measure the cost of employee services received in exchange for an award of equity
instruments based on the grant-date fair value of the award (with limited exceptions). That cost will be recognized over the
period during which an employee is required to provide service in exchange for the award – the requisite service period (usually
the vesting period). No compensation cost is recognized for equity instruments for which employees do not render the requisite
service. SFAS 123R will significantly change existing accounting practice and have a material effect on our reported earnings.
SFAS 123R is effective as of the beginning of the first Annual period that begins after June 15, 2005, with early adoption
encouraged. The pro forma disclosures previously permitted under SFAS 123, as amended, no longer will be an alternative to
financial statement recognition. We are required to adopt SFAS 123R in the first quarter of fiscal 2006, beginning January 1, 2006.
Under SFAS 123R, we must determine the appropriate fair value model to be used for valuing share-based payments, the
amortization method for compensation cost and the transition method to be used at date of adoption. The transition methods
include modified prospective and retroactive adoption options. Under the retroactive option, prior periods may be restated
either as of the beginning of the year of adoption or for all periods presented. The modified prospective method requires that
compensation expense be recorded for all unvested stock options and restricted stock at the beginning of the first quarter of
adoption of SFAS 123R, while the retroactive methods would record compensation expense for all unvested stock options and
restricted stock beginning with the first period restated. We are evaluating the requirements of SFAS 123R and expect that
the adoption of SFAS 123R will have a material impact on our consolidated results of operations and earnings per share. We
have not yet determined the method of adoption or the effect of adopting SFAS 123R, and we have not determined whether
the adoption will result in amounts that are similar to the current pro forma disclosures under SFAS 123.

Universal Electronics Inc. 2004 Annual Report 59
Note 6. Equipment, Furniture and Fixtures
Equipment, furniture and fixtures consist of the following:
December 31, 2 0 0 4 2 0 0 3
Tooling $ 5,756,993 $ 7,664,091
Equipment 5,429,345 6,298,838
Furniture and fixtures 1,279,927 1,201,868
Leasehold improvements 1,050,209 990,885
13,516,474 16,155,682
Accumulated depreciation (9,784,185) (12,681,092)
Equipment, furniture and fixtures, net $ 3,732,289 $ 3,474,590
Depreciation expense was $2,227,225, $2,378,549 and $2,569,033, for the years ended December 31, 2004, 2003 and 2002,
respectively.
Note 7. Revolving Credit Line
On September 2, 2003, we terminated a $15.0 million unsecured Credit Facility with Bank of America National Trust and
Savings Association. On September 15, 2003, we entered into a three-year $15.0 million unsecured Credit Facility (the “Credit
Facility”) with Comerica Bank (“Comerica”). Under the Credit Facility with Comerica, the interest payable is variable and is based
on the bank’s cost of funds or the LIBOR rate plus a fixed margin of 1.25%. The interest rate in effect as of December 31,
2004 and 2003, using the LIBOR Rate option plus a fixed margin of 1.25%, was 3.67% and 2.37%, respectively. We pay a com-
mitment fee ranging from zero to a maximum rate of 1/4 of 1% per year on the unused portion of the credit line depending on
the amount of cash investment retained with Comerica during each quarter. Under the terms of this Credit Facility, dividend
payments are allowed up to 100% of net income of the prior fiscal year period to be paid within 90 days of such prior year,
and we are subject to certain financial covenants related to our net worth, quick ratio, and net income. Amounts available for
borrowing under this credit facility are reduced by the outstanding balance of import letters of credit. No amounts were
borrowed under the credit lines during 2004, 2003, or 2002. As of December 31, 2004 and 2003, no amounts were out-
standing under this credit facility and no outstanding import letters of credit. Furthermore, as of December 31, 2004 and
2003, we were in compliance with all financial covenants required by the Credit Facility. No interest was paid for the years
ended December 31, 2004, 2003, or 2002.
We have authority under this credit facility to acquire up to 1.5 million shares of our common stock in market purchases.
Between the date of execution of the Credit Facility and December 31, 2004, we have purchased 540,734 shares of our
common stock leaving 959,266 remaining shares authorized for purchase under the credit facility.
Note 8. Financial Instruments
Our financial instruments consist primarily of investments in cash and cash equivalents, accounts receivable, accounts payable
and accrued liabilities. The carrying value of these instruments approximates fair value because of their short maturities.
Note 9. Stockholders’ Equity
Fair Price Provisions and Other Anti-Takeover Measures Our Restated Certificate of Incorporation, as amended, contains certain
provisions restricting business combinations with interested stockholders under certain circumstances and imposing higher voting
requirements for the approval of certain transactions (“fair price” provision). Any of these provisions could delay or prevent a
change in control of us.
The “fair price” provisions require that holders of at least two-thirds of the outstanding shares of voting stock approve
certain business combinations and significant transactions with interested stockholders.
58 Universal Electronics Inc. 2004 Annual Report
Amortization expense for 2004, 2003 and 2002 amounted to approximately $0.7 million, $0.9 million and $1.1 million, respec-
tively. Estimated amortization expense for existing intangible assets for each of the five succeeding years ended December 31 is
as follows (in thousands):
2005 $ 1,163
2006 1,144
2007 961
2008 871
2009 708
Note 4. Accounts Receivable
Trade accounts receivable are recorded at the invoiced amount and do not bear interest. The allowances for doubtful accounts
is our best estimate for losses resulting from the inability of our customers to make required payments. We specifically analyze
accounts receivables and historical bad debts, customer credit , current economic trends and changes in customer payment
trends when evaluating the adequacy of the allowance for doubtful accounts. If the financial condition of our customers were to
deteriorate, resulting in an impairment of their ability to make payments, additional allowances may be required or the receivable
may be charged off against the allowance. Accounts receivable consist of the following at December 31, 2004 and 2003:
December 31, 2 0 0 4 2 0 0 3
Trade receivable, gross $ 41,220,883 $ 34,001,623
Sales tax receivable 146,619 252,689
Other 19,142 24,227
Allowance for doubtful accounts (1,129,944) (2,564,888)
Allowance for sales returns (1,823,472) (1,213,210)
Accounts receivable, net $ 38,433,228 $ 30,500,441
In 2002, one of our subsidiaries (One For All® France S.A.S) brought an action against a former distributor of the subsidiary’s
products seeking recovery of approximately $2.2 million of accounts receivable. Although we consider this receivable collec-
tible, payment is not expected to be received by December 31, 2005. Consequently, as of December 31, 2004, this receivable
has been reclassified as a long-term asset in “other assets”. See Note 19 – Contingencies.
Following are the changes in the allowance for doubtful accounts during the years ended December 31, 2004, 2003, and 2002:
Balance at Additions
Beginning of Charged to Costs Balance at
Description Period and Expenses Write-offs End of Period
Valuation account for accounts receivable:
Year Ended December 31, 2004 $ 2,564,888 $ 160,975 $ (1,595,919) $ 1,129,944
Year Ended December 31, 2003 $ 2,604,933 $ 392,447 $ (432,492) $ 2,564,888
Year Ended December 31, 2002 $ 1,798,852 $ 886,332 $ (80,251) $ 2,604,933
Note 5. Inventories
Inventories consist of the following:
December 31, 2 0 0 4 2 0 0 3
Components $ 8,221,606 $ 7,592,681
Finished goods 15,640,090 11,793,596
Inventory, net $ 23,861,696 $ 19,386,277

Universal Electronics Inc. 2004 Annual Report 61
through May 26, 2008, unless otherwise terminated by resolution of our Board of Directors. The option price for the stock
options will not be less than the fair market value at the date of grant. The Compensation Committee shall determine when
each option is to expire, but no option shall be exercisable more than ten years after the date the option is granted. No stock
appreciation rights or performance stock units have been awarded under this 1998 Plan.
1999 Stock Incentive Plan On January 27, 1999, the 1999 Stock Incentive Plan (“1999 Plan”) was approved. Under the
1999 Plan, 630,000 shares of common stock are available for distribution to our key officers and employees. The 1999 Plan
provides for the issuance of stock options, stock appreciation rights, performance stock units, or any combination thereof
through January 26, 2009, unless otherwise terminated by resolution of our Board of Directors. The option price for the stock
options will not be less than the fair market value at the date of grant. The Compensation Committee shall determine when
each option is to expire, but no option shall be exercisable more than ten years after the date the option is granted. No stock
appreciation rights or performance stock units have been awarded under this 1999 Plan.
1999A Stock Incentive Plan On October 7, 1999, the 1999A Nonqualified Stock Plan (“1999A Plan”) was approved and on
February 1, 2000, the 1999A Plan was amended. Under the 1999A Plan, 1,000,000 shares of common stock are available for
distribution to our key officers and employees. The 1999A Plan provides for the issuance of stock options, stock appreciation
rights, performance stock units, or any combination thereof through October 6, 2009, unless otherwise terminated by resolution
of our Board of Directors. The option price for the stock options will not be less than the fair market value at the date of grant.
The Compensation Committee shall determine when each option is to expire, but no option shall be exercisable more than ten
years after the date the option is granted. No stock appreciation rights or performance stock units have been awarded under this
1999A Plan.
2002 Stock Incentive Plan On February 5, 2002, the 2002 Nonqualified Stock Plan (“2002 Plan”) was approved. Under the
2002 Plan, 1,000,000 shares of common stock are available for distribution to our key officers and employees. The 2002
Plan provides for the issuance of stock options, stock appreciation rights, performance stock units, or any combination thereof
through February 4, 2012, unless otherwise terminated by resolution of our Board of Directors. The option price for the stock
options will not be less than the fair market value at the date of grant. The Compensation Committee shall determine when
each option is to expire, but no option shall be exercisable more than ten years after the date the option is granted. No stock
appreciation rights or performance stock units have been awarded under this 2002 Plan.
2003 Stock Incentive Plan On June 18, 2003, the 2003 Nonqualified Stock Plan (“2003 Plan”) was approved. Under the
2003 Plan, 1,000,000 shares of common stock are available for distribution to our key officers and employees. The 2003
Plan provides for the issuance of stock options, stock appreciation rights, performance stock units, or any combination thereof
through June 17, 2013, unless otherwise terminated by resolution of our Board of Directors. The option price for the stock
options will not be less than the fair market value at the date of grant. The Compensation Committee shall determine when
each option is to expire, but no option shall be exercisable more than ten years after the date the option is granted. No stock
appreciation rights or performance stock units have been awarded under this 2003 Plan.
Vesting periods for the above referenced stock incentive plans range from three to four years.
The following table summarizes the changes in the number of shares of common stock under option:
2 0 0 4 2 0 0 3 2 0 0 2
Weighted-Average Weighted-Average Weighted-Average
Shares (000) Exercise Price Shares (000) Exercise Price Shares (000) Exercise Price
Outstanding at beginning of year 2,662 $ 12.32 2,976 $ 12.00 2,260 $ 11.28
Granted 702 13.94 119 10.60 998 12.14
Exercised (209) 9.10 (370) 8.96 (243) 5.49
Expired and/or forfeited (116) 15.95 (63) 13.92 (39) 14.17
Outstanding at end of year 3,039 $ 12.79 2,662 $ 12.32 2,976 $ 12.00
Options exercisable at year-end 1,828 $ 12.58 1,668 $ 11.79 1,502 $ 10.42
60 Universal Electronics Inc. 2004 Annual Report
Treasury Stock During 2004, 2003 and 2002, 494,998, 84,437 and 584,845 shares of common stock, respectively, were pur-
chased by us on the open market at a cost of $6,695,130, $963,168 and $5,273,611, respectively. These shares are recorded
as shares held in treasury at cost. The shares will generally be held by us for future use as management and the Board of
Directors deem appropriate. In addition, some of these shares will be used by us to compensate the outside directors of the
Company. During 2004, 2003 and 2002, 9,077, 7,080 and 6,836 shares, respectively, were issued to the outside directors.
Stock Awards On July 1, 2004, as compensation for the outside directors for the one year period commencing July 1, 2004,
we granted each director 5,000 shares of our common stock with an aggregate fair market value of approximately $348,523.
These shares have been recorded in a separate component of stockholders’ equity and are being amortized over their 1-year
vesting period. Each calendar quarter, 1/4 of the total stock award will vest and the shares will be distributed provided the
director has served the entire calendar quarter term. Amortization expense amounted to $179,823 in 2004. On July 30, 2004,
we filed an S-8 Registration Statement covering all of the shares issued under this plan.
On July 11, 2001, as compensation for the outside directors for the three year period commencing July 1, 2001, we
granted each director shares of our common stock with a fair market value equivalent to approximately $278,833. These
shares have been recorded in a separate component of stockholders’ equity and are being amortized over their three-year
vesting period. Each calendar quarter, 1/12 of the total stock award will vest and the shares will be distributed provided the
director has served the entire calendar quarter term. Amortization expense amounted to $42,012, $105,032 and $98,030
in 2004, 2003 and 2002, respectively. The stock awards to the directors were fully vested as of June 30, 2004.
Note 10. Stock Options
1993 Stock Incentive Plan On January 19, 1993, the 1993 Stock Incentive Plan (“1993 Plan”) was approved. Under the
1993 Plan, 400,000 shares of common stock are reserved for the granting of incentive and other stock options to officers,
key employees and non-affiliated directors. The 1993 Plan provides for the granting of incentive and other stock options
through January 18, 2003. All options outstanding at the time of termination of the 1993 Plan shall continue in full force and
effect in accordance with their terms. The option price for incentive stock options and non-qualified stock options will not be
less than the fair market value at the date of grant. The Compensation Committee determined when each option was to expire,
and that no option shall be exercisable more than ten years after the date the option is granted. The 1993 Plan also provides
for the award of stock appreciation rights subject to terms and conditions specified by the Compensation Committee. No
stock appreciation rights have been awarded under this 1993 Plan.
1995 Stock Incentive Plan On May 19, 1995, the 1995 Stock Incentive Plan (“1995 Plan”) was approved. Under the 1995
Plan, 800,000 shares of common stock are available for distribution to our key officers, employees and non-affiliated directors.
The 1995 Plan provided for the issuance of stock options, stock appreciation rights, performance stock units, or any combina-
tion thereof through May 18, 2005, unless otherwise terminated by resolution of our Board of Directors. The option price for
the stock options will be equal to the fair market value at the date of grant. The Compensation Committee shall determine
when each option is to expire, but no option shall be exercisable more than ten years after the date the option is granted. No
stock appreciation rights or performance stock units have been awarded under this 1995 Plan.
1996 Stock Incentive Plan On December 1, 1996, the 1996 Stock Incentive Plan (“1996 Plan”) was approved. Under the
1996 Plan, 800,000 shares of common stock are available for distribution to our key officers and employees. The 1996 Plan
provides for the issuance of stock options, stock appreciation rights, performance stock units, or any combination thereof
through November 30, 2007, unless otherwise terminated by the resolution of our Board of Directors. The option price for the
stock options will be equal to the fair market value at the date of grant. The Compensation Committee shall determine when
each option is to expire, but no option shall be exercisable more than ten years after the date the option is granted. No stock
appreciation rights or performance stock units have been awarded under this 1996 Plan.
1998 Stock Incentive Plan On May 27, 1998, the 1998 Stock Incentive Plan (“1998 Plan”) was approved. Under the 1998
Plan, 630,000 shares of common stock are available for distribution to our key officers and employees. The 1998 Plan
provides for the issuance of stock options, stock appreciation rights, performance stock units, or any combination thereof

Universal Electronics Inc. 2004 Annual Report 63
The following summarizes future minimum non-cancelable operating lease payments with initial terms greater than one year
at December 31, 2004:
Year ending December 31: Amount
2005 $ 1,441,709
2006 721,434
2007 657,407
2008 422,035
2009 42,145
Thereafter —
Total lease commitments $ 3,284,730
Note 13. Employee Benefit Plans
We maintain a retirement and profit sharing plan under Section 401(k) of the Internal Revenue Code for all of our domestic
employees that meet certain qualifications. Participants in the plan may elect to contribute from 1% to 15% of their annual
salary to the plan. The Company may, at its discretion, make contributions to the plan. The Company matches 50% of the parti-
cipants’ contributions in the form of newly issued shares of common stock of the Company. The expense recorded for the years
ended December 31, 2004, 2003 and 2002 amounted to $421,981, $390,087 and $384,329, respectively.
Note 14. Other (Expense) Income, net
“Other (expense) income, net” in the Consolidated Income Statements consisted of the following:
Year Ended December 31, 2 0 0 4 2 0 0 3 2 0 0 2
Net gain (loss) on foreign exchange transactions $ (151,845) $ 343,804 $ 93,740
Patent settlements — — 162,964
Write-down of investment (357,518) — —
Other income (loss) (31,277) (5,645) (17,461)
Total $ (540,640) $ 338,159 $ 239,243
During 2002, we settled patent infringement suits resulting in payments totaling $162,964.
Note 15. Income Taxes
In 2004, 2003, and 2002, pre-tax income was attributed to the following jurisdictions:
Year Ended December 31, 2 0 0 4 2 0 0 3 2 0 0 2
Domestic operations $ 4,487,292 $ 6,002,416 $ 4,898,516
Foreign operations 9,235,372 3,492,758 2,916,290
Total $13,722,664 $ 9,495,174 $ 7,814,806
62 Universal Electronics Inc. 2004 Annual Report
During 2003, common stock options were modified for two employees as part of severance agreements. The total number of
options modified was 92,647, which resulted in new measurement dates. The difference between the exercise price and the
fair value of the common stock on the new measurement dates for the options totaled $341,282. As a result, $341,282 was
charged to non-cash stock-based compensation.
Significant option groups outstanding at December 31, 2004 and related weighted average price and life information are as follows:
Options Outstanding Options Exercisable
Number Weighted-Average Number
Outstanding Remaining Exercisable
At 12/31/04 Years of Weighted-Average At 12/31/04 Weighted-Average
Range of Exercise Prices (000) Contractual Life Exercise Price (000) Exercise Price
$ 2.16 to $ 3.19 22 1.06 $ 2.73 22 $ 2.73
3.47 to 4.97 162 3.72 4.95 162 4.95
5.31 to 7.50 229 3.94 7.08 229 7.08
8.45 to 9.83 521 7.88 8.64 243 8.60
10.92 to 13.39 963 7.18 11.84 447 11.05
14.85 to 22.06 1,142 6.92 9.83 725 13.97
$ 2.16 to $ 22.06 3,039 6.73 $ 12.79 1,828 $ 12.58
Note 11. Significant Customers and Suppliers
One significant customer, with purchases of $17.5 million, $18.1 million, and $15.9 million, accounted for 11.0%, 15.0%, and
15.3% of the total net revenue for the years ended December 31, 2004, 2003 and 2002, respectively. Trade receivables with
this customer amounted to $2.4 million and $2.7 million or 5.9% and 9.0%, of the total trade receivables at December 31,
2004 and 2003, respectively. In addition, for the same periods, we had sales to a customer and its sub-contractors, that when
combined, had purchases of $16.4 million, $4.6 million, and $4.2 million, accounting for 10.4%, 3.8%, and 4.0% of net sales for
the respective periods. Trade receivables with this customer and its sub-contractors amounted to $2.4 million, or 5.7%, of the
total trade receivables at December 31, 2004. The future loss of these customers or any key customer, either in the United States
or abroad, due to the financial weakness or bankruptcy of any such customer or our inability to obtain orders or maintain our order
volume with our major customers, may have an adverse effect on our financial condition, results of operations and cash flows.
Trade receivables subject us to a concentration of credit risk. The risk is mitigated as a result of the large number of
customers comprising our customer base, the relative size and strength of most of our customers and our performance of
ongoing credit evaluations.
We utilize third-party manufacturers in Asia, Mexico and the United States to produce our wireless control products. Pur-
chases from three major suppliers amounted to $25.5 million, $9.5 million and $8.2 million representing 28.2%, 10.5% and
9.1%, respectively, of total inventory purchases in 2004. Purchases with the same three major suppliers amounted to $13.4
million, $10.7 million and $6.9 million representing 19.7%, 15.6% and 10.1%, respectively, of total inventory purchases in 2003.
Accounts payable with the previously mentioned three suppliers amounted to $5.9 million, $1.0 million and $1.4 million, re-
spectively, representing 33.8%, 5.5% and 8.0% of the total accounts payable at December 31, 2004. There was one additional
significant supplier with accounts payable of $2.0 million or 11.6% of the total accounts payable at December 31, 2004. Accounts
payable with the previously mentioned three suppliers amounted to $1.0 million, $3.6 million and $0.7 million representing 6.8%,
26.1% and 4.9%, respectively, of the total accounts payable at December 31, 2003. There was one additional significant supplier
with accounts payable of $1.7 million or 12.0% of the total accounts payable at December 31, 2003.
Note 12. Leases
We lease office and warehouse space and certain office equipment under operating leases that expire at various dates through
December 31, 2009. Rental expense under operating leases was $1,795,677, $1,578,643, and $1,211,852 for the years ended
December 31, 2004, 2003 and 2002, respectively.

The provision for income taxes charged to operations was as follows:
Year Ended December 31, 2 0 0 4 2 0 0 3 2 0 0 2
Current tax expense/(Benefit):
U.S. federal $ 2,571,582 $ 2,438,395 $ 554,105
State and local 216,698 156,965 (389,006)
Foreign 1,514,802 1,482,389 1,011,728
Total current 4,303,082 4,077,749 1,176,827
Deferred tax expense/(Benefit):
U.S. federal 564,503 (715,000) 492,992
State and local (200,243) (46,000) 42,009
Foreign (58,067) (88,390) 163,725
Total deferred 306,193 (849,390) 698,726
Total provision $ 4,609,275 $ 3,228,359 $ 1,875,553
Net deferred tax assets comprised the following at December 31:
2 0 0 4 2 0 0 3
Deferred tax assets:
Inventory reserves $ 1,003,018 $ 990,199
Allowance for doubtful accounts 67,572 727,280
Capitalized research costs 1,286,655 —
Capitalized inventory costs 573,620 287,341
Net operating losses 5,830,703 303,311
Amortization of intangibles 685,962 758,653
Accrued liabilities 510,737 693,049
Income tax credits 264,967 —
State taxes — 18,407
Depreciation 24,237 17,062
Other 185,633 191,085
Total deferred tax assets $10,433,104 $ 3,986,387
Deferred tax liability:
Depreciation (7,918) —
Intangible assets (1,068,023) —
Other — (22,981)
Total deferred tax liabilities (1,075,941) (22,981)
Net deferred tax assets before valuation allowance 9,357,163 3,963,406
Less: Valuation allowance (1,316,433) (137,406)
Net deferred tax assets $ 8,040,730 $ 3,826,000
64 Universal Electronics Inc. 2004 Annual Report
The deferred tax valuation allowance increased $1,179,027, $28,707, and $66,022 during 2004, 2003, and 2002, respectively.
The provision for income taxes differs from the amount of income tax determined by applying the applicable U.S. statutory
federal income tax rate to pre-tax income from operations as a result of the following:
Year Ended December 31, 2 0 0 4 2 0 0 3 2 0 0 2
Tax provision at statutory
U.S. rate $ 4,665,705 $ 3,228,359 $ 2,657,034
Increase (decrease) in tax provision resulting from:
State and local taxes, net 235,656 80,288 (225,554)
Foreign tax rate differential 183,674 171,534 183,915
Nondeductible items 34,164 29,199 14,663
In-process R&D 81,600 — —
Federal valuation allowance 121,556 — —
Federal research and development credits (521,052) (282,055) (645,251)
Other (192,028) 1,034 (109,254)
Tax provision $ 4,609,275 $ 3,228,359 $ 1,875,553
During 2004, pursuant to our purchase of SimpleDevices, pretax book income reflects the write-off of IPR&D expenditures
and amortization of certain acquired intangibles. The tax effects of intangibles, other than goodwill, are included in deferred
tax liabilities. In connection with the acquisition, we established a $1,100,000 deferred tax liability, and a $5,600,000 deferred
tax asset. The net result was an increase to Goodwill of $4,500,000.
At December 31, 2004, we had state Research and Experimentation income tax credit carryforwards of approximately
$265,000 with no expiration date.
At December 31, 2004, we had federal, state and foreign net operating losses of approximately $10,874,000, $8,683,000
and $4,679,000, respectively. All of the federal and state net operating loss carryfowards were acquired as part of the acqui-
sition of SimpleDevices. The federal and state net operating loss carryforwards begin to expire in 2017 and 2007, respectively.
Approximately $3,367,000 of the foreign net operating losses begin to expire in 2005, the remaining $1,312,000 of foreign
net operating losses have an unlimited carryforward. At December 31, 2004, a valuation allowance of approximately $1,176,000
has been provided on certain foreign net operating losses.
Internal Revenue Code Section 382 places certain limitations on the annual amount of net operating loss carryforwards
that can be utilized if certain changes to a company’s ownership occur. Our acquisition of SimpleDevices was a change in
ownership pursuant to Section 382 of the Internal Revenue Code, and the federal and state net operating loss carryforwards
of SimpleDevices (approximately $10,874,000 and $8,683,000, respectively) are limited but considered realizable in future
periods. The annual limitation is as follows: $1,325,000 for 2005 through 2008 and approximately $562,000 thereafter.
As of December 31, 2004, we believed it was more likely than not that certain deferred tax assets related to the impair-
ment of the investment in a private company (a capital asset) would not be realized due to uncertainties as to the timing and
amounts of future capital gains. Accordingly, a valuation allowance of approximately $140,000 was established during 2004
(see note 2 – Investments).
During the years ended December 31, 2004, 2003, and 2002 we recognized a credit to additional paid-in capital and a
reduction to income taxes payable of $481,000, $443,000, and $1,009,000, respectively, related to the tax benefit from
exercises of non-qualified stock options under our stock option plans.
The undistributed earnings of our foreign subsidiaries are considered to be indefinitely reinvested. Accordingly, no provision
for US federal and state income taxes or foreign withholding taxes has been provided on such undistributed earnings. Deter-
mination of the potential amount of unrecognized deferred US income tax liability and foreign withholding taxes is not practi-
cable because of the complexities associated with its hypothetical calculation; however, unrecognized foreign tax credits would
be available to reduce some portion of the U.S. liability.
Universal Electronics Inc. 2004 Annual Report 65

Universal Electronics Inc. 2004 Annual Report 6766 Universal Electronics Inc. 2004 Annual Report
During the year, the Internal Revenue Service began an audit of the December 31, 2001 tax year and the California Franchise
Tax Board (“FTB”) continued its audit of the years ended December 31, 1999 and 2000. In 2004, the passing of the statute
of limitations for the federal tax year 2000 and negotiations with the FTB on a number of issues, eliminated the need for certain
previously recorded tax reserves. Accordingly, we reversed the related previously accrued taxes, reducing the tax provision for
2004 by approximately $250,000. The final results of these audits are not expected to have a material impact on our financial
position or results of operations.
On October 22, 2004, the American Jobs Creation Act of 2004 (“AJCA”) was signed into law. The AJCA provides several
incentives for US multinational corporations and US manufacturers. Subject to certain limitations, the incentives include an
85% dividend received deduction for certain dividends from controlled foreign corporations that repatriate accumulated
income abroad, and a deduction for domestic qualified production activities taxable income. The US Treasury Department is
expected to issue additional guidance with regards to these provisions. We are in the process of analyzing whether to take
advantage of this opportunity or the potential impact on our income tax provision, if any.
Note 16. Earnings Per Share
Basic earnings per share are computed by dividing net income available to common stockholders by the weighted average
number of common shares outstanding. Diluted earnings per share is computed by dividing net income by the weighted
average number of common shares and dilutive potential common shares which includes the dilutive effect of stock options
and restricted stock grants. Dilutive potential common shares for all periods presented are computed utilizing the treasury
stock method. In the computation of diluted earnings per common share for the years ended December 31, 2004, 2003 and
2002, approximately 988,250, 1,031,125 and 1,782,000 stock options, respectively, with exercise prices greater than the
average market price of the underlying common stock, were excluded because their inclusion would have been anti-dilutive.
The following table sets forth the computation of basic and diluted earnings per share (in thousands, except per share data):
Year Ended Dec. 31, 2004 Dec. 31, 2003 Dec. 31, 2002
Basic
Net Income $ 9,113 $ 6,267 $ 5,939
Weighted-average common shares outstanding 13,567 13,703 13,790
Basic earnings per share $ 0.67 $ 0.46 $ 0.43
Diluted
Net Income $ 9,113 $ 6,267 $ 5,939
Weighted-average common shares outstanding for basic 13,567 13,703 13,790
Dilutive effect of stock options and restricted stock 533 304 373
Weighted-average common shares outstanding on a diluted basis 14,100 14,007 14,163
Diluted earnings per share $ 0.65 $ 0.45 $ 0.42
Note 17. Business Segments and Foreign Operations
Industry Segments We have two reportable segments, Core Business and SimpleDevices. The Core Business segment produces
a broad line of easy-to-use, pre-programmed universal wireless control products that are marketed principally for home video
and audio entertainment equipment through various channels of distribution, including international retail, private label, OEMs,
and cable and satellite service providers and to companies in the computing industry. The SimpleDevices segment produces
connected-device technology solutions, as well as hardware reference designs, that link the home computer and the Internet to
existing consumer electronic devices in the home and car using UPnP-compatible software that are marketed primarily to OEMs.
Measurement of Profit or Loss of Segment Assets The accounting policies of the reportable segments are the same as
those described in the summary of significant accounting policies except that the disaggregated financial results for our
reportable segments have been prepared using a management approach, which is consistent with the basis and manner in
which we internally disaggregate financial information for the purposes of making internal operating and resource allocation
decisions. The primary difference is that the segment information does not include a full allocation of corporate overhead
costs between the SimpleDevices and Core Business segments.
Factors Used to Identify Reportable Segments SFAS 131, “Disclosures about Segments of an Enterprise and Related Infor-
mation,” defines an operating segment, in part, as a component of an enterprise whose operating results are regularly reviewed
by the chief operating decision maker to make decisions about resources to be allocated to the segment and assess its per-
formance. Operating segments may be aggregated only to the limited extent permitted by the standard. During the fourth
quarter of 2004 we purchased SimpleDevices, Inc. for approximately $12.8 million in cash, including direct acquisition costs,
and a potential performance-based payment of our unregistered common stock, if certain future financial objectives are
achieved. The results of SimpleDevices’ operations have been included in the consolidated financial statements from the date
of acquisition to December 31, 2004. As a result of the performance based incentive and other factors, we began to review
SimpleDevices operating results on a regular basis. As the integration of SimpleDevices operations continues, and the perfor-
mance based incentive expires, we may or may not determine in the future whether SimpleDevices continues to be a report-
able segment in accordance with SFAS 131. Other factors that we considered in the determination of reportable operating
segments included product differences, current management structure, distribution methods, and economic characteristics. We
concluded, as of December 31, 2004, that reporting SimpleDevices as an additional segment is in accordance with SFAS 131.
Segment Income (Loss) and Assets
Year Ended December 31, 2004 Core Business SimpleDevices (1) Total
Net sales $ 157,548,746 $ 830,980 $ 158,379,726
Depreciation and amortization 2,968,412 125,218 3,093,630
Interest income 723,199 — 723,199
Income before income taxes 14,272,566 (549,902) 13,722,664
Assets $ 134,473,934 $ 5,811,245 $ 140,285,179
(1) The financial results of SimpleDevices included above, contain only the results of operations since the date of acquisition. The segmented results of operations
for the year ended December 31, 2003 and 2002 are not presented here as the results of the Core Business segment for 2003 and 2002 correspond to the
consolidated income reported in the consolidated financial statements included in this report.
Geographic Information Our operations by geographic area are presented below:
Year ended Dec. 31, 2004 Dec. 31, 2003 Dec. 31, 2002
Net Sales
United States $ 73,979,268 $ 67,641,896 $ 64,869,051
Netherlands 9,544,000 16,187,092 11,712,572
United Kingdom 26,749,860 15,666,576 11,734,250
France 6,037,043 4,430,504 4,226,259
Germany 8,813,401 5,422,239 3,437,778
Spain 5,581,280 4,611,451 2,931,174
Australia 4,662,878 2,518,151 1,153,324
Hong-Kong 2,803,107 843,040 410,093
Taiwan 2,737,056 533,900 775,300
Singapore 5,807,709 — —
All Other 11,664,124 2,612,937 2,640,927
$ 158,379,726 $ 120,467,786 $ 103,890,728
December 31, 2 0 0 4 2 0 0 3 2 0 0 2
Long-Lived Assets
United States 5,182,002 $ 3,002,066 $ 7,131,655
All Other Countries 1,484,815 1,917,065 3,632,999
$ 6,666,817 $ 4,919,131 $ 10,764,654
Specific identification was the basis used for attributing revenues from external customers to individual countries.

Universal Electronics Inc. 2004 Annual Report 6968 Universal Electronics Inc. 2004 Annual Report
Note 18. Related Party Transactions
In August 2001, we entered into a 30-month consulting agreement with one of our former directors, under which the former
director received $600,000 for services rendered. Amounts paid under this agreement were $0, $200,000, and $200,000 for
the years ended December 31, 2004, 2003, and 2002, respectively. The agreement expired in February 2004. There were no
further amounts due at December 31, 2004.
In April 1999, we provided a non-recourse interest bearing secured loan to our chief executive officer. The loan in the amount
of $200,000 bears interest at the rate of 5.28% per annum, with interest payable annually to us on each December 15th. The
loan is collateralized by the primary residence purchased and the principal is payable on the earlier of (i) December 15, 2007,
(ii) within twelve months following a demand from us but only in the event the executive officer ceases being our employee or
in the event of a default under the loan; or (iii) on the closing of a sale or transfer of the property.
Note 19. Contingencies
Product Warranties We provide for estimated product warranty expenses concurrent with the recognition of revenue. We grant
a three year warranty period on our products. Because warranty estimates are forecasts that are based on the best available
information, mostly historical claims experience, claims costs may differ from amounts provided.
An analysis of changes in the liability for product warranties follows:
Accruals
Relating to
Accruals Preexisting
for Warranties Warranties Settlements
Balance at Issued During and Changes (in Cash or in Kind) Balance at
Description beginning of period the Period in Estimates During the Period end of period
Year Ended December 31, 2004 $ 95,005 $ 212,137 $ 0 $ (139,528) $ 167,614
Year Ended December 31, 2003 $ 95,005 $ 181,466 $ 0 $ (181,466) $ 95,005
Year Ended December 31, 2002 $ 95,005 $ 51,142 $ 0 $ (51,142) $ 95,005
Litigation On November 15, 2000, we filed suit against Universal Remote Control Inc. alleging that Universal Remote has
infringed certain of our patents. On January 31, 2005, we announced resolution of this lawsuit by stating that the parties had
entered into a Confidential Settlement Agreement in which Universal Remote Control agreed to license certain of our remote
control patents.
On November 19, 2002, we filed suit against Intrigue Technologies, Inc., which was amended on February 13, 2004, alleging
that Intrigue Technologies has infringed certain of our patents. In addition, Intrigue Technologies filed suit against us seeking a
judgment to declare certain of our patents invalid, unenforceable and void and also alleging that we have violated federal anti-
trust laws with respect to our patent enforcement. On November 29, 2004, the parties announced that they had settled the
various lawsuits when they entered into a Confidential Settlement Agreement which set forth an overall business relationship
in which Logitech (Intrigue’s parent company) has licensed certain of our technologies to be used in the Logitech Harmony
line of advanced remote controls.
As a result of settlements described above, we recorded $375 thousand in selling, general and administrative expenses
as a gain.
In 2002, one of our subsidiaries (One For All® S.A.S.) brought an action against a former distributor of the subsidiary’s
products seeking a recovery of accounts receivable (See Note 4 - Accounts Receivable). At December 31, 2004, the amounts
due of $2.2 million is recorded as a long term asset in “other assets”. The distributor filed a counterclaim against our subsi-
diary seeking payment for amounts allegedly owed for administrative and other services rendered by the distributor for our
subsidiary. In January 2005, the parties agreed to include claims between the distributor and two of our other subsidiaries,
namely, Universal Electronics BV, One For All® Iberia SL, such that the proceeding covers all claims and counterclaims be-
tween the various parties. These additional claims involve nonpayment for products and damages resulting from the wrongful
termination of agency agreements. At this time, each of the subsidiaries disagrees with the allegations of the former distri-
butor and has vigorously defended itself against the counterclaims. These proceedings are still in preliminary stages and
the court appointed expert has not yet finalized his report to the court.
In 2003, an ex-employee of one of our subsidiaries brought an action against our subsidiary seeking damages in the
amount of approximately $191,000 for wrongful termination. The subsidiary disagreed with these allegations and vigorously
defended itself against this claim. In January 2005, judgment was rendered for the ex-employee awarding him approximately
$26,000 in damages. In March, 2005, our subsidiary paid this judgment. In February 2005, the ex-employee filed a notice of
appeal. It is our intention to seek a settlement of this matter with the ex-employee. If a settlement is not possible, our
subsidiary will again vigorously defend itself.
On January 7, 2004, James D. Lyon, Trustee for the bankruptcy estate of Computrex, Inc. (“Trustee”) filed an action against
us alleging that we received preferential treatment in connection with certain payments made on our behalf by Computrex. We
have not yet answered this complaint and will not need to do so as this action is currently in abeyance while the Trustee appeals
an adverse ruling against it in another matter having facts similar to those in the Trustee’s action against us. If and when we
answer, we intend to deny all of the material allegations made against us and defend this matter vigorously.
There are no other material pending legal proceedings, other than litigation that is incidental to the ordinary course of our
business, to which we or any of our subsidiaries are a party or of which our respective property is the subject. We do not believe
that any of the claims made against us in any of the pending matters have merit and, except for the employment matter of which
we intend to seek settlement, we intend to vigorously defend ourselves against them. As of December 31, 2004, because incurring
a loss relating to the employment matter is both probable and estimable, a loss contingency of $191,000 has been recorded.
We maintain directors’ and officers’ liability insurance which insures our individual directors and officers against certain
claims such as those alleged in the above lawsuits, as well as attorney’s fees and related expenses incurred in connection
with the defense of such claims.
Note 20. SimpleDevices, Inc. Acquisition
From October 1, 2004 through December 31, 2004, we acquired over 99% of the outstanding shares of SimpleDevices, Inc.
for approximately $12.8 million in cash, including direct acquisition costs of $0.3 million. We intend to purchase the remaining
shares when the sellers are located. The transaction also includes a potential performance-based payment of unregistered
common stock, if certain future financial objectives are achieved, which has not been reflected as part of the purchase price
as of December 31, 2004 since it is not probable such objectives will be achieved. The results of SimpleDevices’ operations
have been included in the consolidated financial statements since the date of acquisition.
The value we received from the acquisition relates primarily to SimpleDevices’ unique capabilities as well as their complete
and in-process technology. SimpleDevices has developed connected-device technology solutions that link the home computer
and the Internet to existing consumer electronic devices in the home and car.
The total purchase price of approximately $12.8 million, including direct acquisition costs, has been allocated to the net
assets acquired based on estimated fair values as follows (in thousands):
Current assets $ 274
Property, plant, and equipment 4
Intangible assets
Engineering contracts 370
Developed and core technology 1,630
Trademarks and trade names 840
In-process research and development (IPR&D) 240
Goodwill 7,146
Deferred tax asset 4,521
Total assets and IPR&D acquired 15,025
Current liabilities (2,264)
Purchase price $ 12,761
Amortizable intangible assets Of the total purchase price, approximately $2.8 million was allocated to amortizable intangible
assets including engineering contracts, developed and core technology, trademarks and trade names.

Universal Electronics Inc. 2004 Annual Report 71
Factors considered in estimating cash flows include historical margin levels, budgeted margin levels, the migration of the
acquired core/developed technology through subsequent advancements, the estimated life of the underlying technologies in
each of the products, and the value contribution estimated to be associated with the technology and industry norms. In general,
the estimated margins utilized in the valuation are reflective of the margins historically realized by SimpleDevices. Also reflec-
tive of historical experience, the margins are expected to increase over the product life cycle. The expectation for future selling,
general and administrative expenses likewise are reflective of historical experience and the assumptions used in SimpleDevices’
enterprise valuation model. Research and development costs were forecasted for each IPR&D project based upon the costs
required to bring the product to fruition and the additional costs associated with maintaining the product technology.
The expected operating margins for the IPR&D were reduced for contributory assets, including assessments for capital
expenditures and working capital employed, as well as a return on both the tangible assets and the identified intangibles
valued in the purchase price allocation.
The free cash flows (net of the various charges discussed above) generated by the in-process technologies in future periods
were discounted to their net present value by applying a reasonable discount rate. The discount rate applied to the individual
technologies was 24%. This discount rate reflects a “risk premium” of 2% over the weighted average cost of capital (WACC) of
22% computed for SimpleDevices. The WACC was determined based upon an analysis that considered selected industry data.
The WACC represents a blended, after-tax cost of debt and equity, and was calculated using a capital asset pricing model.
Through the date of this report, there have been no events or changes in circumstances that suggest the assumptions
used in the valuation of the IPR&D were not reasonable. SimpleDevices has continued its development of the in-process
technologies and anticipates deploying these technologies in end-products in a timeframe and manner consistent with the
projections used for valuation purposes.
The estimates used in valuing IPR&D were based upon assumptions believed to be reasonable, but which are inherently
uncertain and unpredictable. As a result, actual results may differ from estimates.
Potential Performance-Based Payment of Unregistered Common Stock On October 1, 2004, in conjunction with the purchase
of SimpleDevices, we executed a Stock Option Exchange Agreement (“agreement”) with the holders of non-vested options to
purchase the common stock of SimpleDevices. The terms of this agreement included the cancellation of these non-vested
options. In consideration for this cancellation we extended the right to receive 65,842 shares of Universal Electronic Inc.
unregistered stock contingent on meeting certain performance based criteria, including specified operating income levels
through the years ending December 31, 2005 and 2006. As of December 31, 2004 the probability that these performance
targets will be met is remote.
Pro forma results (unaudited) The following unaudited pro forma financial information presents the combined results of our
operations and SimpleDevices as if the acquisition had occurred as of the beginning of the periods presented. Adjustments of
$84,000 for the year ended December 31, 2004 and $113,000 for the year ended December 31, 2003 have been made to
the combined results of operations, reflecting primarily amortization of purchased intangible assets, net of tax.
Pro forma results were as follows for the years ended December 31, 2004 and 2003:
2 0 0 4 2 0 0 3 (1)
Revenue: $ 159,760,383 $ 121,869,691
Net income: $ 7,473,767 $ 4,934,244
Basic and diluted net income per share:
Basic $ 0.55 $ 0.36
Diluted $ 0.53 $ 0.35
(1) The pro-forma net income does not reflect the write-off of $240,000 of acquired in-process research and development of SimpleDevices.
The unaudited pro forma financial information is not intended to represent or be indicative of the consolidated results of
operations that would have been achieved had the acquisition actually been completed as of the dates presented, and should
not be taken as a projection of the future consolidated results of our operations.
70 Universal Electronics Inc. 2004 Annual Report
Engineering contracts represent SimpleDevices’ existing contracts to provide engineering services. In determining the fair
value of these engineering service agreements, we used the Income Approach and developed cash flows based on estimated
revenue for the contracts over their estimated remaining lives. The underlying premise of this approach is that the value of an
asset can be measured by the present worth of the net economic benefit (cash receipts less cash outlays) to be received over
the life of the subject asset. The steps followed in applying this approach include estimating the expected after-tax cash flows
attributable to the asset over its life and converting these after-tax cash flows to the present value through “discounting”. We
are amortizing the engineering contracts on a straight-line basis over an estimated useful life of approximately 5 years.
Developed and core technology consists of products that have reached technological feasibility. These items include most
of SimpleDevices’ product lines, principally the SimpleWare™ Platforms and SimpleWare™ Extension Technology. Developed
and core technology was valued utilizing the Income Approach. In valuing SimpleDevices’ technology, the initial focus was on
the amount of revenue generated by each project. Revenue estimates were based on a combination of: (i) aggregate revenue
growth rates for the business as a whole (the Company’s “business model”); (ii) anticipated product development and introduc-
tion schedules; (iii) product sales cycles; (iv) the estimated life of the product’s underlying technology; and (v) management’s
plans for development of each project. We are amortizing the developed and core technology on a straight-line basis over an
estimated useful life of approximately 5 years.
Trademarks and trade names represent the value of SimpleDevices’ name, which we intend to utilize going forward.
The value of this intangible was determined after the consideration of many factors, including the length of time that the
SimpleDevices name has been in use, the SimpleDevices brand awareness and market position and the plans for continued
use of the SimpleDevices brand within a portion of our overall product portfolio. In estimating the fair value of the “Simple”
trademark and trade name, the Relief from Royalty Method was employed. This method is based on the assumption that, in
lieu of ownership, a firm would be willing to pay a royalty in order to exploit the related benefits of this asset class. We are
amortizing the trademark and trade names on a straight-line basis over an estimated useful life of approximately 10 years.
Goodwill Goodwill represents the excess of the cost (purchase price) over the estimated fair value of the tangible and
identifiable intangible assets acquired and the liabilities assumed. Goodwill from this transaction of $7.1 million will not be
amortized, but will be analyzed for impairment on at least an annual basis in accordance with SFAS No. 142 (Note 3). We
performed an initial impairment review of this goodwill as of December 31, 2004, and will evaluate goodwill for impairment
annually as of December 31 and whenever events or changes in circumstances indicate that an impairment loss may have
occurred. Of the total goodwill recorded, none is expected to be deductible for tax purposes.
In-process research & development (IPR&D) The following is a description of the significant research and development
projects that were under development at the acquisition date which comprised the aggregate IPR&D charge of $240,000:
SimpleWare™ Platforms. SimpleWare™ Platforms include SimpleCenter™, SimpleDevice™, and SimpleSync™. These platforms
are core software products for SimpleDevices, Inc. These Platforms provide flexible, standards-based software development
kits and applications. The development kits enable OEMs to create customized device applications for different market demo-
graphics. SimpleWare™ Platform products and services include connected-device software, media server solutions, USB hard-
ware reference designs, and content service solutions. The SimpleWare™ Platforms had been introduced into the market, were
generating revenue, and had reached technological feasibility at the date of the acquisition, and were classified as core/
developed technology. The IPR&D related to SimpleWare™ Platforms includes research and development efforts underway to
significantly enhance certain features of this software. The associated IPR&D charge for this technology is $200,000.
SimpleWare Extensions. SimpleWare™ Extensions include MediaShare, MediaSkins, MediaProvisioning, MediaExplorer, Digital
Rights Management, and Ripping. SimpleWare™ Extensions are add-ons to the core software products, SimpleWare™ Platforms.
The IPR&D related to SimpleWare™ Extensions includes research and development efforts underway to significantly enhance
certain features of these add-ons. The associated IPR&D charge for this technology is $40,000.
Basis for In-Process R&D Valuation Assumptions As noted above, the projects in development as of the acquisition date are
expected to reach technological feasibility over a period of approximately six to twelve months subsequent to the acquisition
date. Cash flows from the sale of software incorporating these technologies are expected to extend through the year 2009
and are forecasted using a product life cycle approach.

Universal Electronics Inc. 2004 Annual Report 7372 Universal Electronics Inc. 2004 Annual Report
Supplementary Data
Quarterly Financial Data (Unaudited) (In thousands)
Summarized quarterly financial data for the years ended December 31, 2004 and 2003 is presented below.
2004 March 31, June 30, Sep. 30, Dec. 31,(2)
Net sales $ 32,611,427 $ 34,011,395 $ 40,046,571 $ 51,710,333
Gross profit 12,664,173 12,879,801 15,792,458 20,243,605
Operating income 2,080,453 2,417,463 3,295,283 5,746,906
Net income 1,778,334 1,687,713 1,928,298 3,719,044
Earnings per share (1):
Basic $ 0.13 $ 0.13 $ 0.14 $ 0.27
Diluted $ 0.13 $ 0.12 $ 0.14 $ 0.26
Shares used in computing earnings per share:
Basic 13,714,685 13,483,250 13,495,904 13,579,564
Diluted 14,052,213 13,889,464 14,028,537 14,206,006
2003 March 31, June 30, Sep. 30, Dec. 31,
Net sales $ 26,918,697 $ 27,711,796 $ 30,300,217 $ 35,537,076
Gross profit 10,156,897 10,830,374 11,832,663 13,479,567
Operating income 1,305,943 1,577,218 2,390,154 3,300,167
Net income 939,045 1,201,629 1,666,992 2,459,149
Earnings per share (1):
Basic $ 0.07 $ 0.09 $ 0.12 $ 0.18
Diluted $ 0.07 $ 0.09 $ 0.12 $ 0.17
Shares used in computing earnings per share:
Basic 13,581,581 13,612,039 13,750,669 13,835,281
Diluted 13,785,008 13,880,922 14,145,423 14,186,574
(1) Net income per common share calculations for each of the quarters were based upon the weighted average number of shares outstanding for each period, and the
sum of the quarters may not be equal to the full year net income per common share amount.
(2) The comparability of the financial data for the quarter ended December 31, 2004 is affected by the October 1, 2004 acquisition of SimpleDevices, Inc. and the
inclusion of their financial results.
Controls and Procedures
Disclosure Controls and Procedures
As of December 31, 2004, management, including our Chief Executive Officer and Chief Financial officer, conducted an evalua-
tion of the effectiveness of the design and operation of the Company’s disclosure controls and procedures pursuant to Exchange
Act Rule 13a-15(b). Based on this evaluation, our Chief Executive Officer and Chief Financial Officer concluded as of the
evaluation date that our disclosure controls and procedures were effective such that the information relating to the Company,
including our consolidated subsidiaries, required to be disclosed in our Securities and Exchange Commission (“SEC”) reports
(i) is recorded, processed, summarized and reported within the time periods specified in SEC rules and forms, and (ii) is ac-
cumulated and communicated to our management, including our Chief Executive Officer and Chief Financial Officer, as appro-
priate to allow timely decisions regarding required disclosure.
Internal Control Over Financial Reporting
Management’s Annual Report on Internal Control Over Financial Reporting Our management is responsible for establishing
and maintaining adequate internal control over financial reporting, as such term is defined in Exchange Act Rule 13a-15(f).
Under the supervision and with the participation of our management, including our Chief Executive Officer and Chief Financial
Officer, we evaluated the effectiveness of our internal control over financial reporting based on the framework in Internal
Control-Integrated Framework issued by the Committee of Sponsoring Organizations of the Treadway Commission. Based
on our evaluation under that framework, our management concluded that our internal control over financial reporting was
effective as of December 31, 2004.
Our management has excluded SimpleDevices Inc. from its assessment of internal control over financial reporting as of
December 31, 2004 because they were acquired during 2004. SimpleDevices is a subsidiary whose total assets and total
revenues represent 9.24% and .52%, respectively, of the related consolidated financial statement amounts as of and for the
year ended December 31, 2004.
Our management’s assessment of the effectiveness of our internal control over financial reporting as of December 31,
2004 has been audited by PricewaterhouseCoopers LLP, an independent registered public accounting firm, as stated in its
attestation report which is included herein.
Changes in Internal Control Over Financial Reporting There have been no changes in internal controls or in other factors
that could significantly affect our internal controls subsequent to the date the Chief Executive Officer and Chief Financial
Officer completed their evaluation.

Universal Electronics Inc. 2004 Annual Report 75
the Public Company Accounting Oversight Board (United States). Those standards require that we plan and perform the audit
to obtain reasonable assurance about whether effective internal control over financial reporting was maintained in all material
respects. An audit of internal control over financial reporting includes obtaining an understanding of internal control over
financial reporting, evaluating management’s assessment, testing and evaluating the design and operating effectiveness of
internal control, and performing such other procedures as we consider necessary in the circumstances. We believe that our
audit provides a reasonable basis for our opinions.
A company’s internal control over financial reporting is a process designed to provide reasonable assurance regarding the
reliability of financial reporting and the preparation of financial statements for external purposes in accordance with generally
accepted accounting principles. A company’s internal control over financial reporting includes those policies and procedures
that (i) pertain to the maintenance of records that, in reasonable detail, accurately and fairly reflect the transactions and dis-
positions of the assets of the company; (ii) provide reasonable assurance that transactions are recorded as necessary to permit
preparation of financial statements in accordance with generally accepted accounting principles, and that receipts and expen-
ditures of the company are being made only in accordance with authorizations of management and directors of the company;
and (iii) provide reasonable assurance regarding prevention or timely detection of unauthorized acquisition, use, or disposition
of the company’s assets that could have a material effect on the financial statements.
Because of its inherent limitations, internal control over financial reporting may not prevent or detect misstatements. Also,
projections of any evaluation of effectiveness to future periods are subject to the risk that controls may become inadequate
because of changes in conditions, or that the degree of compliance with the policies or procedures may deteriorate.
As described in the accompanying Management’s Annual Report on Internal Control Over Financial Reporting, manage-
ment has excluded SimpleDevices, Inc. from its assessment of internal control over financial reporting as of December 31,
2004 because it was acquired by the Company in a purchase business combination during 2004. We have also excluded
SimpleDevices, Inc. from our audit of internal control over financial reporting. The Company acquired over 99% of the out-
standing shares of SimpleDevices, Inc., whose total assets and total revenues represent 9.24% and 0.52%, respectively,
of the related consolidated financial statement amounts as of and for the year ended December 31, 2004.
PricewaterhouseCoopers LLP
Orange County, California
March 16, 2005
74 Universal Electronics Inc. 2004 Annual Report
To the Board of Directors and Stockholders of Universal Electronics Inc.:
We have completed an integrated audit of Universal Electronics Inc.’s consolidated financial statements and of its internal
control over financial reporting as of December 31, 2004 and audits of its 2003 and 2002 consolidated financial statements
in accordance with the standards of the Public Company Accounting Oversight Board (United States). Our opinions, based on
our audits, are presented below.
Consolidated financial statements and financial statement schedule In our opinion, the accompanying consolidated financial
statements, present fairly, in all material respects, the financial position of Universal Electronics Inc. and its subsidiaries at
December 31, 2004 and 2003, and the results of their operations and their cash flows for each of the three years in the period
ended December 31, 2004 in conformity with accounting principles generally accepted in the United States of America. In addi-
tion, in our opinion, the accompanying financial statement schedules present fairly, in all material respects, the information set
forth therein when read in conjunction with the related consolidated financial statements. These financial statements and the
financial statement schedules are the responsibility of the Company’s management. Our responsibility is to express an opinion
on these financial statements and the financial statement schedules based on our audits. We conducted our audits of these
statements in accordance with the standards of the Public Company Accounting Oversight Board (United States). Those
standards require that we plan and perform the audit to obtain reasonable assurance about whether the financial statements
are free of material misstatement. An audit of financial statements includes examining, on a test basis, evidence supporting the
amounts and disclosures in the financial statements, assessing the accounting principles used and significant estimates made
by management, and evaluating the overall financial statement presentation. We believe that our audits provide a reasonable
basis for our opinion.
Internal control over financial reporting Also, in our opinion, management’s assessment, included in the accompanying
Management’s Annual Report on Internal Control Over Financial Reporting, that the Company maintained effective internal
control over financial reporting as of December 31, 2004 based on criteria established in Internal Control — Integrated Frame-
work issued by the Committee of Sponsoring Organizations of the Treadway Commission (“COSO”), is fairly stated, in all material
respects, based on those criteria. Furthermore, in our opinion, the Company maintained, in all material respects, effective internal
control over financial reporting as of December 31, 2004, based on criteria established in Internal Control — Integrated Frame-
work issued by the COSO. The Company’s management is responsible for maintaining effective internal control over financial
reporting and for its assessment of the effectiveness of internal control over financial reporting. Our responsibility is to express
opinions on management’s assessment and on the effectiveness of the company’s internal control over financial reporting
based on our audit. We conducted our audit of internal control over financial reporting in accordance with the standards of
Report of Independent Registered Public Accounting Firm

76 Universal Electronics Inc. 2004 Annual Report
Directors
Paul D. ArlingChairman and Chief Executive OfficerUniversal Electronics Inc.Cypress, California
Satjiv S. ChahilAdvisor to the CEOpalmOne, Inc.Los Altos, California
Bruce A. Henderson1,2
Chairman and Chief Executive OfficerImation CorporationOakdale, Minnesota
William C. Mulligan1,3
Managing DirectorPrimus Venture Partners, Inc.Cleveland, Ohio
J.C. Sparkman1,2,3
Retired Executive Vice President and Chief Operating OfficerTCIDenver, CO
1. Member, Audit Committee
2. Member, Compensation Committee
3. Member, Corporate Governance &
Nominating Committee
Universal Electronics Inc. is
an equal opportunity employer
Officers
Paul D. ArlingChairman and Chief Executive Officer
Robert P. LillenessPresident and Chief Operating Officer
Richard A. Firehammer, Jr.Senior Vice President, General Counseland Secretary
John S. AmesSenior Vice President of Sales
Paul J. M. BennettSenior Vice President, Managing Director, Europe
Patrick H. HayesVice President of Core Technology
Pam PriceVice President of Cable Sales
Ramzi S. AmmariVice President of Product Development
Jacques MathijsenVice President of Product, Planning and Strategy, Europe
Olav PouwVice President of Sales, Europe
Corporate Office
6101 Gateway DriveCypress, California 90630
Annual Meeting
4:00 p.m. June 15, 2005Universal Electronics Inc.6101 Gateway DriveCypress, California 90630
Independent Registered Public Accounting Firm
PricewaterhouseCoopers LLPIrvine, California
Registrar & Transfer Agent
Computershare Investor Services2 North LaSalle StreetChicago, Illinois 60602Phone (312) 588-4991
Form 10-K
Any stockholder who desires a copy of the Company’s 2004 Annual Report on Form 10-K filed with the Securities and Exchange Commission may obtain a copy (excluding exhibits) without charge by addressing a request to:
Investor RelationsUniversal Electronics Inc. 6101 Gateway Drive Cypress, California 90630 A charge equal to the reproduction cost will be made if the exhibits are requested.
Universal’s Internet address is www.uei.com. Universal makes available through its Internet Web site its annual report on Form 10-K. Investors can also obtain copies of our SEC filings from the SEC Web site at www.sec.gov
Locations
6101 Gateway DriveCypress, California 90630
1864 Enterprise Parkway WestTwinsburg, Ohio 44087
The NetherlandsUniversal Electronics BVInstitutenweg 21 7521 PHEnschede, Netherlands
Design
ramp creative+design
Los Angeles, CA
Corporate Information

Universal Electronics Inc.
6101 Gateway Drive,
Cypress, CA 90630
Phone 714.820.1000
www.uei.com
Universal Electronics Inc.
giving you the power
2004 Annual Report