Embed Size (px)
Citation preview
Unit 2.3: Introduction to DNA microarrays
Objectives:
-learn the major types and uses of DNA microarrays
-be introduced to the basic principles of analysis of microarray data
Readings:
Trevino, V., Falciani, F., and Barrera-Saldana, H.A. 2007. DNA microarrays: a powerful genomic tool for biomedical and clinical research. Mol Med 13: 527-541.
Kato, H., Saito, K., and Kimura, T. 2005. A perspective on DNA microarray technology in food and nutritional science. Curr Opin Clin Nutr Metab Care 8: 516-522.
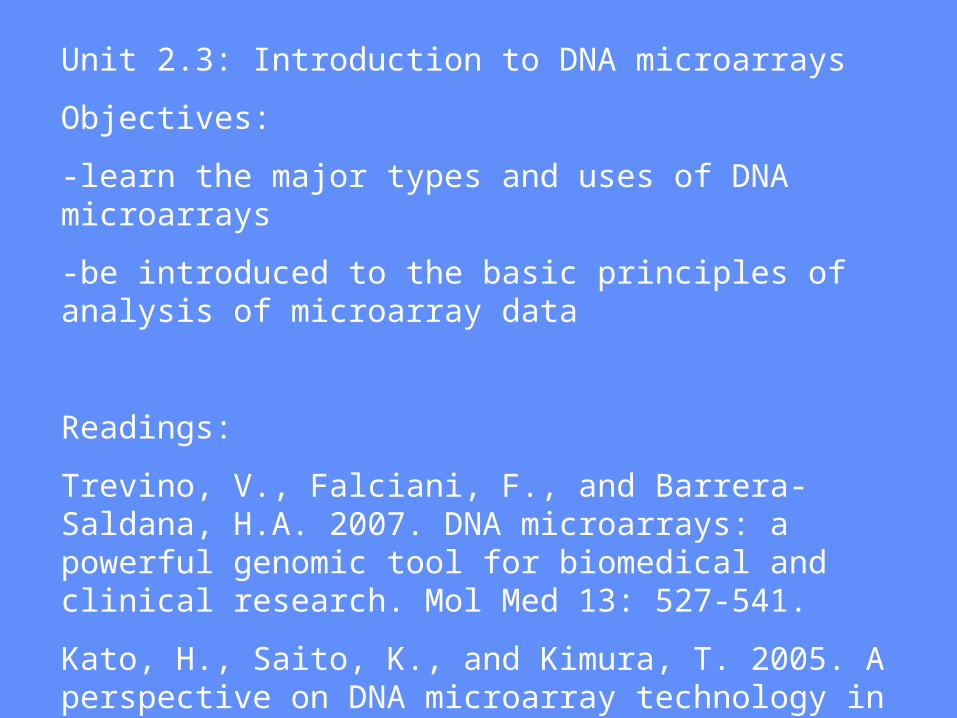
• transcription• post transcription (RNA stability)
• post transcription (translational control)• post translation (not considered gene regulation)
the “transcriptome”
Genes can be regulated at many levels
RNA PROTEINDNATRANSCRIPTION TRANSLATION
Usually, when we speak of gene regulation, we are referring to transcriptional regulation. The complete set of all genes being transcribed are referred to as the “transcriptome.”
In the last dozen years, it has become possible to look at the entire transcriptome in a single experiment!
While there are a number of variations, there are essentially two basic ways of doing this—using sequencing-based methods and microarrays. These have largely replaced older methods such as subtractive hybridization and differential display.
Sequencing-based methods are very powerful but have typically been prohibitively expensive. However, with recent advances in low-cost, high-throughput next generation sequencing, these methods—referred to as “RNA-seq”—are becoming more common and may soon be dominant.
Genomic analysis of gene expression
• Methods capable of giving a “snapshot” of RNA expression of all genes
• Can be used as diagnostic profile– Example: cancer diagnosis
• Can show how RNA levels change during development, after exposure to stimulus, during cell cycle, etc.
• Provides large amounts of data• Can help us start to understand how whole systems function
Benfey and Protopapas, "Genomics" © 2005 Prentice Hall Inc. / A Pearson Education Company / Upper Saddle River, New Jersey 07458
Although details of the methods vary, the concept behind RNA-seq is simple:
• isolate all mRNA
• convert to cDNA using reverse transcriptase
• sequence the cDNA
• map sequences to the genome
The more times a given sequence is detected, the more abundantly transcribed it is. If enough sequences are generated, a comprehensive and quantitative view of the entire transcriptome of an organism or tissue can be obtained.
RNA-seq
Microarrays may eventully be eclipsed by sequence-based methods, but meanwhile have become incredibly popular since their inception in 1995 (Schena et al. (1995) Science 270:467-70).
Microarrays are based on the ability of complementary strands of DNA (or DNA and RNA) to hybridize to one another in solution with high specificity.
There are now many variations. We’ll take a quick look at the two basic types: Affymetrix (high density oligonucleotide) and glass slide (cDNA, long oligo, etc). Both are conceptually similar, with differences in manufacture and details of design and analysis.
DNA microarrays
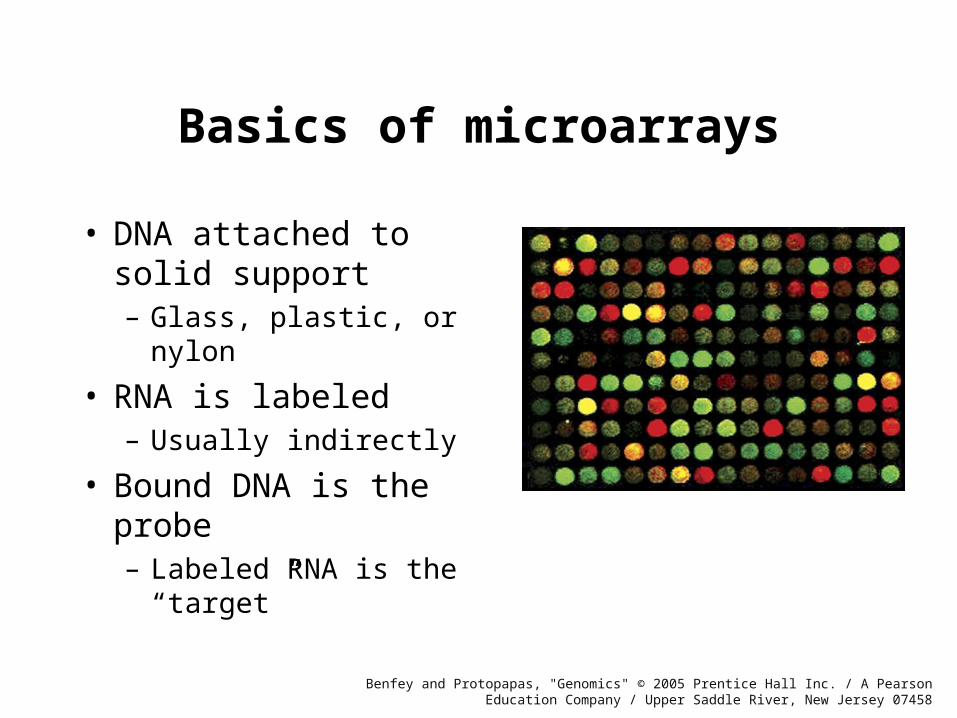
Basics of microarrays
• DNA attached to solid support– Glass, plastic, or nylon
• RNA is labeled– Usually indirectly
• Bound DNA is the probe– Labeled RNA is the “target”
Benfey and Protopapas, "Genomics" © 2005 Prentice Hall Inc. / A Pearson Education Company / Upper Saddle River, New Jersey 07458
For slide-based microarrays, the probe DNA is affixed directly to the surface of a glass microscope slide. The probe DNA can range from a medium-length oligonucleotide (e.g., 60 nt) to an entire cDNA clone or larger. Oligonucleotide arrays have become more common and can be obtained from several different commercial vendors.
The DNA is deposited on the slide by any of a number of methods, including “printing” with what is essentially an ink-jet printer and spotting using a robotically controlled set of fine-tipped metal pins. An example of the latter is seen in the following slides:
Slide-based DNA microarrays
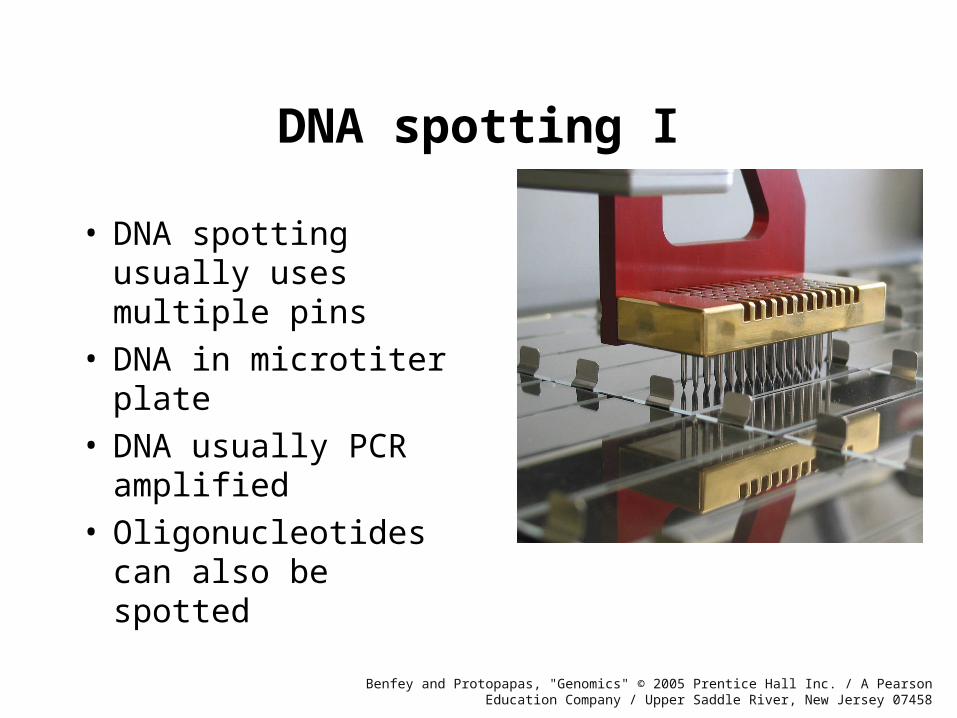
DNA spotting I
• DNA spotting usually uses multiple pins
• DNA in microtiter plate
• DNA usually PCR amplified
• Oligonucleotides can also be spotted
Benfey and Protopapas, "Genomics" © 2005 Prentice Hall Inc. / A Pearson Education Company / Upper Saddle River, New Jersey 07458
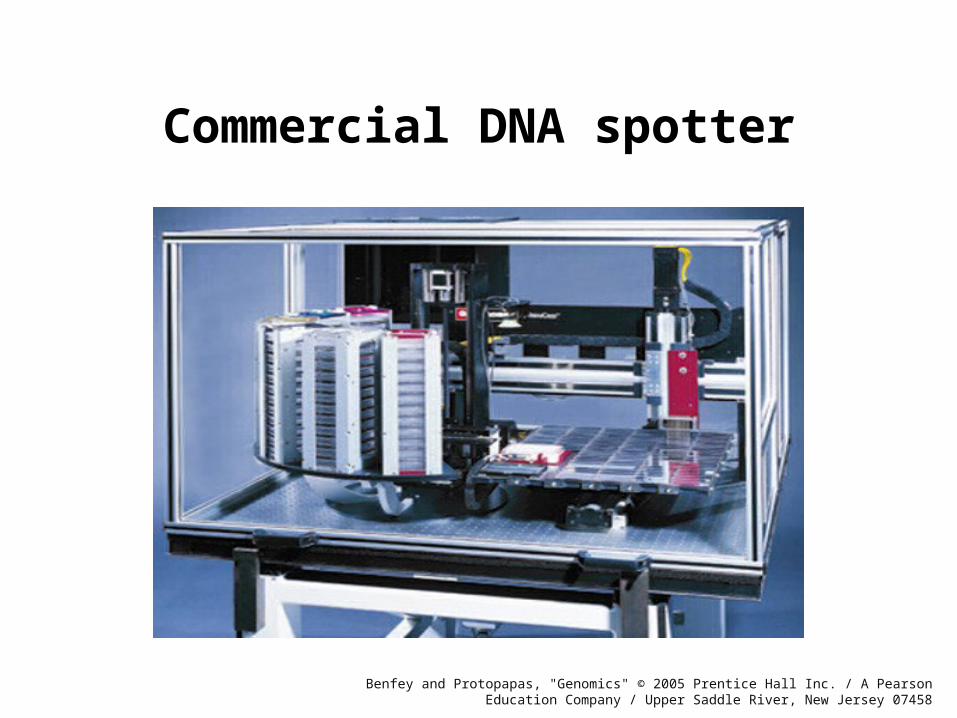
Commercial DNA spotter
Benfey and Protopapas, "Genomics" © 2005 Prentice Hall Inc. / A Pearson Education Company / Upper Saddle River, New Jersey 07458
Movie of microarray spotting
QuickTime™ and aYUV420 codec decompressor
are needed to see this picture.
QuickTime™ and aYUV420 codec decompressor
are needed to see this picture.
Benfey and Protopapas, "Genomics" © 2005 Prentice Hall Inc. / A Pearson Education Company / Upper Saddle River, New Jersey 07458
Slide-based DNA microarrays
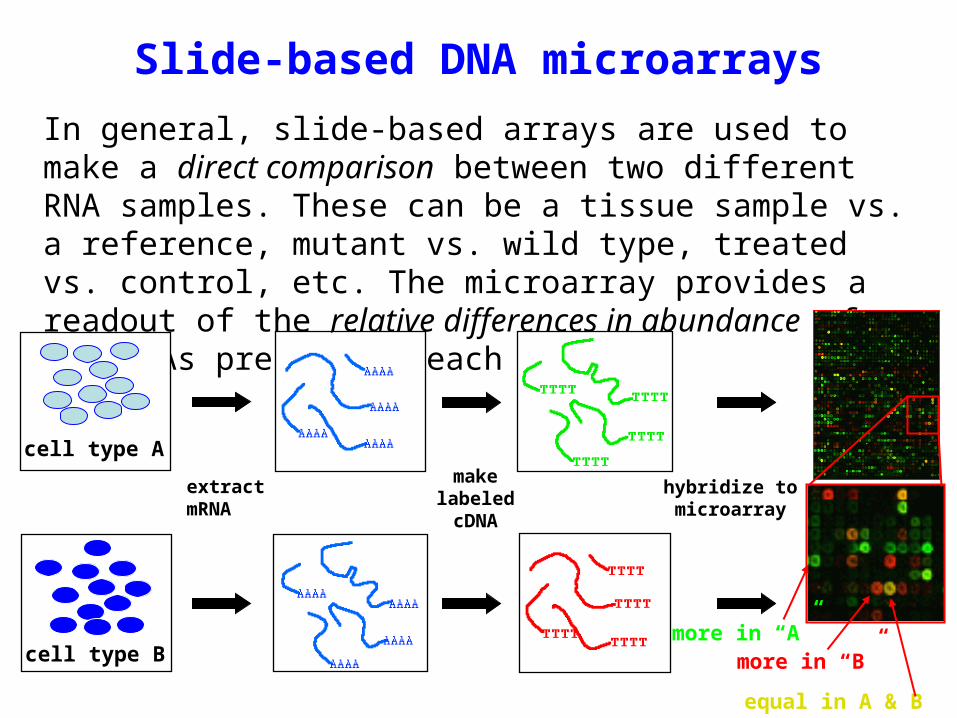
In general, slide-based arrays are used to make a direct comparison between two different RNA samples. These can be a tissue sample vs. a reference, mutant vs. wild type, treated vs. control, etc. The microarray provides a readout of the relative differences in abundance of the RNAs present in each sample.
extract mRNA
make labeled cDNA
hybridize to microarray
cell type A
cell type Bmore in “A”
more in “B”
equal in A & B
cDNA microarrays: key points
•hybridize two samples/chip (i.e., direct comparison of samples)
• non-standardized production can affect reproducibility (i.e., depends a lot on who made them), although there are now many quality-controlled commercial arrays available
• longer sequences can have cross-hybridization with other genes
• don’t necessarily need to know all genes in genome: can use unsequenced ESTs, for instance
Affymetrix GeneChips
• Oligonucleotides– Usually 20–25 bases in length– 10–20 different oligonucleotides for each gene
• Oligonucleotides for each gene selected by computer program to be the following:– Unique in genome– Nonoverlapping
• Composition based on design rules• Empirically derived
Benfey and Protopapas, "Genomics" © 2005 Prentice Hall Inc. / A Pearson Education Company / Upper Saddle River, New Jersey 07458
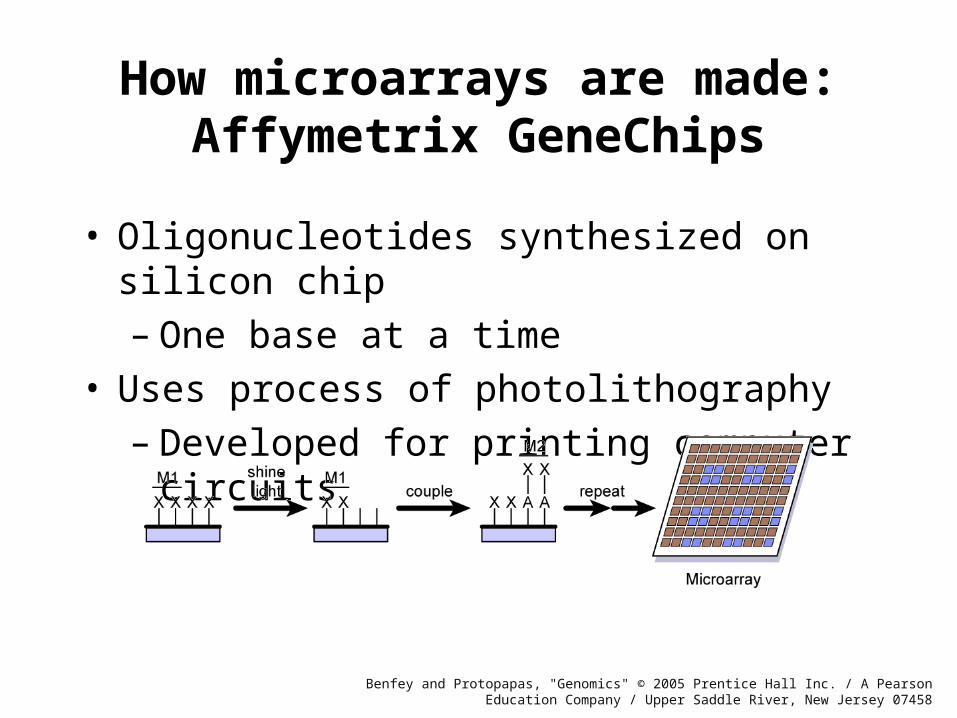
How microarrays are made:Affymetrix GeneChips
• Oligonucleotides synthesized on silicon chip– One base at a time
• Uses process of photolithography– Developed for printing computer circuits
Benfey and Protopapas, "Genomics" © 2005 Prentice Hall Inc. / A Pearson Education Company / Upper Saddle River, New Jersey 07458
Affymetrix GeneChips
probe pair Mismatch probe cells
(12-20/gene)
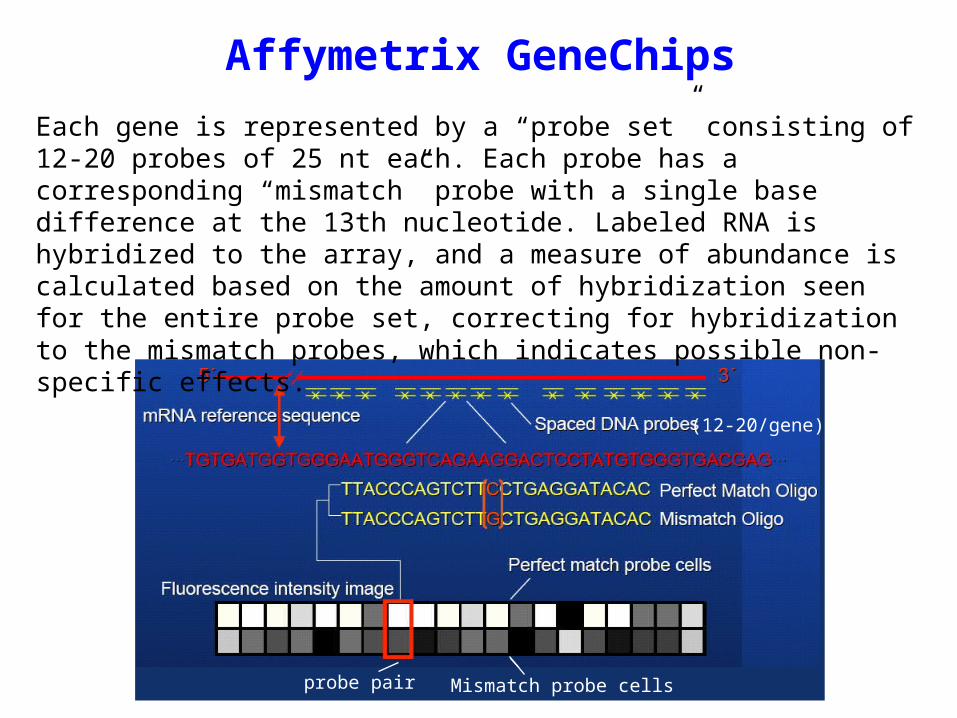
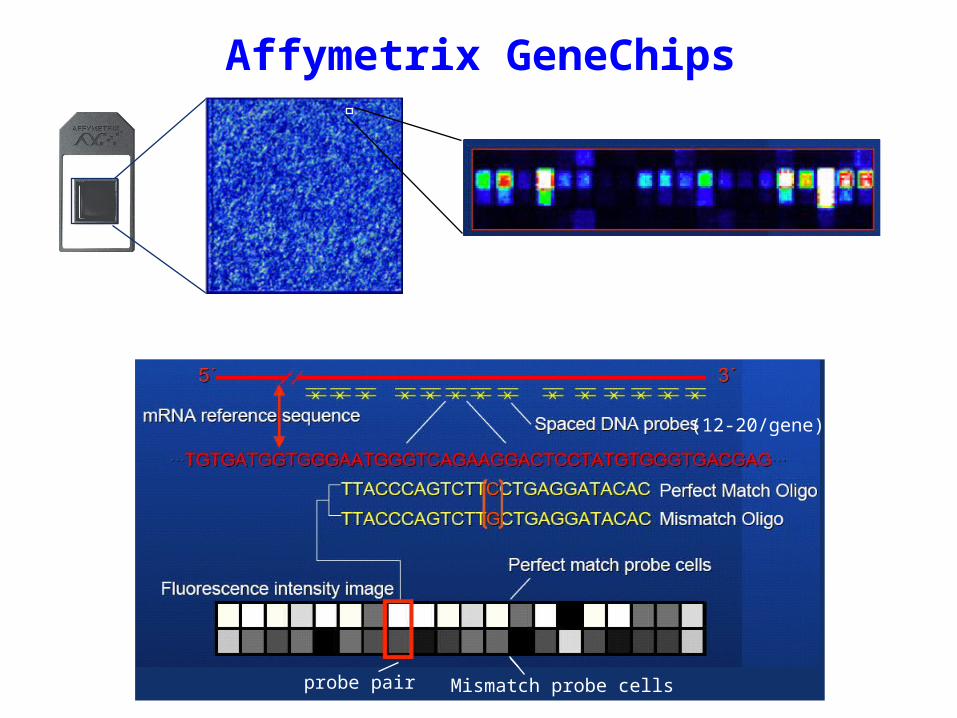
Each gene is represented by a “probe set” consisting of 12-20 probes of 25 nt each. Each probe has a corresponding “mismatch” probe with a single base difference at the 13th nucleotide. Labeled RNA is hybridized to the array, and a measure of abundance is calculated based on the amount of hybridization seen for the entire probe set, correcting for hybridization to the mismatch probes, which indicates possible non-specific effects.
probe pair Mismatch probe cells
(12-20/gene)
Affymetrix GeneChips
Affymetrix: key points
• can hybridize only one sample/chip (i.e., no direct comparisons of 2 samples)
• standardized production tends to give good reproducibility
• limited amount of probe sequence can be problematic (miss alternative splices, bias toward one end of transcript, dependent on good genome annotation), but can also be helpful in limiting cross- hybridization
Comparison of microarray hybridization
• Spotted microarrays– Competitive hybridization
•Two labeled cDNAs hybridized to same slide
• Affymetrix GeneChips– One labeled RNA population per chip– Comparison made between hybridization intensities of same oligonucleotides on different chips
Benfey and Protopapas, "Genomics" © 2005 Prentice Hall Inc. / A Pearson Education Company / Upper Saddle River, New Jersey 07458
Uses of microarrays
• Gene discovery- tissue profiles- time course data- altered genetic backgrounds
• Comparing tissues/genotypes
there are still some inherent difficulties here
• Classification
there’s a lot of promise in medicine (especially cancer research) for this
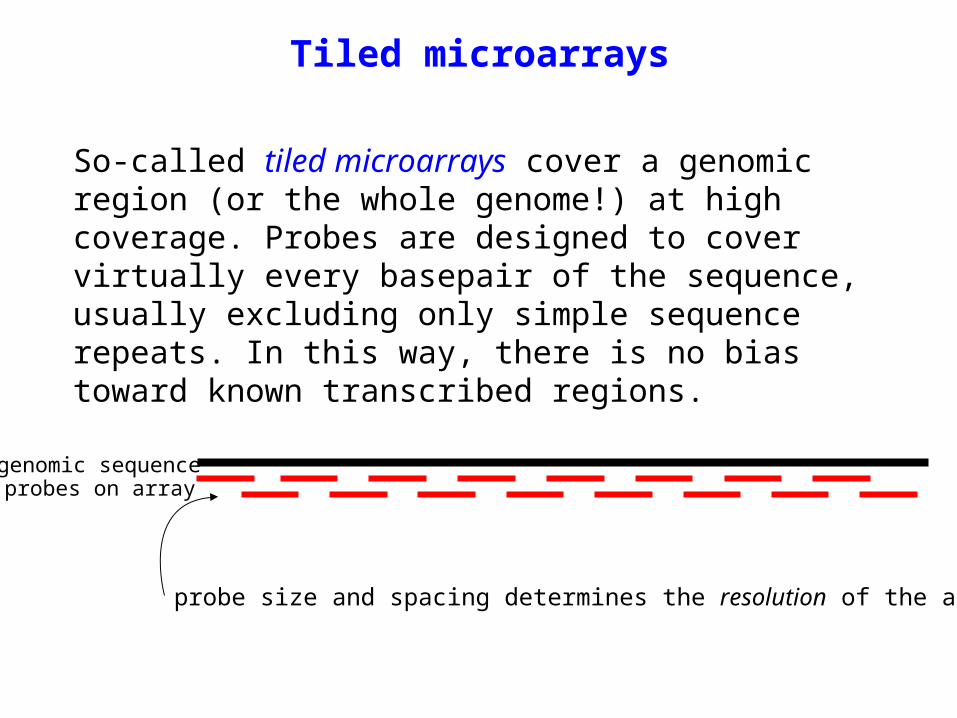
Tiled microarrays
So-called tiled microarrays cover a genomic region (or the whole genome!) at high coverage. Probes are designed to cover virtually every basepair of the sequence, usually excluding only simple sequence repeats. In this way, there is no bias toward known transcribed regions.
genomic sequenceprobes on array
probe size and spacing determines the resolution of the array
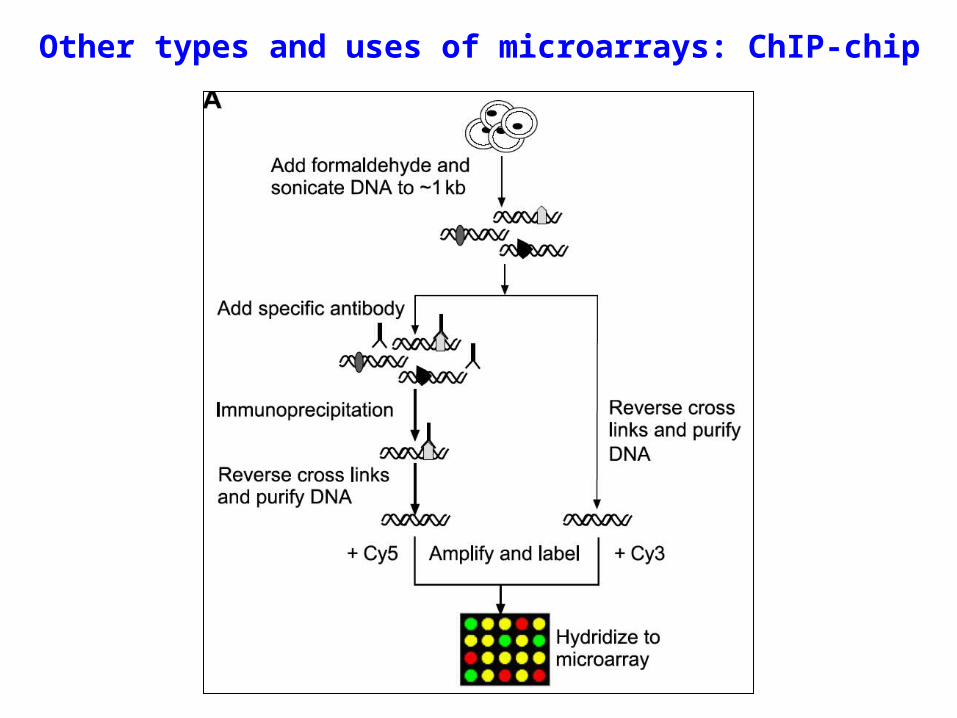
Other types and uses of microarrays: ChIP-chip
Microarray technology can be combined with other methods for purposes in addition to looking at transcription (“transcriptional profiling”). For instance, it can be used along with chromatin immunoprecipitation (ChIP) to look at proteins bound to DNA within the cell. This works best with whole genome tiling arrays and be used to look at transcription factor binding and post translation modifications to histone proteins.
Other types and uses of microarrays: ChIP-chip

ChIP-chip
Other types and uses of microarrays: RIP-chip
Similar to ChIP-chip but for discovering RNA binding proteins rather than DNA binding proteins
Tenenbaum, S.A., Carson, C.C., Lager, P.J., Keene, J.D. 2000. Identifying mRNA subsets in messenger ribonucleoprotein complexes by using cDNA arrays. Proc. Natl. Acad. Sci. 97: 14085–14090.
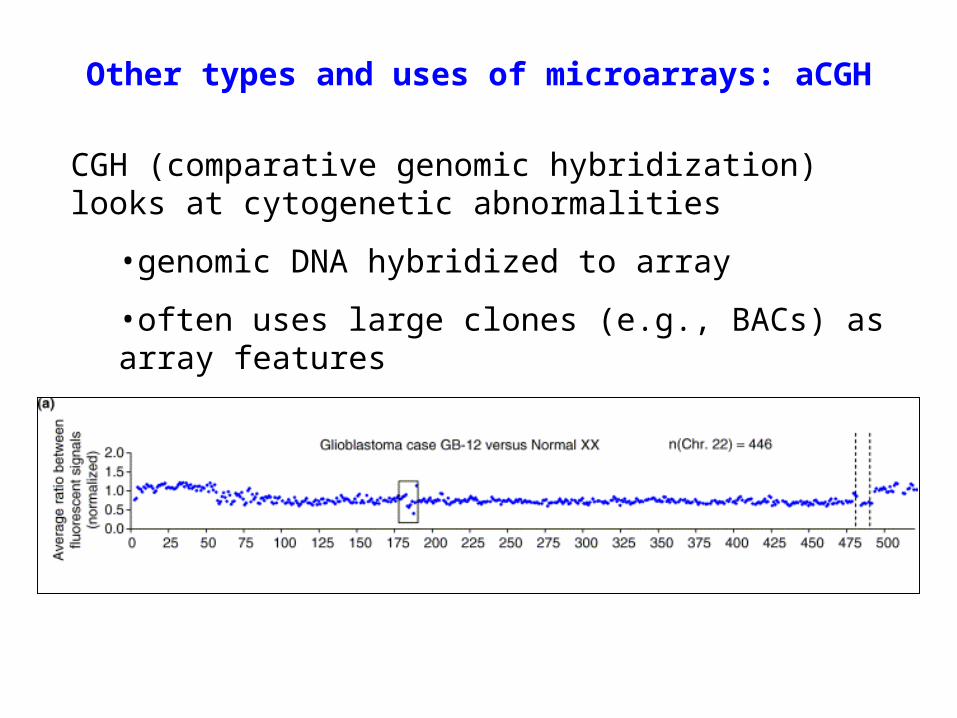
Other types and uses of microarrays: aCGH
CGH (comparative genomic hybridization) looks at cytogenetic abnormalities
•genomic DNA hybridized to array
•often uses large clones (e.g., BACs) as array features
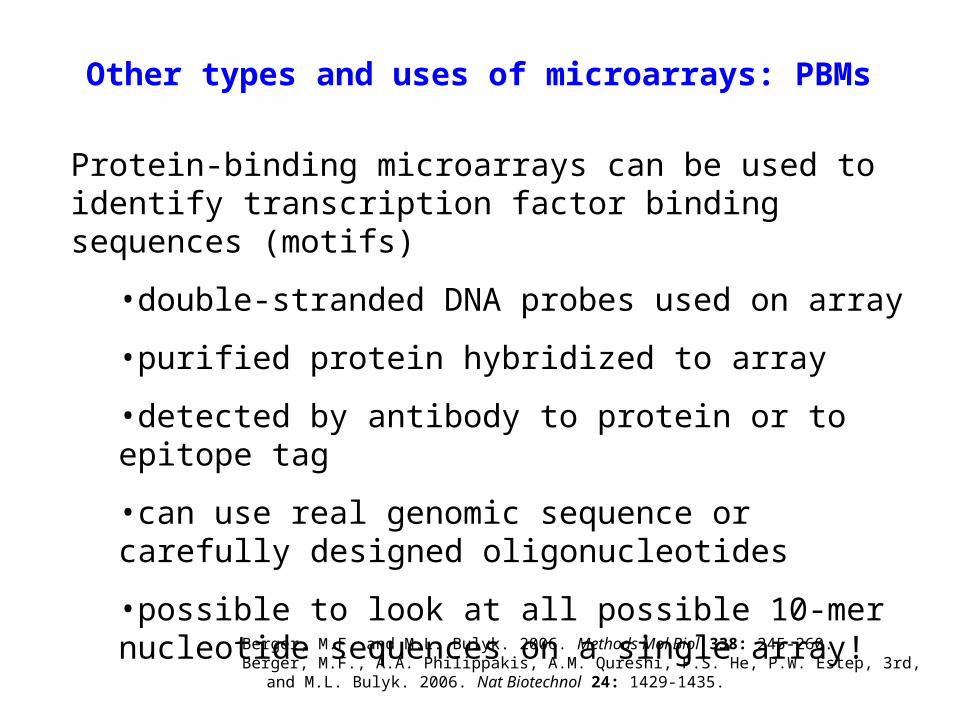
Other types and uses of microarrays: PBMs
Protein-binding microarrays can be used to identify transcription factor binding sequences (motifs)
•double-stranded DNA probes used on array
•purified protein hybridized to array
•detected by antibody to protein or to epitope tag
•can use real genomic sequence or carefully designed oligonucleotides
•possible to look at all possible 10-mer nucleotide sequences on a single array!Berger, M.F. and M.L. Bulyk. 2006. Methods Mol Biol 338: 245-260.
Berger, M.F., A.A. Philippakis, A.M. Qureshi, F.S. He, P.W. Estep, 3rd, and M.L. Bulyk. 2006. Nat Biotechnol 24: 1429-1435.
Validation of data
There’s no way that all of your microarray data can be validated.
It’s strongly recommended that any key findings be verified by independent means.
Northern blots and quantitative RT-PCR are the typical ways of doing this; real-time, quantitative RT-PCR is generally the method of choice.
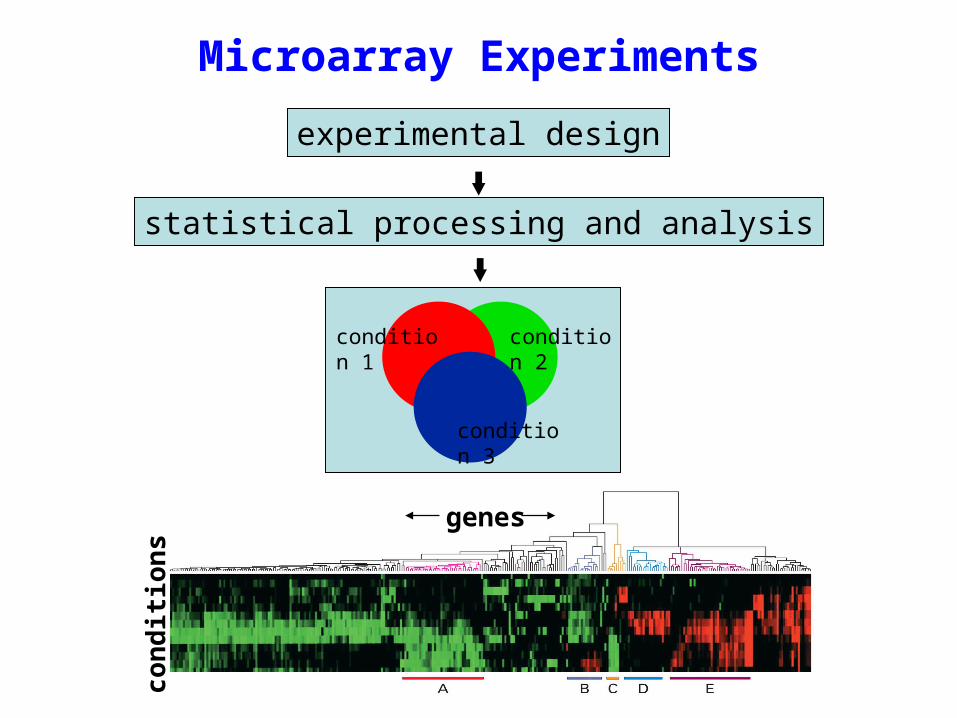
Microarray Experiments
genes
conditions
condition 1
condition 2
condition 3
statistical processing and analysis
experimental design
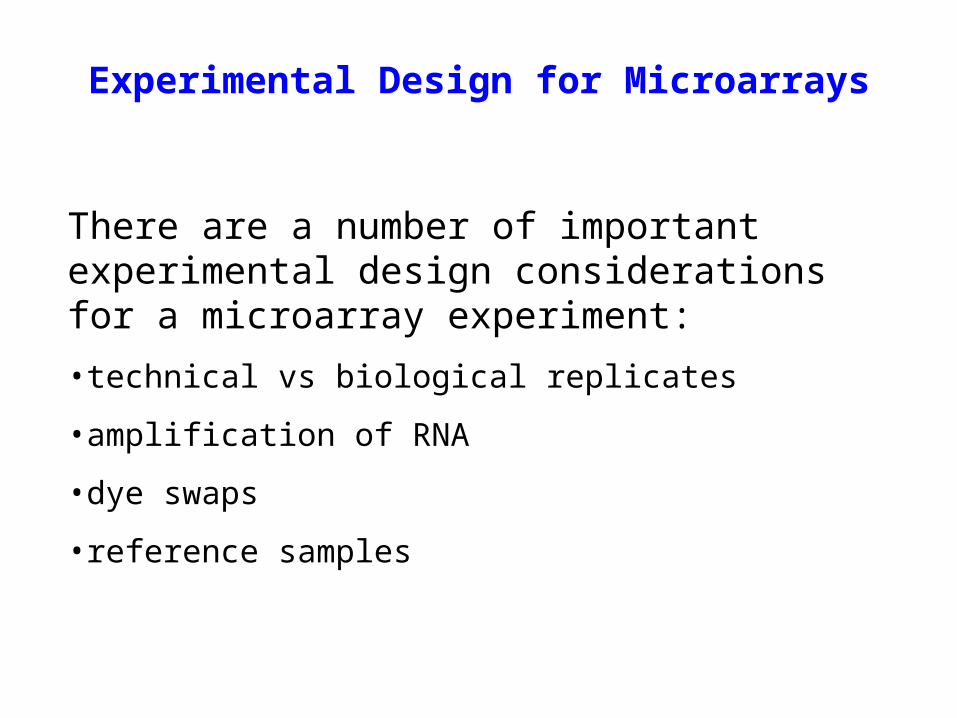
Experimental Design for Microarrays
There are a number of important experimental design considerations for a microarray experiment:
•technical vs biological replicates
•amplification of RNA
•dye swaps
•reference samples
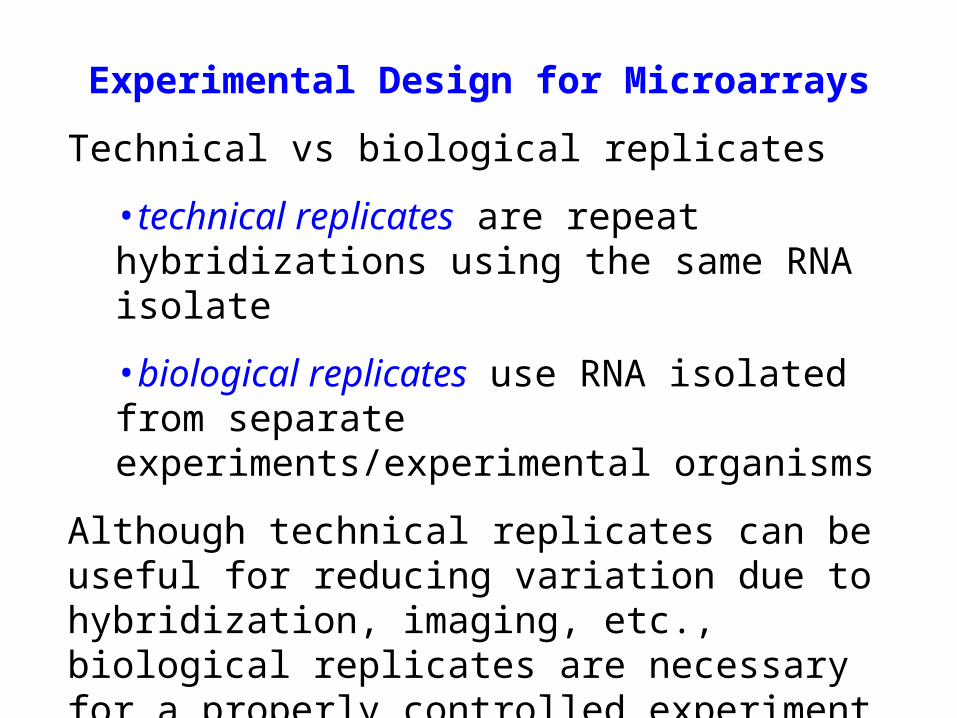
Experimental Design for Microarrays
Technical vs biological replicates
•technical replicates are repeat hybridizations using the same RNA isolate
•biological replicates use RNA isolated from separate experiments/experimental organisms
Although technical replicates can be useful for reducing variation due to hybridization, imaging, etc., biological replicates are necessary for a properly controlled experiment
Experimental Design for Microarrays
Amplification of RNA
• linear amplification methods can be used to increase the amount of RNA so that microarray experiments can be performed using very small numbers of cells. It’s not clear to what degree this affects results, especially with respect to rare transcripts, but seems to be generally OK if done correctly
Experimental Design for Microarrays
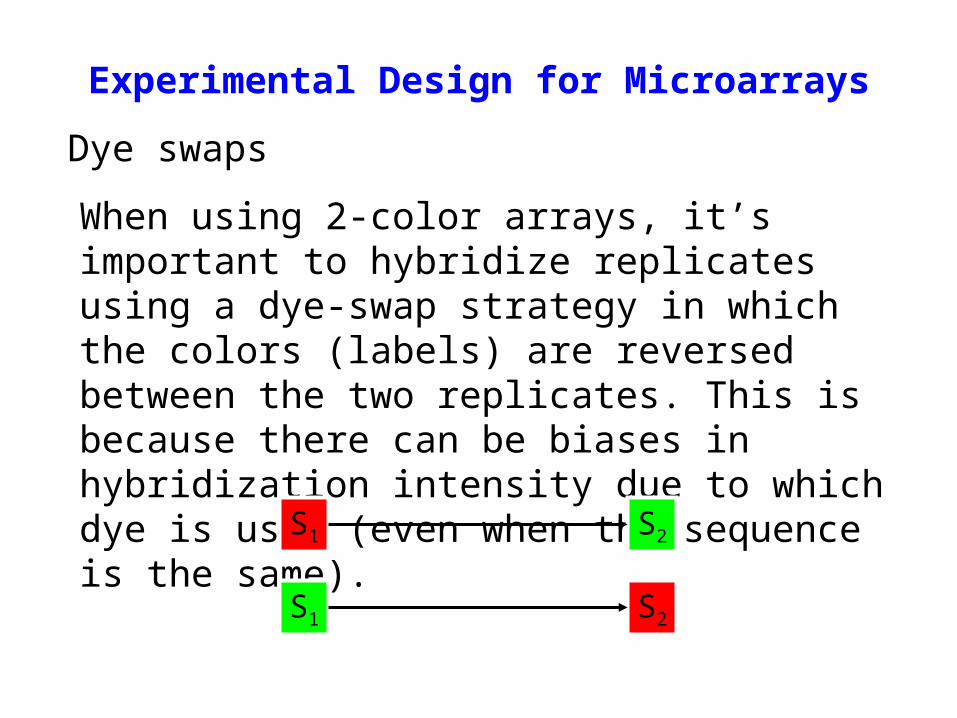
Dye swaps
When using 2-color arrays, it’s important to hybridize replicates using a dye-swap strategy in which the colors (labels) are reversed between the two replicates. This is because there can be biases in hybridization intensity due to which dye is used (even when the sequence is the same).
S1 S2
S1 S2
Experimental Design for Microarrays
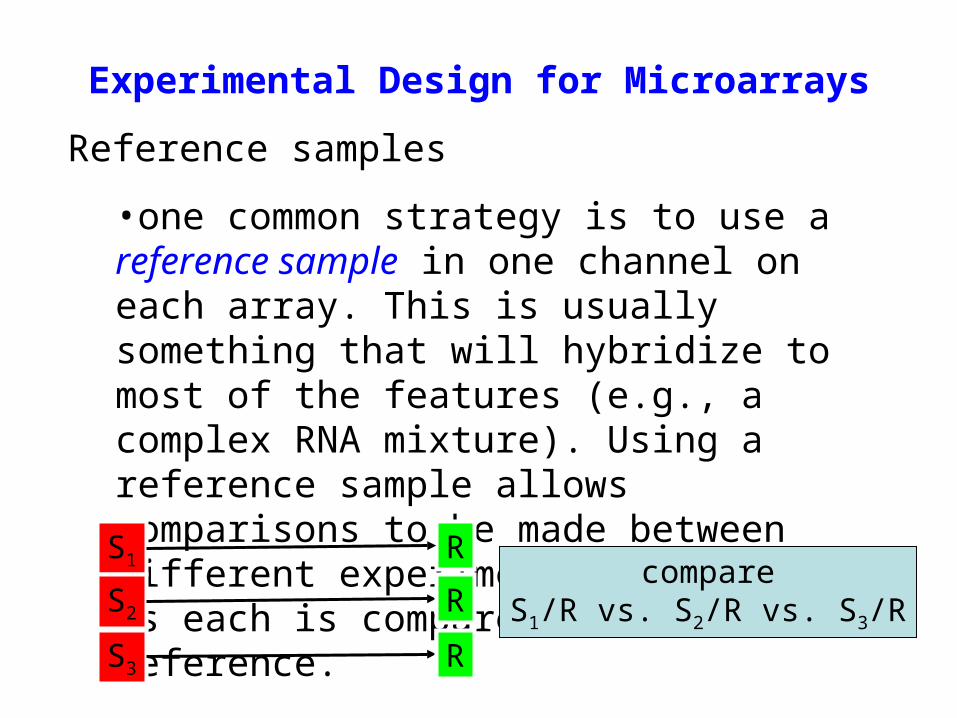
Reference samples
•one common strategy is to use a reference sample in one channel on each array. This is usually something that will hybridize to most of the features (e.g., a complex RNA mixture). Using a reference sample allows comparisons to be made between different experimental conditions, as each is compared to the common reference.
S1
S2
S3
R
R
R
compareS1/R vs. S2/R vs. S3/R
Experimental Design for Microarrays
The bottom line is that you should discuss your experimental design with a statistician before going ahead and beginning your experiments. It’s usually too late and too expensive to change the design once you’ve begun!
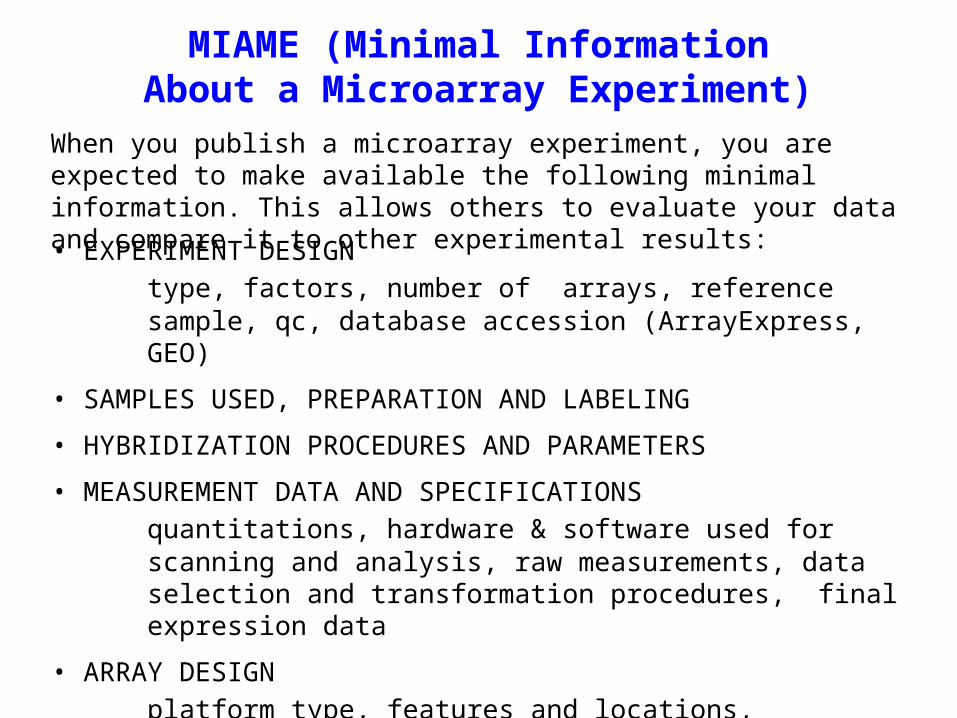
• EXPERIMENT DESIGNtype, factors, number of arrays, reference sample, qc, database accession (ArrayExpress, GEO)
• SAMPLES USED, PREPARATION AND LABELING
• HYBRIDIZATION PROCEDURES AND PARAMETERS
• MEASUREMENT DATA AND SPECIFICATIONSquantitations, hardware & software used for scanning and analysis, raw measurements, data selection and transformation procedures, final expression data
• ARRAY DESIGNplatform type, features and locations, manufacturing protocols or commercial p/n
MIAME (Minimal Information About a Microarray Experiment)
When you publish a microarray experiment, you are expected to make available the following minimal information. This allows others to evaluate your data and compare it to other experimental results:

Microarray Experiments
genes
conditions
condition 1
condition 2
condition 3
statistical processing and analysis
experimental design
Analysis of microarray data
• Microarrays can measure the expression of thousands of genes simultaneously
• Vast amounts of data require computers• Types of analysis
– Gene-by-gene• Method: Statistical techniques
– Categorizing groups of genes• Method: Clustering algorithms
– Deducing patterns of gene regulation• Method: Under development
Benfey and Protopapas, "Genomics" © 2005 Prentice Hall Inc. / A Pearson Education Company / Upper Saddle River, New Jersey 07458
Data Analysis—Don’t try this at home
Microarray analysis is a complex and rapidly evolving field. Issues include normalization within and among arrays, limited replication of experiments, and massive multiple testing (20,000 genes vs 20,000 genes). Each array platform has its own quirks and requirements. Although a lot of software packages will do your analysis for you, working with a true statistician is highly recommended.
But it’s also important to have a grasp of the basics!
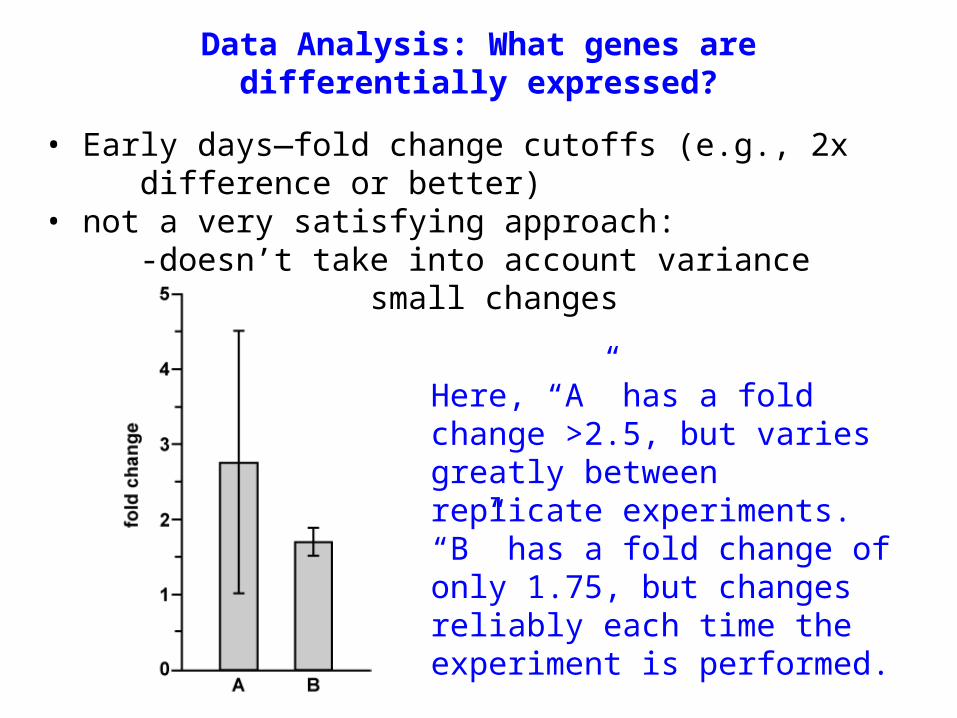
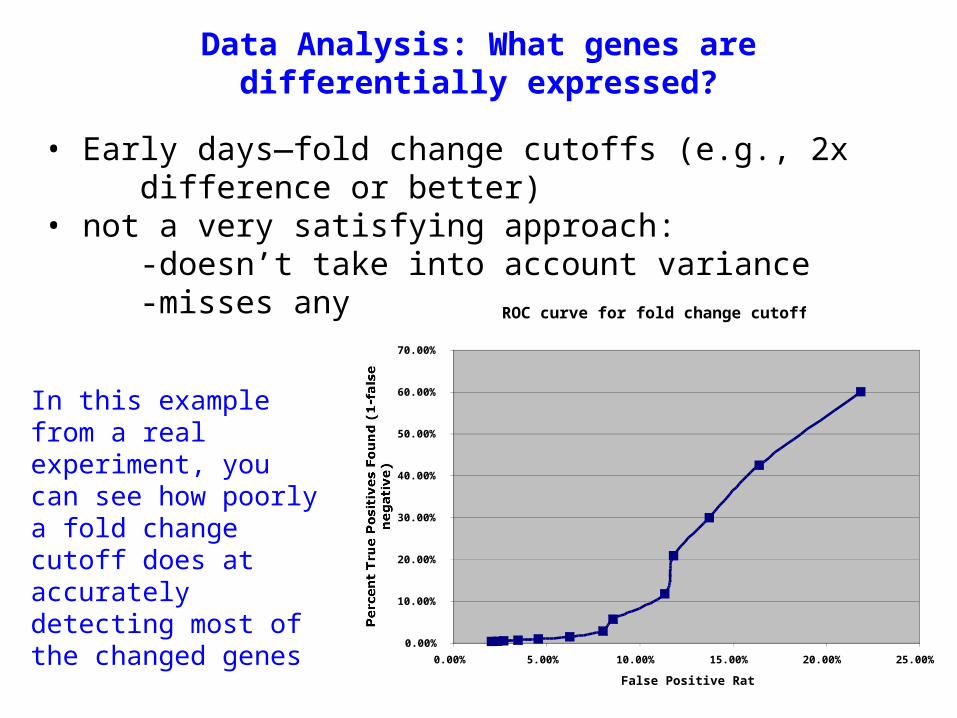
• Early days—fold change cutoffs (e.g., 2x difference or better)
• not a very satisfying approach:-doesn’t take into account variance-misses any small changes
Data Analysis: What genes are differentially expressed?
Here, “A” has a fold change >2.5, but varies greatly between replicate experiments. “B” has a fold change of only 1.75, but changes reliably each time the experiment is performed.
• Early days—fold change cutoffs (e.g., 2x difference or better)
• not a very satisfying approach:-doesn’t take into account variance-misses any small changesROC curve for fold change cutoffs
0.00%
10.00%
20.00%
30.00%
40.00%
50.00%
60.00%
70.00%
0.00% 5.00% 10.00% 15.00% 20.00% 25.00%
False Positive Rate
Percent True Positives Found (1-false
negative)
In this example from a real experiment, you can see how poorly a fold change cutoff does at accurately detecting most of the changed genes
Data Analysis: What genes are differentially expressed?

Data Analysis: Statistical Considerations
Using statistical tests is usually a better way of determining which genes are trully changed in your microarray experiment. The p-value tells you how much confidence to place in your result.
Many different methods and statistical tests for evaluating microarray data have been proposed. Your statistician can help you to determine what will be most effective for you experiments.
In general, you want to maximize the sensitivity of your experiment—how many of the truly changed genes you detect—without sacrificing specificity (i.e., incorrectly thinking that a gene’s expression is altered).
Data Analysis: Statistical Considerations
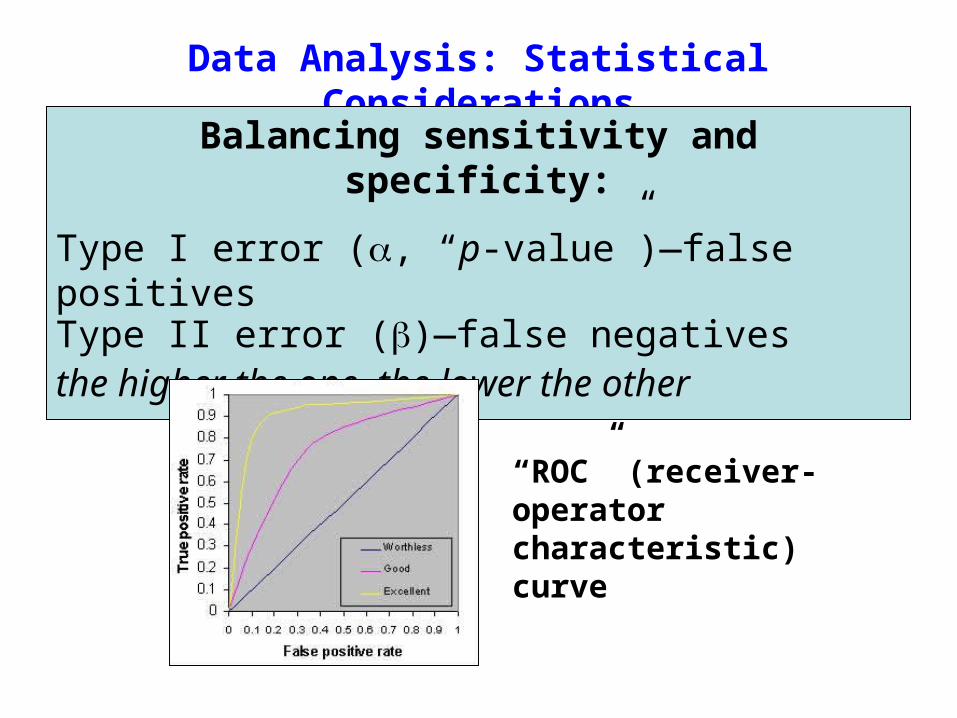
Balancing sensitivity and specificity:
Type I error (, “p-value”)—false positivesType II error ()—false negativesthe higher the one, the lower the other
“ROC” (receiver-operator characteristic) curve
Data Analysis: Statistical Considerations
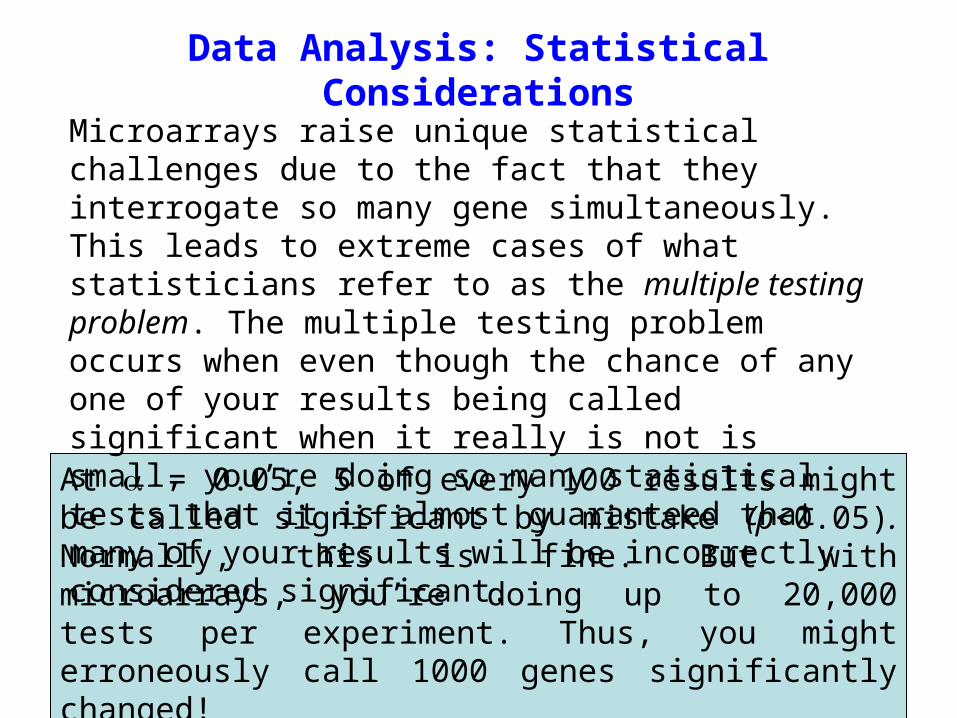
At = 0.05, 5 of every 100 results might be called significant by mistake (p<0.05). Normally, this is fine. But with microarrays, you’re doing up to 20,000 tests per experiment. Thus, you might erroneously call 1000 genes significantly changed!
Microarrays raise unique statistical challenges due to the fact that they interrogate so many gene simultaneously. This leads to extreme cases of what statisticians refer to as the multiple testing problem. The multiple testing problem occurs when even though the chance of any one of your results being called significant when it really is not is small, you’re doing so many statistical tests that it is almost guaranteed that many of your results will be incorrectly considered significant.
Data Analysis: Statistical Considerations
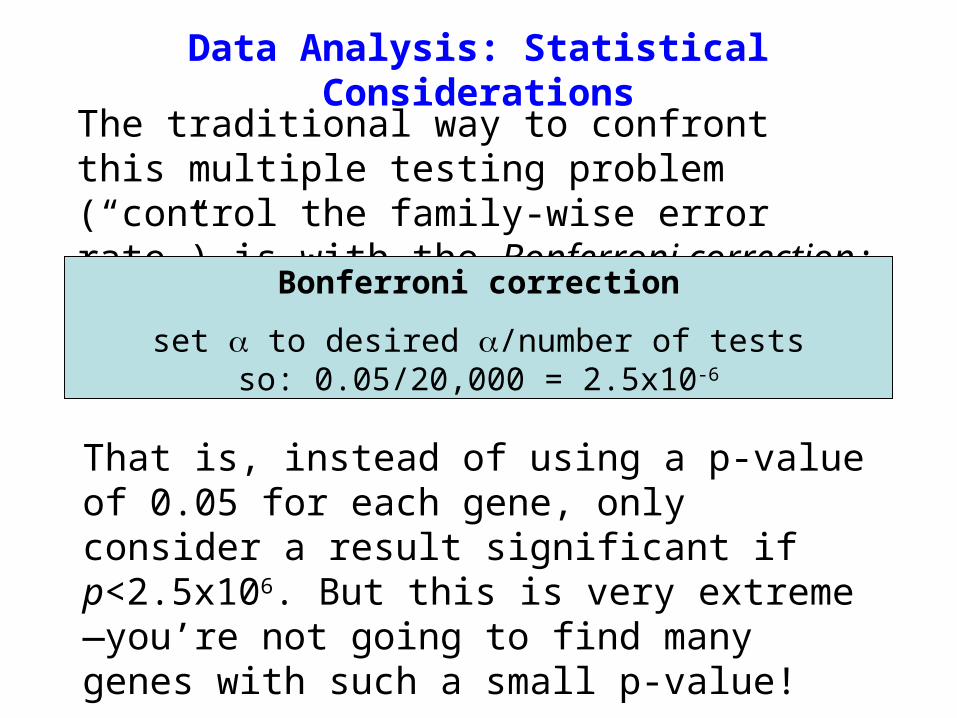
The traditional way to confront this multiple testing problem (“control the family-wise error rate”) is with the Bonferroni correction:
Bonferroni correction
set to desired /number of testsso: 0.05/20,000 = 2.5x10⁻⁶
That is, instead of using a p-value of 0.05 for each gene, only consider a result significant if p<2.5x10⁶. But this is very extreme—you’re not going to find many genes with such a small p-value!
Data Analysis: Statistical Considerations
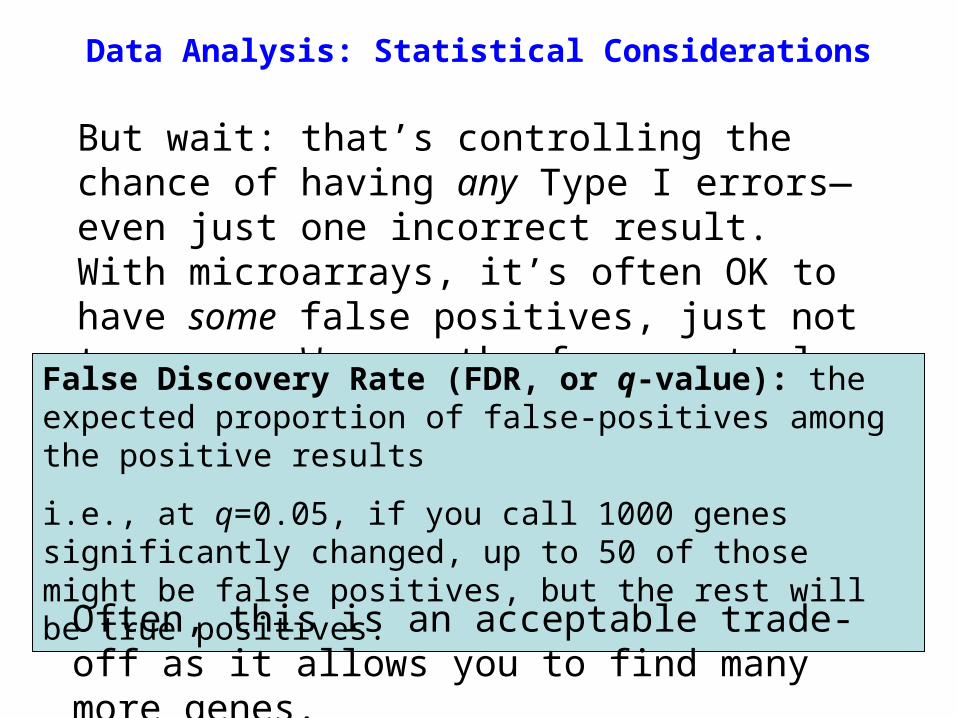
But wait: that’s controlling the chance of having any Type I errors—even just one incorrect result. With microarrays, it’s often OK to have some false positives, just not too many. We can therfore control the False Discovery Rate (FDR).
False Discovery Rate (FDR, or q-value): the expected proportion of false-positives among the positive results
i.e., at q=0.05, if you call 1000 genes significantly changed, up to 50 of those might be false positives, but the rest will be true positives.Often, this is an acceptable trade-off as it allows you to find many more genes.
Data Analysis: Clustering
What do you do once you have a list of significantly differentially expressed genes from your experiment?
Sometimes, it’s useful to look at how various subsets or groups of genes change in different experimental conditions.
We can do this using different types of clustering analysis.
Data Analysis: Clustering
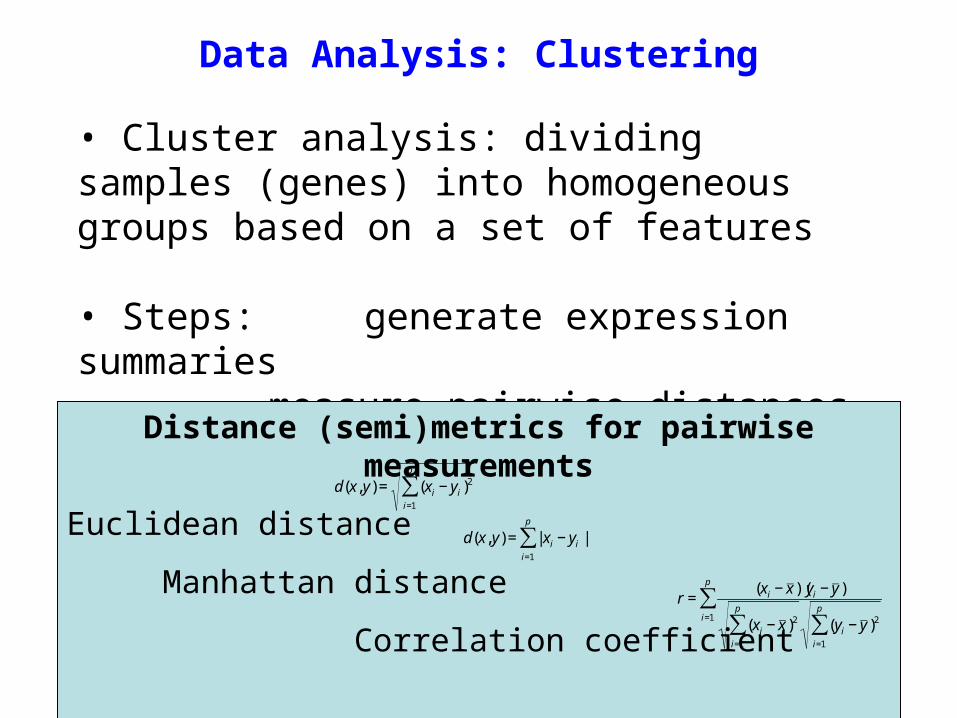
• Cluster analysis: dividing samples (genes) into homogeneous groups based on a set of features
• Steps: generate expression summaries
measure pairwise distancescluster
Distance (semi)metrics for pairwise measurements
Euclidean distance
Manhattan distance
Correlation coefficient
€
d(x, y) = (xi − yi )2
i=1
p
∑
€
d(x, y) = | xi − yi |i=1
p
∑
€
r =(xi − x )(yi − y )
(xi − x )2
i=1
p
∑ (yi − y )2
i=1
p
∑i=1
p
∑
Metrics for gene expression
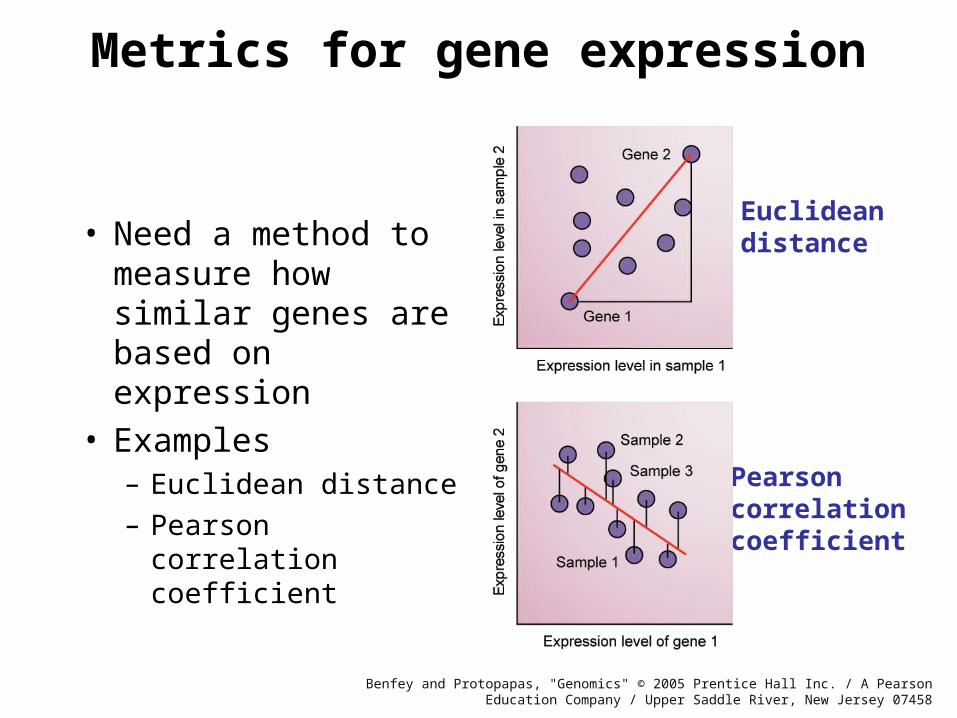
• Need a method to measure how similar genes are based on expression
• Examples– Euclidean distance
– Pearson correlation coefficient
Euclideandistance
Pearsoncorrelationcoefficient
Benfey and Protopapas, "Genomics" © 2005 Prentice Hall Inc. / A Pearson Education Company / Upper Saddle River, New Jersey 07458
Data Analysis: Clustering
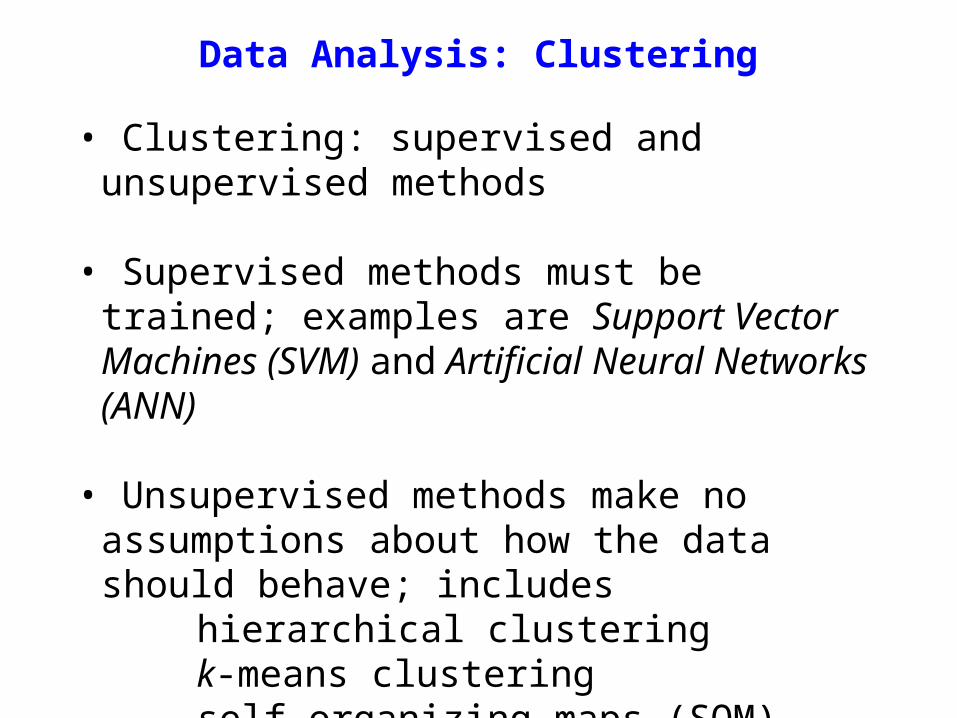
• Clustering: supervised and unsupervised methods
• Supervised methods must be trained; examples are Support Vector Machines (SVM) and Artificial Neural Networks (ANN)
• Unsupervised methods make no assumptions about how the data should behave; includes
hierarchical clusteringk-means clusteringself-organizing maps (SOM)principal component analysis
(PCA)
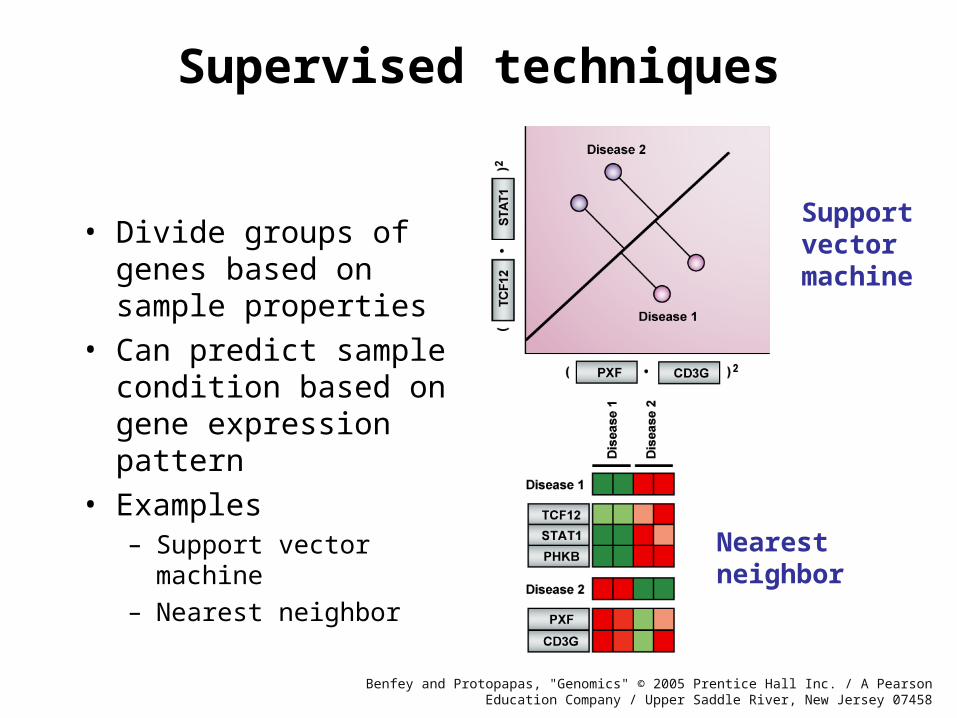
Supervised techniques
• Divide groups of genes based on sample properties
• Can predict sample condition based on gene expression pattern
• Examples– Support vector machine
– Nearest neighbor
Nearestneighbor
Supportvectormachine
Benfey and Protopapas, "Genomics" © 2005 Prentice Hall Inc. / A Pearson Education Company / Upper Saddle River, New Jersey 07458
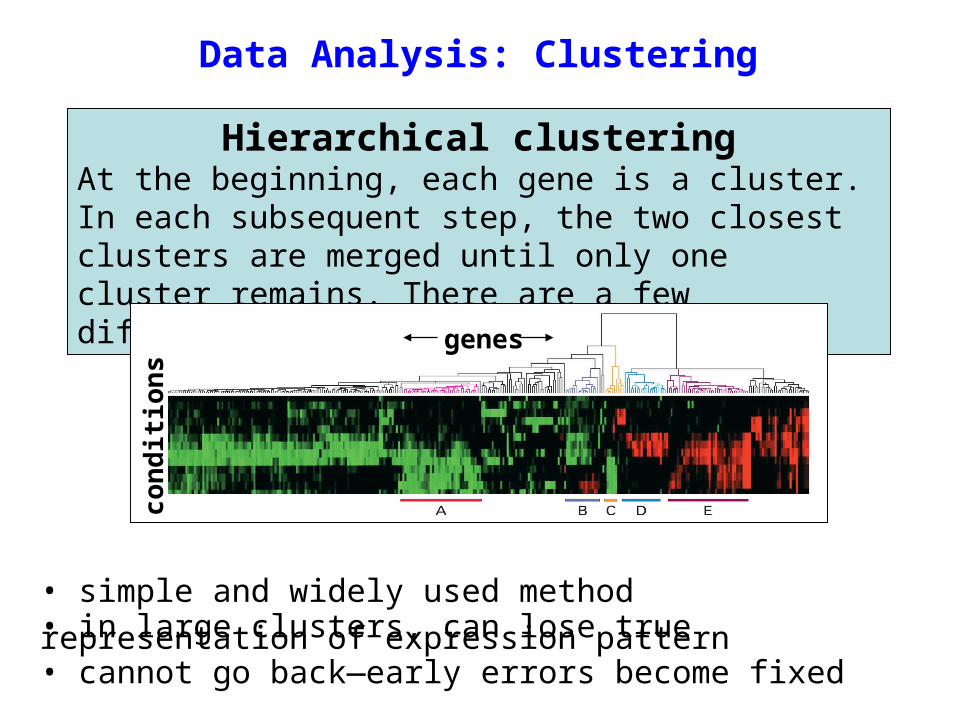
Hierarchical clusteringAt the beginning, each gene is a cluster. In each subsequent step, the two closest clusters are merged until only one cluster remains. There are a few different ways of doing this.genes
conditions
• simple and widely used method• in large clusters, can lose true representation of expression pattern• cannot go back—early errors become fixed
Data Analysis: Clustering
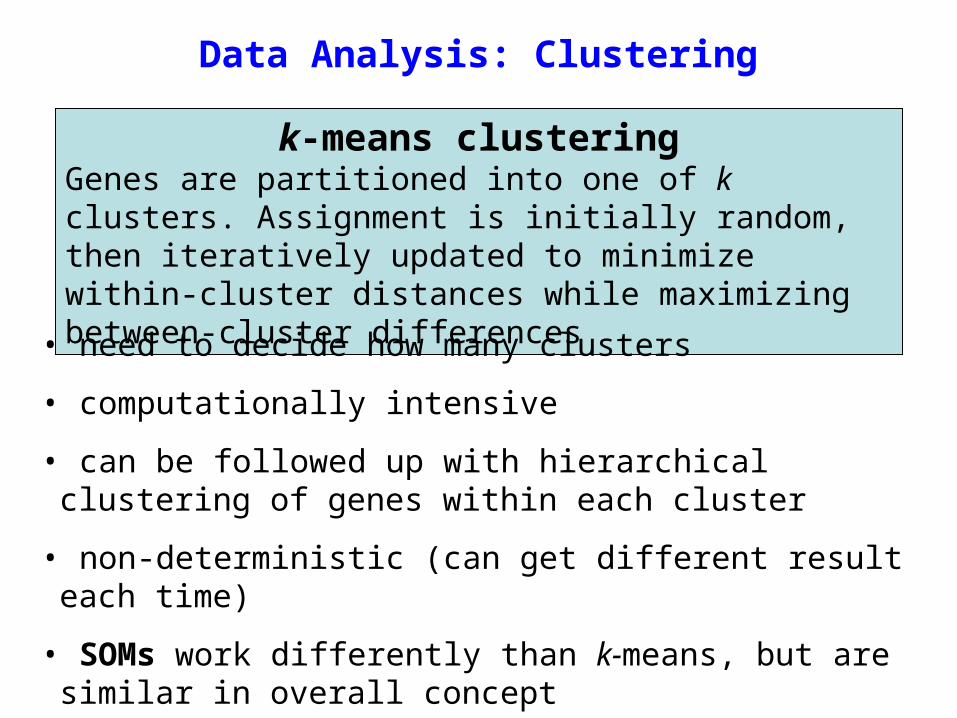
k-means clusteringGenes are partitioned into one of k clusters. Assignment is initially random, then iteratively updated to minimize within-cluster distances while maximizing between-cluster differences• need to decide how many clusters
• computationally intensive
• can be followed up with hierarchical clustering of genes within each cluster
• non-deterministic (can get different result each time)
• SOMs work differently than k-means, but are similar in overall concept
Data Analysis: Clustering
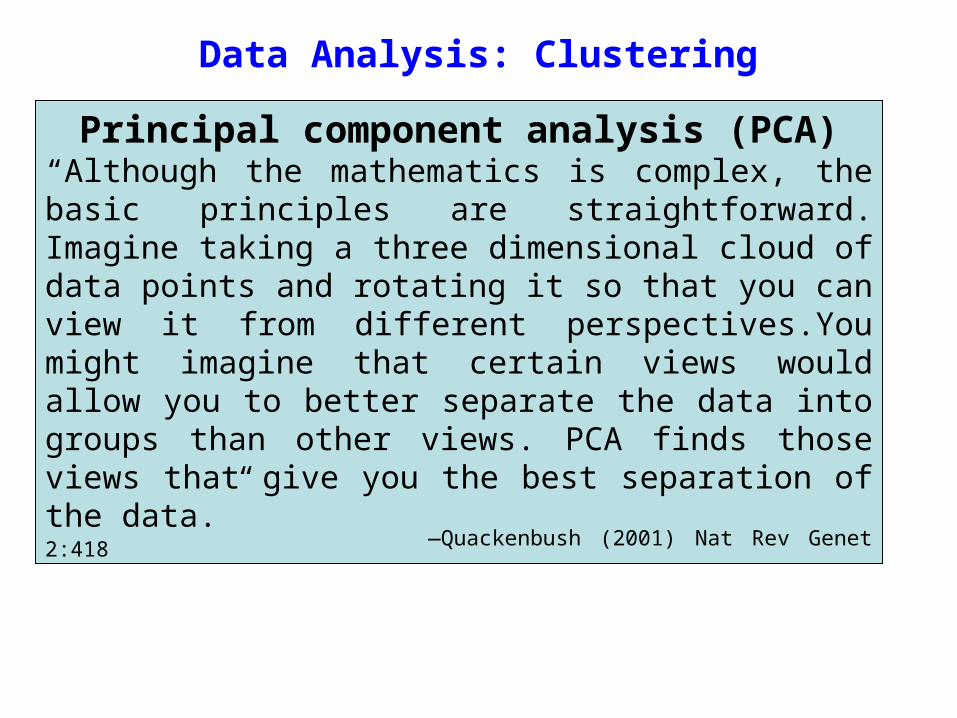
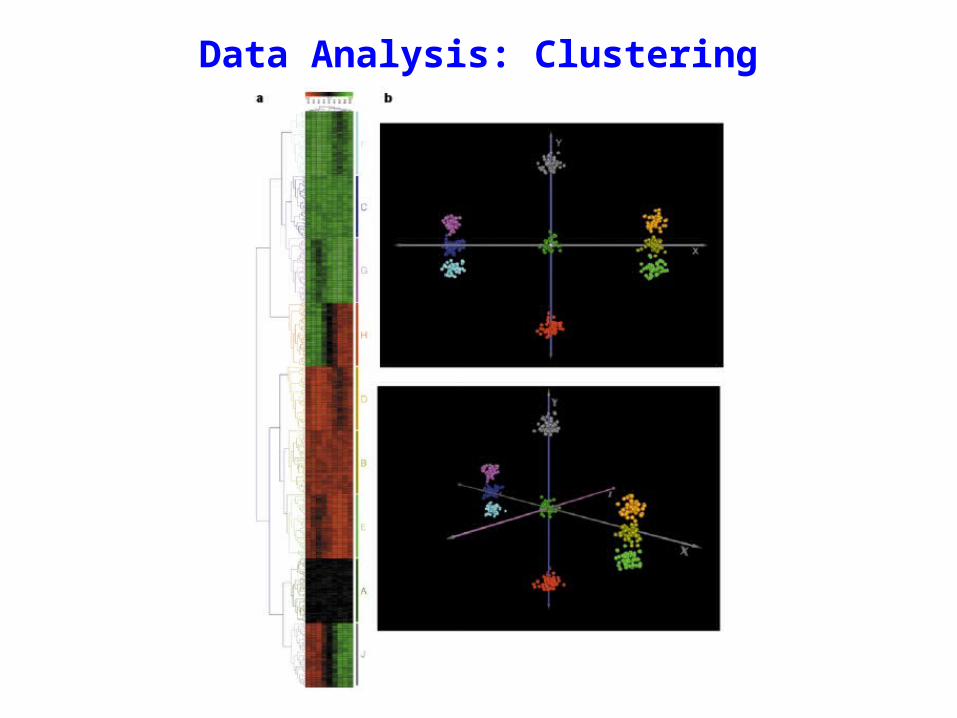
Principal component analysis (PCA)“Although the mathematics is complex, the basic principles are straightforward. Imagine taking a three dimensional cloud of data points and rotating it so that you can view it from different perspectives.You might imagine that certain views would allow you to better separate the data into groups than other views. PCA finds those views that give you the best separation of the data.”
—Quackenbush (2001) Nat Rev Genet 2:418
Data Analysis: Clustering
Data Analysis: Clustering
• Different clustering methods will give you different views of the data
• There is no “correct” clustering method—clustering is just a guide that helps you to see the data in different ways
• On the other hand, there are “incorrect” methods—a certain amount of mathematical validation should be undertaken
• It’s often worth trying a variety of clustering methods to see what is the most useful for your purposes
Data Analysis: Clustering