Embed Size (px)
Citation preview
56
Miscellaneous Methods
UNIT 14 STRUCTURE ELUCIDATION BY
INTEGRATED SPECTROSCOPIC
METHODS
Structure
14.1 Introduction Objectives
14.2 Molecular Formula and Index of Hydrogen Deficiency
14.3 Structural Information Available from Different Types of Spectra Mass Spectrum
UV-VIS Spectrum
IR Spectrum
1H-NMR Spectrum
14.4 Structure Elucidation of Organic Molecules
14.5 Summary
14.6 Terminal Questions
14.7 Answers
14.1 INTRODUCTION
This is the last Unit of this course. You have studied in details about the theoretical
aspects and the applications of different types of atomic and molecular spectroscopic
methods in the earlier Units. You have learnt that the molecular spectra contain
important information about the structure of the molecule. In this Unit you will learn
that how the information available from different types of molecular spectra can be
used for the structure elucidation of the Organic molecules. In this context we will use
the information available from UV-VIS, IR, 1H-NMR and mass spectrometry.
To facilitate this, we would first recapitulate the important structural information
available from different types of spectra and then, with the help of worked examples,
illustrate how to elucidate the structure of a molecule from its given spectral data. This
Unit, thus, aims to integrate the information available from different types of spectral
methods and apply this knowledge to arrive at the structure of a molecule. In other
words, you will be able to correlate the spectral signals of a molecule to different
structural units present in the molecule. Once you understand the correlation between
different spectral features and the structure of the molecule, you can also predict the
important spectral details for a given molecule from its structure.
Objectives
After studying this Unit, you should be able to:
• define and calculate the Index of Hydrogen Deficiency,
• discuss the importance of molecular formula and Index of Hydrogen Deficiency
in the structure elucidation of an organic compound,
• list important structural information available from UV-VIS, IR, 1H-NMR and
mass spectra of a molecule,
• correlate the signals and their intensities in different types of spectra of a
molecule to various structural units present in it,
• integrate the information available from different types of spectra to elucidate the
structure of a molecule, and
57
Structure Elucidation
by Integrated
Spectroscopic Methods
• predict the spectral data for a compound from its structural formula.
14.2 MOLECULAR FORMULA AND INDEX OF
HYDROGEN DEFICIENCY
We have mentioned that in this unit you will learn as to how the information available
from different types of molecular spectra can be used to elucidate the structure of a
molecule. It is interesting to know that in addition to spectra, the molecular formula can
also provide important structural leads. It is, therefore, worthwhile to know about the
kind of information available from the molecular formula.
You know that the molecular formula indicates the elements constituting the molecule
and the number of atoms of each element present in it. This can provide information
about the unsaturation and/or the ring structures in the molecule. The information can
be obtained by computing a parameter called Index of Hydrogen Deficiency (IHD). It
is defined as the number of pairs of hydrogen atoms that must be removed from the
corresponding saturated formula to give the molecular formula under consideration. Let
us learn about it with the help of some simple examples.
In case of ethane (C2H4), there are two i.e., one pair of hydrogen atoms less than that
required for the corresponding saturated compound having molecular formula C2H6.
Hence, its IHD will be 1. Similarly, for ethyne (C2H2), the number of hydrogen atoms
required for the saturated hydrocarbon would be C2H6 ‒ C2H2 = 4. Hence, the number
of pairs of H atoms needed would be 4/2= 2. So, IHD of ethyne is 2.
Let us now take the example of cyclopropane. What is its IHD? If we see the molecular
formula C3H6, we find that the numbers of hydrogen atoms are two less than that for the
corresponding saturated aliphatic hydrocarbon, i.e. propane. Thus, according to our
definition its IHD should be 1. You know, that this compound itself does not contain
any multiple bond or unsaturation per se. Then how do we account for the IHD of 1? In
this case, the IHD is due to the presence of a ring in the molecule. Thus, a ring
contributes to IHD in the same way as a double bond. Similarly, we can consider the
contributions of halogen atoms and nitrogen atoms on IHD. These considerations give
the following formula for the computation of the index of hydrogen deficiency for a
molecule from its molecular formula:
−=
2
atomshydrogen ofNumber atomscarbon ofNumber IHD
12
atomsnitrogen ofNumber
2
atomshalogen ofNumber +
+
−
You may note here that the divalent atoms such as oxygen and sulphur are not taken
into account while calculating the IHD. Thus, for a compound with the molecular
formula as C4H10O, the index of hydrogen deficiency would be zero as shown below:
IHD = 4 − 2
10+ 1 = 5 – 5 = 0
It implies that the molecule of C4H10O does not contain any unsaturation or a ring
structure. Why don’t you try to calculate the IHD for the compounds with molecular
formulas as given in the following SAQ.
SAQ 1
Calculate the IHD for the compounds having the following molecular formulae:
The determination of IHD
alongwith other tests/data
helps us to
choose between alternative
structures proposed for an
unknown compound.
The index of hydrogen
deficiency helps us to know
about the number of
multiple bonds (i.e. double
or triple) or rings present in
a molecule.
58
Miscellaneous Methods
(a) C4H4 (b) C5H10O (c) C6H12O6
…………………………………………………………………………………………..
…………………………………………………………………………………………..
Having understood the importance of molecular formula in structure elucidation and the
method of computing the index of hydrogen deficiency, let us now take up a
comprehensive account of the information about the structural features/units of a
molecule available from the different types of spectra exhibited by it.
14.3 STRUCTURAL INFORMATION AVAILABLE FROM
DIFFERENT TYPES OF SPECTRA
In this section, you will learn about important structured information about a molecule
which can be obtained from its different types of spectra. Let us begin with the
information available from the mass spectrum of a molecule.
14.3.1 Mass Spectrum
i) The m/z value of the molecular ion, +•M gives the molecular mass and can also
be used for generating the molecular formula (subsec. 13.4.1).
ii) The relative intensities of +•+ 1][M and
+•+ 2][M peaks can be related to the
number and nature of hetero atoms present in a molecule. You would recall from
Unit 13 that a typical pattern of M+1 and M+2 peaks is observed if a chlorine or
bromine atom is present in the molecule.
iii) The odd molecular mass is indicative of the presence of a nitrogen atom in the
molecule. However, this has to be further confirmed by other means or by
analysing the fragmentation patterns for the typical nitrogen containing functional
groups.
iv) The characteristic peaks arising from typical fragmentation patterns of various
classes of functional groups such as α ‒ cleavage, loss of small molecules such
as H2O, C2H4, etc. are quite useful.
v) Certain peaks which may be attributed to the rearrangement of the molecular ion
or its fragments ions also give significant structural leads.
You are suggested to have a relook at the subsection 13.4.1 of Unit 13. Table 13.2
containing commonly lost fragments and stable fragment ions observed in the mass
spectrum is being reproduced here so as to facilitate you in the interpretation of the
mass spectra of the examples being taken up in the next section.
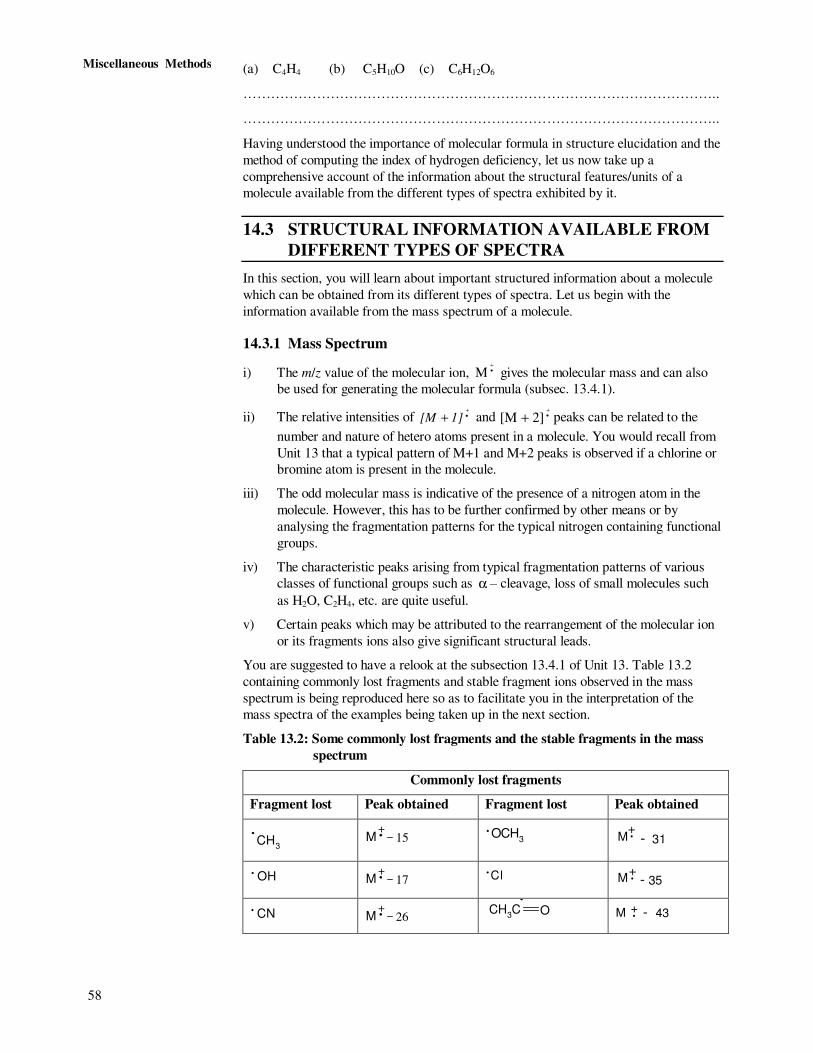
Table 13.2: Some commonly lost fragments and the stable fragments in the mass
spectrum
Commonly lost fragments
Fragment lost Peak obtained Fragment lost Peak obtained
CH3
.
+.M 15
OCH3
.
M - 31+.
OH.
+.M 17
Cl.
M - 35+.
CN.
+.M 26
CH3C O
.
+.M - 43
59
Structure Elucidation
by Integrated
Spectroscopic Methods
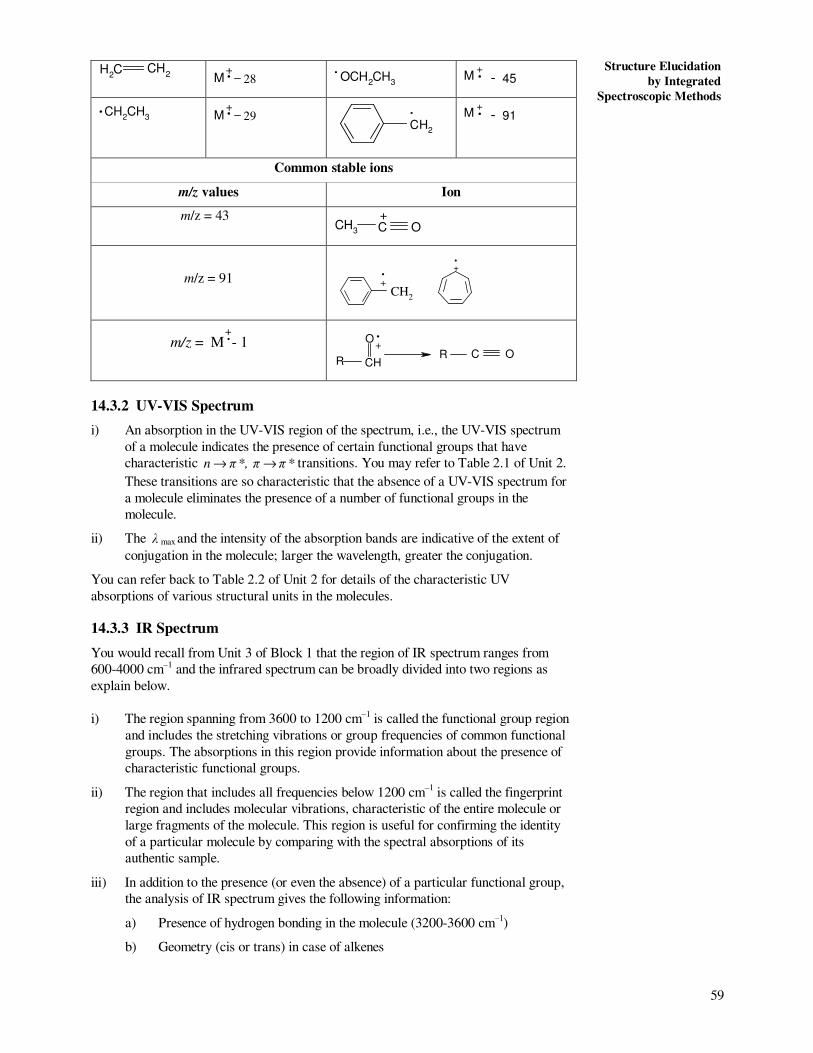
H2C CH
2 +.M 28
OCH2CH
3
.
+.M - 45
CH2CH
3.
+.M 29
CH2
.
+.M - 91
Common stable ions
m/z values Ion
m/z = 43 CH
3 C O+
m/z = 91 CH
2
.+
.+
+.m/z = M - 1
CH
O .+
R C OR
14.3.2 UV-VIS Spectrum
i) An absorption in the UV-VIS region of the spectrum, i.e., the UV-VIS spectrum
of a molecule indicates the presence of certain functional groups that have
characteristic *π π *, π n →→ transitions. You may refer to Table 2.1 of Unit 2.
These transitions are so characteristic that the absence of a UV-VIS spectrum for
a molecule eliminates the presence of a number of functional groups in the
molecule.
ii) The λ max and the intensity of the absorption bands are indicative of the extent of
conjugation in the molecule; larger the wavelength, greater the conjugation.
You can refer back to Table 2.2 of Unit 2 for details of the characteristic UV
absorptions of various structural units in the molecules.
14.3.3 IR Spectrum
You would recall from Unit 3 of Block 1 that the region of IR spectrum ranges from
600-4000 cm‒1 and the infrared spectrum can be broadly divided into two regions as
explain below.
i) The region spanning from 3600 to 1200 cm‒1 is called the functional group region
and includes the stretching vibrations or group frequencies of common functional
groups. The absorptions in this region provide information about the presence of
characteristic functional groups.
ii) The region that includes all frequencies below 1200 cm‒1
is called the fingerprint
region and includes molecular vibrations, characteristic of the entire molecule or
large fragments of the molecule. This region is useful for confirming the identity
of a particular molecule by comparing with the spectral absorptions of its
authentic sample.
iii) In addition to the presence (or even the absence) of a particular functional group,
the analysis of IR spectrum gives the following information:
a) Presence of hydrogen bonding in the molecule (3200-3600 cm‒1
)
b) Geometry (cis or trans) in case of alkenes
60
Miscellaneous Methods
c) Substitution pattern of aromatic compounds (690-850 cm‒1)
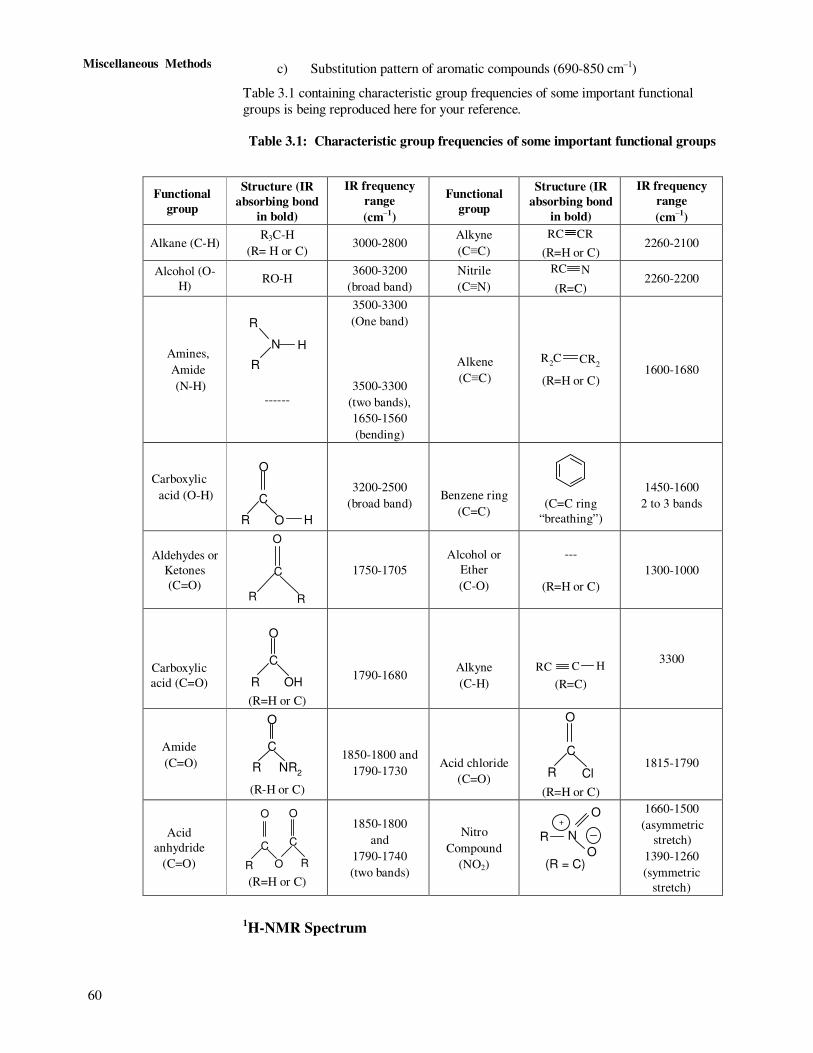
Table 3.1 containing characteristic group frequencies of some important functional
groups is being reproduced here for your reference.
Table 3.1: Characteristic group frequencies of some important functional groups
1H-NMR Spectrum
Functional
group
Structure (IR
absorbing bond
in bold)
IR frequency
range
(cm‒1
)
Functional
group
Structure (IR
absorbing bond
in bold)
IR frequency
range
(cm‒1
)
Alkane (C-H) R3C-H
(R= H or C) 3000-2800
Alkyne
(C≡C)
RC CR (R=H or C)
2260-2100
Alcohol (O-
H) RO-H
3600-3200
(broad band)
Nitrile
(C≡N)
RC N (R=C)
2260-2200
Amines,
Amide
(N-H)
R
N H
R
------
3500-3300
(One band)
3500-3300
(two bands),
1650-1560
(bending)
Alkene
(C≡C)
R2C CR
2 (R=H or C)
1600-1680
Carboxylic
acid (O-H)
C
O
HR O
3200-2500
(broad band)
Benzene ring
(C=C)
(C=C ring
“breathing”)
1450-1600
2 to 3 bands
Aldehydes or
Ketones
(C=O)
O
C
RR
1750-1705
Alcohol or
Ether
(C-O)
---
(R=H or C)
1300-1000
Carboxylic
acid (C=O)
R
O
C
OH (R=H or C)
1790-1680
Alkyne
(C-H)
RC C H
(R=C)
3300
Amide
(C=O) R
C
O
NR2
(R-H or C)
1850-1800 and
1790-1730
Acid chloride
(C=O)
O
C
R Cl (R=H or C)
1815-1790
Acid
anhydride
(C=O)
C
O
O O
C
R R
(R=H or C)
1850-1800
and
1790-1740
(two bands)
Nitro
Compound
(NO2)
R
O
O
N
+
(R = C)
1660-1500
(asymmetric
stretch)
1390-1260
(symmetric
stretch)
61
Structure Elucidation
by Integrated
Spectroscopic Methods
You would recall from Unit 12, the following spectral features of the 1H-NMR and the
structural information available from them. Spectral data tells us about the following
important aspects of a molecule.
i) The number of different signals in the 1H-NMR spectrum indicates about the
different types of protons present in the molecule.
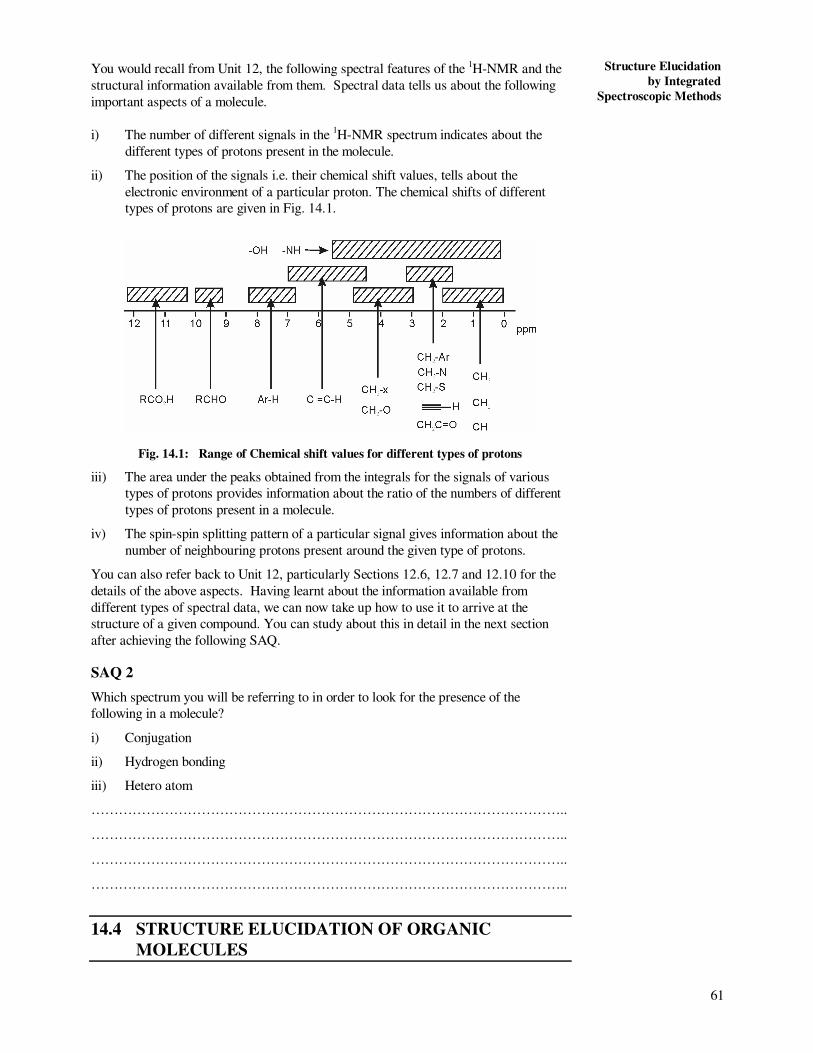
ii) The position of the signals i.e. their chemical shift values, tells about the
electronic environment of a particular proton. The chemical shifts of different
types of protons are given in Fig. 14.1.
Fig. 14.1: Range of Chemical shift values for different types of protons
iii) The area under the peaks obtained from the integrals for the signals of various
types of protons provides information about the ratio of the numbers of different
types of protons present in a molecule.
iv) The spin-spin splitting pattern of a particular signal gives information about the
number of neighbouring protons present around the given type of protons.
You can also refer back to Unit 12, particularly Sections 12.6, 12.7 and 12.10 for the
details of the above aspects. Having learnt about the information available from
different types of spectral data, we can now take up how to use it to arrive at the
structure of a given compound. You can study about this in detail in the next section
after achieving the following SAQ.
SAQ 2
Which spectrum you will be referring to in order to look for the presence of the
following in a molecule?
i) Conjugation
ii) Hydrogen bonding
iii) Hetero atom
…………………………………………………………………………………………..
…………………………………………………………………………………………..
…………………………………………………………………………………………..
…………………………………………………………………………………………..
14.4 STRUCTURE ELUCIDATION OF ORGANIC
MOLECULES
62
Miscellaneous Methods
In this section, we will discuss the structural elucidation by taking some organic
compounds as examples. We will analyse the data available from various types of
spectra for a given compound and integrate the information about various structural
units present in the compound to arrive at its structure.
Example 1
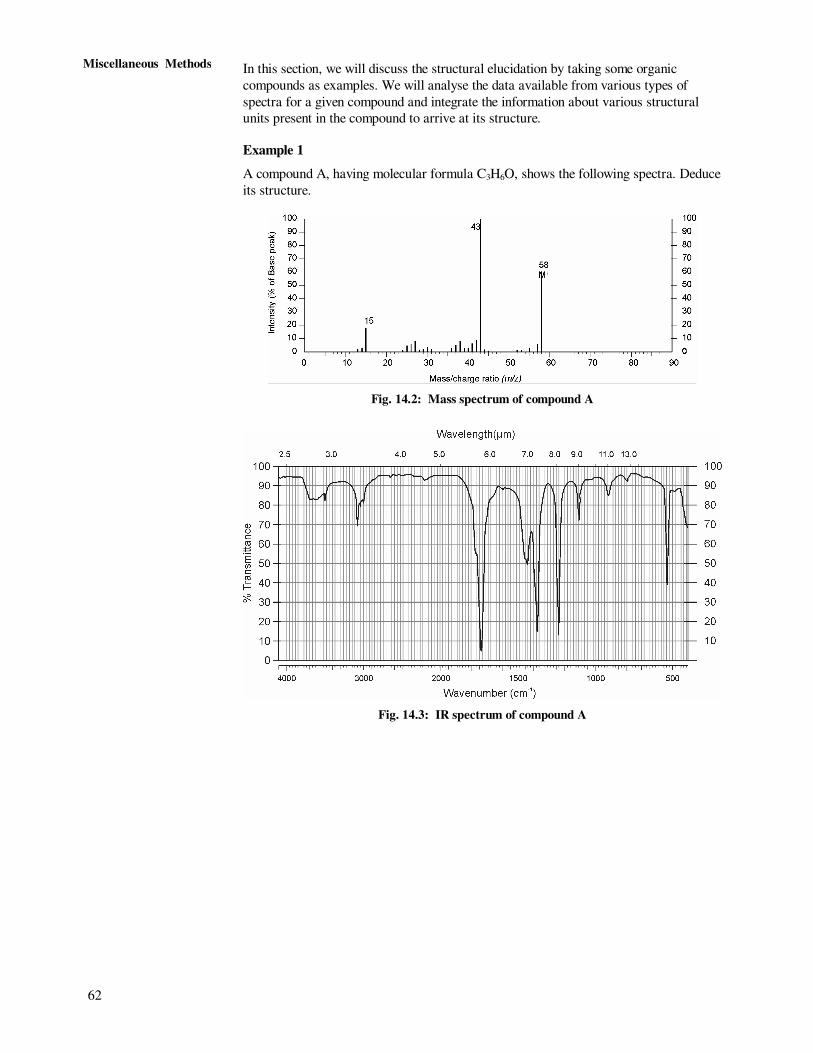
A compound A, having molecular formula C3H6O, shows the following spectra. Deduce
its structure.
Fig. 14.2: Mass spectrum of compound A
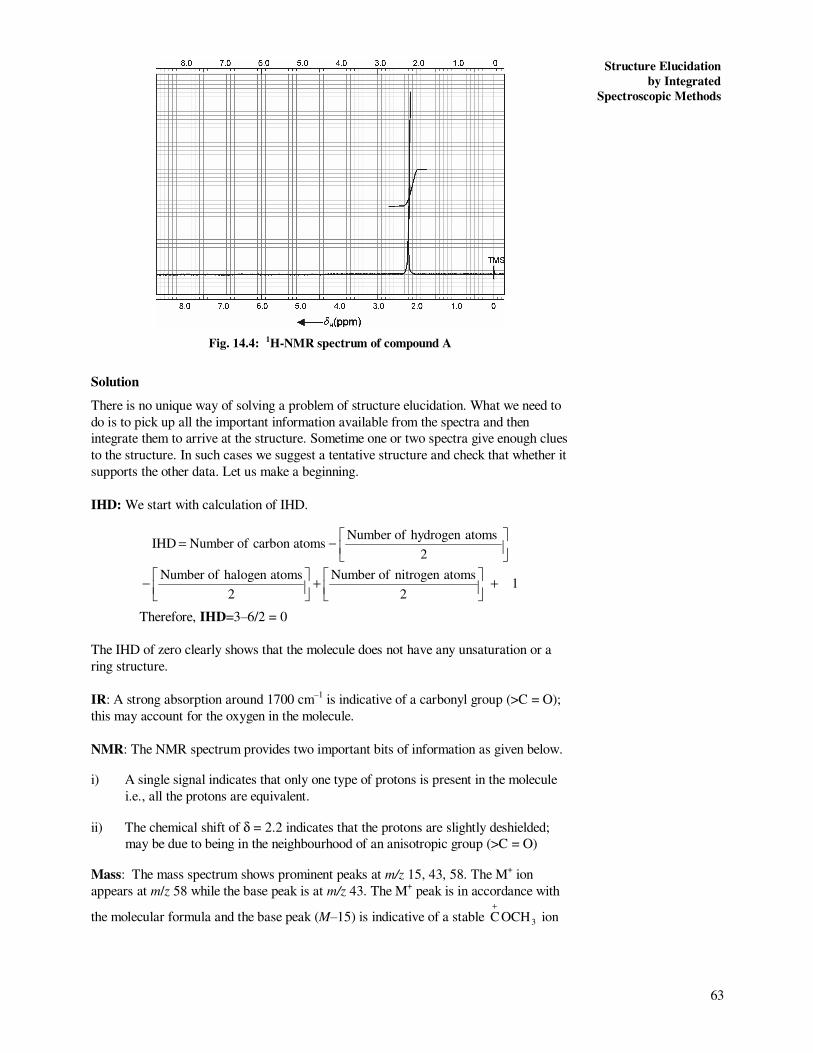
Fig. 14.3: IR spectrum of compound A
63
Structure Elucidation
by Integrated
Spectroscopic Methods
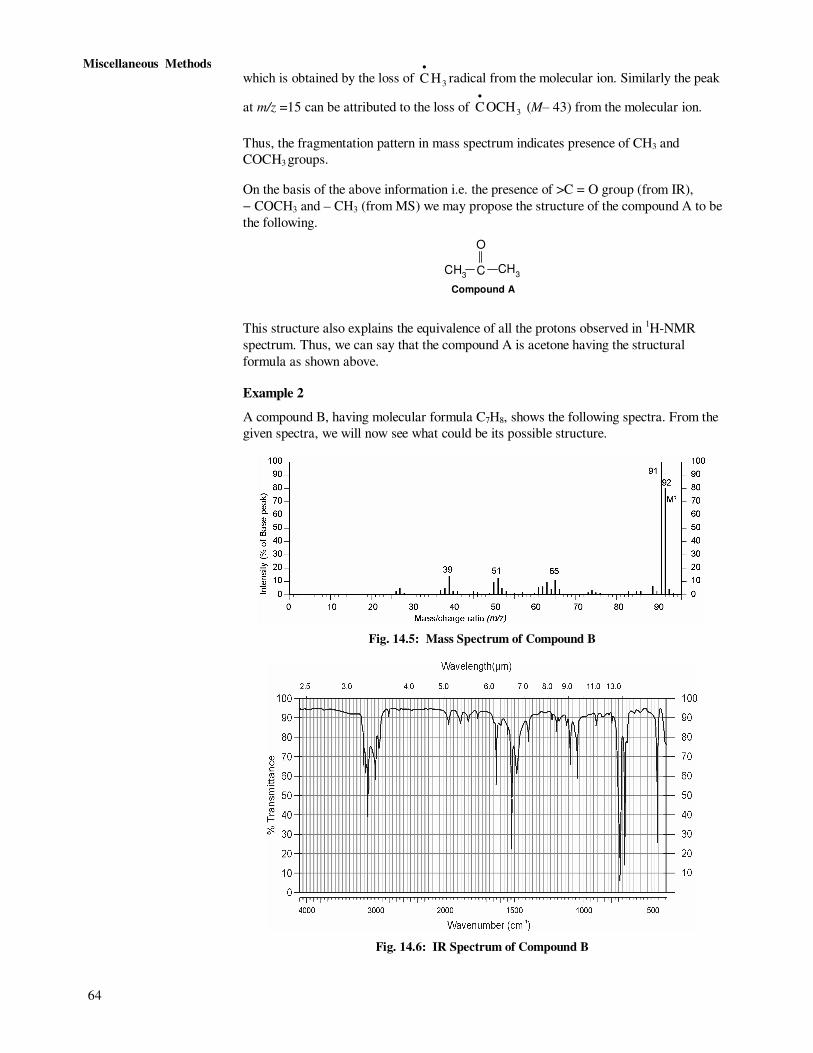
Fig. 14.4: 1H-NMR spectrum of compound A
Solution
There is no unique way of solving a problem of structure elucidation. What we need to
do is to pick up all the important information available from the spectra and then
integrate them to arrive at the structure. Sometime one or two spectra give enough clues
to the structure. In such cases we suggest a tentative structure and check that whether it
supports the other data. Let us make a beginning.
IHD: We start with calculation of IHD.
−=
2
atomshydrogen ofNumber atomscarbon ofNumber IHD
12
atomsnitrogen ofNumber
2
atomshalogen ofNumber +
+
−
Therefore, IHD=3‒6/2 = 0
The IHD of zero clearly shows that the molecule does not have any unsaturation or a
ring structure.
IR: A strong absorption around 1700 cm‒1
is indicative of a carbonyl group (>C = O);
this may account for the oxygen in the molecule.
NMR: The NMR spectrum provides two important bits of information as given below.
i) A single signal indicates that only one type of protons is present in the molecule
i.e., all the protons are equivalent.
ii) The chemical shift of δ = 2.2 indicates that the protons are slightly deshielded;
may be due to being in the neighbourhood of an anisotropic group (>C = O)
Mass: The mass spectrum shows prominent peaks at m/z 15, 43, 58. The M+ ion
appears at m/z 58 while the base peak is at m/z 43. The M+ peak is in accordance with
the molecular formula and the base peak (M‒15) is indicative of a stable 3OCHC+
ion
64
Miscellaneous Methods
which is obtained by the loss of 3HC•
radical from the molecular ion. Similarly the peak
at m/z =15 can be attributed to the loss of 3OCHC•
(M‒ 43) from the molecular ion.
Thus, the fragmentation pattern in mass spectrum indicates presence of CH3 and
COCH3 groups.
On the basis of the above information i.e. the presence of >C = O group (from IR),
− COCH3 and – CH3 (from MS) we may propose the structure of the compound A to be
the following.
CH3CH
3C
O
Compound A
This structure also explains the equivalence of all the protons observed in 1H-NMR
spectrum. Thus, we can say that the compound A is acetone having the structural
formula as shown above.
Example 2
A compound B, having molecular formula C7H8, shows the following spectra. From the
given spectra, we will now see what could be its possible structure.
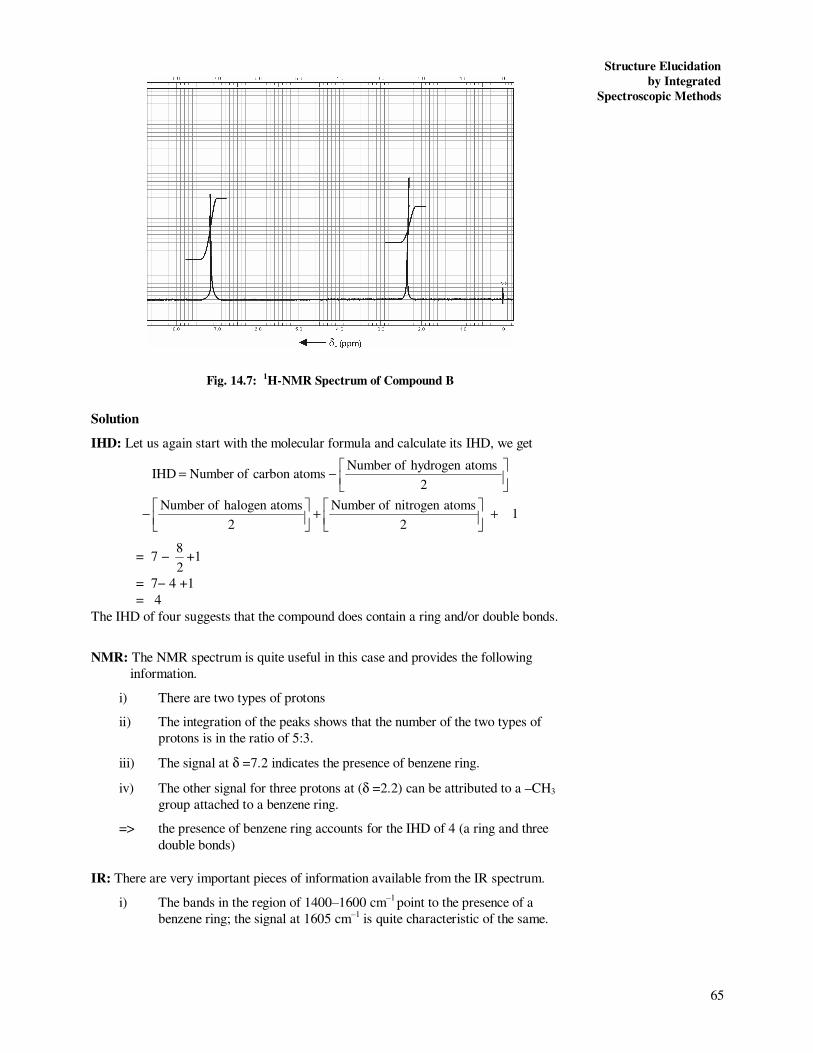
Fig. 14.5: Mass Spectrum of Compound B
Fig. 14.6: IR Spectrum of Compound B
65
Structure Elucidation
by Integrated
Spectroscopic Methods
Fig. 14.7: 1H-NMR Spectrum of Compound B
Solution
IHD: Let us again start with the molecular formula and calculate its IHD, we get
−=
2
atomshydrogen ofNumber atomscarbon ofNumber IHD
12
atomsnitrogen ofNumber
2
atomshalogen ofNumber +
+
−
= 7 − 2
8+1
= 7− 4 +1
= 4
The IHD of four suggests that the compound does contain a ring and/or double bonds.
NMR: The NMR spectrum is quite useful in this case and provides the following
information.
i) There are two types of protons
ii) The integration of the peaks shows that the number of the two types of
protons is in the ratio of 5:3.
iii) The signal at δ =7.2 indicates the presence of benzene ring.
iv) The other signal for three protons at (δ =2.2) can be attributed to a –CH3
group attached to a benzene ring.
=> the presence of benzene ring accounts for the IHD of 4 (a ring and three
double bonds)
IR: There are very important pieces of information available from the IR spectrum.
i) The bands in the region of 1400‒1600 cm‒1
point to the presence of a
benzene ring; the signal at 1605 cm‒1 is quite characteristic of the same.
66
Miscellaneous Methods
ii) Two strong peaks near 690 cm‒1 and 750 cm‒1 indicate monosubstituted
benzene ring. These are due to out of plane bending of aromatic = C − H.
The overtones of bands are observed between 2000 ‒1667 cm‒1
.
iii) The signal at about 3050 cm‒1
can be ascribed to sp2 C − H stretching,
while at about 2900 cm‒1
is due to sp3 C − H stretching.
Thus, the IR spectrum clearly points to a monosubstituted benzene.
Mass: The mass spectrum given in Fig. 14.5 shows the M+ peak at m/z 92 and the base
peak at m/z 91. Looking at the table we can say that this peak could be due to benzyl
carbocation, as shown in the following structure.
CH2
+
Benzyl carbocation
The spectral data evidences indicate that compound B to have the following structure
CH3
Toluene
And, hence the compound B is toluene.
Example 3
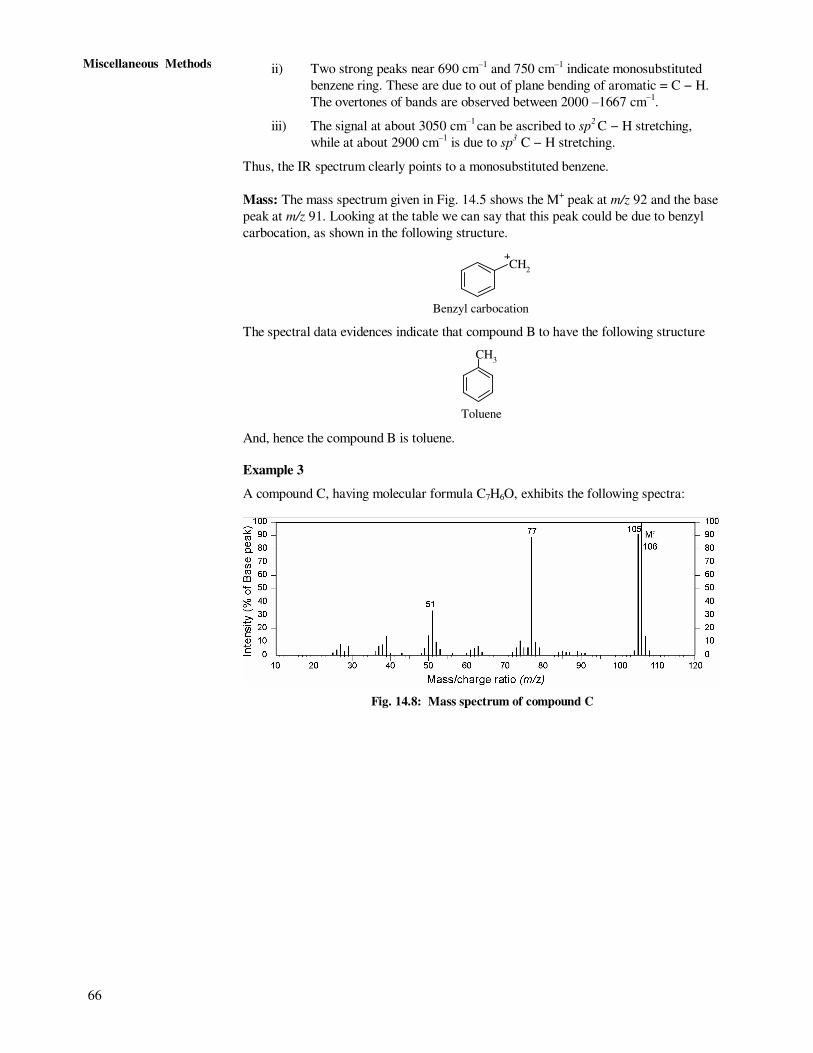
A compound C, having molecular formula C7H6O, exhibits the following spectra:
Fig. 14.8: Mass spectrum of compound C
67
Structure Elucidation
by Integrated
Spectroscopic Methods
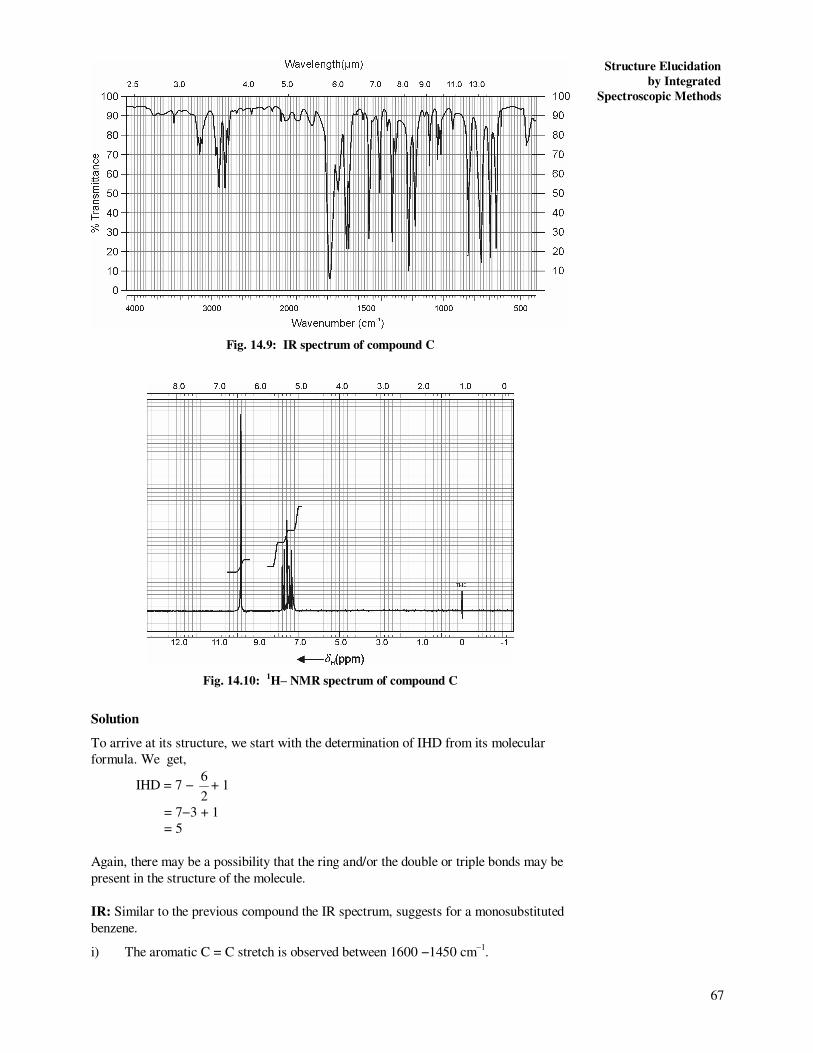
Fig. 14.9: IR spectrum of compound C
Fig. 14.10: 1H‒ NMR spectrum of compound C
Solution
To arrive at its structure, we start with the determination of IHD from its molecular
formula. We get,
IHD = 7 − 2
6+ 1
= 7−3 + 1
= 5
Again, there may be a possibility that the ring and/or the double or triple bonds may be
present in the structure of the molecule.
IR: Similar to the previous compound the IR spectrum, suggests for a monosubstituted
benzene.
i) The aromatic C = C stretch is observed between 1600 −1450 cm‒1
.
68
Miscellaneous Methods
ii) Two strong peaks near 690 cm‒1 and 750 cm‒1 are indicative of out of plane
= C − H bending for monosubstituted benzene.
iii) In addition, the strong signal at 1700 cm‒1
suggests for the carbonyl group.
iv) The doublet, between 2850 cm‒1
and 2750 cm‒1
is characteristic of C− H stretch
of aldehydes. This further qualifies the nature of carbonyl group.
Thus, an IHD of 4 out of 5 is accounted for by the presence of benzene unit (which
contains one ring and three double bonds) and the fifth by the carbonyl group.
Thus, you may see here that the IR spectrum has provided enough leads to suggest a
plausible structure. In the molecule, an aldehyde (−CHO) group is linked to the
monosubstituted benzene ring. Hence, the compound has the structure C6H5CHO. Let
us look into other spectra and see do they support the assignment.
NMR: The NMR spectrum also supports the proposed structure. Let us see the
available information.
i) The multiplet between δ 7.4 – 7.9 is suggestive of aromatic protons.
ii) The one proton signal at δ 9.8 is quite useful as it is suggestive of an aldehydic
proton.
The complex multiplet between δ 7.4 – 7.9 when resolved under high resolution shows
that there are three different types of aromatic protons and these are in the ratio of
2:1:2. The multiplet when observed at higher resolution (at 300 MHz) shows a doublet
(2H) and two triplets. The doublet at δ =7.5 is due to two ortho protons. The triplet due
to (1H) at ∼ δ 7.6 is due to para proton and the other triplet is due to 2 meta protons
appears at about δ 7.9. Thus, the 1H-NMR spectral data also supports that the
compound is benzaldehyde. Let us see what does the mass spectrum say.
Mass: The mass spectrum also supports the suggested structure. Let us analyse the
evidence.
i) The molecular ion gives an intense M+ peak at m/z = 106.
ii) An equally intense M – 1 peak at m/z 105 is suggestive of the loss of one
hydrogen via the α -cleavage process – a very favourable fragmentation
mechanism.
iii) The characteristic peak at m/z 77 can be due to the loss of – CHO to
give +56HC ion.
iv) A further loss of HC = CH from +56HC ion yields +
34HC ion; the peak for which
is observed at m/z 51 in the mass spectrum.
Thus, all the above spectral data confirm that the compound C is benzaldehyde and it
has the following structure. CHO
Benzaldehyde
Example 4
A compound D having molecular formula C3H6O2 shows the following spectral data.
Find out the structure.
69
Structure Elucidation
by Integrated
Spectroscopic Methods
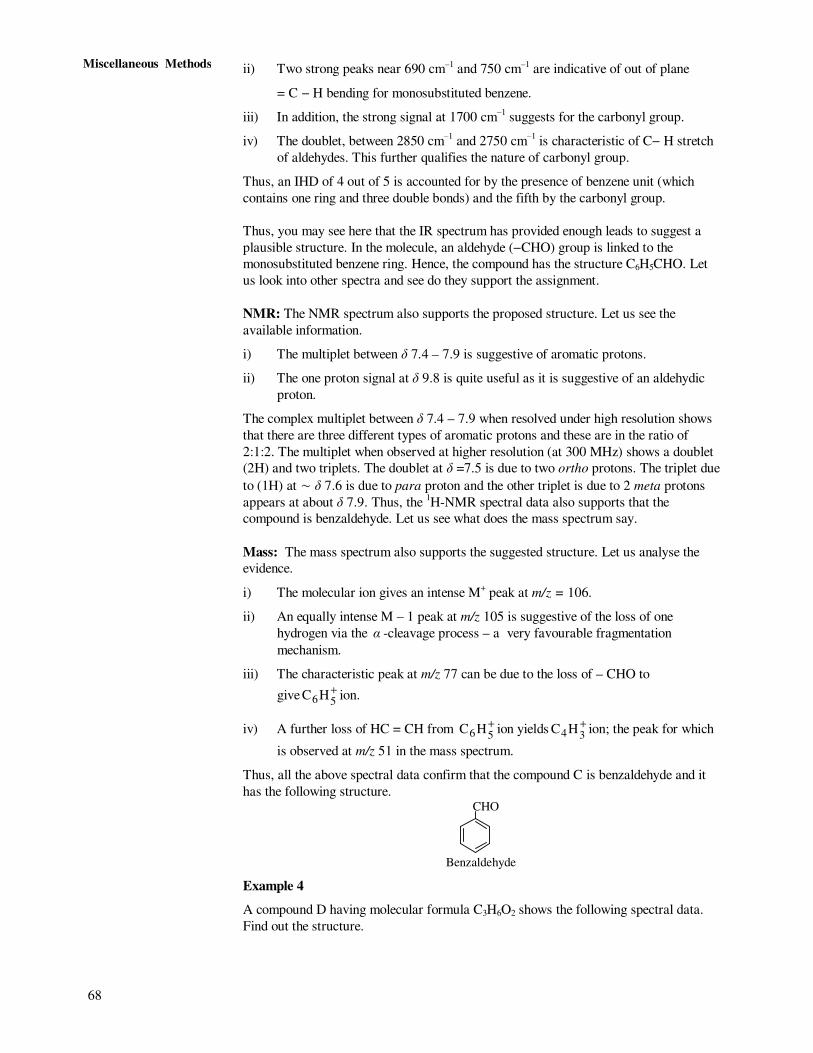
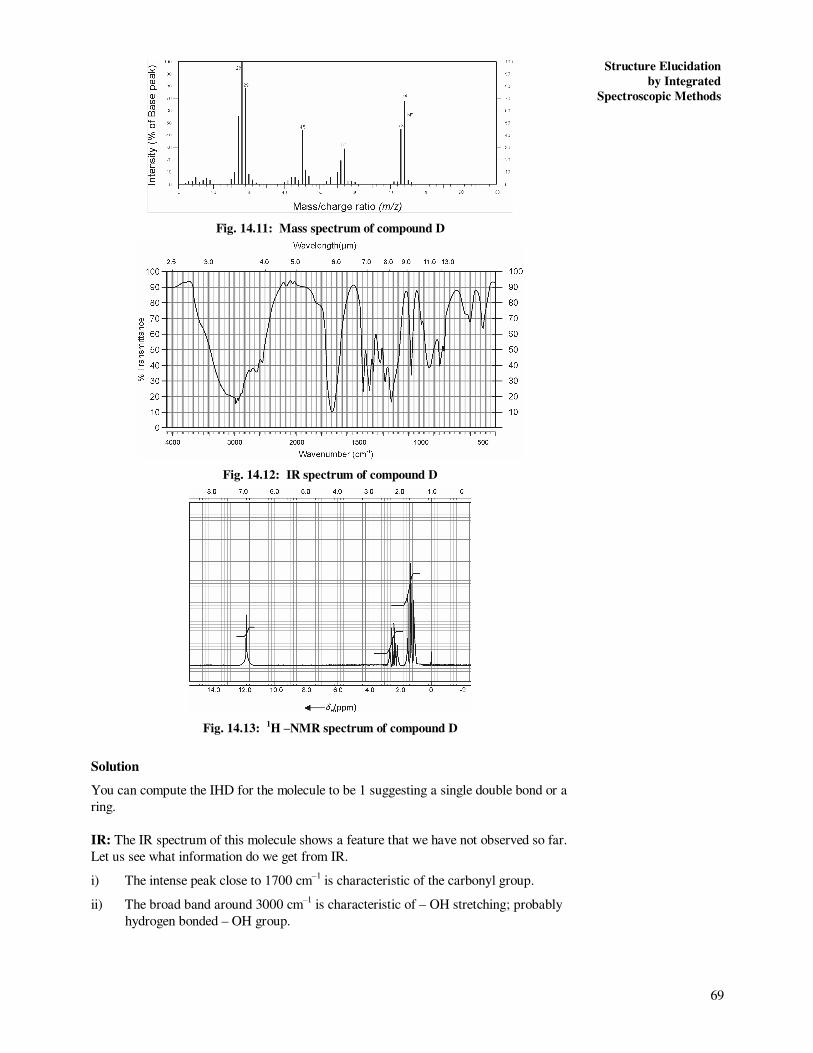
Fig. 14.11: Mass spectrum of compound D
Fig. 14.12: IR spectrum of compound D
Fig. 14.13: 1H ‒NMR spectrum of compound D
Solution
You can compute the IHD for the molecule to be 1 suggesting a single double bond or a
ring.
IR: The IR spectrum of this molecule shows a feature that we have not observed so far.
Let us see what information do we get from IR.
i) The intense peak close to 1700 cm‒1
is characteristic of the carbonyl group.
ii) The broad band around 3000 cm‒1
is characteristic of – OH stretching; probably
hydrogen bonded – OH group.
70
Miscellaneous Methods
These two pieces of information indicate towards the presence of a – COOH functional
group. Let us see other spectra for more information.
NMR: We can arrive at the following observations from its NMR spectrum.
i) The NMR spectrum gives three signals indicative of three different types of
protons.
ii) The small peak at a highly downfield δ = 10.5 which is likely to be due to the
acidic proton of the − COOH.
iii) The typical pattern of a two proton quartet and three proton triplet at about δ 1.2
and δ 2.3 respectively are suggestive of – CH2CH3 group.
On the basis of the two spectra, the tentative structure of the molecule can be proposed
to be CH3CH2COOH. Let us check whether the mass spectrum supports it or not.
Mass: The mass spectrum contains the following information.
i) The molecular ion peak M+ is at m/z 74.
ii) A M −17 peak at m/z 57 is indicating the loss of – OH.
iii) The intense peak at m/z 29 could be due to the loss of COOH.
iv) The peak at m/z 45 probably arises because of COOH+ ion.
As the mass spectrum clearly accounts for the –COOH group we can say that the
proposed structure is correct. The given compound D is propanoic acid with the
following structure.
CH3CH2COOH (Propanoic acid)
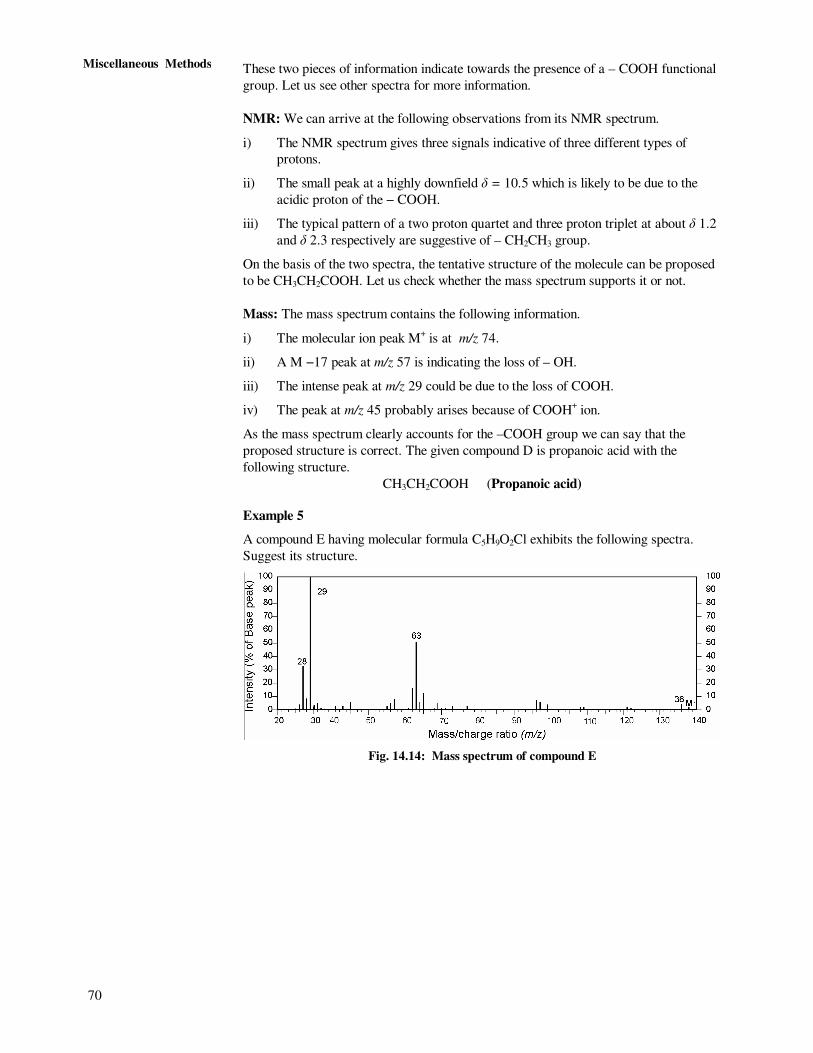
Example 5
A compound E having molecular formula C5H9O2Cl exhibits the following spectra.
Suggest its structure.
Fig. 14.14: Mass spectrum of compound E
71
Structure Elucidation
by Integrated
Spectroscopic Methods
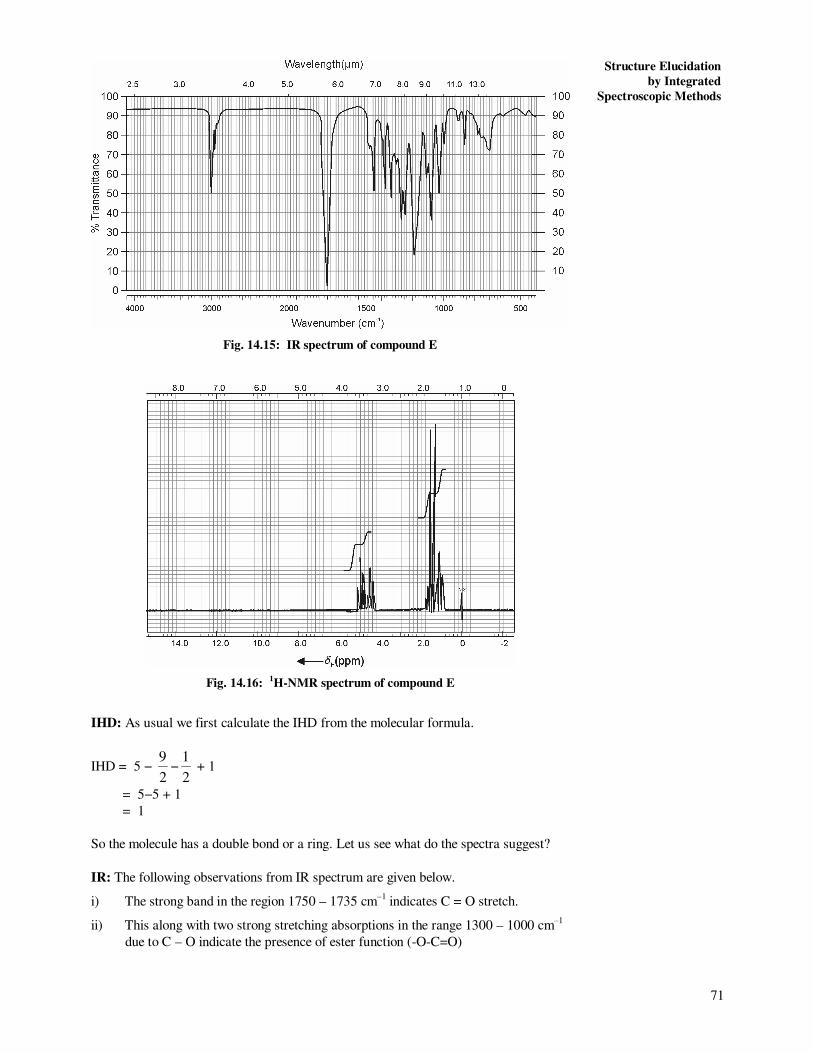
Fig. 14.15: IR spectrum of compound E
Fig. 14.16: 1H-NMR spectrum of compound E
IHD: As usual we first calculate the IHD from the molecular formula.
IHD = 5 − 2
9−
2
1 + 1
= 5−5 + 1
= 1
So the molecule has a double bond or a ring. Let us see what do the spectra suggest?
IR: The following observations from IR spectrum are given below.
i) The strong band in the region 1750 – 1735 cm‒1
indicates C = O stretch.
ii) This along with two strong stretching absorptions in the range 1300 – 1000 cm‒1
due to C – O indicate the presence of ester function (-O-C=O)
72
Miscellaneous Methods
Let us look into other spectra to identify the groups attached to the ester function.
NMR
i) The 1H-NMR spectrum shows the presence of four different types of protons.
ii) The two quartets at δ = 4.23 and at δ = 4.39 are for one proton and two protons
respectively.
iii) The other two signals, a doublet at δ = 1.68 and a triplet at δ = 1.31 are for two
protons each.
iv) One triplet and one quartet could be attributed to ethyl group (−CH2CH3).
v) The other quartet and a doublet may be due to CH3CH(Cl)‒ unit.
We are still not very sure but the tentative structure at this stage is given below.
CH3 CH C O CH
2CH
3
Cl O
let us see how does the mass spectrum help us.
Mass: The interpretation of the mass spectra is given below.
i) The M+ peak at m/z 136 is very-very small.
ii) The base peak at m/z = 29 suggests for the presence of – CH2CH3.
iii) The peak at m/z = 91 (M ‒ 45) is suggestive of the loss of – OCH2CH3 fragment;
the peak at m/z =45 corroborates this.
iv) The reasonably intense peak at m/z = 63 does go into support the proposed
structure as this may correspond to CH3CH(Cl)+ moiety which may be obtained
from the loss of CO from the m/z = 91 peak of CH3CH(Cl)CO+
v) The peak at m/z = 26 supports this.
Thus, we can say that the structure proposed above is correct and the given compound
has the following structure
CH3 CH C O CH
2CH
3
Cl O
Ethylchloropropionate
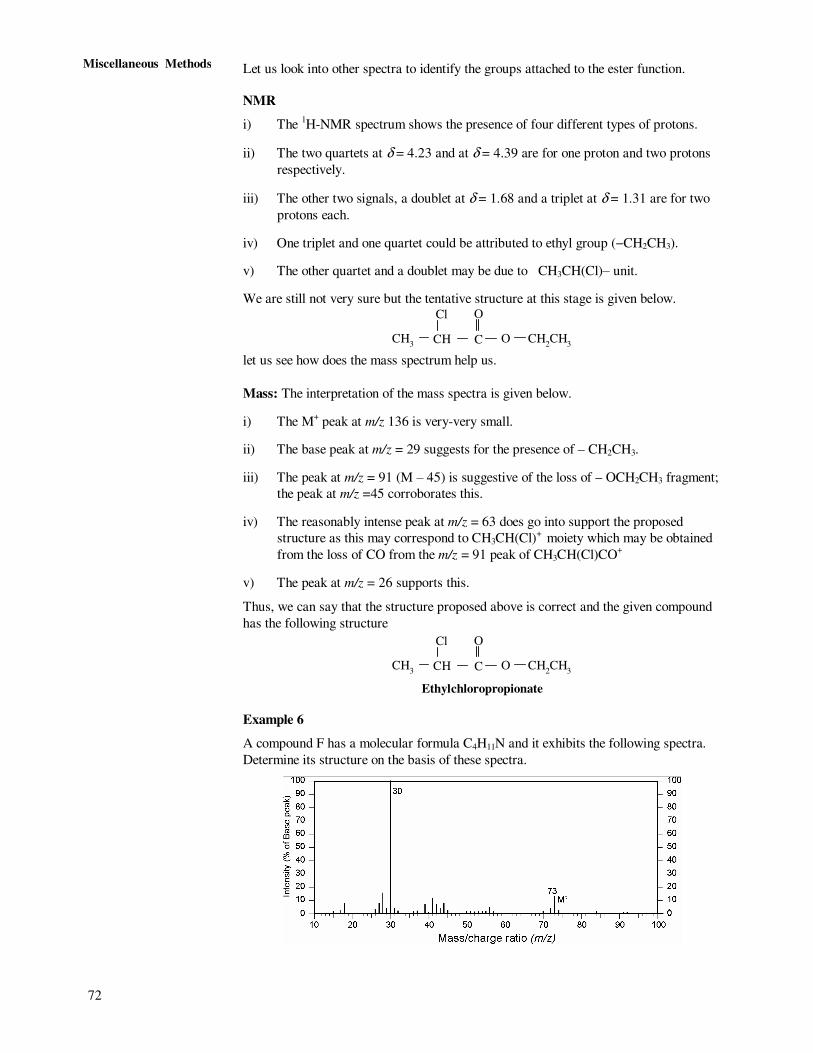
Example 6
A compound F has a molecular formula C4H11N and it exhibits the following spectra.
Determine its structure on the basis of these spectra.
73
Structure Elucidation
by Integrated
Spectroscopic Methods
Fig. 14.17: Mass spectrum of compound F
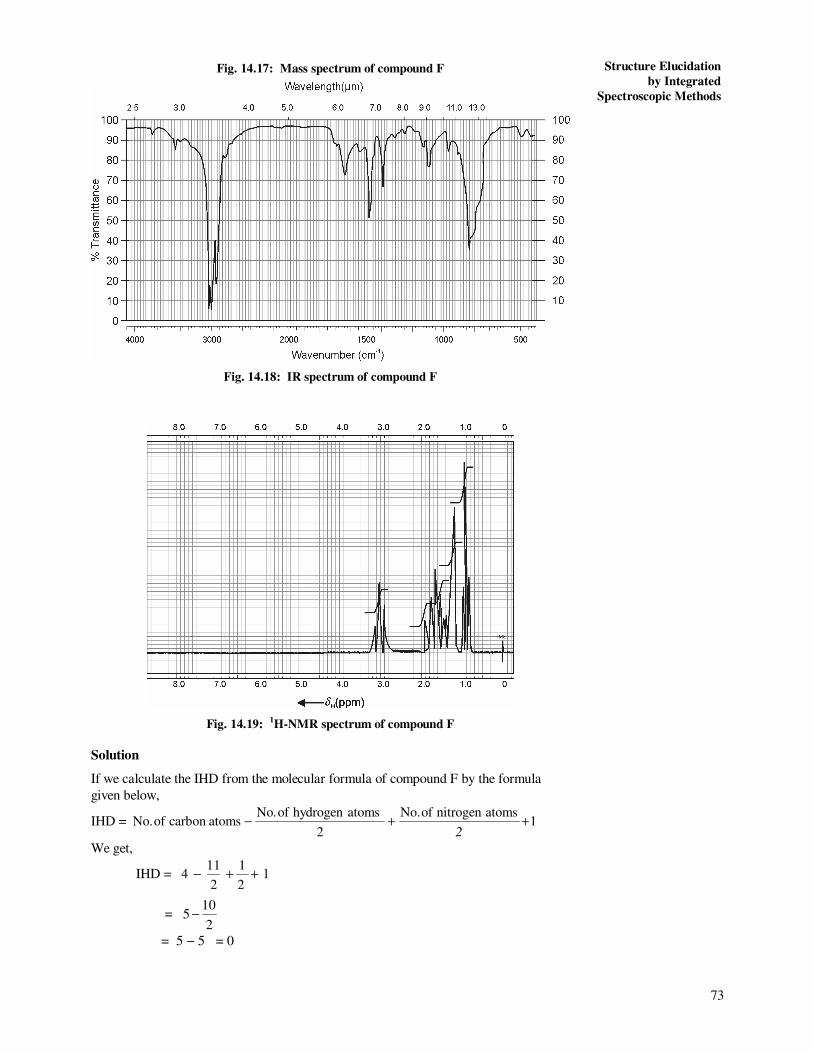
Fig. 14.18: IR spectrum of compound F
Fig. 14.19: 1H-NMR spectrum of compound F
Solution
If we calculate the IHD from the molecular formula of compound F by the formula
given below,
IHD = 1atomsnitrogenof.No
2
atoms hydrogenof.Noatomscarbonof.No ++−
2
We get,
IHD = 12
1
2
114 ++−
= 2
105 −
= 5 − 5 = 0

74
Miscellaneous Methods
Thus, the compound has no unsaturation or double/triple bond or rings.
Mass: The compound contains nitrogen as is evident from its molecular formula. The
molecular ion M+ peak is at m/z at 73 which is in accordance with the nitrogen rule.
The base peak at m/z 30 indicates that the compounds could be a primary amine as
primary amines gives this characteristic peak due to α -cleavage as shown below.
[R CH2 − ] 22.
2 HNCHRNH+
• =+→
+
m/z = 30
IR: The interpretation of the IR signal is as follows.
i) The two bands in the range of 3500 – 3300 cm‒1
are supportive of the presence of
a primary amine as these bands could be arising due to the N – H stretching.
ii) The other amines are ruled out as the secondary amines show only one band in
this region and tertairy amines do not show any band here.
iii) The presence of amino group is supported by the broad band near 800 cm‒1
due
to the out of plane N − H bending and the C − N stretching band around 1090
cm‒1
.
NMR: The 1H-NMR spectrum shows 4 sets of signals at δ= 0.92 (triplet, 3H), δ= 1.16
singlet (2H, broad), δ= 1.3 – 1.5 (multiplet, 4H) and δ= 2.7 (triplet, 2H).Let us now try
to identify the structural units present in the compound on the basis of these signals and
their splitting patterns.
i) The three proton triplet at δ 0.92 could be due to the protons of a methyl group,
next to a − CH2 group, i.e. CH3 – CH2 – .
ii) The broad singlet due to two H at δ 1.16 could be due to –NH2 protons which do
not show coupling with neighbouring protons.
iii) The two proton triplet at δ= 2.7 is quite downfield and is likely to be for a – CH2
group attached to – NH2 group. The splitting into triplet, could be due to the
presence of a neighbouring –CH2 group. This yields the following structural unit.
− CH2 − CH2 − NH2
iv) The remaining 4 protons appear as a multiplet between δ 1.3-1.5.
If we put together this unit and the CH3 − CH2 − unit, we get the structure indicated
below:
CH3CH
2CH
2CH
2NH
2
Butanamine
Thus, on the basis of the spectra the compound is found to be butanamine with the
structure given above.
14.5 SUMMARY
The determination of molecular formula is an important aspect in the structure
elucidation of an organic compound. From the molecular formula, the Index of
Hydrogen Deficiency can be calculated. The knowledge of IHD helps to know about the
possibility of presence of unsaturation and/or rings in a molecule.
Different kind of information is available from various spectra of a molecule. The mass
spectral data helps us to know the molecular mass of a compound and the fragment ions
75
Structure Elucidation
by Integrated
Spectroscopic Methods
of the molecule. An analysis of the fragment ion peaks indicates the type of functional
groups or structural units that may be present in the molecule. The UV spectral data
indicates about the extent of conjugation present in a compound. The IR spectral data
tells about different types of functional groups present in a compound. It also gives
information about the presence/absence of hydrogen bonding, substituent pattern of
aromatic rings etc. The 1H-NMR reveals the number of different types of protons
present in a molecule, their number and the electronic environment, etc.
Together, the variety of information available from different types of spectra leads us to
the elucidation of structure of an unknown compound. The structure-spectra correlation
also helps us to predict the spectral data for a given compound. The spectral studies,
thus, help a lot in structure determination and identification of compounds.
14.6 TERMINAL QUESTIONS
1. Calculate IHD for the following molecules:
(a) C6H6 (b) C4H8O2
(c) (d)
O
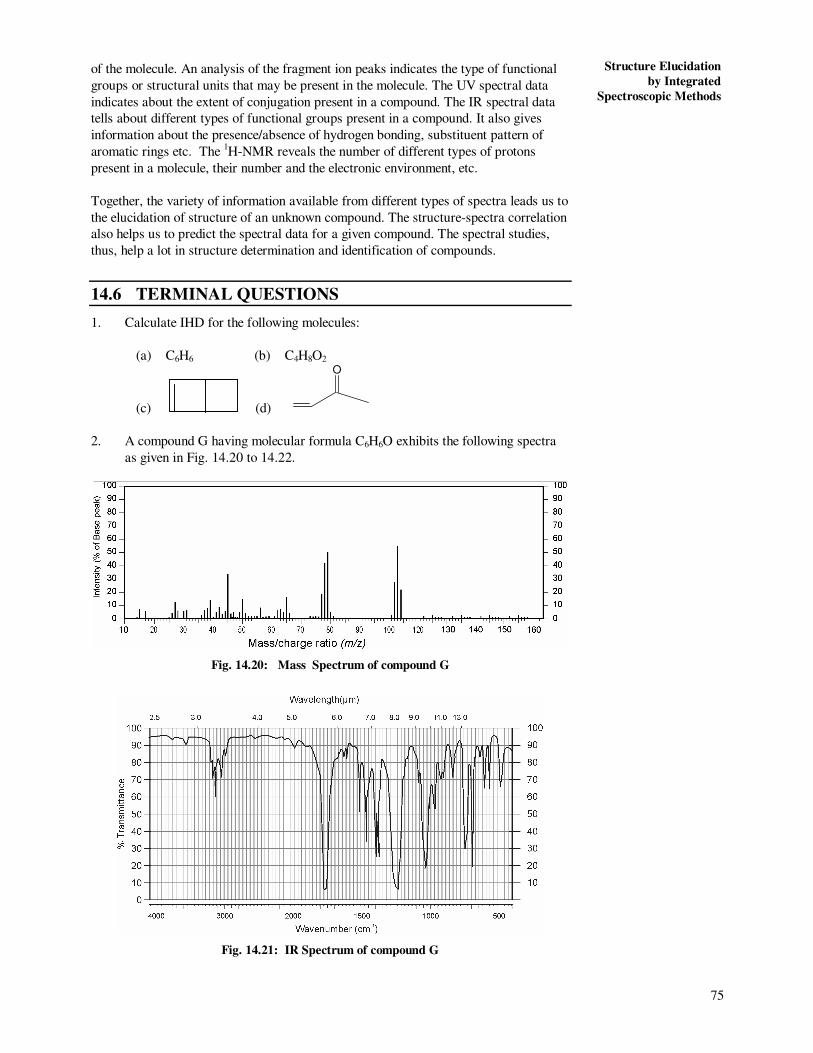
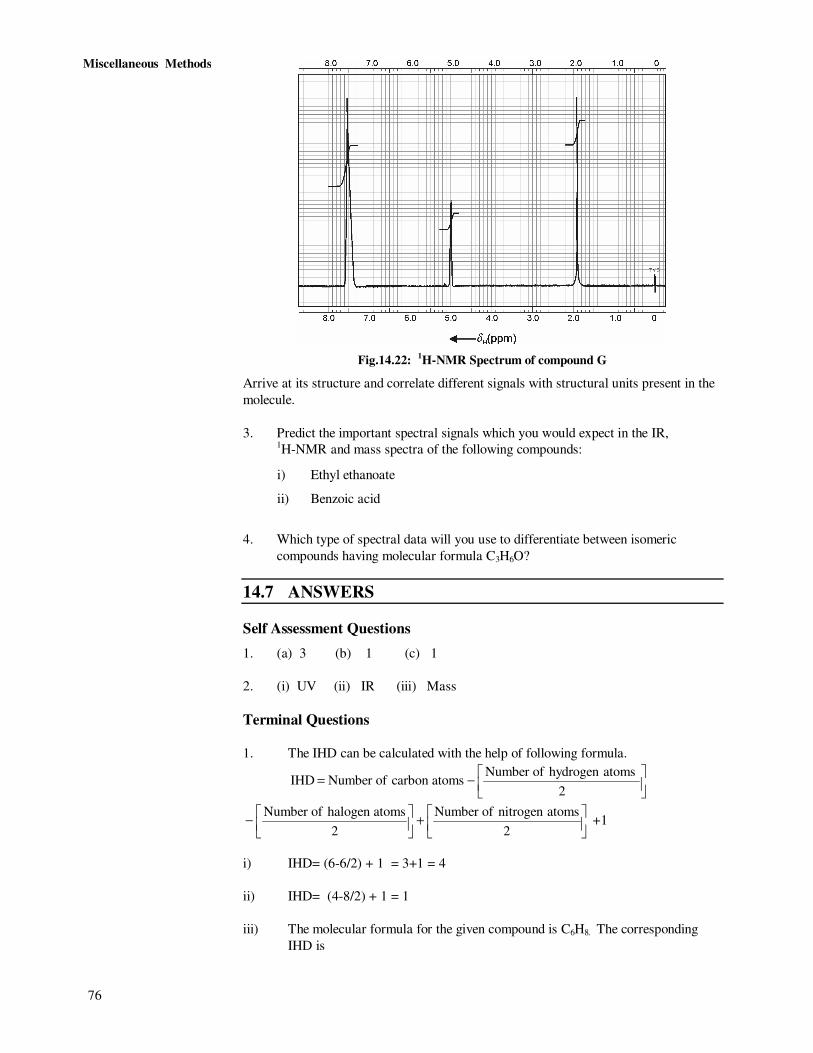
2. A compound G having molecular formula C6H6O exhibits the following spectra
as given in Fig. 14.20 to 14.22.
Fig. 14.20: Mass Spectrum of compound G
Fig. 14.21: IR Spectrum of compound G
76
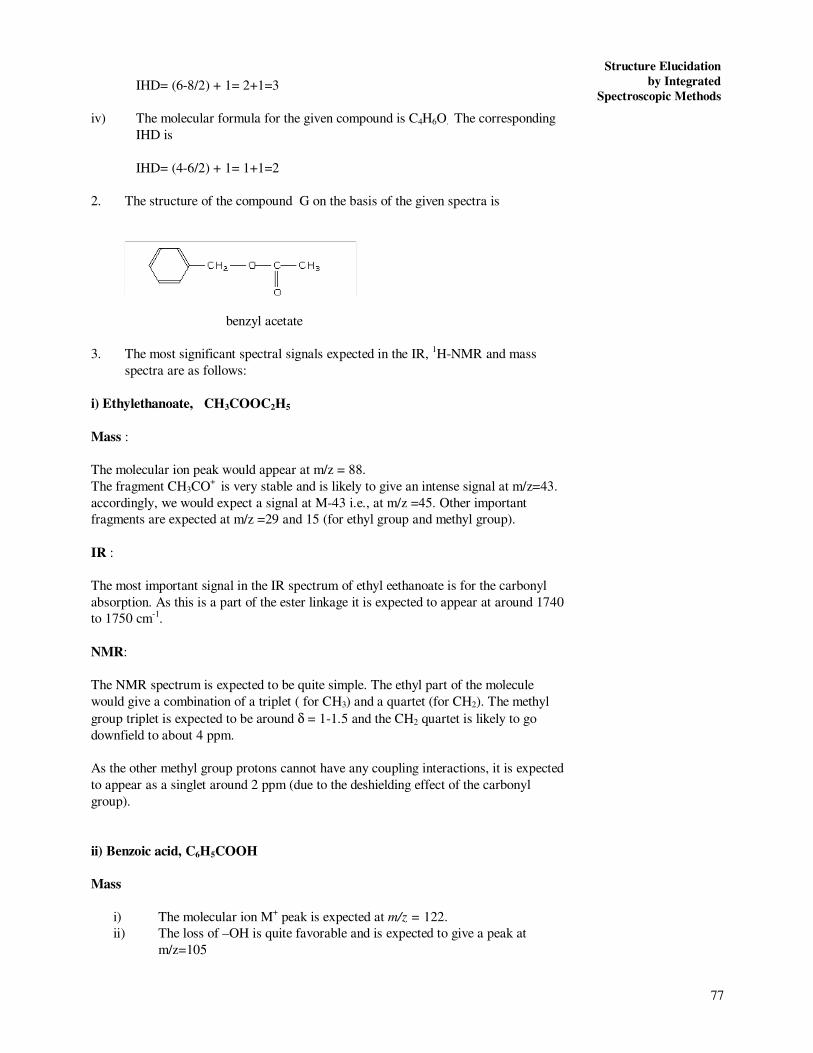
Miscellaneous Methods
Fig.14.22: 1H-NMR Spectrum of compound G
Arrive at its structure and correlate different signals with structural units present in the
molecule.
3. Predict the important spectral signals which you would expect in the IR,
1H-NMR and mass spectra of the following compounds:
i) Ethyl ethanoate
ii) Benzoic acid
4. Which type of spectral data will you use to differentiate between isomeric
compounds having molecular formula C3H6O?
14.7 ANSWERS
Self Assessment Questions
1. (a) 3 (b) 1 (c) 1
2. (i) UV (ii) IR (iii) Mass
Terminal Questions
1. The IHD can be calculated with the help of following formula.
−=
2
atomshydrogen ofNumber atomscarbon ofNumber IHD
+
−
2
atomsnitrogen ofNumber
2
atomshalogen ofNumber +1
i) IHD= (6-6/2) + 1 = 3+1 = 4
ii) IHD= (4-8/2) + 1 = 1
iii) The molecular formula for the given compound is C6H8. The corresponding
IHD is
77
Structure Elucidation
by Integrated
Spectroscopic Methods
IHD= (6-8/2) + 1= 2+1=3
iv) The molecular formula for the given compound is C4H6O. The corresponding
IHD is
IHD= (4-6/2) + 1= 1+1=2
2. The structure of the compound G on the basis of the given spectra is
benzyl acetate
3. The most significant spectral signals expected in the IR, 1H-NMR and mass
spectra are as follows:
i) Ethylethanoate, CH3COOC2H5
Mass :
The molecular ion peak would appear at m/z = 88.
The fragment CH3CO+ is very stable and is likely to give an intense signal at m/z=43.
accordingly, we would expect a signal at M-43 i.e., at m/z =45. Other important
fragments are expected at m/z =29 and 15 (for ethyl group and methyl group).
IR :
The most important signal in the IR spectrum of ethyl eethanoate is for the carbonyl
absorption. As this is a part of the ester linkage it is expected to appear at around 1740
to 1750 cm-1.
NMR:
The NMR spectrum is expected to be quite simple. The ethyl part of the molecule
would give a combination of a triplet ( for CH3) and a quartet (for CH2). The methyl
group triplet is expected to be around δ = 1-1.5 and the CH2 quartet is likely to go
downfield to about 4 ppm.
As the other methyl group protons cannot have any coupling interactions, it is expected
to appear as a singlet around 2 ppm (due to the deshielding effect of the carbonyl
group).
ii) Benzoic acid, C6H5COOH
Mass
i) The molecular ion M+ peak is expected at m/z = 122.
ii) The loss of –OH is quite favorable and is expected to give a peak at
m/z=105
78
Miscellaneous Methods
iii) Similarly, the loss of –COOH is also favourable and is expected to give a
peak at m/z=77; the expected ion being +56HC
iv) A further loss of HC = CH from +56HC ion would yield +
34HC ion; the
peak for which may be observed at m/z 51.
IR
In benzoic acid we can expect 3-4 important signals/ features in the IR spectrum. These
are as follows:
i) Characteristic bands in the range of 1600 cm-1 for the benzene ring
ii) The carbonyl group at around 1700-1750 cm-1
ii) A broad signal about 3000 cm-1
for hydrogen bonding
iii) Characteristic pattern in the range of 700-750 cm-1 for the mono substituted
benzene.
NMR
The aromatic protons are expected as a multiplet between δ 7.4 – 7.9 due to the
difference in chemical shift positions of the ortho, meta and para protons and the
coupling between them.
The acidic proton of the –COOH group is expected to be quite downfield around 11-
12 ppm.
4. Let us first write down the structural formulae for the possible isomers of the
compound with the molecular formula, C3H6O.
CH2 CH CH
2 OH
CH3
C
OH
CH2
CH3 C
O
CH3
CH3
CH2 C
H
O
i)
ii)
iii)
iv)
These compounds can be differentiated by using UV-VIS, IR, NMR or Mass
spectrometry; NMR being the most convenient. The NMR of the compound
i) would give just one signal in NMR whereas the compounds ii) and iv)
would give three different signals each. On the other hand the compound iii)
would give as many as four signals. The compounds ii) and iv) can be further
differentiated by the location of the signals and the splitting pattern.
79
Structure Elucidation
by Integrated
Spectroscopic Methods
SOME USEFUL BOOKS AND WEBSITES
1. Robert M. Silverstein, Francis X. Webster and David Kiemle (2005).
Spectrometric Identification of Organic Compounds, 7th edition. Wiley.
2. William Kemp (1991). Organic Spectroscopy, 3rd edition. W.H. Freeman &
Company.
3. Douglas A. Skoog, F. James Holler and Timothy A. Nieman. (1998) Principles
of Instrumental Analysis, 5th edition. Brooks/Cole.
4. S.M. Khopkar (2008) Basic Concepts in Analytical Chemistry, 3rd edition. New
Age International publishers.
http://www.cem.msu.edu/~reusch/VirtualText/Spectrpy/nmr/nmr2.htm#nmr11
http://www.chemistry.nmsu.edu/studntres/chem435/Lab8/intro.html
http://www.chem.uic.edu/web1/ocol/spec/MS.htm
http://base-peak.wiley.com/
http://www.chem.ucla.edu/~webspectra/Solvingspectralproblems.html
80
Miscellaneous Methods INDEX
Absorption signals 26
Acetone 26, 63
Analysers 43
Anisotropic 19, 21, 31
Applications of mass spectrometry Qualitative applications 46
Quantitative applications 51
Applications of NMR spectroscopy
Qualitative applications 28 Ethanol 28
Methanol 30
Benzyl alcohol 30
Phenol 31
Base peak 39
Benzaldehyde 67, 68
Boltzmann constant 9
Boltzmann distribution law 9, 12
Broad or wide line 27
Butanamine 73
Characteristics of mass spectrum 38
Chemical exchange 30, 32
Chemical ionisation 42
Continuous wave spectrometry 12
Coupling constant 14, 23
Deshielding 15, 16, 17
Desorption sources 41
Diamagnetic effect 16, 17
Direct insertion probe 41
Double focussing analysers 44
Electromagnets 25, 43
Electron ionisation 42
Ethychloropropionate 71
Factors affecting chemical shift Anisotropy of chemical bonds19, 20, 33
Electronegativity 19
Hydrogen bonds 21
Field ionisation 42
Field sweep method 12
Fourier transform spectroscopy 14
Fourier transformation 14
Fragment ions 39
Fragmentation by cleavage at a single bond 48
by α-cleavage in molecules with heteroatoms 48
due to intramolecular rearrangement 48, 49
Free induction decay 14, 32
Frequency sweep method 12
Gas phase sources 41
Index of hydrogen deficiency 57, 58
Induced magnetic field 15, 16, 19
Instrumentation for mass spectrometry Inlet device 40, 41
Ionisation chamber 40
Analyser 40, 43
Detector 40, 44, 45
Processing and output devices 40, 45
Instrumentation for NMR spectroscopy Magnet 25
Sample probe 25
Detector system 25
Sample handling 26
Integral modes 26
Integration trace 26
Isotopic peaks 39
Larmor frequency 11
Larmor precession 10, 12
Longitudinal relaxation 13
Magnetic moment 7, 8, 9
Magnetic sector analyzer 43
Magnitude of coupling constants 23
Mass spectrum 38, 40
McLafferty rearrangement 48
Mechanism of resonance 11
Molecular ion 38
Multiplicity of spin-spin interactions 23
Natural abundance 39
Nitrogen rule 46
Nuclear g-factor 7
Paramagnetic effect 17
Pascal’s triangle 22, 23
Permanent magnets 25
Precessional motion 10, 11, 12, 34
Propanoic acid 69
Quantisation 8
Quantitative applications Analysis of multicomponent mixtures 27
Elemental analysis 27
Organic functional group analysis 28
Radical cation 38
Radical ion 38
Relaxation mechanisms 12, 13
Representation of NMR 26
Resolution or sharp line spectrum 27
Scan 14, 15
Shielding 15
Shielding constant 16
Shielding mechanism 16
Spin angular momentum quantum number 6, 7, 13, 32
Spin down 9
Spin flip 12
Spin up 9
Spin-lattice relaxation 13, 32
Spin-spin coupling 21, 23
Spin-spin relaxation 13
Standard for chemical shift 17
Structure elucidation of organic compounds 61
Superconducting magnets 25
Tetramethylsilane 17, 21, 26
Theory of mass spectrometry 38
Theory of NMR spectroscopy 6
Toluene 65
Transducer 41
Transverse relaxation 13
Types of nuclei 6
Unit of chemical shift 17