Embed Size (px)
Citation preview

UniCredit Group: 3Q15 results
Milan, November 11th, 2015

UniCredit Group - INTERNAL USE ONLY -
2
Disclaimer
This Presentation may contain written and oral “forward-looking statements”, which includes all statements that do not relate solely to historical or current facts and which are therefore inherently uncertain. All forward-looking statements rely on a number of assumptions, expectations, projections and provisional data concerning future events and are subject to a number of uncertainties and other factors, many of which are outside the control of UniCredit S.p.A. (the “Company”). There are a variety of factors that may cause actual results and performance to be materially different from the explicit or implicit contents of any forward-looking statements and thus, such forward-looking statements are not a reliable indicator of future performance. The Company undertakes no obligation to publicly update or revise any forward-looking statements, whether as a result of new information, future events or otherwise, except as may be required by applicable law. The information and opinions contained in this Presentation are provided as at the date hereof and are subject to change without notice. Neither this Presentation nor any part of it nor the fact of its distribution may form the basis of, or be relied on or in connection with, any contract or investment decision. The information, statements and opinions contained in this Presentation are for information purposes only and do not constitute a public offer under any applicable legislation or an offer to sell or solicitation of an offer to purchase or subscribe for securities or financial instruments or any advice or recommendation with respect to such securities or other financial instruments. None of the securities referred to herein have been, or will be, registered under the U.S. Securities Act of 1933, as amended, or the securities laws of any state or other jurisdiction of the United States or in Australia, Canada or Japan or any other jurisdiction where such an offer or solicitation would be unlawful (the “Other Countries”), and there will be no public offer of any such securities in the United States. This Presentation does not constitute or form a part of any offer or solicitation to purchase or subscribe for securities in the United States or the Other Countries. Pursuant the consolidated law on financial intermediation of 24 February 1998 (article 154-bis, paragraph 2) Marina Natale, in her capacity as manager responsible for the preparation of the Company’s financial reports declares that the accounting information contained in this Presentation reflects the UniCredit Group’s documented results, financial accounts and accounting records. Neither the Company nor any member of the UniCredit Group nor any of its or their respective representatives, directors or employees accept any liability whatsoever in connection with this Presentation or any of its contents or in relation to any loss arising from its use or from any reliance placed upon it.
UniCredit Group - INTERNAL USE ONLY -
3
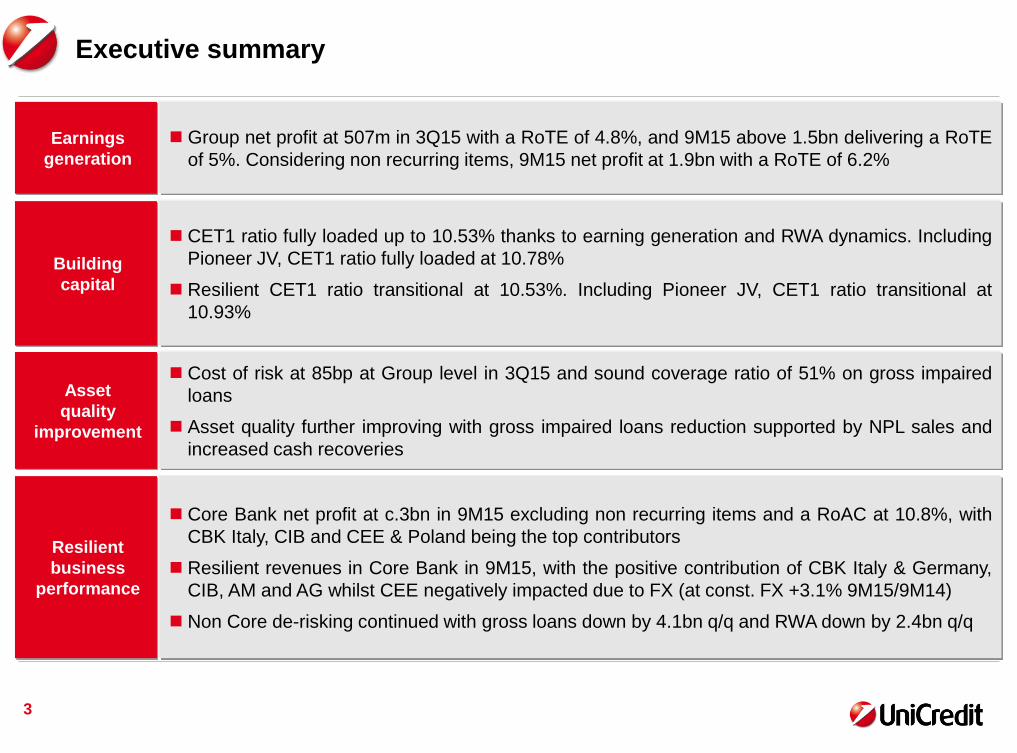
Executive summary
Earnings
generation
Resilient
business
performance
Building
capital
Asset
quality
improvement
Group net profit at 507m in 3Q15 with a RoTE of 4.8%, and 9M15 above 1.5bn delivering a RoTE
of 5%. Considering non recurring items, 9M15 net profit at 1.9bn with a RoTE of 6.2%
Core Bank net profit at c.3bn in 9M15 excluding non recurring items and a RoAC at 10.8%, with
CBK Italy, CIB and CEE & Poland being the top contributors
Resilient revenues in Core Bank in 9M15, with the positive contribution of CBK Italy & Germany,
CIB, AM and AG whilst CEE negatively impacted due to FX (at const. FX +3.1% 9M15/9M14)
Non Core de-risking continued with gross loans down by 4.1bn q/q and RWA down by 2.4bn q/q
CET1 ratio fully loaded up to 10.53% thanks to earning generation and RWA dynamics. Including
Pioneer JV, CET1 ratio fully loaded at 10.78%
Resilient CET1 ratio transitional at 10.53%. Including Pioneer JV, CET1 ratio transitional at
10.93%
Cost of risk at 85bp at Group level in 3Q15 and sound coverage ratio of 51% on gross impaired
loans
Asset quality further improving with gross impaired loans reduction supported by NPL sales and
increased cash recoveries

UniCredit Group - INTERNAL USE ONLY -
4
Agenda
Non Core
Core Bank
Annex
Financials
Group

UniCredit Group - INTERNAL USE ONLY -
9M15 at 1.9bn
excluding non
recurring items(1)
3Q15 at c.640m
excluding CHF
conversion in
Croatia
5
Group – Results
Net profit above 1.5bn in 9M15 with 5% RoTE and 1.9bn with 6.2% RoTE
considering SRF/DGS, LLP for Ukraine and CHF conversion in Croatia
Net profit, m
RoTE(2)
(1) Single Resolution Funds in Italy, Germany, Austria and CEE (c.160m net), impairment related to Ukrsotsbank (100m net) and LLP
for CHF conversion in Croatia (c.140m net).
(2) RoTE: net profit / average tangible equity (excluding AT1).
(3) Funding gap: customers loans - (customer deposits + customer securities).
6.0% 5.0%6.8% 4.9% 4.8%
Total assets, bn
Total RWA / Total assets, %
Tangible equity, bn
Funding gap(3), bn
874875901844856
+2.1%
-0.2%
Sep-15 Jun-15 Mar-15 Dec-14 Sep-14
44.644.645.643.845.9
+0.2%
-2.8%
Sep-15 Jun-15 Mar-15 Dec-14 Sep-14
45.846.446.748.546.9
-0.5pp
-1.0p.p.
Sep-15 Jun-15 Mar-15 Dec-14 Sep-14
23.3 15.6
-11.9
15.4
-10bn
-1.5
29.9
Jun-15
20.0
-21bn
Sep-15 Mar-15
40.9
Sep-14
33.2 32.6
Dec-14
Funding GAP
Exc. mkt & instit. counterparties
6.2% excl. non
recurring items(1)
1,541
1,837
507522722
9M14 3Q15 2Q15 3Q14
-16.1%
-3.0%
9M15
UniCredit Group - INTERNAL USE ONLY -
6
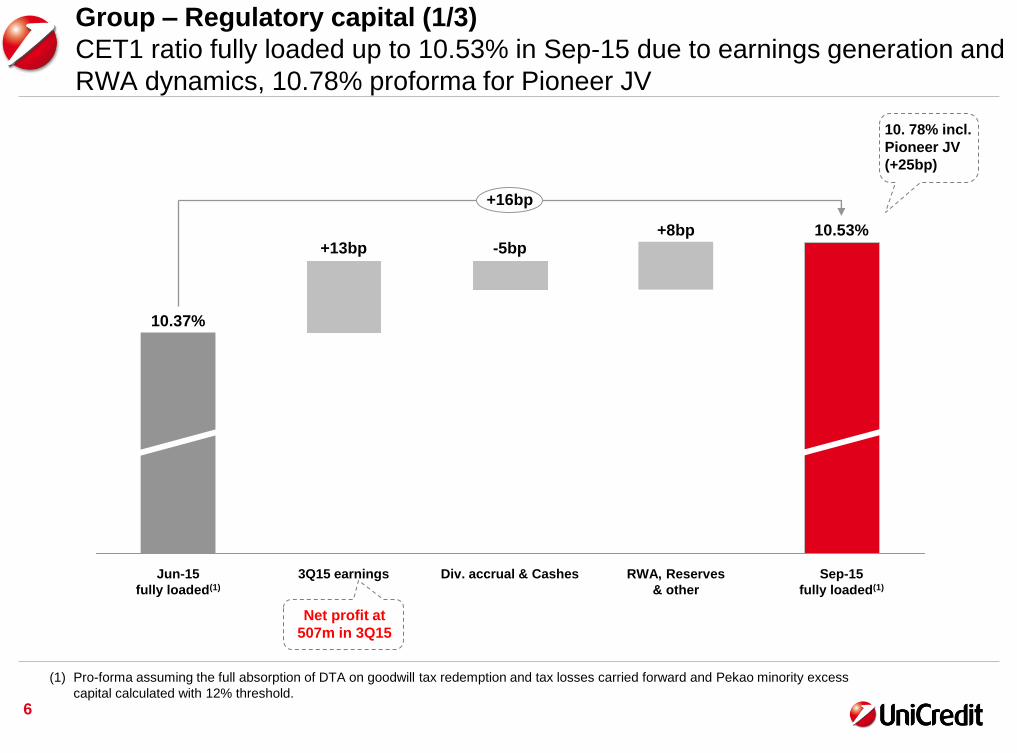
Group – Regulatory capital (1/3)
CET1 ratio fully loaded up to 10.53% in Sep-15 due to earnings generation and
RWA dynamics, 10.78% proforma for Pioneer JV
10.37%
Sep-15
fully loaded(1)
10.53%
+16bp
RWA, Reserves
& other
+8bp
Div. accrual & Cashes
-5bp
3Q15 earnings
+13bp
Jun-15
fully loaded(1)
(1) Pro-forma assuming the full absorption of DTA on goodwill tax redemption and tax losses carried forward and Pekao minority excess
capital calculated with 12% threshold.
10. 78% incl.
Pioneer JV
(+25bp)
Net profit at
507m in 3Q15
UniCredit Group - INTERNAL USE ONLY -
7
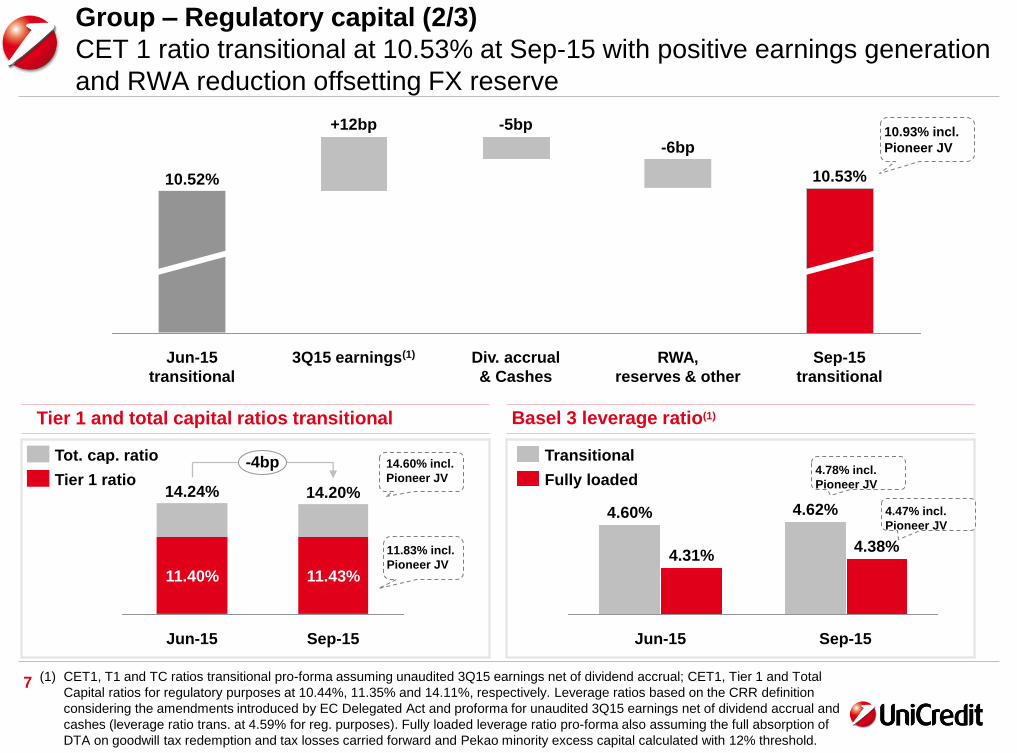
Group – Regulatory capital (2/3)
CET 1 ratio transitional at 10.53% at Sep-15 with positive earnings generation
and RWA reduction offsetting FX reserve
Sep-15
transitional
10.53%
RWA,
reserves & other
-6bp
Div. accrual
& Cashes
-5bp
3Q15 earnings(1)
+12bp
Jun-15
transitional
10.52%
Tier 1 and total capital ratios transitional Basel 3 leverage ratio(1)
Sep-15
4.38%
4.62%
Jun-15
4.31%
4.60%
Fully loaded
Transitional
11.83% incl.
Pioneer JV
Jun-15
14.24%
11.40%
-4bp
Sep-15
14.20%
11.43%
(1) CET1, T1 and TC ratios transitional pro-forma assuming unaudited 3Q15 earnings net of dividend accrual; CET1, Tier 1 and Total
Capital ratios for regulatory purposes at 10.44%, 11.35% and 14.11%, respectively. Leverage ratios based on the CRR definition
considering the amendments introduced by EC Delegated Act and proforma for unaudited 3Q15 earnings net of dividend accrual and
cashes (leverage ratio trans. at 4.59% for reg. purposes). Fully loaded leverage ratio pro-forma also assuming the full absorption of
DTA on goodwill tax redemption and tax losses carried forward and Pekao minority excess capital calculated with 12% threshold.
10.93% incl.
Pioneer JV
14.60% incl.
Pioneer JV Tier 1 ratio
Tot. cap. ratio 4.78% incl.
Pioneer JV
4.47% incl.
Pioneer JV

Sep-15
400.5
Other
-1.0
FX effect
-3.7
-3.5
-0.2
Procyclicality
-1.0
Business
actions
-0.2
Business
evolution
+0.5
+1.1
-0.6
Jun-15
405.9
8
RWA eop, bn
Group – Regulatory capital (3/3)
RWA decreased by 5.4bn q/q mainly due to FX dynamics and procyclicality
more than offsetting business evolution
RWA main drivers(1), bn
Credit risk RWA decreased mainly driven by FX effect more than offsetting business evolution
The amortization of FX hedging(3) in CEE resulted in -1.2bn Market RWA during 3Q15
19
344
43
Sep-14
401
19
Credit
Market
-0.8bn
-5.4bn
Operational
Sep-15
400
17
340
43
Jun-15
406
338
44
Credit
Market
Other(2)
(1) Business evolution: changes related to business development; business actions: actions to proactively decrease RWA (mainly loan
securitization); procyclicality: change in macro-economics framework or change in specific client's credit worthiness; FX effect:
impact on RWA from translation of exposure from non-euro denominated exposures.
(2) Market, credit and operational RWA.
(3) Run-off of strategic FX hedging to cover 2015 net profit in CEE countries.

UniCredit Group - INTERNAL USE ONLY -
9
Group – Medium-long term funding plan
2015 Group Funding Plan completed including TLTRO
Group Funding Plan 2015 rightsized to better gauge liquidity available from TLTRO take up for 7.9bn(3) in 2015
Group Funding Plan realized leveraging on diversified sources and geographies
(1) Inter-company funding not included.
(2) Network bonds comprise only unsecured bonds placed through UCG commercial networks.
(3) 7.9bn at Group level, o/w 7.4bn in Italy and 0.5bn in Austria.
Funding mix, managerial data % of M/L term run offs by region(1)
% M/L Term Network bonds run offs(2)
Austria
Germany
Italy
2016
32.3bn
18%
23%
59%
2015
28.2bn
20%
28%
52%
2015 (planned)
26.6bn
2014 (realized)
24.6bn
18%
25%
14%
8%
13%
23%
Group retail network
Public sector & mortgages CBs
Supranational funding
Priv. plac. & schuldschein
Bank cap. bonds
Public market and wholesale MLT
2017
29.6bn
15%
17%
68%
10.1bn TLTRO
not included
7.9bn TLTRO
not included
2015 (realized)
16.9bn
9%
33%
19%
7%
19%
12%
Geographical distribution Poland
0.0% Austria
24.3%
Germany
27.4%
Italy 48.3%
32% 39% 40%

UniCredit Group - INTERNAL USE ONLY -
10
Gross impaired loans(1), bn
39.7 40.9 41.1 40.0 39.6
83.6
-0.2% -4.3%
Sep-15
80.7
Jun-15
81.7
Dec-14
84.4
Sep-14
83.5
Dec-13
Gross bad loans (sofferenze)(1), bn
Group – Asset quality
Gross impaired further down due to NPL sales and recoveries. Coverage ratio
confirmed at a sound 51% with CoR down excluding CHF conversion in Croatia
18.1 19.719.719.3
49.1
+3.1% -2.9%
Sep-15
50.6
19.5
Jun-15
51.3
Dec-14
52.1
Sep-14
50.6
Dec-13
Cov. ratio
(1) The perimeter of impaired exposures as per instructions of BankIT Circular 272 is substantially equivalent to the perimeter of Non
Performing Exposures (NPE) EBA.
(2) Adjusted for -7.2bn coverage enhancement LLP in 4Q13 (stated CoR at 753bp), +0.5bn LLP release in 3Q14 (stated CoR at 64bp)
and -0.2bn LLP in 3Q15 related to CHF conversion in Croatia (stated CoR at 85bp).
Cov. ratio
Net imp.
Net bad
Gross impaired loans – Yearly variations
52.5% 51.0% 51.3% 51.0% 51.0% 63.1% 61.8% 62.2% 61.7% 61.4%
3Q15
-3.3%
2Q15
-0.8%
1Q15
0.9%
4Q14
0.9%
3Q14
0.0%
4Q13
4.9%
Cost of risk(2), bp
144
76
174
68109
3Q14 3Q15 2Q15 4Q14 4Q13
Non-rec. items(2)

11
Asset quality in Italy
Confirmed better asset quality trend vs. banking system
(1) UCI Spa data based on regulatory flows.
(2) Italian banking association - sample composed by c. 80% of Italian banking system; including exposures towards households and
non financial corporations.
Gross impaired loans Base 100 at Dec-12
Gross bad loans (sofferenze) Base 100 at Dec-12
Other gross impaired loans Base 100 at Dec-12
Dec-12 Dec-14 Mar-15
Gross impaired loans trend consistently better than the Italian banking system
Gross bad loans (sofferenze) still performing better than the system in 3Q15
Other gross impaired loans confirmed a downward trend for UCG, down by 16pp y/y
Sep-14 Dec-13 Dec-12 Dec-14 Mar-15 Sep-14 Dec-13 Dec-12 Dec-14 Mar-15 Sep-14 Dec-13
143138138
134
159155
150146
140
129
122
117
100 100 85
89
94
98101
103
127126127127
123
113
100 100
ABI sample(2)
UCI Spa(1)
116115117117
116
144141
139137
133
118
110
100 100
Jun-15 Jun-15 Jun-15 Sep-15 Sep-15 Sep-15

12
Group
Agenda
Non Core
Core Bank
Annex
Financials
Group

9M15 at c.3bn
excluding non
recurring items(1)
13
Core Bank – Net profit
Net profit 900m in 3Q15 with 10% RoAC. Net profit 2.6bn in 9M15, up vs. 9M14
considering DGS/SRF, Ukraine in 2Q15 and LLP for CHF conversion in Croatia
Net profit, m
RoAC(2)
57
36
72
AM
-18
CIB
CB Germany
515
AG (Fineco)
CEE
294
106
CB Italy
CB Austria
158
Poland
Divisional breakdown – 3Q15 net profit, m
RoAC(2)
(1) Single Resolution Funds in Italy, Germany, Austria and CEE (c.140m net), impairment related to Ukrsotsbank (100m net) and LLP
for CHF conversion in Croatia (c.140m net).
(2) RoAC calculated as net profit on allocated capital. Allocated capital calculated as 9.25% of RWAs, including deductions for shortfall
and securitizations.
(3) Excluding the impact of c.200m (c.140m net of tax) LLP related to CHF conversion in Croatia booked in 3Q15.
13.6% 8.9% 9.9% 11% 9.4%
25.1%
12.6%
n.m.
22.0%
14.0%
18.0%
83.8%
90.5%
(3)
2,597
2,865
900818
1,099
2Q15
+9.9%
9M15 9M14 3Q15
-9.3%
3Q14
10.8% excl. non
recurring items(1)

3Q15 at c.1.7bn
excluding CHF
conversion in
Croatia
14
Core Bank – Net operating profit
Net operating profit stable in 3Q15 excluding loan loss provisions for CHF
conversion in Croatia
Net operating profit, m
Revenues, m
Loan loss provisions, m
Costs, m
16,68816,643
5,3115,6935,476
3Q14 2Q15 9M15 9M14 3Q15
-6.7%
+0.3%
9,7899,599
3,2393,3013,181
2Q15 3Q15 9M14 3Q14
+2.0%
9M15
-1.9%
5,166
5,666
1,5231,776
2,040
3Q15
-14.2%
-8.8%
9M15 9M14 3Q14 2Q15
3Q15 embedding
c200m for CHF
conversion 1,732
1,378
548615256
-10.9%
3Q15 9M15
+25.7%
3Q14 9M14 2Q15

15
Core Bank – Revenues
Resilient revenues in 9M15 with net interest compensated by higher fees,
trading and dividends. 3Q15 trading affected by market conditions
Net fees and commissions, m
Dividends and other income(2), m
Net interest(1), m
Trading income, m
1,808
+4.6%
1,868
5,545
1,966
5,801
9M14 3Q14 9M15 3Q15 2Q15
-5.0%
2Q15
-3.8%
-2.1%
9M15 9M14
9,210
3Q14 3Q15
8,856
2,990 2,928 3,068
248
462387
3Q14 3Q15
1,199
2Q15 9M14
-46.2%
1,330
9M15
+11.0%
229 220120 188
461
8793
481
203
690
2Q15 9M14 3Q14
275 213
9M15
63
3Q15
266
-3.4%
701
+1.6% Turkey
Other revenues
(1) Contribution from macro hedging strategy on non naturally hedged sight deposits in 3Q15 at 365m (368m in 3Q14).
(2) Figures include dividends, equity investments and balance of other operating income / expenses. Turkey contribution based
on a divisional view.
UniCredit Group - INTERNAL USE ONLY -
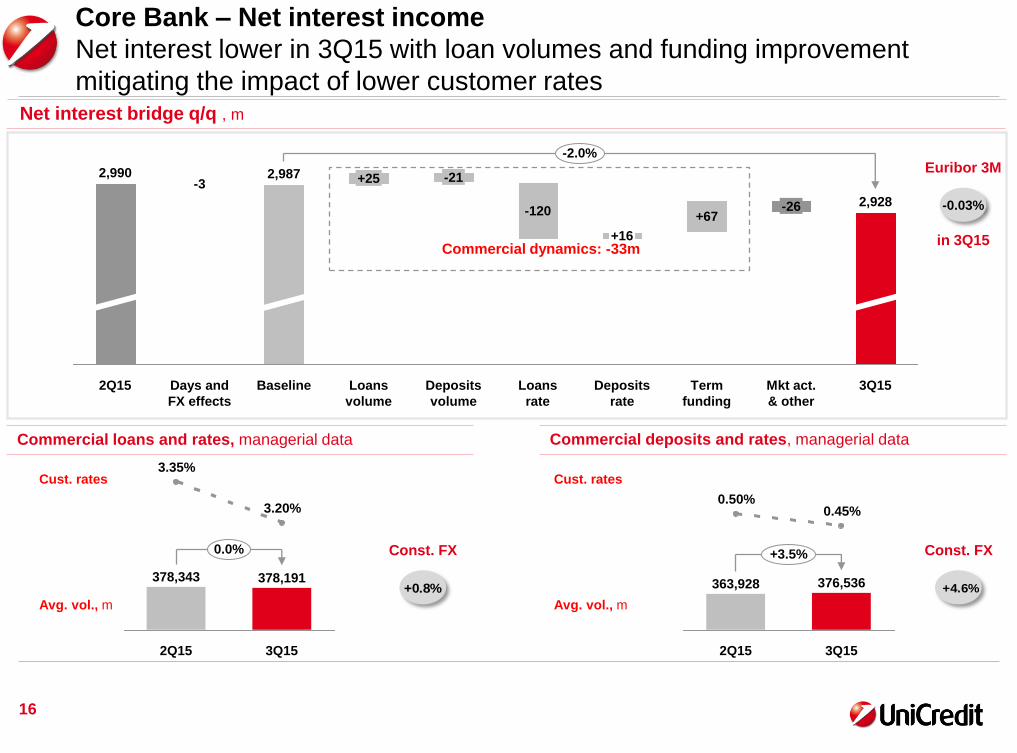
3Q15
363,928
+3.5%
376,536
0.50%
2Q15
0.45%
0.0%
3Q15
378,191
3.20%
2Q15
378,343
3.35%
16
Core Bank – Net interest income
Net interest lower in 3Q15 with loan volumes and funding improvement
mitigating the impact of lower customer rates Net interest bridge q/q , m
Commercial dynamics: -33m
Euribor 3M
-0.03%
Commercial loans and rates, managerial data Commercial deposits and rates, managerial data
Cust. rates
Avg. vol., m
Cust. rates
Avg. vol., m
Const. FX Const. FX
+0.8% +4.6%
2,928
Mkt act.
& other
-26
Term
funding
+67
Deposits
rate
+16
Loans
rate
-120
Deposits
volume
-21
Loans
volume
+25
Baseline
2,987
-2.0%
3Q15 Days and
FX effects
-3
2Q15
2,990
in 3Q15
UniCredit Group - INTERNAL USE ONLY -
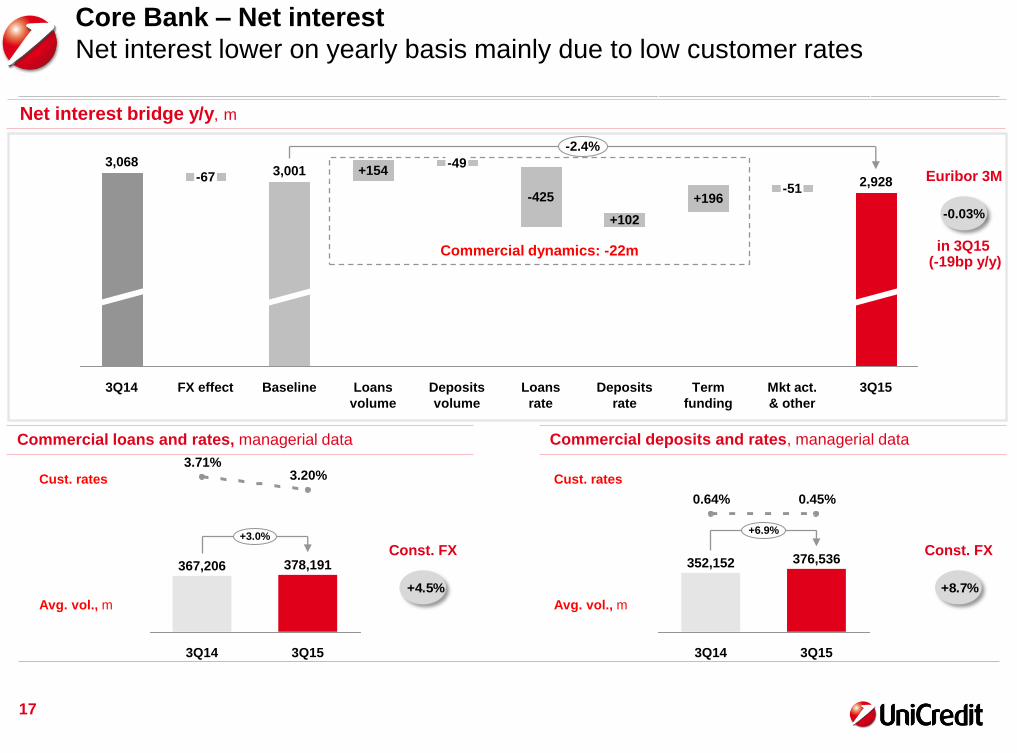
+3.0%
3Q15
378,191
3.20%
3Q14
367,206
3.71%
+6.9%
3Q15
376,536
0.45%
3Q14
352,152
0.64%
17
Core Bank – Net interest
Net interest lower on yearly basis mainly due to low customer rates
Net interest bridge y/y, m
Commercial dynamics: -22m
Euribor 3M
-0.03%
Commercial loans and rates, managerial data Commercial deposits and rates, managerial data
Cust. rates
Avg. vol., m
Cust. rates
Avg. vol., m
Const. FX Const. FX
+8.7%+4.5%
-2.4%
3Q15
2,928
Mkt act.
& other
-51
Term
funding
+196
Deposits
rate
+102
Loans
rate
-425
Deposits
volume
-49
Loans
volume
+154
Baseline
3,001
FX effect
-67
3Q14
3,068
in 3Q15 (-19bp y/y)
UniCredit Group - INTERNAL USE ONLY -
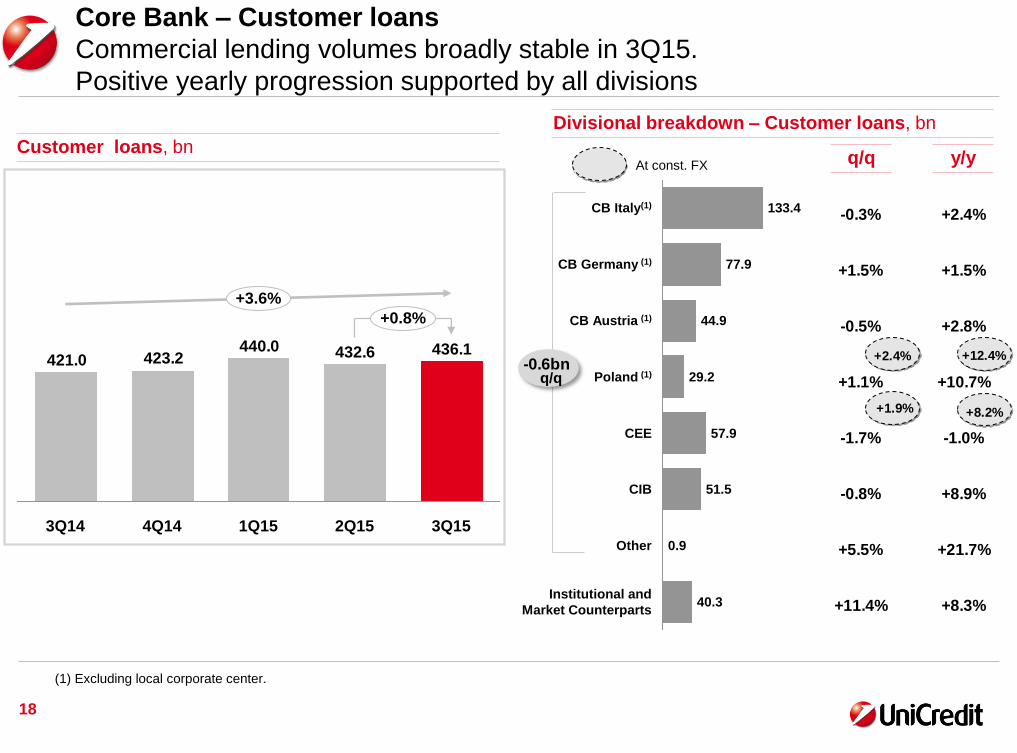
18
436.1432.6440.0423.2421.0
1Q15
+3.6%
+0.8%
2Q15 4Q14 3Q14 3Q15
Customer loans, bn
Core Bank – Customer loans
Commercial lending volumes broadly stable in 3Q15.
Positive yearly progression supported by all divisions
Divisional breakdown – Customer loans, bn
q/q y/y
40.3
Other 0.9
Institutional and
Market Counterparts
CIB 51.5
CEE 57.9
Poland (1) 29.2
CB Austria (1) 44.9
CB Germany (1) 77.9
CB Italy(1) 133.4
q/q
At const. FX
(1) Excluding local corporate center.
-0.6bn
-0.3%
+1.5%
-0.5%
+1.1%
-1.7%
-0.8%
+5.5%
+11.4%
+2.4%
+1.5%
+2.8%
+10.7%
-1.0%
+8.9%
+21.7%
+8.3%
+12.4%
+8.2%
+2.4%
+1.9%

UniCredit Group - INTERNAL USE ONLY -
19
484.4
473.6
465.0
452.6
444.7
3Q15
+8.9% +2.3%
2Q15 1Q15 4Q14 3Q14
Customer direct funding(1), bn
Core Bank – Customer direct funding
Commercial direct funding up by 6.2bn q/q. CIB and CEE & Poland are top
contributors to a sound liquidity position
Divisional breakdown – Direct funding, bn
q/q y/y
72.2
AG (Fineco)
Institutional and
Market Counterparts
15.3
CIB 40.6
CEE 57.8
Poland(2) 30.6
CB Austria(2) 52.4
CB Germany(2) 73.1
CB Italy(2) 142.3
(1) Customer direct funding: total customer deposits + commercial customer securities in issue.
(2) Excluding local corporate center.
q/q
At const. FX
+6.2bn +2.8% +7.0%
+7.6% +26.3%
-0.1%
+2.1%
+3.2%
+5.3%
+13.8%
+30.6%
+8.6%
+31.7%
-1.2%
-0.2%
+0.8%
+1.5%
+3.0%
+16.8%
-1.6%
+6.7%

Core Bank – New origination in commercial banks
MLT flows strongly up by 38% in 9M15 at 23.3bn, driven by all main customer
segments across commercial banks
CB Austria, m
CB Germany, m
CB Italy, m
New flows o/w household mortgages
7,7086,034
+27.7%
9M15 9M14
2,6271,681
+56.3%
9M15 9M14
3,255
2,205
+47.6%
9M15 9M14
637349
+82.5%
9M15 9M14
12,343
8,650
+42.7%
9M15 9M14
2,8102,527
+11.2%
9M15 9M14
o/w mid corporates
1,5271,058
+44.3%
9M15 9M14
3,6863,192
+15.5%
9M15 9M14
5,232
2,853
+83.3%
9M15 9M14
20
UniCredit Group - INTERNAL USE ONLY -
21
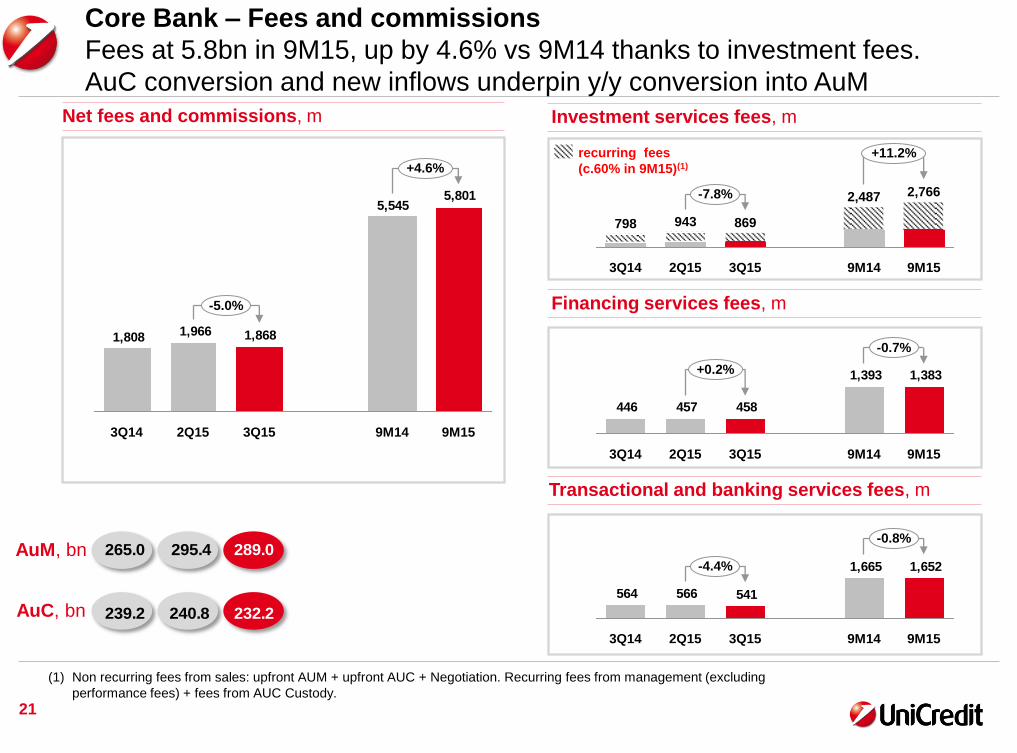
Net fees and commissions, m Investment services fees, m
Transactional and banking services fees, m
Financing services fees, m
1,3831,393
458457446
-0.7%
+0.2%
9M15 9M14 3Q15 2Q15 3Q14
1,6521,665
541566564
-0.8%
-4.4%
9M15 9M14 3Q15 2Q15 3Q14
Core Bank – Fees and commissions
Fees at 5.8bn in 9M15, up by 4.6% vs 9M14 thanks to investment fees.
AuC conversion and new inflows underpin y/y conversion into AuM
5,545
1,8681,9661,808
5,801
+4.6%
-5.0%
9M15 9M14 3Q15 2Q15 3Q14
+11.2%
-7.8%
9M15
2,766
9M14
2,487
3Q15
869
2Q15
943
3Q14
798
recurring fees
(c.60% in 9M15)(1)
(1) Non recurring fees from sales: upfront AUM + upfront AUC + Negotiation. Recurring fees from management (excluding
performance fees) + fees from AUC Custody.
AuM, bn
AuC, bn
289.0 295.4 265.0
232.2 240.8 239.2

UniCredit Group - INTERNAL USE ONLY -
22
Core Bank – Total costs
Costs down in 3Q15 by c.2% supported by lower staff expenses
Costs, m Staff expenses, m
Depreciation & amortization, m
Other administrative expenses(1), m
Cost income
FTE, k
Branches
9,7899,599
3,2393,3013,181
-1.9%
+2.0%
9M15 9M14 3Q15 2Q15 3Q14
3Q15 9M14
2,093 2,034
6,183 -2.8%
9M15 3Q14
6,007
+2.9%
2Q15
1,993
979982968
2Q15
-0.3%
-0.4%
3Q14 3Q15 9M15
2,939
9M14
2,928
678653
227226219
+3.7%
+0.4%
9M15 9M14 3Q15 2Q15 3Q14
58% 58% 61% 58% 59%
7,665 7,121 7,055
128.0 125.8 125.2
(1) Other administrative expenses net of expenses recovery and indirect costs.

UniCredit Group - INTERNAL USE ONLY -
23
Core Bank – Loan loss provisions
LLP down by c.11% in 3Q15, embedding negative impact of CHF conversion
in Croatia and positive impact of write-backs in CBK Germany and CIB
Loan loss provisions, m Divisional breakdown – 3Q15 cost of risk, bp
q/q y/y
Cost of risk
1,732
1,378
615
256205
+25.7%
-10.9%
9M15 9M14 3Q15
548
2Q15 3Q14
24bp 56bp 50bp 43bp 53bp 67
-32
246
41
7
-11
73
AG (Fineco)
AM n.m.
CB Austria
CB Germany
CB Italy
CIB
CEE
Poland
-4bp +33bp
-32bp -2bp
+32bp -8bp
-3bp -8bp
+97bp +139bp
-72bp -0bp
+12bp +28bp
n.m. n.m.
CEE at 106bp
embedding
c.200m CHF
conversion in
Croatia
Croatia CHF conversion
32bp net of CHF
conversion in
Croatia

UniCredit Group - INTERNAL USE ONLY -
24
Group
Agenda
Non Core
Core Bank
Annex
Financials
Group

Non Core – Main trends
Gross loans further down by over 4bn q/q supported by back to Core, NPL
disposals and proactive deleveraging, leading to a RWA decrease of 2.4bn q/q
9.7
6.5
6.5
9.8
8.8
8.2
-4.1bn
-13.7bn
Special
Network
Former
UCCMB
Leasing
SPV
Sep-15
65.8
51.1
Jun-15
69.9
53.8
0.7
Sep-14
79.5
59.3
0.7
Gross customer loans, bn
25
Gross loans at 65.8bn, further down by 4.1bn q/q, supported
by Back to Core, NPL disposals and proactive deleveraging
After a strict assessment of risk profile, 2.3bn performing
loans transferred back to the Core Bank
RWA down by 2.4bn (-6.8%) q/q as a result of proactive
deleveraging
Net loss in 9M15 at 1.1bn, in line with 9M14 with lower costs
and LLP offsetting lower revenues
€, m 3Q14 2Q15 3Q15 Q/Q Y/Y 9M14 9M15 9M/9M
Revenues 85 42 21 -49.0% -74.8% 304 128 -58.0%
Costs 148 134 143 +6.8% -3.0% 476 446 -6.2%
LLP 498 298 457 +53.6% -8.2% 1,217 1,166 -4.2%
Net Loss 377 296 393 +32.7% +4.3% 1,027 1,056 +2.8%
Net loans 49,382 41,356 37,987 -8.1% -23.1% 49,382 37,987 -23.1%
RWA 33,351 35,119 32,739 -6.8% -1.8% 33,351 32,739 -1.8%
FTE 1,923 1,707 1,672 -2.1% -13.1% 1,923 1,672 -13.1%

60,5%
26
Non Core – Asset quality
Impaired loans confirmed downward trend driven by continued reduction in
other impaired loans Bad loans stabilizing with NPL sales balancing internal
migrations
Gross impaired loans(1), bn
26.7 27.1 26.8 26.0 25.5
-7.4% -2.4%
Sep-15
52.7
Jun-15
53.7
Dec-14
56.9
Sep-14
56.5
Dec-13
57.9
Coverage ratio
Gross bad loans (sofferenze)(1), bn
Other gross impaired loans(1), bn
12.6 13.9 14.0 14.4 14.7
-2.7% +3.2%
Sep-15
36.6
Jun-15
36.4
Dec-14
37.6
Sep-14
36.4
Dec-13
35.3
Coverage ratio
14.1 13.3 12.7 11.6 10.8
-11.0%
-16.6%
Sep-15
16.1
Jun-15
17.3
Dec-14
19.3
Sep-14
20.1
Dec-13
22.6
Coverage ratio
Net bad loans
Net other impaired
Net impaired
(1) The perimeter of impaired exposures hereby shown as per instructions of BankIT Circular 272 is substantially equivalent to the
perimeter of Non Performing Exposures (NPE) EBA.
53.8% 52.9% 51.6%
64.4% 62.7% 60.5%
37.3% 34.0% 32.8%
52.0% 51.6%
62.0% 59.9%
33.9% 32.7%

Concluding remarks
Group net profit over 1.5bn in 9M15 with a RoTE of 5%. Excluding non recurring items
(Croatia and Ukraine) and systemic charges net profit at 1.9bn with RoTE of 6.2%
Core Bank net operating profit stable in 3Q15 net of LLP related to CHF conversion in
Croatia, lower costs and lower LLP offsetting revenues impacted by seasonality
CET1 ratio fully loaded further increased to 10.53%, up to 10.78% including Pioneer JV.
CET1 ratio transitional at 10.93% including the Pioneer JV
Group cost of risk at 81bp in 9M15 and coverage ratio on impaired loans at a sound 51%
Asset quality further improving with gross impaired loans reduction supported by NPL
sales and net outflows from impaired loans
Non Core de-risking progressing well with gross loans further down by over 4bn q/q and
RWA reduced by 2.4bn q/q
27

28
Group
Agenda
Non Core
Core Bank
Annex Non operating items
Italian perimeter
Russia
AQ Group & Italy
Financials
Group
UniCredit Group - INTERNAL USE ONLY -
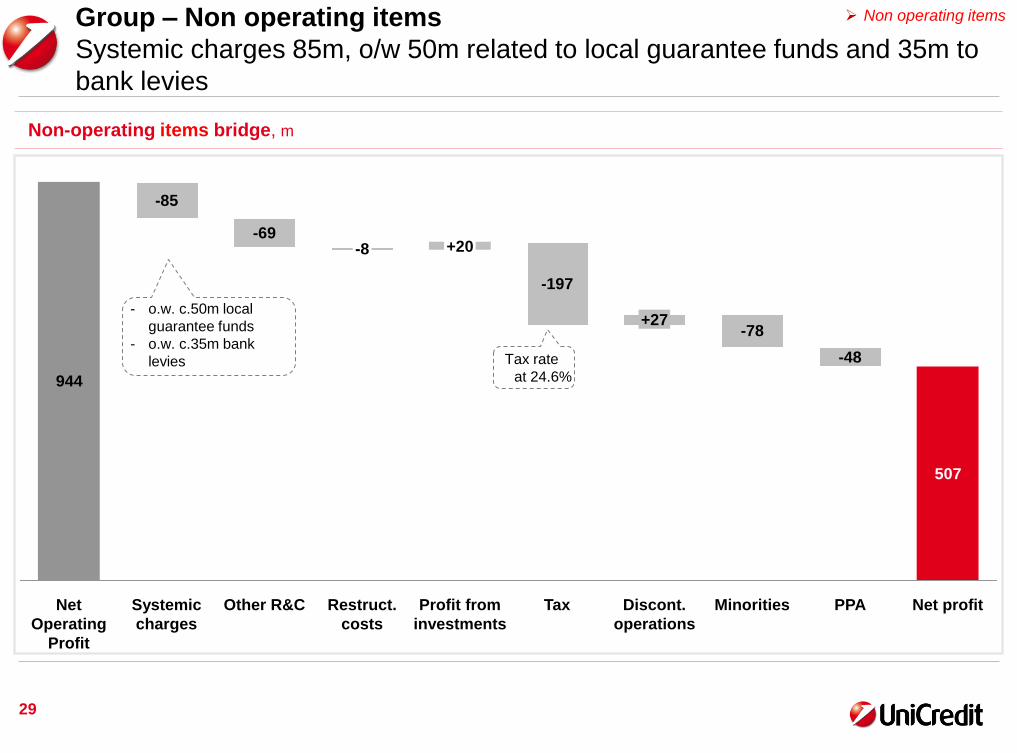
507
944
Net profit PPA
-48
Minorities
-78
Discont.
operations
+27
Tax
-197
Profit from
investments
+20
Restruct.
costs
-8
Other R&C
-69
Systemic
charges
-85
Net
Operating
Profit
29
Non-operating items bridge, m
Group – Non operating items
Systemic charges 85m, o/w 50m related to local guarantee funds and 35m to
bank levies
- o.w. c.50m local
guarantee funds
- o.w. c.35m bank
levies Tax rate
at 24.6%
Non operating items

UniCredit Group - INTERNAL USE ONLY -
30
Group – Asset quality
All regions confirm a sound asset quality position
Italy Core Germany
Austria Poland CEE
Coverage
Coverage
Net ratio
Gross
impaired
loans (bn)
Gross
impaired
loans (bn)
7.8 8.2 8.7 9.0 9.4
Sep-15 Jun-15 Mar-15 Dec-14 Sep-14
30
6.0 6.3 6.2 5.7 5.5
Sep-15 Jun-15 Mar-15 Dec-14 Sep-14
4.4 4.6 4.8 4.6 4.6
Sep-15 Jun-15 Mar-15 Dec-14 Sep-14
1.9 1.9 2.1 2.0 2.0
Sep-15 Jun-15 Mar-15 Dec-14 Sep-14
6.9 6.5 6.6 6.5 6.5
Sep-15 Jun-15 Mar-15 Dec-14 Sep-14
Italy Core
Net ratio
Italy Non Core
56.5 56.9 54.9 53.7 52.7
Sep-15 Jun-15 Mar-15 Dec-14 Sep-14
AQ Italy & Group
42.2% 40.9% 41.3% 43.2% 43.7%
2.6% 2.8% 2.8% 2.9% 3.0%
52.0% 52.9% 51.8% 51.6% 51.6%
54.9% 56.5% 62.0% 62.9% 67.1%
42.7% 38.6% 41.5% 43.8% 42.1%
3.2% 3.5% 3.2% 2.9% 2.9%
62.4% 61.7% 60.4% 60.9% 61.0%
2.6% 2.7% 2.9% 2.8% 2.7%
62.9% 64.2% 63.7% 64.5% 65.7%
2.7% 2.6% 2.6% 2.5% 2.4%
49.5% 51.0% 50.5% 52.2% 52.1%
6.6% 6.2% 6.0% 5.8% 5.9%

UniCredit Group - INTERNAL USE ONLY -
31
31.6 31.6 31.130.5 30.8
-0.3% -2.3%
Sep-15
62.1
Jun-15
62.8
Dec-14
65.1
Sep-14
64.3
Dec-13
64.5
Italy – Asset quality breakdown
Gross impaired continued reduction due to NPL sales.
Coverage ratio above 50% despite NPL sales in the quarter.
Net impaired
Coverage ratio
Net impaired loan ratio
14.4 14.6 15.213.0 15.7
39.7
Jun-15
39.0
Dec-14
39.5
Sep-14
38.2
Dec-13
36.5
+4.5% +0.4%
Sep-15
17.5 17.2 17.0 15.9 15.1
-12.3%
Sep-15
-6.6%
22.4
Jun-15
23.8
Dec-14
25.6
Sep-14
26.1
Dec-13
27.9
Coverage ratio
Net bad loans
Coverage ratio
Net other impaired
Gross impaired loans, bn(1)
Other gross impaired loans, bn
Gross bad loans (Sofferenze), bn
(1) The perimeter of impaired exposures hereby shown as per instructions of BankIT Circular 272 is substantially equivalent to the
perimeter of Non Performing Exposures (NPE) EBA.
(2) Yearly variations for 1Q13, 2Q13 and 3Q13 are based on historical data.
AQ Italy & Group
64.5% 62.2% 63.0%
37.3% 34.1% 33.6%
12.7% 14.1% 14.3% 14.3% 14.2%
52.7% 50.8% 51.4% 50.4% 50.4%
60.9% 60.4%
33.1% 32.8%
Gross impaired loans – Yearly variations(2)
-3.3% -0.1%
2.6%
2Q15 4Q14 2Q14
5.5%
1.0%
1Q14 1Q15
2.5% 0.2%
4Q13 3Q14 3Q15
9.5%
3Q13
10.8%
2Q13
12.2%
1Q13
14.4%

UniCredit Group - INTERNAL USE ONLY -
32
Group
Agenda
Non Core
Core Bank
Annex
Financials
Group

UniCredit Group - INTERNAL USE ONLY -
33
Group – P&L and volumes
Net profit over 1.5bn in 9M15 with 5.0% RoTE. Solid commercial performance
partly overshadowed by LLP for CHF conversion in Croatia
Euro (m) 1Q14 2Q14 3Q14 4Q14 1Q15 2Q15 3Q15 ∆ % vs. ∆ % vs. 9M14 9M15 ∆ % vs.
2Q15 3Q14 9M14
Total Revenues 5,588 5,798 5,561 5,604 5,749 5,735 5,332 -7.0% ▼ -4.1% ▼ 16,948 16,816 -0.8% ▼
Operating Costs -3,410 -3,336 -3,328 -3,432 -3,418 -3,435 -3,383 -1.5% ▼ +1.6% ▲ -10,075 -10,236 +1.6% ▲
Gross Operating Profit 2,178 2,462 2,233 2,172 2,331 2,299 1,949 -15.2% ▼ -12.7% ▼ 6,873 6,580 -4.3% ▼
LLP -838 -1,003 -754 -1,697 -980 -913 -1,005 +10.1% ▲ +33.4% ▲ -2,595 -2,898 +11.7% ▲
Profit Before Taxes 1,275 1,171 1,285 360 1,080 1,043 802 -23.0% ▼ -37.6% ▼ 3,731 2,925 -21.6% ▼
Net Profit 712 403 722 170 512 522 507 -3.0% ▼ -29.8% ▼ 1,838 1,541 -16.1% ▼
Cost / Income Ratio, % 61% 58% 60% 61% 59% 60% 63% +3.5pp ▲ +4pp ▲ 59% 61% +1.4pp ▲
Cost of Risk, bp 69 84 64 144 82 76 85 +8bp ▲ +21bp ▲ 72bp 81bp +9bp ▲
RoTE 7.1% 4.0% 6.9% 1.6% 4.8% 4.9% 4.8% -0.1pp ▼ -2.0pp ▼ 6.3% 5.0% -1.3pp ▼
Customer Loans 483,782 474,798 470,356 470,569 482,658 473,930 474,123 +0.0% +0.8% 470,356 474,123 +0.8%
Direct Funding 560,163 561,005 554,908 560,688 573,787 580,859 587,695 +1.2% +5.9% 554,908 587,695 +5.9%
Total RWA 418,871 398,702 401,238 409,223 420,637 405,897 400,480 -1.3% -0.2% 401,238 400,480 -0.2%
FTE (#) 131,333 130,577 129,958 129,021 128,263 127,475 126,849 -0.5% -2.4% 129,958 126,849 -2.4%
(1) Cost of risk in 3Q14 adjusted for +0.5bn non recurring items at 109bp; Cost of risk in 3Q15 adjusted for non recurring items at 68 in
3Q15.
(1) (1)
UniCredit Group - INTERNAL USE ONLY -
34
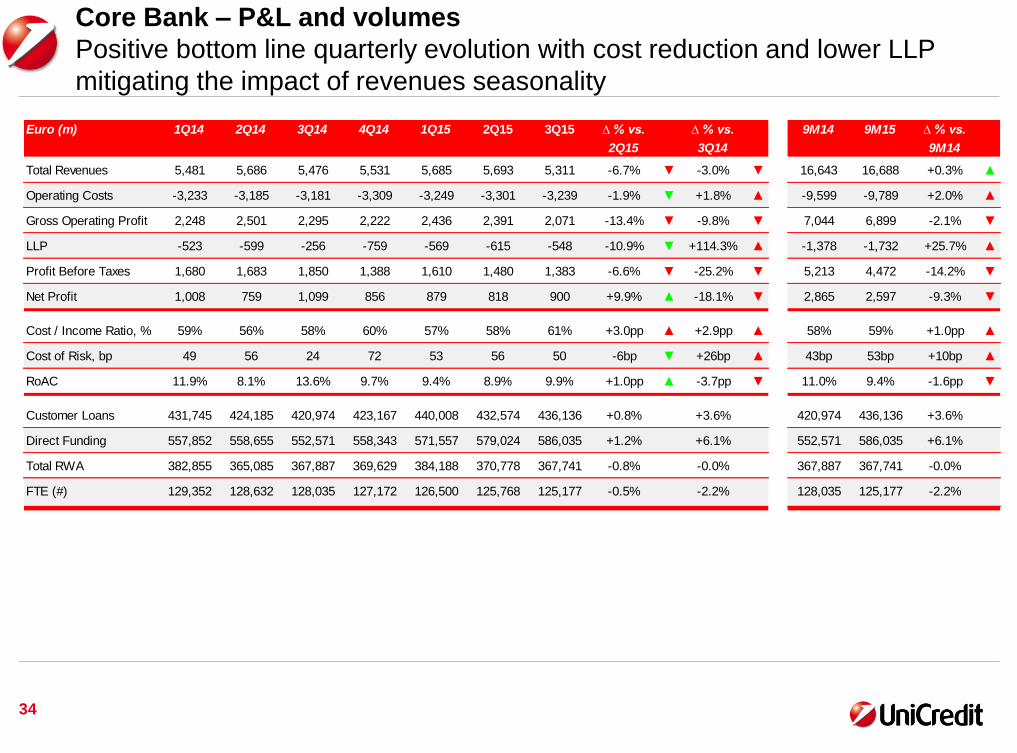
Core Bank – P&L and volumes
Positive bottom line quarterly evolution with cost reduction and lower LLP
mitigating the impact of revenues seasonality
Euro (m) 1Q14 2Q14 3Q14 4Q14 1Q15 2Q15 3Q15 ∆ % vs. ∆ % vs. 9M14 9M15 ∆ % vs.
2Q15 3Q14 9M14
Total Revenues 5,481 5,686 5,476 5,531 5,685 5,693 5,311 -6.7% ▼ -3.0% ▼ 16,643 16,688 +0.3% ▲
Operating Costs -3,233 -3,185 -3,181 -3,309 -3,249 -3,301 -3,239 -1.9% ▼ +1.8% ▲ -9,599 -9,789 +2.0% ▲
Gross Operating Profit 2,248 2,501 2,295 2,222 2,436 2,391 2,071 -13.4% ▼ -9.8% ▼ 7,044 6,899 -2.1% ▼
LLP -523 -599 -256 -759 -569 -615 -548 -10.9% ▼ +114.3% ▲ -1,378 -1,732 +25.7% ▲
Profit Before Taxes 1,680 1,683 1,850 1,388 1,610 1,480 1,383 -6.6% ▼ -25.2% ▼ 5,213 4,472 -14.2% ▼
Net Profit 1,008 759 1,099 856 879 818 900 +9.9% ▲ -18.1% ▼ 2,865 2,597 -9.3% ▼
Cost / Income Ratio, % 59% 56% 58% 60% 57% 58% 61% +3.0pp ▲ +2.9pp ▲ 58% 59% +1.0pp ▲
Cost of Risk, bp 49 56 24 72 53 56 50 -6bp ▼ +26bp ▲ 43bp 53bp +10bp ▲
RoAC 11.9% 8.1% 13.6% 9.7% 9.4% 8.9% 9.9% +1.0pp ▲ -3.7pp ▼ 11.0% 9.4% -1.6pp ▼
Customer Loans 431,745 424,185 420,974 423,167 440,008 432,574 436,136 +0.8% +3.6% 420,974 436,136 +3.6%
Direct Funding 557,852 558,655 552,571 558,343 571,557 579,024 586,035 +1.2% +6.1% 552,571 586,035 +6.1%
Total RWA 382,855 365,085 367,887 369,629 384,188 370,778 367,741 -0.8% -0.0% 367,887 367,741 -0.0%
FTE (#) 129,352 128,632 128,035 127,172 126,500 125,768 125,177 -0.5% -2.2% 128,035 125,177 -2.2%

UniCredit Group - INTERNAL USE ONLY -
35
Commercial Bank Italy – P&L and volumes
Positive operating progression in 9M15 with earnings generation offsetting
costs increase
Euro (m) 1Q14 2Q14 3Q14 4Q14 1Q15 2Q15 3Q15 ∆ % vs. ∆ % vs. 9M14 9M15 ∆ % vs.
2Q15 3Q14 9M14
Total Revenues 2,131 2,164 2,046 2,060 2,198 2,218 2,085 -6.0% ▼ +1.9% ▲ 6,341 6,501 +2.5% ▲
Operating Costs -1,053 -1,005 -988 -1,053 -1,056 -1,062 -1,042 -1.8% ▼ +5.5% ▲ -3,046 -3,160 +3.7% ▲
Gross Operating Profit 1,078 1,158 1,058 1,007 1,142 1,156 1,043 -9.8% ▼ -1.4% ▼ 3,294 3,341 +1.4% ▲
LLP -280 -294 -132 -329 -280 -260 -245 -5.8% ▼ +86.5% ▲ -706 -785 +11.3% ▲
Profit Before Taxes 782 814 889 659 845 839 775 -7.7% ▼ -12.8% ▼ 2,485 2,459 -1.0% ▼
Net Profit 495 537 572 417 563 565 515 -8.8% ▼ -9.9% ▼ 1,604 1,643 +2.5% ▲
Cost / Income Ratio, % 49% 46% 48% 51% 48% 48% 50% +2.1pp ▲ +1.7pp ▲ 48% 49% +0.6pp ▲
Cost of Risk, bp 85 89 40 101 85 78 73 -4bp ▼ +33bp ▲ 72bp 78bp +7bp ▲
RoAC 26.7% 29.6% 29.4% 21.6% 27.0% 27.7% 25.1% -2.6pp ▼ -4.4pp ▼ 28.6% 26.6% -2.0pp ▼
Customer Loans 132,303 131,471 130,571 130,190 134,106 134,063 133,643 -0.3% +2.4% 130,571 133,643 +2.4%
Direct Funding 147,921 144,132 142,516 145,347 144,209 144,222 142,403 -1.3% -0.1% 142,516 142,403 -0.1%
Total RWA 79,125 78,340 80,126 80,603 83,206 80,464 80,097 -0.5% -0.0% 80,126 80,097 -0.0%
FTE (#) 37,484 37,527 37,209 37,212 37,081 37,197 36,985 -0.6% -0.6% 37,209 36,985 -0.6%

UniCredit Group - INTERNAL USE ONLY -
36
Commercial Bank Germany – P&L and volumes
Increased operating performance in 9M15 due to both higher revenues and
lower costs. Very low CoR in 9M15 with 3Q15 LLP benefitting from write-backs
Euro (m) 1Q14 2Q14 3Q14 4Q14 1Q15 2Q15 3Q15 ∆ % vs. ∆ % vs. 9M14 9M15 ∆ % vs.
2Q15 3Q14 9M14
Total Revenues 691 677 638 636 646 707 679 -4.1% ▼ +6.4% ▲ 2,006 2,032 +1.3% ▲
Operating Costs -512 -498 -522 -527 -519 -507 -501 -1.1% ▼ -4.1% ▼ -1,532 -1,527 -0.4% ▼
Gross Operating Profit 179 179 116 109 127 201 177 -11.6% ▼ +53.5% ▲ 474 505 +6.6% ▲
LLP -15 -5 18 -25 -24 -41 22 n.m. ▼ +26.1% ▼ -2 -43 n.m. ▲
Profit Before Taxes 156 169 108 235 66 128 159 +24.3% ▲ +47.6% ▲ 432 352 -18.5% ▼
Net Profit 104 113 73 214 43 86 106 +22.7% ▲ +44.3% ▲ 289 234 -19.0% ▼
Cost / Income Ratio, % 74% 74% 82% 83% 80% 72% 74% +2.2pp ▲ -8.0pp ▼ 76% 75% -1.2pp ▼
Cost of Risk, bp 8 2 -9 13 12 21 -11 -32bp ▼ -2bp ▼ 0bp 7bp +7bp ▲
RoAC 9.7% 11.1% 5.9% 25.5% 2.9% 9.5% 12.6% +3.1pp ▲ +6.6pp ▲ 8.9% 8.2% -0.7pp ▼
Customer Loans 78,537 78,783 78,765 78,416 79,256 79,563 80,143 +0.7% +1.7% 78,765 80,143 +1.7%
Direct Funding 105,562 104,709 102,044 102,236 101,088 101,978 101,504 -0.5% -0.5% 102,044 101,504 -0.5%
Total RWA 35,388 32,879 33,780 33,608 33,334 31,121 31,782 +2.1% -5.9% 33,780 31,782 -5.9%
FTE (#) 13,586 13,505 13,580 13,422 13,051 12,326 12,164 -1.3% -10.4% 13,580 12,164 -10.4%

UniCredit Group - INTERNAL USE ONLY -
37
Commercial Bank Austria – P&L and volumes
Resilient operating profitability in 3Q15 with lower costs and LLP offsetting
lower revenues. Cost of risk confirmed the high quality of the loan book.
Starting from 2Q15 some activities that Bank Austria carries out in its capacity of sub-holding for CEE countries, have been shifted
from Commercial Bank Austria to CEE division. These activities mainly refer to Corporate Center. Previous quarters have been
restated accordingly.
Euro (m) 1Q14 2Q14 3Q14 4Q14 1Q15 2Q15 3Q15 ∆ % vs. ∆ % vs. 9M14 9M15 ∆ % vs.
2Q15 3Q14 9M14
Total Revenues 410 471 403 426 370 406 377 -7.2% ▼ -6.3% ▼ 1,284 1,154 -10.2% ▼
Operating Costs -345 -343 -328 -356 -339 -338 -329 -2.8% ▼ +0.1% ▲ -1,017 -1,006 -1.0% ▼
Gross Operating Profit 65 128 74 70 31 68 48 -28.8% ▼ -34.7% ▼ 268 147 -45.0% ▼
LLP -48 -4 -17 -41 -27 31 -8 n.m. ▲ -52.2% ▼ -69 -5 -93.3% ▼
Profit Before Taxes 36 80 39 -21 -37 64 -29 n.m. ▼ n.m. ▼ 155 -2 n.m. ▼
Net Profit 34 84 79 -45 -20 83 -18 n.m. ▼ n.m. ▼ 197 44 -77.7% ▼
Cost / Income Ratio, % 84% 73% 82% 84% 92% 83% 87% +3.9pp ▲ +5.6pp ▲ 79% 87% +8.1pp ▲
Cost of Risk, bp 40 4 14 35 23 -25 7 +32bp ▲ -8bp ▼ 19bp 1bp -18bp ▼
RoAC 5.8% 14.4% 13.0% n.m. n.m. 14.4% n.m. n.m. ▲ n.m. ▲ 11.1% 2.7% -8.5pp ▼
Customer Loans 47,877 48,083 47,442 47,379 48,744 48,785 48,677 -0.2% +2.6% 47,442 48,677 +2.6%
Direct Funding 60,225 59,920 62,877 63,442 65,119 63,847 64,494 +1.0% +2.6% 62,877 64,494 +2.6%
Total RWA 27,169 23,838 24,080 24,047 28,273 24,582 22,301 -9.3% -7.4% 24,080 22,301 -7.4%
FTE (#) 6,803 6,634 6,751 6,701 6,614 6,565 6,530 -0.5% -3.3% 6,751 6,530 -3.3%

UniCredit Group - INTERNAL USE ONLY -
38
Poland – P&L and volumes
Lower costs in 3Q15 mitigating subdued revenues and confirming a sound
RoAC. Cost of risk confirmed a downward trend
N.B. Variations at constant FX.
Euro (m) 1Q14 2Q14 3Q14 4Q14 1Q15 2Q15 3Q15 ∆ % vs. ∆ % vs. 9M14 9M15 ∆ % vs.
2Q15 3Q14 9M14
Total Revenues 431 448 450 440 433 435 405 -4.6% ▼ -9.6% ▼ 1,329 1,273 -4.6% ▼
Operating Costs -200 -203 -202 -194 -190 -201 -194 -1.3% ▼ -3.5% ▼ -606 -586 -3.7% ▼
Gross Operating Profit 230 245 248 246 242 234 211 -7.3% ▼ -14.6% ▼ 723 687 -5.4% ▼
LLP -35 -34 -32 -32 -33 -32 -30 -3.8% ▼ -7.5% ▼ -102 -94 -7.8% ▼
Profit Before Taxes 186 202 208 207 185 187 179 -1.8% ▼ -13.5% ▼ 596 551 -8.0% ▼
Net Profit 76 83 84 84 75 76 72 -2.8% ▼ -13.9% ▼ 243 223 -8.5% ▼
Cost / Income Ratio, % 47% 45% 45% 44% 44% 46% 48% -0.0pp ▼ +0.0pp ▲ 46% 46% +0.0pp ▲
Cost of Risk, bp 56 53 49 48 47 44 41 -15bp ▼ -64bp ▼ 52bp 44bp -8bp ▼
RoAC 23.6% 26.3% 27.1% 26.6% 22.4% 22.9% 22.0% -0.0pp ▼ -0.3pp ▼ 25.7% 22.4% -0.0pp ▼
Customer Loans 25,540 26,384 26,449 26,896 28,798 28,815 29,128 +2.4% +11.9% 26,449 29,128 +11.9%
Direct Funding 27,439 28,362 29,685 30,178 30,670 30,784 31,096 +2.3% +6.4% 29,685 31,096 +6.4%
Total RWA 25,311 24,760 25,234 25,894 26,862 25,618 25,848 +2.2% +4.1% 25,234 25,848 +4.1%
FTE (#) 18,194 18,134 17,983 18,160 18,043 17,916 17,806 -0.6% -1.0% 17,983 17,806 -1.0%

UniCredit Group - INTERNAL USE ONLY -
39
CEE – P&L and volumes
Net profit higher q/q with lower costs mitigating the seasonality of revenues
and higher LLP (mostly related to CHF conversion in Croatia)
N.B. Variations at constant FX.
Starting from 2Q15 some activities that Bank Austria carries out in its capacity of sub-holding for CEE countries, have been shifted
from Commercial Bank Austria to CEE division. These activities mainly refer to Corporate Center. Previous quarters have been
restated accordingly.
Euro (m) 1Q14 2Q14 3Q14 4Q14 1Q15 2Q15 3Q15 ∆ % vs. ∆ % vs. 9M14 9M15 ∆ % vs.
2Q15 3Q14 9M14
Total Revenues 888 974 1,064 908 909 982 918 -3.5% ▼ -6.3% ▼ 2,927 2,809 +3.1% ▲
Operating Costs -369 -369 -379 -393 -350 -372 -359 -0.8% ▼ +0.9% ▲ -1,117 -1,081 +2.5% ▲
Gross Operating Profit 519 605 686 515 558 610 559 -5.0% ▼ -10.3% ▼ 1,810 1,727 +3.5% ▲
LLP -148 -168 -156 -204 -174 -220 -359 +57.2% ▲ n.m. ▲ -472 -753 +73.0% ▲
Profit Before Taxes 311 375 414 277 323 357 172 -44.6% ▼ -50.1% ▼ 1,100 853 -14.9% ▼
Net Profit 247 283 294 112 178 152 158 +45.7% ▲ -38.5% ▼ 824 488 -48.1% ▼
Cost / Income Ratio, % 42% 38% 36% 43% 39% 38% 39% +0.0pp ▼ +3.5pp ▲ 38% 38% -0.2pp ▼
Cost of Risk, bp 105 118 107 142 120 149 246 +bp ▼ +139bp ▲ 110bp 172bp +62bp ▲
RoAC 13.5% 15.4% 16.7% 5.5% 8.5% 7.2% 7.5% +0.7pp ▲ -9.2pp ▼ 15.2% 7.7% -7.5pp ▼
Customer Loans 55,886 57,846 58,449 57,073 59,142 58,870 57,851 +1.9% -1.0% 58,449 57,851 +8.2%
Direct Funding 48,011 49,071 50,768 52,213 54,533 56,073 57,770 +7.6% +13.8% 50,768 57,770 +26.3%
Total RWA 83,492 81,786 84,635 89,278 93,340 93,461 92,651 +5.6% +9.5% 84,635 92,651 +24.2%
FTE (#) 30,623 30,097 29,576 29,040 28,918 28,834 28,668 -0.6% -3.1% 29,576 28,668 -3.1%
UniCredit Group - INTERNAL USE ONLY -
40
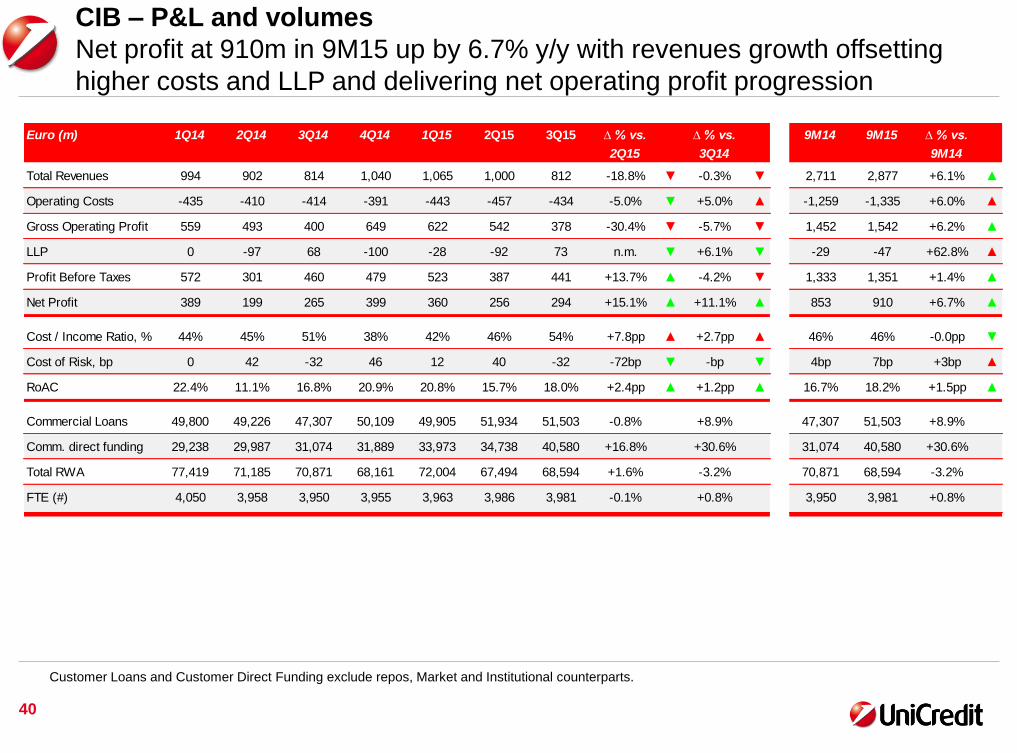
Customer Loans and Customer Direct Funding exclude repos, Market and Institutional counterparts.
CIB – P&L and volumes
Net profit at 910m in 9M15 up by 6.7% y/y with revenues growth offsetting
higher costs and LLP and delivering net operating profit progression
Euro (m) 1Q14 2Q14 3Q14 4Q14 1Q15 2Q15 3Q15 ∆ % vs. ∆ % vs. 9M14 9M15 ∆ % vs.
2Q15 3Q14 9M14
Total Revenues 994 902 814 1,040 1,065 1,000 812 -18.8% ▼ -0.3% ▼ 2,711 2,877 +6.1% ▲
Operating Costs -435 -410 -414 -391 -443 -457 -434 -5.0% ▼ +5.0% ▲ -1,259 -1,335 +6.0% ▲
Gross Operating Profit 559 493 400 649 622 542 378 -30.4% ▼ -5.7% ▼ 1,452 1,542 +6.2% ▲
LLP 0 -97 68 -100 -28 -92 73 n.m. ▼ +6.1% ▼ -29 -47 +62.8% ▲
Profit Before Taxes 572 301 460 479 523 387 441 +13.7% ▲ -4.2% ▼ 1,333 1,351 +1.4% ▲
Net Profit 389 199 265 399 360 256 294 +15.1% ▲ +11.1% ▲ 853 910 +6.7% ▲
Cost / Income Ratio, % 44% 45% 51% 38% 42% 46% 54% +7.8pp ▲ +2.7pp ▲ 46% 46% -0.0pp ▼
Cost of Risk, bp 0 42 -32 46 12 40 -32 -72bp ▼ -bp ▼ 4bp 7bp +3bp ▲
RoAC 22.4% 11.1% 16.8% 20.9% 20.8% 15.7% 18.0% +2.4pp ▲ +1.2pp ▲ 16.7% 18.2% +1.5pp ▲
Commercial Loans 49,800 49,226 47,307 50,109 49,905 51,934 51,503 -0.8% +8.9% 47,307 51,503 +8.9%
Comm. direct funding 29,238 29,987 31,074 31,889 33,973 34,738 40,580 +16.8% +30.6% 31,074 40,580 +30.6%
Total RWA 77,419 71,185 70,871 68,161 72,004 67,494 68,594 +1.6% -3.2% 70,871 68,594 -3.2%
FTE (#) 4,050 3,958 3,950 3,955 3,963 3,986 3,981 -0.1% +0.8% 3,950 3,981 +0.8%
UniCredit Group - INTERNAL USE ONLY -
41
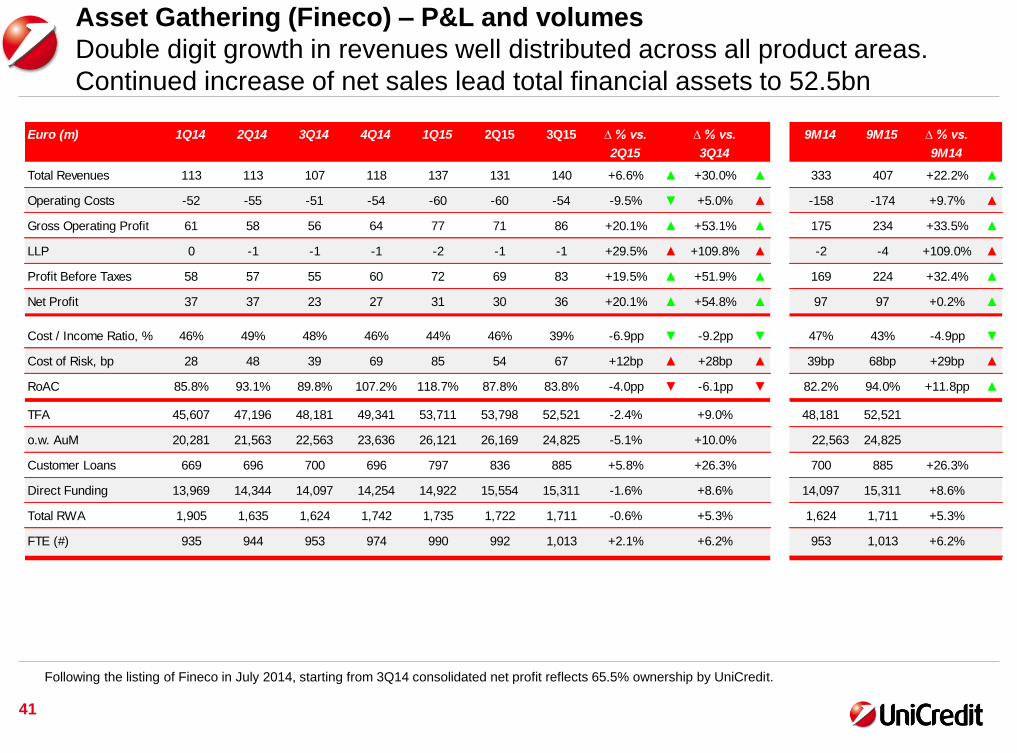
Asset Gathering (Fineco) – P&L and volumes
Double digit growth in revenues well distributed across all product areas.
Continued increase of net sales lead total financial assets to 52.5bn
Following the listing of Fineco in July 2014, starting from 3Q14 consolidated net profit reflects 65.5% ownership by UniCredit.
Euro (m) 1Q14 2Q14 3Q14 4Q14 1Q15 2Q15 3Q15 ∆ % vs. ∆ % vs. 9M14 9M15 ∆ % vs.
2Q15 3Q14 9M14
Total Revenues 113 113 107 118 137 131 140 +6.6% ▲ +30.0% ▲ 333 407 +22.2% ▲
Operating Costs -52 -55 -51 -54 -60 -60 -54 -9.5% ▼ +5.0% ▲ -158 -174 +9.7% ▲
Gross Operating Profit 61 58 56 64 77 71 86 +20.1% ▲ +53.1% ▲ 175 234 +33.5% ▲
LLP 0 -1 -1 -1 -2 -1 -1 +29.5% ▲ +109.8% ▲ -2 -4 +109.0% ▲
Profit Before Taxes 58 57 55 60 72 69 83 +19.5% ▲ +51.9% ▲ 169 224 +32.4% ▲
Net Profit 37 37 23 27 31 30 36 +20.1% ▲ +54.8% ▲ 97 97 +0.2% ▲
Cost / Income Ratio, % 46% 49% 48% 46% 44% 46% 39% -6.9pp ▼ -9.2pp ▼ 47% 43% -4.9pp ▼
Cost of Risk, bp 28 48 39 69 85 54 67 +12bp ▲ +28bp ▲ 39bp 68bp +29bp ▲
RoAC 85.8% 93.1% 89.8% 107.2% 118.7% 87.8% 83.8% -4.0pp ▼ -6.1pp ▼ 82.2% 94.0% +11.8pp ▲
TFA 45,607 47,196 48,181 49,341 53,711 53,798 52,521 -2.4% +9.0% 48,181 52,521
o.w. AuM 20,281 21,563 22,563 23,636 26,121 26,169 24,825 -5.1% +10.0% 22,563 24,825
Customer Loans 669 696 700 696 797 836 885 +5.8% +26.3% 700 885 +26.3%
Direct Funding 13,969 14,344 14,097 14,254 14,922 15,554 15,311 -1.6% +8.6% 14,097 15,311 +8.6%
Total RWA 1,905 1,635 1,624 1,742 1,735 1,722 1,711 -0.6% +5.3% 1,624 1,711 +5.3%
FTE (#) 935 944 953 974 990 992 1,013 +2.1% +6.2% 953 1,013 +6.2%
UniCredit Group - INTERNAL USE ONLY -
42
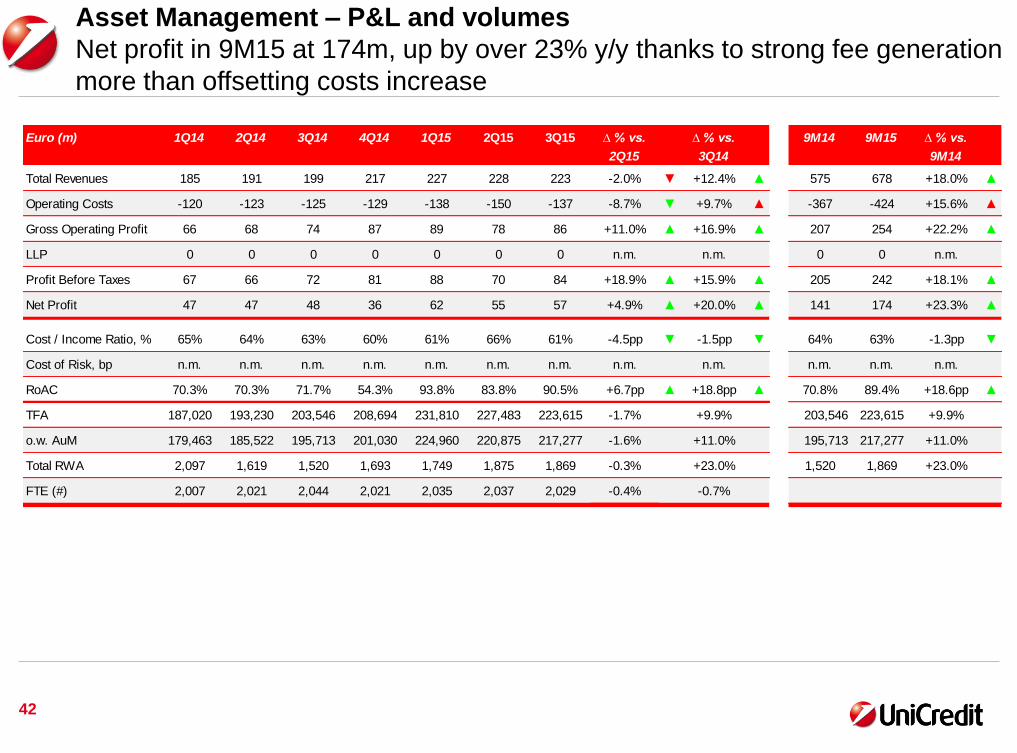
Asset Management – P&L and volumes
Net profit in 9M15 at 174m, up by over 23% y/y thanks to strong fee generation
more than offsetting costs increase
Euro (m) 1Q14 2Q14 3Q14 4Q14 1Q15 2Q15 3Q15 ∆ % vs. ∆ % vs. 9M14 9M15 ∆ % vs.
2Q15 3Q14 9M14
Total Revenues 185 191 199 217 227 228 223 -2.0% ▼ +12.4% ▲ 575 678 +18.0% ▲
Operating Costs -120 -123 -125 -129 -138 -150 -137 -8.7% ▼ +9.7% ▲ -367 -424 +15.6% ▲
Gross Operating Profit 66 68 74 87 89 78 86 +11.0% ▲ +16.9% ▲ 207 254 +22.2% ▲
LLP 0 0 0 0 0 0 0 n.m. n.m. 0 0 n.m.
Profit Before Taxes 67 66 72 81 88 70 84 +18.9% ▲ +15.9% ▲ 205 242 +18.1% ▲
Net Profit 47 47 48 36 62 55 57 +4.9% ▲ +20.0% ▲ 141 174 +23.3% ▲
Cost / Income Ratio, % 65% 64% 63% 60% 61% 66% 61% -4.5pp ▼ -1.5pp ▼ 64% 63% -1.3pp ▼
Cost of Risk, bp n.m. n.m. n.m. n.m. n.m. n.m. n.m. n.m. n.m. n.m. n.m. n.m.
RoAC 70.3% 70.3% 71.7% 54.3% 93.8% 83.8% 90.5% +6.7pp ▲ +18.8pp ▲ 70.8% 89.4% +18.6pp ▲
TFA 187,020 193,230 203,546 208,694 231,810 227,483 223,615 -1.7% +9.9% 203,546 223,615 +9.9%
o.w. AuM 179,463 185,522 195,713 201,030 224,960 220,875 217,277 -1.6% +11.0% 195,713 217,277 +11.0%
Total RWA 2,097 1,619 1,520 1,693 1,749 1,875 1,869 -0.3% +23.0% 1,520 1,869 +23.0%
FTE (#) 2,007 2,021 2,044 2,021 2,035 2,037 2,029 -0.4% -0.7%

UniCredit Group - INTERNAL USE ONLY -
43
Non Core – P&L and volumes
Net loss in 9M15 at 1.1bn, broadly in line with 9M14 with lower costs and LLP
offsetting lower revenues
Euro (m) 1Q14 2Q14 3Q14 4Q14 1Q15 2Q15 3Q15 ∆ % vs. ∆ % vs. 9M14 9M15 ∆ % vs.
2Q15 3Q14 9M14
Total Revenues 107 112 85 73 64 42 21 -49.0% ▼ -74.8% ▼ 304 128 -58.0% ▼
Operating Costs -177 -151 -148 -123 -169 -134 -143 +6.8% ▲ -3.0% ▼ -476 -446 -6.2% ▼
Gross Operating Profit -70 -39 -63 -50 -105 -92 -122 +32.4% ▼ +94.5% ▼ -171 -319 +85.8% ▼
LLP -315 -404 -498 -938 -411 -298 -457 +53.6% ▲ -8.2% ▼ -1,217 -1,166 -4.2% ▼
Profit Before Taxes -405 -513 -564 -1,028 -529 -438 -580 +32.6% ▼ +2.8% ▼ -1,482 -1,547 +4.4% ▼
Net Profit -295 -355 -377 -686 -367 -296 -393 +32.7% ▼ +4.3% ▼ -1,027 -1,056 +2.8% ▼
Cost / Income Ratio, % 165% 135% 174% 168% 263% 319% 668% +350pp ▲ +495pp ▲ 156% 349% +193pp ▲
Cost of Risk, bp 239 315 398 775 365 284 461 +177bp ▲ +63bp ▲ 316bp 368bp +52bp ▲
RoAC n.m. n.m. n.m. n.m. n.m. n.m. n.m. n.m. n.m. n.m. n.m. n.m.
Customer Loans 52,037 50,613 49,382 47,402 42,650 41,356 37,987 -8.1% -23.1% 49,382 37,987 -23.1%
Direct Funding 2,311 2,350 2,337 2,344 2,230 1,835 1,660 -9.5% -29.0% 2,337 1,660 -29.0%
Total RWA 36,016 33,617 33,351 39,594 36,448 35,119 32,739 -6.8% -1.8% 33,351 32,739 -1.8%
FTE (#) 1,981 1,945 1,923 1,849 1,763 1,707 1,672 -2.1% -13.1% 1,923 1,672 -13.1%