Embed Size (px)
Citation preview
Understanding Urban Human Activity and MobilityPatterns Using Large-scale Location-based Data from
Online Social Media
Samiul HasanResearch Assistant
School of Civil Engineering,Purdue University
West Lafayette, IN 47907, [email protected]
Xianyuan ZhanResearch Assistant
School of Civil Engineering,Purdue University
West Lafayette, IN 47907, [email protected]
Satish V. UkkusuriAssociate Professor
School of Civil Engineering,Purdue University
West Lafayette, IN 47907, [email protected]
ABSTRACTLocation-based check-in services enable individuals to sharetheir activity-related choices providing a new source of hu-man activity data for researchers. In this paper urban hu-man mobility and activity patterns are analyzed using location-based data collected from social media applications (e.g.Foursquare and Twitter). We first characterize aggregateactivity patterns by finding the distributions of different ac-tivity categories over a city geography and thus determinethe purpose-specific activity distribution maps. We thencharacterize individual activity patterns by finding the tim-ing distribution of visiting different places depending on ac-tivity category. We also explore the frequency of visitinga place with respect to the rank of the place in individu-al’s visitation records and show interesting match with theresults from other studies based on mobile phone data.
KeywordsSocial media, large-scale, location-based data, human mo-bility pattern, urban activity pattern
1. INTRODUCTIONThe introduction of location-based services in social me-
dia applications of smartphones has enabled people to sharetheir activity related choices (check-in) in their virtual socialnetworks (e.g. Facebook, Foursquare, Twitter etc.) provid-ing unprecedented amount of user-generated data on humanmovement and activity participation. This data containsdetailed geo-location information, which reflects extensiveknowledge about human movement behavior. In addition,the venue category information for each check-in is recordedfrom which user activities can be inferred. Thus location-based data offers us a new dimension of information relat-ed to human activity categories with greater details. Re-searchers are realizing the potential to harness the rich in-
Permission to make digital or hard copies of all or part of this work forpersonal or classroom use is granted without fee provided that copies are notmade or distributed for profit or commercial advantage and that copies bearthis notice and the full citation on the first page. Copyrights for componentsof this work owned by others than ACM must be honored. Abstracting withcredit is permitted. To copy otherwise, or republish, to post on servers or toredistribute to lists, requires prior specific permission and/or a fee. Requestpermissions from [email protected] ’13, August 11-14, 2013, Chicago, Illinois, USA.Copyright c⃝ 2013 ACM 978-1-4503-2331-4/13/08 ...$15.00.
formation provided by the location-based data which hasalready enabled many novel applications such as recommen-dation system for physical locations (or activity) [1, 2] orrecommending potential customers or friend [3, 4]; and de-termining popular travel routes in a city [5]. This data hasthe potential to impact many other areas including trav-el demand modeling, ubiquitous computing, epidemiology,urban planning, security and health monitoring. As such, atremendous opportunity exists to develop fundamental tool-s to analyze this very large-scale spatial and temporal da-ta that allows one to understand the social and behavioralcharacteristics of the users of location-based services.
Previous research efforts on individual activity-travel pat-terns over longer time periods were usually based on people’smovements through traditional surveys on travel journeys[6, 7, 8]. The obtained information was based on question-naires that are usually costly to implement and with intrin-sic limitations to cover large number of individuals and someproblems of reliability. These efforts, however, demonstratedthat individual mobility patterns are strongly related withland-use patterns as well as the built environment of a city,and individual daily travel patterns exhibit great regularity[9, 10, 11, 12, 13].
On the other hand, there are some recent mobility studiesthat have used distance-based measures to characterize hu-man mobility patterns using alternative datasets collectedfrom mobile phones [14], bank notes movements [15], andsubway smart-card transactions [16, 17] etc. These studieshowever limit the understanding of the interplay betweenselection of destinations for different activity purposes andmobility dynamics due to the lack of information about thepurposes behind these movements. In this context, location-based data has received increasing attention in the researchcommunity, as the rich information in the data connects eachgeo-location record with a venue category indicating the pur-pose of the activity participated. In more recent studies,Cheng et al. [18] investigated 22 million check-ins and ob-served similar mobility pattern found in previous researches[14, 15], which is a mixture of short, random movementswith occasional long jumps. Cho et al. [19] investigated therelationship between human mobility and social relationshipusing data from Gowalla and Brightkite. They found thatsocial relationships can explain 10% to 30% of all humanmovements, while periodic behavior explains 50% to 70%.However, the dimension of human activity was not consid-
ered in both of the researches. In this paper, by consideringthe temporal dimension and activity categories (i.e. purpos-es) into the analysis, we discover more realistic and detaileddescriptions of human mobility dynamics. Considering theactivity purposes in the analysis will enable us to developadvanced models for predicting mobility decisions.We consider the location-based data obtained from online
social media check-in services to characterize urban humanactivity and mobility patterns. We first investigate the char-acterization and visualization of aggregate human mobilityand activity patterns by constructing a virtual grid refer-ence of a city map into square cells of 200 by 200 meters.We discover a relationship between the popularity of a celland the probability of visiting the cell. Spatial distributionsof visiting different places are also determined for various ac-tivity purposes by counting the number of purpose-specificvisits within each cell and computing the proportion of vis-its to each cell for each activity category. This generatesactivity distribution maps showing the popular places with-in a city and the functionality of each part of the urbanarea. Check-in distributions appear differently for differen-t activity categories suggesting a strong influence of urbancontext on people’s destination choices. Using Kernel densi-ty estimation methods we construct time-dependent activitydensity maps. Using this approach, we can also visualize d-ifferent human activities in a city and thus capture the pulseof urban human activities.Next we investigate the characterization of the spatio-
temporal aspects of individual mobility patterns. We de-termine a set of statistical properties to characterize humanmobility based on check-in data from online social medi-a. First, we observe the timing of visiting different placesdepending on activity category. Second, we explore the fre-quency of visiting a place with respect to the rank of theplace in individual’s visitation records. Recently it has beensuggested that the visitation frequency of the Lth most visit-ed location is well approximated by Zipf’s law: P (L) ∼ L−η,with η ≈ 1.2 independent of N the total number of visitedlocations [14, 20].In following sections we present the description of the data
set and the findings related to individual mobility and urbanactivity patterns.
2. DATA COLLECTION
2.1 DatasetThe dataset used in this analysis is collected from a wide-
ly used social media tool called Twitter where users canpost short messages up to 140 characters. These short mes-sages are generally called status message in the social me-dia norm and specifically called “Tweets” in Twitter. Whenpermissions are given by the users, each of their tweets areattached with a corresponding geo-location. In addition toposting status messages, Twitter allows its users to post sta-tuses from third-party “check-in” services (e.g. Foursquare).When Foursquare users “check-in” to a place this status canbe posted to their Twitter pages. In this work we use alarge-scale check-in data available from [18]. The datasetcontains check-ins from Feb, 25, 2010 to January, 20, 2011.On average each user has 25 check-ins.An example of a tweet with a “check-in” looks like:
tweet(79132591248261120)={189872633, ####,79132591248261120, Fri Jun 10 10:27:34 +0000 2011,
Table 1: New York Dataset Details
Original datasetNumber of users 20606Number of check-ins 680564Study sampleNumber of users 3256Number of check-ins 504000
Table 2: Activity Category Classification
Activity Category Type of Visited LocationHome Home (private), Residential Building
(Apartment/Condo)Work Office, Coworking Space, Tech Startup,
Design StudioEating Coffee Shop, Restaurant, Pizza, Burg-
er, Caf, Diner, Steakhouse, Sandwich,Bakery, Breakfast, Bagel Shop, TacoPlace, Gourmet Shop, Tea Room, etc.
Entertainment Pub, Nightclub, Bar, Entertainment,Arcade, Theater, Club, Concert Hall,Other Nightlife, Dance Studio, OperaHouse, Casino, Event Space, etc.
Recreation Park, Gym, Playground, Dog Run,Scenic Lookout, Beach, Lake, Zoo orAquarium, Field, Tennis Court, Re-sort, Ski Area, Soccer Field, etc.
Shopping Supermarket, Store, Plaza, Pharmacy,Bookstore, Mall, Farmers Market, Bou-tique, Miscellaneous Shop, AutomotiveShop, Food & Drink Shop, etc.
40.7529422,-73.9780177, “I’m at Central Cafe & Deli(16 Vanderbilt Ave., New York) http://4sq.com/jMS87x”}
After collecting the original dataset we select subsets of allthe observations within three different cities in US, which areNew York, Chicago and Los Angeles. We create a boundaryregion for these cities and extract all the check-in observa-tions within that region. The New York dataset has largestamount of data, with 20606 users and 680564 check-in ob-servations, while Chicago dataset has 7136 users and 193825check-in observations, and Los Angeles dataset has 11298users and 314783 check-in observations. We select New Y-ork dataset as our main dataset, and perform most of ouranalysis based on the New York dataset. However to find in-dividual longitudinal mobility patterns we study only thoseusers who have more than 50 check-ins. Some basic infor-mation about the New York dataset are given in Table 1.Chicago and Los Angeles dataset are used to conduct city-level comparison of popular places for different activities,which will be introduced in section 3.1.
2.2 Identification of Activity CategoriesOne of the major advantages of using location-based so-
cial media data is the ability to identify activity purposes.Each check-in observation reports a short link to the origi-nal location-based service provider (e.g. Foursquare). Whenqueried in the location-based service provider, this link givesinformation about the category of the visited venue. Weclassify different activity categories based on the type of thevisited locations (see Table 2). About 94.5% of the check-
ins have any category information available; for rest of thecheck-ins their respective categories were not resolved.
3. AGGREGATE SPATIAL ACTIVITY PAT-TERNS
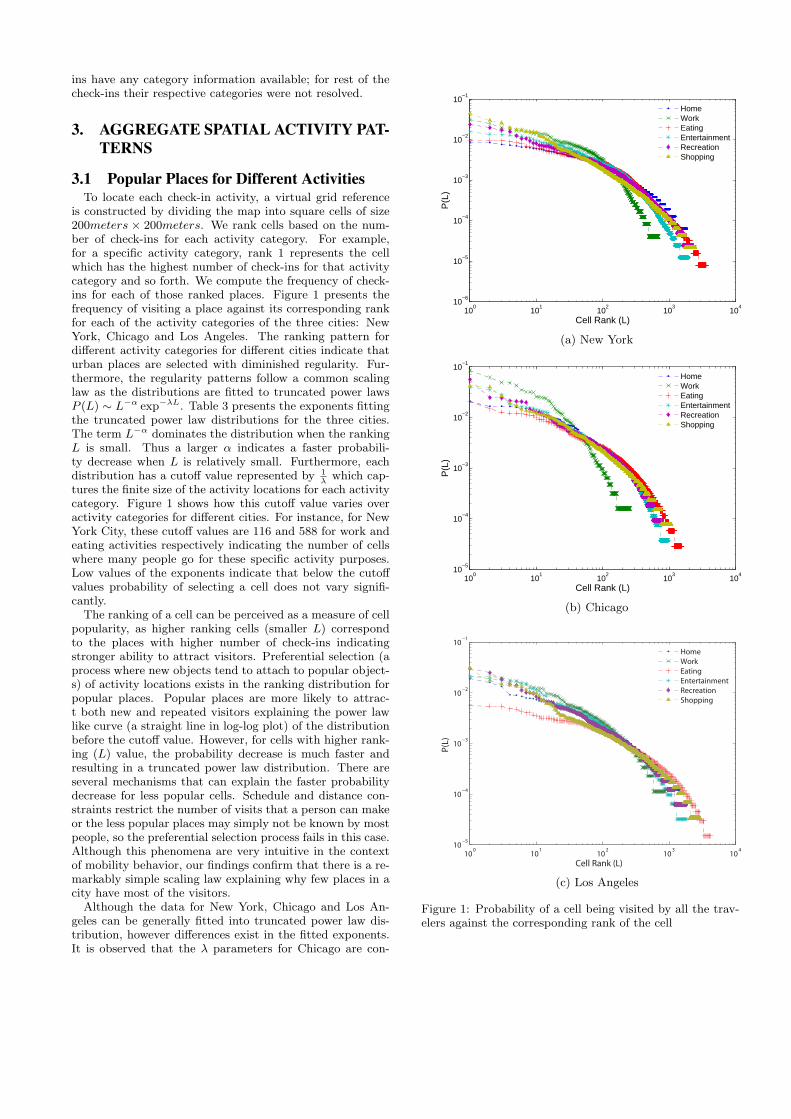
3.1 Popular Places for Different ActivitiesTo locate each check-in activity, a virtual grid reference
is constructed by dividing the map into square cells of size200meters × 200meters. We rank cells based on the num-ber of check-ins for each activity category. For example,for a specific activity category, rank 1 represents the cellwhich has the highest number of check-ins for that activitycategory and so forth. We compute the frequency of check-ins for each of those ranked places. Figure 1 presents thefrequency of visiting a place against its corresponding rankfor each of the activity categories of the three cities: NewYork, Chicago and Los Angeles. The ranking pattern fordifferent activity categories for different cities indicate thaturban places are selected with diminished regularity. Fur-thermore, the regularity patterns follow a common scalinglaw as the distributions are fitted to truncated power lawsP (L) ∼ L−α exp−λL. Table 3 presents the exponents fittingthe truncated power law distributions for the three cities.The term L−α dominates the distribution when the rankingL is small. Thus a larger α indicates a faster probabili-ty decrease when L is relatively small. Furthermore, eachdistribution has a cutoff value represented by 1
λwhich cap-
tures the finite size of the activity locations for each activitycategory. Figure 1 shows how this cutoff value varies overactivity categories for different cities. For instance, for NewYork City, these cutoff values are 116 and 588 for work andeating activities respectively indicating the number of cellswhere many people go for these specific activity purposes.Low values of the exponents indicate that below the cutoffvalues probability of selecting a cell does not vary signifi-cantly.The ranking of a cell can be perceived as a measure of cell
popularity, as higher ranking cells (smaller L) correspondto the places with higher number of check-ins indicatingstronger ability to attract visitors. Preferential selection (aprocess where new objects tend to attach to popular object-s) of activity locations exists in the ranking distribution forpopular places. Popular places are more likely to attrac-t both new and repeated visitors explaining the power lawlike curve (a straight line in log-log plot) of the distributionbefore the cutoff value. However, for cells with higher rank-ing (L) value, the probability decrease is much faster andresulting in a truncated power law distribution. There areseveral mechanisms that can explain the faster probabilitydecrease for less popular cells. Schedule and distance con-straints restrict the number of visits that a person can makeor the less popular places may simply not be known by mostpeople, so the preferential selection process fails in this case.Although this phenomena are very intuitive in the contextof mobility behavior, our findings confirm that there is a re-markably simple scaling law explaining why few places in acity have most of the visitors.Although the data for New York, Chicago and Los An-
geles can be generally fitted into truncated power law dis-tribution, however differences exist in the fitted exponents.It is observed that the λ parameters for Chicago are con-
100
101
102
103
104
10−6
10−5
10−4
10−3
10−2
10−1
Cell Rank (L)
P(L
)
HomeWorkEatingEntertainmentRecreationShopping
(a) New York
100
101
102
103
104
10−5
10−4
10−3
10−2
10−1
Cell Rank (L)
P(L
)
HomeWorkEatingEntertainmentRecreationShopping
(b) Chicago
100
101
102
103
104
10−5
10−4
10−3
10−2
10−1
Cell Rank (L)
P(L)
Home
Work
Eating
Entertainment
Recreation
Shopping
(c) Los Angeles
Figure 1: Probability of a cell being visited by all the trav-elers against the corresponding rank of the cell
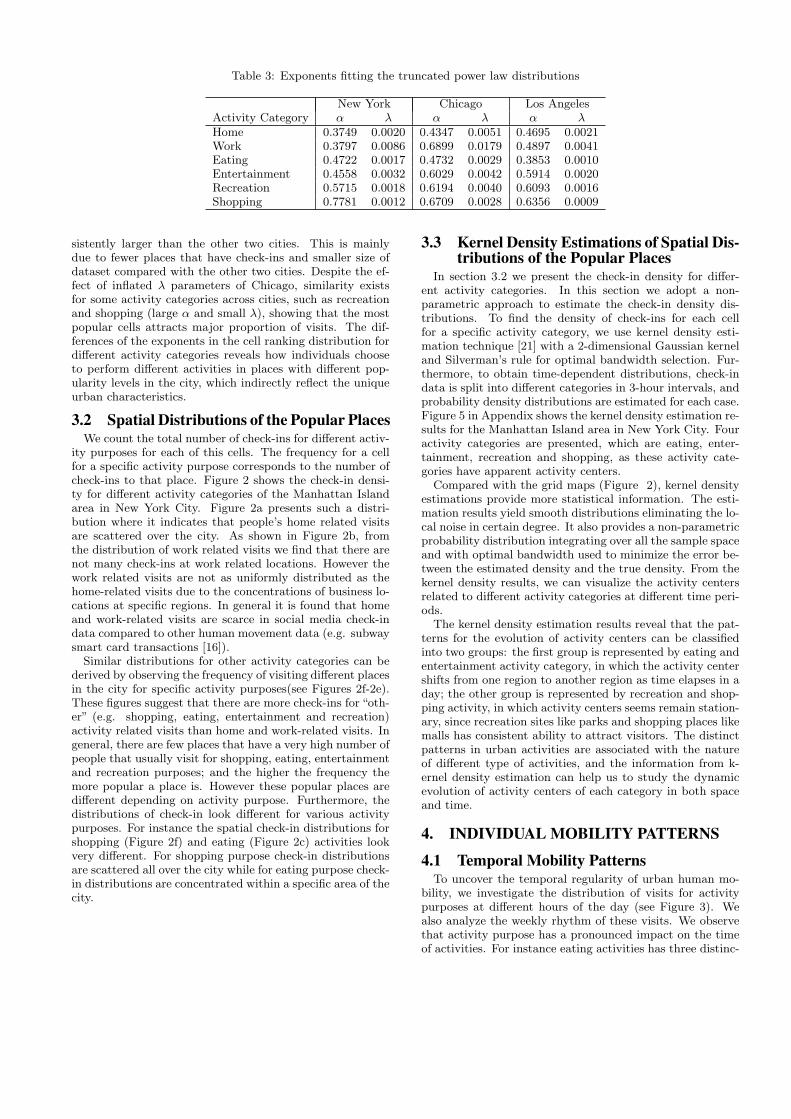
Table 3: Exponents fitting the truncated power law distributions
New York Chicago Los AngelesActivity Category α λ α λ α λHome 0.3749 0.0020 0.4347 0.0051 0.4695 0.0021Work 0.3797 0.0086 0.6899 0.0179 0.4897 0.0041Eating 0.4722 0.0017 0.4732 0.0029 0.3853 0.0010Entertainment 0.4558 0.0032 0.6029 0.0042 0.5914 0.0020Recreation 0.5715 0.0018 0.6194 0.0040 0.6093 0.0016Shopping 0.7781 0.0012 0.6709 0.0028 0.6356 0.0009
sistently larger than the other two cities. This is mainlydue to fewer places that have check-ins and smaller size ofdataset compared with the other two cities. Despite the ef-fect of inflated λ parameters of Chicago, similarity existsfor some activity categories across cities, such as recreationand shopping (large α and small λ), showing that the mostpopular cells attracts major proportion of visits. The dif-ferences of the exponents in the cell ranking distribution fordifferent activity categories reveals how individuals chooseto perform different activities in places with different pop-ularity levels in the city, which indirectly reflect the uniqueurban characteristics.
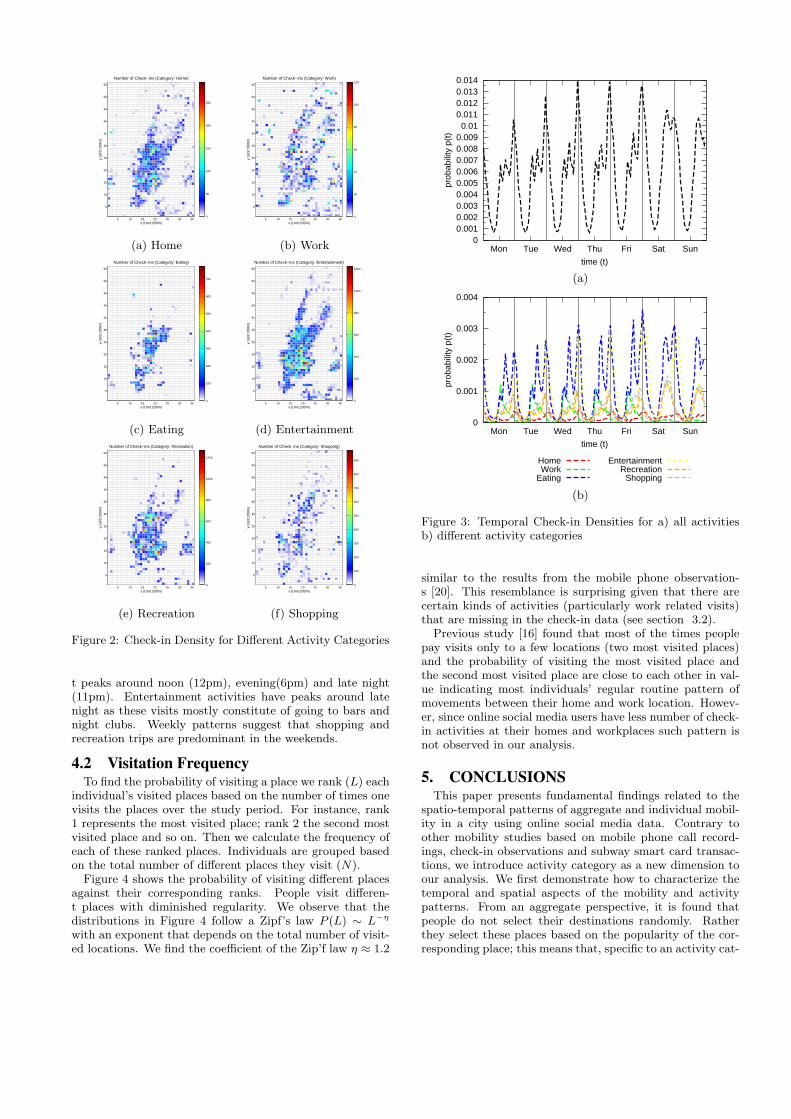
3.2 Spatial Distributions of the Popular PlacesWe count the total number of check-ins for different activ-
ity purposes for each of this cells. The frequency for a cellfor a specific activity purpose corresponds to the number ofcheck-ins to that place. Figure 2 shows the check-in densi-ty for different activity categories of the Manhattan Islandarea in New York City. Figure 2a presents such a distri-bution where it indicates that people’s home related visitsare scattered over the city. As shown in Figure 2b, fromthe distribution of work related visits we find that there arenot many check-ins at work related locations. However thework related visits are not as uniformly distributed as thehome-related visits due to the concentrations of business lo-cations at specific regions. In general it is found that homeand work-related visits are scarce in social media check-indata compared to other human movement data (e.g. subwaysmart card transactions [16]).Similar distributions for other activity categories can be
derived by observing the frequency of visiting different placesin the city for specific activity purposes(see Figures 2f-2e).These figures suggest that there are more check-ins for “oth-er” (e.g. shopping, eating, entertainment and recreation)activity related visits than home and work-related visits. Ingeneral, there are few places that have a very high number ofpeople that usually visit for shopping, eating, entertainmentand recreation purposes; and the higher the frequency themore popular a place is. However these popular places aredifferent depending on activity purpose. Furthermore, thedistributions of check-in look different for various activitypurposes. For instance the spatial check-in distributions forshopping (Figure 2f) and eating (Figure 2c) activities lookvery different. For shopping purpose check-in distributionsare scattered all over the city while for eating purpose check-in distributions are concentrated within a specific area of thecity.
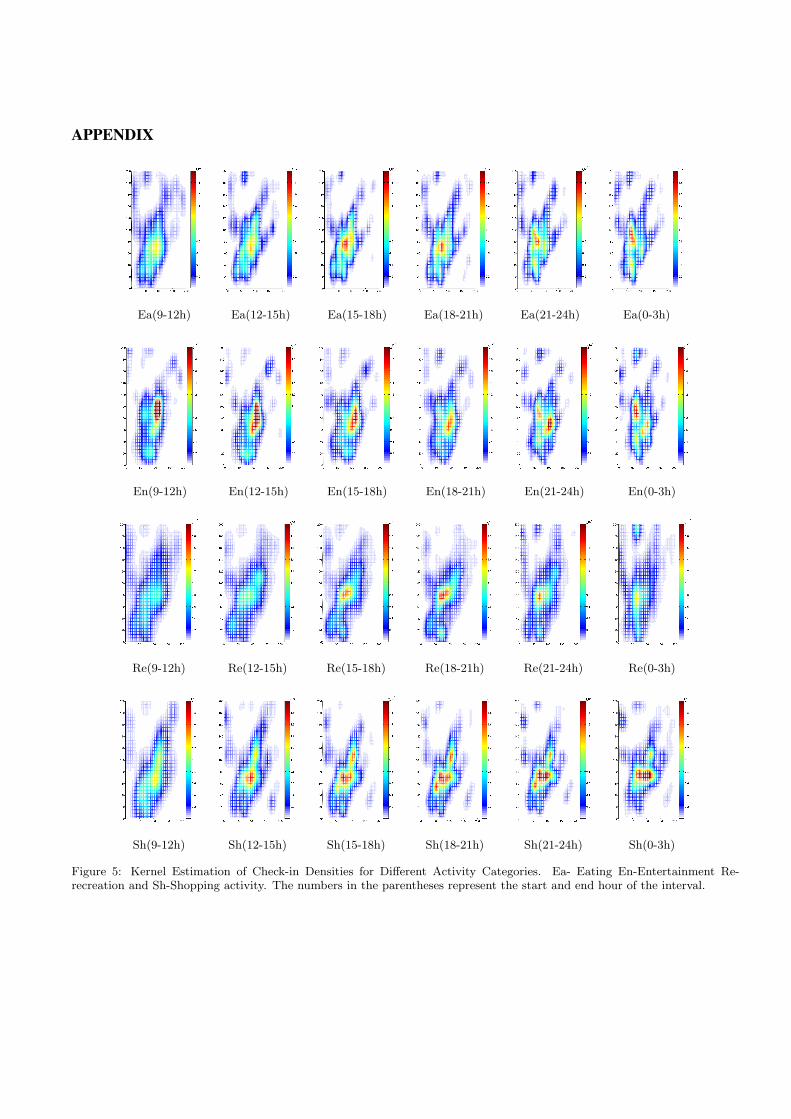
3.3 Kernel Density Estimations of Spatial Dis-tributions of the Popular Places
In section 3.2 we present the check-in density for differ-ent activity categories. In this section we adopt a non-parametric approach to estimate the check-in density dis-tributions. To find the density of check-ins for each cellfor a specific activity category, we use kernel density esti-mation technique [21] with a 2-dimensional Gaussian kerneland Silverman’s rule for optimal bandwidth selection. Fur-thermore, to obtain time-dependent distributions, check-indata is split into different categories in 3-hour intervals, andprobability density distributions are estimated for each case.Figure 5 in Appendix shows the kernel density estimation re-sults for the Manhattan Island area in New York City. Fouractivity categories are presented, which are eating, enter-tainment, recreation and shopping, as these activity cate-gories have apparent activity centers.
Compared with the grid maps (Figure 2), kernel densityestimations provide more statistical information. The esti-mation results yield smooth distributions eliminating the lo-cal noise in certain degree. It also provides a non-parametricprobability distribution integrating over all the sample spaceand with optimal bandwidth used to minimize the error be-tween the estimated density and the true density. From thekernel density results, we can visualize the activity centersrelated to different activity categories at different time peri-ods.
The kernel density estimation results reveal that the pat-terns for the evolution of activity centers can be classifiedinto two groups: the first group is represented by eating andentertainment activity category, in which the activity centershifts from one region to another region as time elapses in aday; the other group is represented by recreation and shop-ping activity, in which activity centers seems remain station-ary, since recreation sites like parks and shopping places likemalls has consistent ability to attract visitors. The distinctpatterns in urban activities are associated with the natureof different type of activities, and the information from k-ernel density estimation can help us to study the dynamicevolution of activity centers of each category in both spaceand time.
4. INDIVIDUAL MOBILITY PATTERNS
4.1 Temporal Mobility PatternsTo uncover the temporal regularity of urban human mo-
bility, we investigate the distribution of visits for activitypurposes at different hours of the day (see Figure 3). Wealso analyze the weekly rhythm of these visits. We observethat activity purpose has a pronounced impact on the timeof activities. For instance eating activities has three distinc-
5 10 15 20 25 30 35
5
10
15
20
25
30
35
40
45
50
55
Number of Check−ins (Category: Home)
x (Unit:200m)
y (U
nit:2
00m
)
0
50
100
150
200
250
(a) Home
5 10 15 20 25 30 35
5
10
15
20
25
30
35
40
45
50
55
Number of Check−ins (Category: Work)
x (Unit:200m)
y (U
nit:2
00m
)
0
20
40
60
80
100
120
(b) Work
5 10 15 20 25 30 35
5
10
15
20
25
30
35
40
45
50
55
Number of Check−ins (Category: Eating)
x (Unit:200m)
y (U
nit:2
00m
)
0
100
200
300
400
500
600
700
(c) Eating
5 10 15 20 25 30 35
5
10
15
20
25
30
35
40
45
50
55
Number of Check−ins (Category: Entertainment)
x (Unit:200m)
y (U
nit:2
00m
)
0
200
400
600
800
1000
1200
(d) Entertainment
5 10 15 20 25 30 35
5
10
15
20
25
30
35
40
45
50
55
Number of Check−ins (Category: Recreation)
x (Unit:200m)
y (U
nit:2
00m
)
0
200
400
600
800
1000
1200
(e) Recreation
5 10 15 20 25 30 35
5
10
15
20
25
30
35
40
45
50
55
Number of Check−ins (Category: Shopping)
x (Unit:200m)
y (U
nit:2
00m
)
0
100
200
300
400
500
600
700
800
900
(f) Shopping
Figure 2: Check-in Density for Different Activity Categories
t peaks around noon (12pm), evening(6pm) and late night(11pm). Entertainment activities have peaks around latenight as these visits mostly constitute of going to bars andnight clubs. Weekly patterns suggest that shopping andrecreation trips are predominant in the weekends.
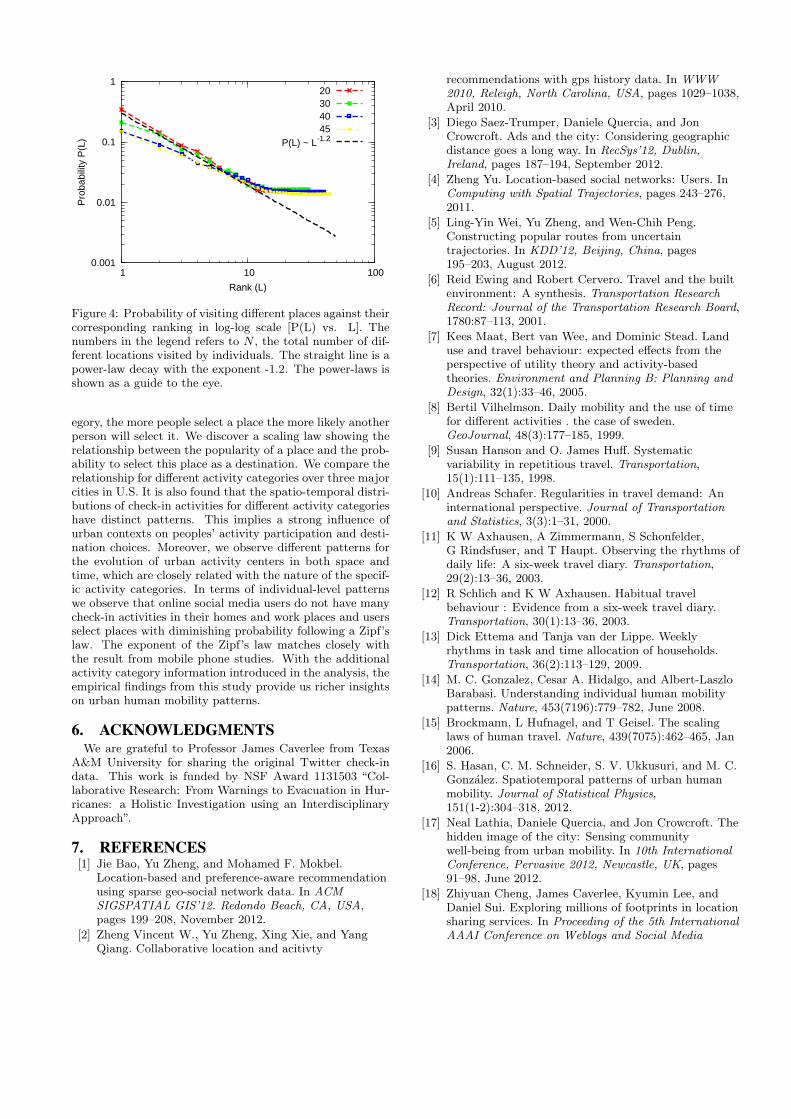
4.2 Visitation FrequencyTo find the probability of visiting a place we rank (L) each
individual’s visited places based on the number of times onevisits the places over the study period. For instance, rank1 represents the most visited place; rank 2 the second mostvisited place and so on. Then we calculate the frequency ofeach of these ranked places. Individuals are grouped basedon the total number of different places they visit (N).Figure 4 shows the probability of visiting different places
against their corresponding ranks. People visit differen-t places with diminished regularity. We observe that thedistributions in Figure 4 follow a Zipf’s law P (L) ∼ L−η
with an exponent that depends on the total number of visit-ed locations. We find the coefficient of the Zip’f law η ≈ 1.2
0 0.001 0.002 0.003 0.004 0.005 0.006 0.007 0.008 0.009 0.01
0.011 0.012 0.013 0.014
Mon Tue Wed Thu Fri Sat Sun
prob
abili
ty p
(t)
time (t)
(a)
0
0.001
0.002
0.003
0.004
Mon Tue Wed Thu Fri Sat Sun
prob
abili
ty p
(t)
time (t)
HomeWork
Eating
EntertainmentRecreation
Shopping
(b)
Figure 3: Temporal Check-in Densities for a) all activitiesb) different activity categories
similar to the results from the mobile phone observation-s [20]. This resemblance is surprising given that there arecertain kinds of activities (particularly work related visits)that are missing in the check-in data (see section 3.2).
Previous study [16] found that most of the times peoplepay visits only to a few locations (two most visited places)and the probability of visiting the most visited place andthe second most visited place are close to each other in val-ue indicating most individuals’ regular routine pattern ofmovements between their home and work location. Howev-er, since online social media users have less number of check-in activities at their homes and workplaces such pattern isnot observed in our analysis.
5. CONCLUSIONSThis paper presents fundamental findings related to the
spatio-temporal patterns of aggregate and individual mobil-ity in a city using online social media data. Contrary toother mobility studies based on mobile phone call record-ings, check-in observations and subway smart card transac-tions, we introduce activity category as a new dimension toour analysis. We first demonstrate how to characterize thetemporal and spatial aspects of the mobility and activitypatterns. From an aggregate perspective, it is found thatpeople do not select their destinations randomly. Ratherthey select these places based on the popularity of the cor-responding place; this means that, specific to an activity cat-
0.001
0.01
0.1
1
1 10 100
Pro
babi
lity
P(L
)
Rank (L)
20304045
P(L) ~ L-1.2
Figure 4: Probability of visiting different places against theircorresponding ranking in log-log scale [P(L) vs. L]. Thenumbers in the legend refers to N , the total number of dif-ferent locations visited by individuals. The straight line is apower-law decay with the exponent -1.2. The power-laws isshown as a guide to the eye.
egory, the more people select a place the more likely anotherperson will select it. We discover a scaling law showing therelationship between the popularity of a place and the prob-ability to select this place as a destination. We compare therelationship for different activity categories over three majorcities in U.S. It is also found that the spatio-temporal distri-butions of check-in activities for different activity categorieshave distinct patterns. This implies a strong influence ofurban contexts on peoples’ activity participation and desti-nation choices. Moreover, we observe different patterns forthe evolution of urban activity centers in both space andtime, which are closely related with the nature of the specif-ic activity categories. In terms of individual-level patternswe observe that online social media users do not have manycheck-in activities in their homes and work places and usersselect places with diminishing probability following a Zipf’slaw. The exponent of the Zipf’s law matches closely withthe result from mobile phone studies. With the additionalactivity category information introduced in the analysis, theempirical findings from this study provide us richer insightson urban human mobility patterns.
6. ACKNOWLEDGMENTSWe are grateful to Professor James Caverlee from Texas
A&M University for sharing the original Twitter check-indata. This work is funded by NSF Award 1131503 “Col-laborative Research: From Warnings to Evacuation in Hur-ricanes: a Holistic Investigation using an InterdisciplinaryApproach”.
7. REFERENCES[1] Jie Bao, Yu Zheng, and Mohamed F. Mokbel.
Location-based and preference-aware recommendationusing sparse geo-social network data. In ACMSIGSPATIAL GIS’12. Redondo Beach, CA, USA,pages 199–208, November 2012.
[2] Zheng Vincent W., Yu Zheng, Xing Xie, and YangQiang. Collaborative location and acitivty
recommendations with gps history data. In WWW2010, Releigh, North Carolina, USA, pages 1029–1038,April 2010.
[3] Diego Saez-Trumper, Daniele Quercia, and JonCrowcroft. Ads and the city: Considering geographicdistance goes a long way. In RecSys’12, Dublin,Ireland, pages 187–194, September 2012.
[4] Zheng Yu. Location-based social networks: Users. InComputing with Spatial Trajectories, pages 243–276,2011.
[5] Ling-Yin Wei, Yu Zheng, and Wen-Chih Peng.Constructing popular routes from uncertaintrajectories. In KDD’12, Beijing, China, pages195–203, August 2012.
[6] Reid Ewing and Robert Cervero. Travel and the builtenvironment: A synthesis. Transportation ResearchRecord: Journal of the Transportation Research Board,1780:87–113, 2001.
[7] Kees Maat, Bert van Wee, and Dominic Stead. Landuse and travel behaviour: expected effects from theperspective of utility theory and activity-basedtheories. Environment and Planning B: Planning andDesign, 32(1):33–46, 2005.
[8] Bertil Vilhelmson. Daily mobility and the use of timefor different activities . the case of sweden.GeoJournal, 48(3):177–185, 1999.
[9] Susan Hanson and O. James Huff. Systematicvariability in repetitious travel. Transportation,15(1):111–135, 1998.
[10] Andreas Schafer. Regularities in travel demand: Aninternational perspective. Journal of Transportationand Statistics, 3(3):1–31, 2000.
[11] K W Axhausen, A Zimmermann, S Schonfelder,G Rindsfuser, and T Haupt. Observing the rhythms ofdaily life: A six-week travel diary. Transportation,29(2):13–36, 2003.
[12] R Schlich and K W Axhausen. Habitual travelbehaviour : Evidence from a six-week travel diary.Transportation, 30(1):13–36, 2003.
[13] Dick Ettema and Tanja van der Lippe. Weeklyrhythms in task and time allocation of households.Transportation, 36(2):113–129, 2009.
[14] M. C. Gonzalez, Cesar A. Hidalgo, and Albert-LaszloBarabasi. Understanding individual human mobilitypatterns. Nature, 453(7196):779–782, June 2008.
[15] Brockmann, L Hufnagel, and T Geisel. The scalinglaws of human travel. Nature, 439(7075):462–465, Jan2006.
[16] S. Hasan, C. M. Schneider, S. V. Ukkusuri, and M. C.Gonzalez. Spatiotemporal patterns of urban humanmobility. Journal of Statistical Physics,151(1-2):304–318, 2012.
[17] Neal Lathia, Daniele Quercia, and Jon Crowcroft. Thehidden image of the city: Sensing communitywell-being from urban mobility. In 10th InternationalConference, Pervasive 2012, Newcastle, UK, pages91–98, June 2012.
[18] Zhiyuan Cheng, James Caverlee, Kyumin Lee, andDaniel Sui. Exploring millions of footprints in locationsharing services. In Proceeding of the 5th InternationalAAAI Conference on Weblogs and Social Media

(ICWSM), July 2011.
[19] Eunjoon Cho, Seth A. Myers, and Jure Leskovec.Friendship and mobility: User movement inlocation-based social networks. In KDD’11, SanDiego, California, USA, pages 243–276, August 2011.
[20] Chaoming Song, Tal Koren, Pu Wang, andAlbert-Laszlo Barabasi. Modelling the scalingproperties of human mobility. Nature Physics,6(10):818–823, September 2010.
[21] Alex Ihler. Kernel density estimation toolbox forMATLAB. http://ssg.mit.edu/˜ihler/code/, 2005.
APPENDIX
Ea(9-12h) Ea(12-15h) Ea(15-18h) Ea(18-21h) Ea(21-24h) Ea(0-3h)
En(9-12h) En(12-15h) En(15-18h) En(18-21h) En(21-24h) En(0-3h)
Re(9-12h) Re(12-15h) Re(15-18h) Re(18-21h) Re(21-24h) Re(0-3h)
Sh(9-12h) Sh(12-15h) Sh(15-18h) Sh(18-21h) Sh(21-24h) Sh(0-3h)
Figure 5: Kernel Estimation of Check-in Densities for Different Activity Categories. Ea- Eating En-Entertainment Re-recreation and Sh-Shopping activity. The numbers in the parentheses represent the start and end hour of the interval.