Embed Size (px)
Citation preview
The New Jersey Sea Grant Consortium (NJSGC) is an affiliation of colleges, universities and other groups dedicated to advancing knowledge and stewardship of New Jersey’s marine and coastal environment. NJSGC meets its mission through its innovative research, education and outreach programs. For more information about NJSGC, visit njseagrant.org.
1
The Education Program at the New Jersey Sea Grant Consortium 22 Magruder Road, Fort Hancock, NJ 07732 (732) 872-1300 www.njseagrant.org
UNDERSTANDING STORM SURGE
OVERVIEW In this climate education module, students will gain an understanding of
the term “storm surge” by exploring the meteorological principles that create storms and generate storm surges. Many basics of weather are discussed, including air pressure, air circulation, and the influence of the Coriolis Effect on weather.
TABLE OF Background……………………………………………………….1-4
CONTENTS Activity 1- Oceans of Pressure………………………………….5-10
Activity 2- Windy Balloon………………………………….......11-13 Activity 3- Density Driven Currents…………………………...14-18 Activity 4- Coriolis Effect………………………………………19-22 Activity 5- Pressure Driven Storms and Surge………………23-24 Activity 6- Surge of the Storm…………………………………25-32 How Meteorologists Measure and Predict Storm Surge……33-35 Why Should You Care about Understanding Storm Surge?......36 NOAA’s Top Ten Tips for Being Ready for a Storm Surge……..37 References and Acknowledgements……………………………..38
OBJECTIVES Following completion of this module, students will be able to:
Define storm surge and the factors that influence it Learn how temperature affects air density and the formation of high
and low pressure systems in the atmosphere Explore the effect of gravity on air in the atmosphere Discover the role of Earth’s rotation on global and localized wind
patterns Examine the effects that air pressure has on storm surge levels Determine how storm surge affects coastal communities Explore the impact of shoreline shape and beach slope on storm
surge
GRADE LEVEL 5 – 12
NGSS PE’S MS- ESS2-2, MS-ESS 2-4, MS-ESS 2-5, MS-ESS 2-6, MS- ESS 3-2, HS-
ESS2-5, HS-ESS3-5.
The New Jersey Sea Grant Consortium (NJSGC) is an affiliation of colleges, universities and other groups dedicated to advancing knowledge and stewardship of New Jersey’s marine and coastal environment. NJSGC meets its mission through its innovative research, education and outreach programs. For more information about NJSGC, visit njseagrant.org.
2
BACKGROUND Storm surge is the abnormal rise of water generated during a storm over
and above the expected tides. The rise is caused when an atmospheric
low pressure system combines with strong swirling winds in a hurricane
or Nor’easter. The resulting surge causes flooding, often severe, along
coastal areas. People frequently consider wind to be the most dangerous
part of a storm; however, flooding and the fast flow of water that
characterizes storm surge often result in more damage and can be far
more devastating than any other part of a storm.
Since storm surge is directly related to air movement, we must first
consider how air in the atmosphere moves to understand how water
levels rise during a storm and lead to a storm surge. Air, like water, is a
fluid medium, constantly rising and falling as it warms and cools. When
air molecules cool, they lose heat energy and move closer together,
becoming denser and heavier. This is the reason cold air sinks. In
contrast, warm air molecules are energized and move away from each
other. This makes the air less dense and causes it to rise.
As the sun warms the surface of the Earth, such as at the Equator, warm
air rises and exerts less atmospheric weight and force onto the area to
form a low pressure system. When an area of the Earth receives less of
the sun’s energy, such as near the Earth’s poles, the surface cools and
the air above it becomes more dense. The dense air falls toward the
Earth, and exerts force down onto the area to form a high pressure
system. Air pressure is a driver of weather. When high and low pressure
systems interact, wind is created by the gradients (the differences in
temperature and pressure). Areas of high air pressure always move
toward areas of low air pressure because air pressure always strives
toward equilibrium. Atmospheric pressure systems are dynamic,
depending on how much the sun warms different areas of Earth’s surface.
Low pressure systems can cause severe storms. The warmed air results
in rapid water evaporation and rapid rising of water vapor. As water vapor
reaches the cool upper atmosphere, it condenses to form clouds and
precipitation. When this occurs, an empty space is created near Earth’s
surface. Higher pressure air that is denser moves down to take over that
space. This movement of air from high pressure to low creates wind.
The New Jersey Sea Grant Consortium (NJSGC) is an affiliation of colleges, universities and other groups dedicated to advancing knowledge and stewardship of New Jersey’s marine and coastal environment. NJSGC meets its mission through its innovative research, education and outreach programs. For more information about NJSGC, visit njseagrant.org.
3
When low pressure is in place over the ocean, less weight (and thus, less
force) is exerted downward, causing water levels to rise. A barometer is a
meteorological tool used to measure how much atmospheric pressure is
exerted down onto Earth’s surface in a particular area. It reports
measurements in millibars (mb). For every barometric pressure drop of 1
mb, sea levels will rise by 1 cm. Strong storms and hurricanes can have a
barometric pressure drop of 30 mb, causing sea levels to rise 30 cm.
Warm ocean water is like fuel for a storm since it warms the air above it
quickly. The higher the water temperature, the faster it will warm the air
above it and cause the air to rise. This rising warm air creates a void
close to the ocean surface that is quickly filled by cooler atmospheric air;
as a result, winds grow stronger. As water vapor condenses and
precipitates (generally in the form of rain) during a storm, it releases heat
energy or latent heat. This latent heat warms the air even more, causing
additional air to expand and rise. The result is air movement up and away
from the center of the storm, which causes the storm to expand in size.
As wind blows over the ocean for extended periods of time, it transfers
some of its energy into the water, which results in waves. Waves will
increase in size and intensity the longer the winds blow (duration), the
faster they blow (speed), and the length of the area they travel (fetch).
During a storm all of these factors combine to make strong, large waves.
As these waves move into shallow water and push up onto the land, they
do so quickly and furiously. As a result, the waves cannot retreat back
into the ocean fast enough, so they grow even larger in size and pile up
along the shoreline. This pile-up is known as wave setup. Wave setup
raises mean water level and can cause flooding on the land.
Air pressure changes and wind are not the only reasons for air to move
horizontally and/or vertically in the atmosphere. Since Earth also rotates
on its axis, there is also planetary air movement. This is known as the
Coriolis effect. The Coriolis effect is defined as the deflection of air in the
atmosphere due to the rotation of the Earth. In the Northern Hemisphere,
the rotation deflects air currents to the right (northeast). In the Southern
Hemisphere, the rotation deflects air currents to the left (southwest).
During strong storms or hurricanes, very low pressure in the center of the
storm causes the higher-pressure air that surrounds the storm to try to
move in and fill the space created by rising warm air. Air is deflected to
the right as the storm spins counter-clockwise north of the Equator
(clockwise south of the Equator).
The New Jersey Sea Grant Consortium (NJSGC) is an affiliation of colleges, universities and other groups dedicated to advancing knowledge and stewardship of New Jersey’s marine and coastal environment. NJSGC meets its mission through its innovative research, education and outreach programs. For more information about NJSGC, visit njseagrant.org.
4
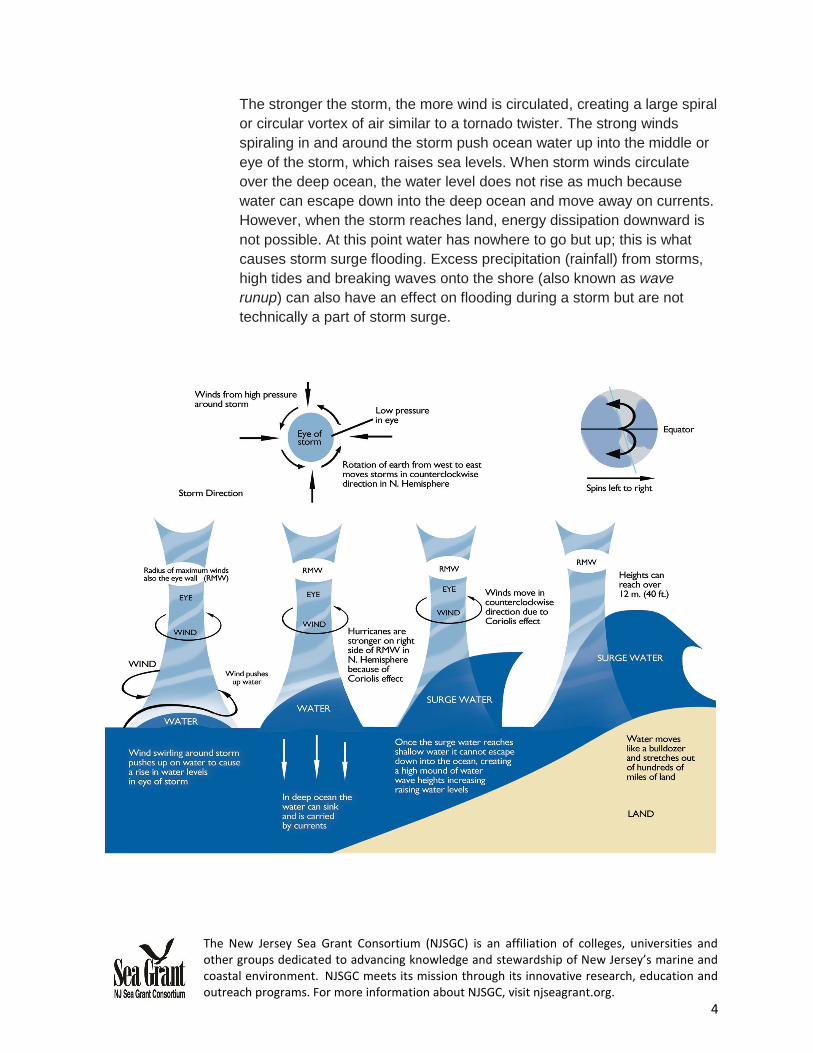
The stronger the storm, the more wind is circulated, creating a large spiral
or circular vortex of air similar to a tornado twister. The strong winds
spiraling in and around the storm push ocean water up into the middle or
eye of the storm, which raises sea levels. When storm winds circulate
over the deep ocean, the water level does not rise as much because
water can escape down into the deep ocean and move away on currents.
However, when the storm reaches land, energy dissipation downward is
not possible. At this point water has nowhere to go but up; this is what
causes storm surge flooding. Excess precipitation (rainfall) from storms,
high tides and breaking waves onto the shore (also known as wave
runup) can also have an effect on flooding during a storm but are not
technically a part of storm surge.
The New Jersey Sea Grant Consortium (NJSGC) is an affiliation of colleges, universities and other groups dedicated to advancing knowledge and stewardship of New Jersey’s marine and coastal environment. NJSGC meets its mission through its innovative research, education and outreach programs. For more information about NJSGC, visit njseagrant.org.
5
The Education Program at the New Jersey Sea Grant Consortium 22 Magruder Road, Fort Hancock, NJ 07732 (732) 872-1300 www.njseagrant.org
UNDERSTANDING STORM SURGE
ACTIVITY 1 - OCEANS OF PRESSURE A Review of the Water Cycle, Air Pressure, and Weather
OVERVIEW In this experiment, students will observe how temperature affects the
density of air. They will also discover how temperature causes air to rise
or sink to create low pressure systems that result in warm, cloudy, and
wet weather or high pressure systems that bring cool, dry, fair weather.
Students will also get the opportunity to review the water cycle.
MATERIALS
Glass bottle or 250ml Erlenmeyer flask
Water
Bowl of cold water (to immerse the bottle or Erlenmeyer flask)
Balloons
Hot plate
PROCEDURE:
1. Explain to students that this experiment will demonstrate how low
and high pressure weather systems form over an area on Earth, as
well as how the weather we observe is created. This experiment
creates a closed system so students will be able to see and explain
how air molecules move when heated or cooled and how this affects
weather. This experiment is also a good review of the water cycle. A
vocabulary review of words associated with the water cycle, such as
condensation, saturation, and precipitation may be helpful prior to
performing this activity.
2. Fill a glass bottle or Erlenmeyer flask with about 4 cm (1.5 inches) of
water and place the balloon securely over the mouth of the bottle.
Center the balloon over the mouth of the bottle so air may easily
enter the balloon. The bottle represents the Earth’s lower
The New Jersey Sea Grant Consortium (NJSGC) is an affiliation of colleges, universities and other groups dedicated to advancing knowledge and stewardship of New Jersey’s marine and coastal environment. NJSGC meets its mission through its innovative research, education and outreach programs. For more information about NJSGC, visit njseagrant.org.
6
atmosphere where humans observe weather; the balloon is the
Earth’s cool upper atmosphere.
3. Place the bottle on a hot plate and turn the hot plate to medium high
heat. The hot plate represents the heat of the sun that has warmed
the Earth. Students should answer questions 1-5 as they observe the
warming of the flask. Do not turn the heat up too high — you do not
want to cause the water to boil. Also, do not allow the balloon to
inflate so that it pops.
4. Students should next answer question 6 to hypothesize what they
think will happen inside the bottle and to the balloon if the bottle is
taken off the hot plate and placed into a bowl of cool water.
5. Carefully take the bottle off the hot plate and place it into a bowl of
cool water. The cool water represents areas such as those near the
Earth’s poles. Students should observe the changes and answer
questions 7-10.

The New Jersey Sea Grant Consortium (NJSGC) is an affiliation of colleges, universities and other groups dedicated to advancing knowledge and stewardship of New Jersey’s marine and coastal environment. NJSGC meets its mission through its innovative research, education and outreach programs. For more information about NJSGC, visit njseagrant.org.
7
The Education Program at the New Jersey Sea Grant Consortium 22 Magruder Road, Fort Hancock, NJ 07732 (732) 872-1300 www.njseagrant.org
UNDERSTANDING STORM SURGE ACTIVITY 1 - OCEANS OF PRESSURE Student Questions:
1. In this experiment the bottle represents an area with a weather system in place. How are
the Earth’s oceans, lakes or rivers represented in this experiment?
2. What do you think will happen to the balloon as the bottle is warmed? What do you think
will happen to the water as it is warmed?
3. Which direction did the air move when warmed in this experiment? How do you know the
air moved in this direction? Why do you think air moved in this direction?
4. High pressure air is dense and will sink; low pressure air is less dense and will rise. When
the bottle is warmed, does it represent a high or low pressure weather system?
5. Using weather terms, explain the weather you observe inside the bottle when it was
warmed. How do you think the warming temperatures cause this type of weather?
6. Based on results from Step 1 of the experiment, hypothesize what you think will happen
inside the bottle and to the balloon when placed into cool water. Explain your reasoning.
7. Which direction did the air move when cooled in this experiment? Explain your reasoning.
8. When the bottle is cooled, does this represent a high or low pressure weather system?
9. Using weather terms, explain what happens inside the bottle when it is cooled.
10. Imagine an Earth without an ocean. Hypothesize how the results of this experiment would
change if we didn’t use water in this experiment.
11. Based on the results of this experiment, what causes a low pressure weather system?
What kind of weather is observed when a low pressure system is in place?
12. Based on the results of this experiment what causes a high pressure weather system?
What kind of weather is observed when a high pressure system in place?
The New Jersey Sea Grant Consortium (NJSGC) is an affiliation of colleges, universities and other groups dedicated to advancing knowledge and stewardship of New Jersey’s marine and coastal environment. NJSGC meets its mission through its innovative research, education and outreach programs. For more information about NJSGC, visit njseagrant.org.
8
The Education Program at the New Jersey Sea Grant Consortium 22 Magruder Road, Fort Hancock, NJ 07732 (732) 872-1300 www.njseagrant.org
UNDERSTANDING STORM SURGE
ACTIVITY 1 - OCEANS OF PRESSURE Student Answers:
1. The Earth’s ocean, lakes and rivers are represented by the water in the bottle. Water is
added because the water on Earth affects the weather on Earth.
2. The balloon will inflate as air is warmed and rises into the balloon. The water will warm and
slowly evaporate, condense, and form a precipitate.
3. The air moved upwards from the bottle and into the balloon. You know the air moved
upwards because the balloon inflates with air. Remember that warm air rises, so as the air
in the bottle warms, the air molecules increase in energy and spread apart. As they move
apart they become less dense and rise to the top of the bottle and into the balloon.
4. A low pressure weather system formed inside the bottle. The air inside the bottle
represented the lower atmosphere. As it warmed, it went upwards into the balloon. A high
pressure system formed inside the balloon which represented the upper atmosphere.
5. You should observe evaporation and condensation. As the bottle is warmed, the water
inside the bottle evaporated and the warm water vapor travelled up to the top of the bottle.
The warm water vapor will fog or cloud up the bottle. Then as water vapor reaches the top
of the cooler top of the bottle and/or balloon, the vapor condensed. When this vapor
reached a saturation point, it formed back into water molecules and caused precipitation
which was observed as water dripping back into the bottle. The condensing water vapor
represents rain that falls when a low pressure system is in place over a location.
6. Answers are open-ended but students might hypothesize that the results of Step 4 will be
the opposite of Step 1. The balloon will deflate and the bottle will clear of any fog, clouds,
and/or precipitation to form a high pressure system. As the bottle cools, the molecules of air
inside the bottle will decrease in energy and move closer together. This causes the air
The New Jersey Sea Grant Consortium (NJSGC) is an affiliation of colleges, universities and other groups dedicated to advancing knowledge and stewardship of New Jersey’s marine and coastal environment. NJSGC meets its mission through its innovative research, education and outreach programs. For more information about NJSGC, visit njseagrant.org.
9
molecules to become dense and sink. The sinking air will cause the balloon to deflate. The
downward movement of cool air will clear up the fog and stop condensation and
precipitation in the bottle.
7. As the bottle was cooled, the air moved down into the bottle and the balloon deflated. This
bottle is sealed by the balloon, but the air in the balloon had to go somewhere. Cool air is
heavier and denser because as molecules cool they move closer together, so the air in the
balloon sank back down inside the bottle as it cooled.
8. A high pressure weather system is represented inside the bottle. As the bottle cooled, the
molecules of air inside the bottle decreased in energy and moved closer together. This
caused the air molecules to become dense and sink. The downward movement of cool air
cleared up the fog and clouds, stopping condensation and precipitation inside the bottle.
9. Clear and dry.
10. With no water there would be no water evaporation, and thus, no condensation,
precipitation, or any form of wet weather. The Earth would be a dry place.
11. Warm or hot air creates a low pressure system; hot air rises and also causes water to
evaporate. When water vapor rises, it will condense in the cool upper atmosphere and
cause condensation and clouds to form. Clouds become saturated with water and this
leads to precipitation (e.g. rain). Low pressure systems are often associated with warm,
cloudy, rainy days.
12. Cool or cold air creates a high pressure system. As air cools, it becomes dense and sinks.
The sinking cool dry air dries and clears up any water vapor in the lower atmosphere. High
pressure systems are often associated with cool, dry, nice weather.
Further Explanation:
The atmosphere is full of air molecules that are always moving, and the weight of these air
molecules creates pressure. All changes in air pressure create weather.
Air is made up of many invisible molecules, and these molecules are full of energy! When
temperatures are cool, air molecules move together, become denser, and sink down towards
land. Typically the mass of air flows downward, fans out, and gives us nice cool temperatures
and sunny skies. This is the type of weather we enjoy when a high pressure weather system is
in place.

The New Jersey Sea Grant Consortium (NJSGC) is an affiliation of colleges, universities and other groups dedicated to advancing knowledge and stewardship of New Jersey’s marine and coastal environment. NJSGC meets its mission through its innovative research, education and outreach programs. For more information about NJSGC, visit njseagrant.org.
10
When air is heated by the sun’s energy, air molecules spread apart and take up more space. This makes the air less dense. The less dense and much lighter mass of air rises up into the Earth’s atmosphere. Also consider that the Earth is made of 71% water, which is mostly ocean water. When the Earth’s water is heated by the sun, some of the water evaporates into the air. Air in the atmosphere is always moving up and down as it warms and cools. Cold air is dense and sinks; warm air is less dense and rises.
As the sun warms the cool air near the surface of the Earth, the newly warmed air will rise; as the air rises, there is less weight exerted onto Earth from the atmosphere. This is called a low pressure system. Low pressure systems are often associated with times of stormy weather and high winds. This is because as surface temperatures rise, they also cause more water to evaporate from our oceans and other bodies of water. The rising warm air is full of water vapor; as the warm air rises, it is cooled by the upper atmosphere and causes the water vapor to condense and create precipitation. Low pressure systems are found on the boundary between warm and cold air masses. As warm air rises up, cold air rushes into the area of low pressure, causing strong winds. The more warm air rises, the stronger the winds. The stronger the wind, the more water evaporates. If this cycle continues over very warm water, storms and even hurricanes can form. The Earth’s rotation adds to this and causes the winds to spin counter-clockwise in the Northern Hemisphere and clockwise in the Southern Hemisphere. This is known as the Coriolis effect.
High pressure systems are the opposite of low pressure systems. They form as cool air sinks. The sinking air exerts more force on the atmosphere near the surface of the Earth. High pressure systems are often associated with cool, dry, nice weather.
The New Jersey Sea Grant Consortium (NJSGC) is an affiliation of colleges, universities and other groups dedicated to advancing knowledge and stewardship of New Jersey’s marine and coastal environment. NJSGC meets its mission through its innovative research, education and outreach programs. For more information about NJSGC, visit njseagrant.org.
11
The Education Program at the New Jersey Sea Grant Consortium 22 Magruder Road, Fort Hancock, NJ 07732 (732) 872-1300 www.njseagrant.org
UNDERSTANDING STORM SURGE
ACTIVITY 2 - WINDY BALLOON
OVERVIEW Winds are created by a change in air pressure. During this activity,
students will do a simple experiment to observe how air strives toward a state of equilibrium and travels from high pressure to low pressure to obtain equilibrium. Within the atmosphere, there are several forces that impact the speed and direction of winds, but the most important is Earth’s gravitational force. As gravity compresses Earth’s atmosphere, it creates air pressure, which is the driving force of wind. Without gravity, there would be no atmosphere or air pressure, and thus, no wind.
MATERIALS Balloons- 1 for each pair of students
PROCEDURE 1. Pair up students and give each team a balloon. Ask each pair of
students to blow up the balloon but not to tie it closed. They must hold the balloon closed between their fingers and answer questions 1 and 2.
2. Ask students to hold onto the balloon but release some of the air and
answer questions 3, 4, 5.
The New Jersey Sea Grant Consortium (NJSGC) is an affiliation of colleges, universities and other groups dedicated to advancing knowledge and stewardship of New Jersey’s marine and coastal environment. NJSGC meets its mission through its innovative research, education and outreach programs. For more information about NJSGC, visit njseagrant.org.
12
The Education Program at the New Jersey Sea Grant Consortium 22 Magruder Road, Fort Hancock, NJ 07732 (732) 872-1300 www.njseagrant.org
UNDERSTANDING STORM SURGE
ACTIVITY 2 - WINDY BALLOON
Student Questions:
1. Hypothesize what will happen to the balloon when you very carefully hold it closed and let
just a bit of air out. Will air be able to move into the balloon or will air move out?
2. Do you think the air inside the balloon is at a higher or lower pressure than the air outside of
the balloon?
3. Carefully relax your fingers so the balloon opens for just a second but don’t let go. After a
second, hold it closed tightly again. Use a weather term to describe what you felt coming out
of the balloon when you relaxed your fingers for just a second.
4. Release the balloon. Describe what happened. In which direction did the air flow?
5. Based on this experiment does, wind flow from low to high pressure or high to low pressure?
The New Jersey Sea Grant Consortium (NJSGC) is an affiliation of colleges, universities and other groups dedicated to advancing knowledge and stewardship of New Jersey’s marine and coastal environment. NJSGC meets its mission through its innovative research, education and outreach programs. For more information about NJSGC, visit njseagrant.org.
13
The Education Program at the New Jersey Sea Grant Consortium 22 Magruder Road, Fort Hancock, NJ 07732 (732) 872-1300 www.njseagrant.org
UNDERSTANDING STORM SURGE
ACTIVITY 2 - WINDY BALLOON
Student Answers:
1. Open ended, but air will flow out of the balloon and the balloon will deflate. The air in the balloon will flow from a high pressure system to a lower pressure system in an attempt to create equal pressure inside and outside the balloon.
2. The balloon is filled with air that is compacted into a small space. By inflating the balloon, students have created a high pressure system. Air pressure will be lower outside of the balloon.
3. Wind!
4. The pressure in the balloon was much higher than the pressure outside the balloon. When released, the air inside the balloon created wind, which propelled the balloon for a bit until it released all its air. Once the balloon was empty, gravity forced the balloon down to the ground. The air flowed in the opposite direction of the balloon.
5. Air moves from high to low pressure.
Further Explanation:
Air moves because of an imbalance in the forces acting upon the air molecules. High pressure
air molecules spread apart and move very fast; low pressure air molecules move more slowly
and compact together. However, the Earth would like to have these air molecules all moving at
the same rate and spread equally across its atmosphere, so Earth is constantly trying to create
this balance. In this experiment, a high pressure system is created by forcing air into a compact
enclosed area (the balloon). This produces an area of high pressure inside the balloon while the
pressure is much lower outside the balloon. When the balloon is opened and released, the two
areas of different pressures meet and create wind as the air strives to create an equal balance
of pressure between the area in and outside the balloon. Wind is the atmosphere's way of trying
to bring the interaction of these forces into a balance or equilibrium. There is always a wind
blowing somewhere across the Earth due to the uneven heating of the Earth by the sun and the
Earth’s rotation. Both factors cause constant change in air pressure.

The New Jersey Sea Grant Consortium (NJSGC) is an affiliation of colleges, universities and other groups dedicated to advancing knowledge and stewardship of New Jersey’s marine and coastal environment. NJSGC meets its mission through its innovative research, education and outreach programs. For more information about NJSGC, visit njseagrant.org.
14
The Education Program at the New Jersey Sea Grant Consortium 22 Magruder Road, Fort Hancock, NJ 07732 (732) 872-1300 www.njseagrant.org
UNDERSTANDING STORM SURGE
Activity 3 - Density Driven Currents OVERVIEW Air moves the same way liquids do. By using cold and warm water,
students will be able to observe how cold air masses with high pressure and warm air masses with low pressure travel through our atmosphere, creating convection currents, wind, and storms.
MATERIALS
• Clear plastic or glass container rectangular in shape, about the size of
a shoebox or a 5- gallon aquarium
• Red and blue food coloring
• Three measuring cups
• Three separate cups of water: 1000 ml of clear water at room
temperature; 250 ml of warm water colored red, and 250 ml of very
cold water colored blue
• 2-4 pieces of white copy paper
PROCEDURE
1. Place a sheet of copy paper beneath the clear rectangular container
and another piece of copy paper lengthwise across the side of the
container.
2. Pour 1000 ml of clear room temperature water into the clear container.
3. Very slowly and carefully pour the cups with the 250ml of warm and
cold water simultaneously into the clear container at opposite ends.
Make observations of the colored waters while pouring.
4. Continue to make observations of the colored water and answer
questions 1 – 8.
The New Jersey Sea Grant Consortium (NJSGC) is an affiliation of colleges, universities and other groups dedicated to advancing knowledge and stewardship of New Jersey’s marine and coastal environment. NJSGC meets its mission through its innovative research, education and outreach programs. For more information about NJSGC, visit njseagrant.org.
15
The Education Program at the New Jersey Sea Grant Consortium 22 Magruder Road, Fort Hancock, NJ 07732 (732) 872-1300 www.njseagrant.org
UNDERSTANDING STORM SURGE
Activity 3 - Density Driven Currents
Student Questions:
1. Where on Earth would you find very cold air?
2. Where on Earth would you find very warm air?
3. When first starting to pour in the cold water, what part of the container did it initially move
towards? How does this relate to the movement of a mass of cold air in our atmosphere?
4. When first starting to pour in the warm water, what part of the container did it initially move
towards? How does this relate to the movement of a mass of warm air in our atmosphere?
5. Viewing the container from the side, explain the direction and movement of the cold blue
water.
6. Viewing the container from the side, explain the direction and movement of the warm red
water.
7. What color water was displaced and moved up in the water column?
8. After about 2 minutes, what happened to the blue and red colored water? Why?
The New Jersey Sea Grant Consortium (NJSGC) is an affiliation of colleges, universities and other groups dedicated to advancing knowledge and stewardship of New Jersey’s marine and coastal environment. NJSGC meets its mission through its innovative research, education and outreach programs. For more information about NJSGC, visit njseagrant.org.
16
The Education Program at the
New Jersey Sea Grant Consortium
22 Magruder Road, Fort Hancock, NJ 07732 (732) 872-1300 www.njseagrant.org
UNDERSTANDING STORM SURGE
Activity 3 - Density Driven Currents
Student Answers:
1. The North and South Poles of the Earth.
2. Near the Equator.
3. Students should observe the cold blue water sinking to the bottom of the container. Cold air
is dense and sinks causing high pressure.
4. Students should observe the warm red water remaining near the surface on top of the room
temperature water and/or rising after it is poured.
5. Students should observe the blue water sinking and travelling slowly across the container to
the opposite side from where it was poured.
6. The warm red water will slowly float and travel across the top of the container to the opposite
side from where it was poured. As the warm water cools it may start to sink but will be
displaced by the cold water and rise again.
7. Students should observe a thermocline with a clear delineation: the warm red water on top,
possibly a small purple mix in the middle, and the cold blue water at the bottom.
This layering happens because as the cold water (air) molecules move close together, the
water becomes denser and sinks to the bottom of the container. In contrast, as the warm
water (air) molecules spread apart, the red water becomes less dense and floats on top of
the cold water (air). When the two masses of water meet in the middle, they start to mix and
equalize in temperature.
8. Eventually the different water temperatures will mix and equalize in temperature, and the
water will turn all purple. However, this is not what happens on Earth because there is
The New Jersey Sea Grant Consortium (NJSGC) is an affiliation of colleges, universities and other groups dedicated to advancing knowledge and stewardship of New Jersey’s marine and coastal environment. NJSGC meets its mission through its innovative research, education and outreach programs. For more information about NJSGC, visit njseagrant.org.
17
constant uneven heating from the sun. The round shape of the Earth, the Earth’s tilt on its
axis and its orbit around the sun (creating seasons) cause the sun’s rays to reach different
areas of the Earth at different angles; In addition, the spin of the Earth (Corioles effect) and
the differences in land and ocean heat absorption rates all create constant temperature
changes around the earth. This constant change in temperature creates pressure differences
which drive air around the world.
Further Explanation:
In this experiment, the cold blue water represents cold air near the North or South Pole of Earth.
Cold temperatures cause air (and water) to become denser as molecules pack closely together
and take up less volume. The cold water is denser, so it will sink and move to the bottom of the
container. This is similar to what happens to cold air in Earth’s atmosphere. The warm red water
represents warm air from near the Equator. Warm temperatures cause air (and water)
molecules to increase their movement and spread apart, taking up more space and becoming
less dense. The warm water used in this experiment is less dense than the room temperature
and cold water so the warm water rises to the top of the container. In the atmosphere, warm air
acts similarly.
Students should be able to observe a thermocline or temperature gradient inside the container.
This gradient should appear with the warm red water on top, possibly some mixed water in the
middle (appears purple), and the cold blue water on the bottom. Students will also observe the
masses of colored water moving to opposite ends of the container because the water strives to
equalize its temperature. The cold blue water will travel down and towards the side where the
warm red water was poured. As the cold blue water moves, it will displace some of the warm
red water, pushing it up and over towards the side of the container opposite from where it was
poured. These are convection currents. Because we cannot possibly keep adding warm and
cold water to our small container, the waters will start to mix and turn purple as they start to
equalize in temperature. Earth strives toward equilibrium with equal pressure and
temperatures; however, this equilibrium is prevented from happening on Earth due to constant
unequal heating from the sun.
The motion of the water in the container is similar to what happens to air in the Earth's
atmosphere. In Earth’s atmosphere, cool air masses with high pressure sink down and displace
the warm air closer to Earth’s surface; the warm air is pushed up and its displacement creates a
low pressure system. Then warm air rises and travels to the upper part of the atmosphere
where cool air prevails. This cools the warm air again, which then moves back down towards
the surface of the earth. This downward flow of warm air creates a high pressure system.
As the cold and warm water begin to mix, students may also observe some swirling water,
which is similar to strong winds in our atmosphere. This motion can be observed when the two
The New Jersey Sea Grant Consortium (NJSGC) is an affiliation of colleges, universities and other groups dedicated to advancing knowledge and stewardship of New Jersey’s marine and coastal environment. NJSGC meets its mission through its innovative research, education and outreach programs. For more information about NJSGC, visit njseagrant.org.
18
different colored water masses meet. It happens because of the extreme difference of
temperature and density of the colored waters.
The movement of the water in the container is similar to what happens in Earth’s atmosphere
when a cold air mass with high pressure meets a warm air mass with lower pressure. The
meeting of these two extremes of temperature and pressure forms storms — and even
hurricanes! Low pressure systems are found on the boundary between warm and cold air
masses. As warm air rises up, cold air rushes into the area of low pressure and causes strong
winds. The more warm air rises, the stronger the winds. However, because Earth is rotating, air
does not just go straight up and down or back and forth in our atmosphere. Ask students to think
about how the spinning of the Earth moves air in the atmosphere and never allows it to still.
How could the rotation of the Earth affect weather patterns around the Earth? (This will be
explored in the next activity).

The New Jersey Sea Grant Consortium (NJSGC) is an affiliation of colleges, universities and other groups dedicated to advancing knowledge and stewardship of New Jersey’s marine and coastal environment. NJSGC meets its mission through its innovative research, education and outreach programs. For more information about NJSGC, visit njseagrant.org.
19
The Education Program at the New Jersey Sea Grant Consortium 22 Magruder Road, Fort Hancock, NJ 07732 (732) 872-1300 www.njseagrant.org
UNDERSTANDING STORM SURGE
ACTIVITY 4: THE CORIOLIS EFFECT
Adapted from : <http://www.carolina.com/teacher-resources/Interactive/modeling-the-coriolis-effect/tr10643.tr>
OVERVIEW Students will explore how air moves around the Earth while it is spinning
on its axis creating the Coriolis effect.
MATERIALS
• A large round object such as a ball, balloon or globe
• Two (2) dry erase markers
PROCEDURE 1. Around the middle of the ball, balloon or globe draw a line representing
the Equator. Label the top and bottom of the ball, balloon, or globe to
represent the North and South Poles.
2. Ask a student to hold the ball, balloon or globe at eye level and rotate it
from left to right, simulating the rotation of the Earth.
3. While one student rotates the ball, balloon, or globe ask the others to
examine movement from the perspective of the labeled North and
South Poles. All students should answer questions 1 and 2.
4. While one student continues to rotate the ball, balloon or globe from
left to right, ask another student to slowly draw a line straight from the
North Pole to the equator. Switch students and while one student
continues to rotate the ball, balloon or globe, ask another student draw
a line straight from the South Pole towards the Equator. Answer
questions 3 and 4.
Students may struggle with understanding that the direction of the Earth’s
movement is based on their point of view. When they describe the
The New Jersey Sea Grant Consortium (NJSGC) is an affiliation of colleges, universities and other groups dedicated to advancing knowledge and stewardship of New Jersey’s marine and coastal environment. NJSGC meets its mission through its innovative research, education and outreach programs. For more information about NJSGC, visit njseagrant.org.
20
direction (left or right) in which the “straight” lines veer, make sure the
students determine this direction from the perspective of the beginning
point of the line. Take a few minutes to discuss this as a class. You may
also address common misconceptions concerning the Coriolis effect,
such as the notion that the direction of swirl in a flushing toilet differs in
the northern and Southern Hemispheres.
Ask students to relate the directional movement of large air masses,
ocean currents, and hurricanes to the Coriolis effect. They may find maps
that depict the prevailing winds and ocean currents in the Northern and
Southern Hemispheres.
The New Jersey Sea Grant Consortium (NJSGC) is an affiliation of colleges, universities and other groups dedicated to advancing knowledge and stewardship of New Jersey’s marine and coastal environment. NJSGC meets its mission through its innovative research, education and outreach programs. For more information about NJSGC, visit njseagrant.org.
21
The Education Program at the New Jersey Sea Grant Consortium 22 Magruder Road, Fort Hancock, NJ 07732 (732) 872-1300 www.njseagrant.org
UNDERSTANDING STORM SURGE
ACTIVITY 4: THE CORIOLIS EFFECT
Student Questions:
1. As you look down from the “North Pole” towards the “Equator,” in which direction is the ball,
balloon, or globe spinning-- clockwise or counterclockwise?
2. When you look up from the “South Pole” toward the “Equator,” which way is the ball, balloon
or globe balloon spinning? Clockwise or counterclockwise?
3. What happened when you tried to draw a straight line from the “North Pole” to the
“Equator”?
4. What happened when you tried to draw a straight line from the “South Pole” to the
“Equator”?
5. Predict what would happen if you again drew lines in the Northern and Southern
Hemispheres but with the Earth rotating in the opposite direction.

The New Jersey Sea Grant Consortium (NJSGC) is an affiliation of colleges, universities and other groups dedicated to advancing knowledge and stewardship of New Jersey’s marine and coastal environment. NJSGC meets its mission through its innovative research, education and outreach programs. For more information about NJSGC, visit njseagrant.org.
22
The Education Program at the New Jersey Sea Grant Consortium 22 Magruder Road, Fort Hancock, NJ 07732 (732) 872-1300 www.njseagrant.org
UNDERSTANDING STORM SURGE
ACTIVITY 4: THE CORIOLIS EFFECT
Student Answers:
1. The ball, balloon or globe appears to be spinning counterclockwise.
2. The ball, balloon or globe appears to be spinning clockwise.
3. The line was not straight but instead veered west of the intended path (to the right, when
examining the line from the “North Pole” to the “Equator”).
4. The line was not straight but instead veered west of the intended path (to the left, when
examining the line from the “South Pole” to the “Equator”).
5. The curving of the lines in the Northern and Southern Hemispheres would be reversed. The
line from the “North Pole” to the “Equator” would veer to the left, and the line from the “South
Pole” would veer to the right (toward the east, in both cases).
The New Jersey Sea Grant Consortium (NJSGC) is an affiliation of colleges, universities and other groups dedicated to advancing knowledge and stewardship of New Jersey’s marine and coastal environment. NJSGC meets its mission through its innovative research, education and outreach programs. For more information about NJSGC, visit njseagrant.org.
23
The Education Program at the New Jersey Sea Grant Consortium 22 Magruder Road, Fort Hancock, NJ 07732 (732) 872-1300 www.njseagrant.org
UNDERSTANDING STORM SURGE
ACTIVITY 5 - PRESSURE DRIVEN STORMS & SURGE
OVERVIEW Many people have the misunderstanding that only strong winds create
storm surge flooding along a coast during a harsh storm or hurricane. In
this experiment students will investigate how air pressure affects storm
surge levels and how storm surge affects a coastal town.
MATERIALS
• Balloon (round or oval)
• 11x17 paper, pencils, rulers
Optional - water and rectangular waterproof container
PROCEDURE
1. Pair up students. Ask them to inflate a balloon and tape a pencil to it. The balloon will represent ocean water.
2. Ask students to press down on the balloon to create ocean levels during a time with high pressure system. On a sheet of 11x17 (or longer) paper held lengthwise, ask students to use the pencil to mark on the left side of the paper where the pencil meets the paper when the balloon is pressed down. This line will represent the water level when a high pressure system is in place. Students should know by now that high pressure generally means a nice day of fair sunny weather.
3. Next, students draw a profile of a coastal town lengthwise across the paper. About 1/3 of the sheet should be the ocean gradually becoming shallower as it meets the land, in this case a sloping beach. Ask them to add other natural and man-made features to the landscape to represent the coastal town, such as houses, roads, and other landscape features sometimes found in coastal towns at varying heights above or below sea level (river basins, mud flats, marshes, dunes, houses, roads, boardwalks).
The New Jersey Sea Grant Consortium (NJSGC) is an affiliation of colleges, universities and other groups dedicated to advancing knowledge and stewardship of New Jersey’s marine and coastal environment. NJSGC meets its mission through its innovative research, education and outreach programs. For more information about NJSGC, visit njseagrant.org.
24
4. Students will predict what will happen when a low pressure system blows a harsh storm onto their “coastal town.” Students should not press down on the balloon because a low pressure system would not put pressure on water and cause water levels to be higher. Students should make a prediction based on the balloons height with a low pressure system in place and how the ocean will impact the coast as water reaches the land areas. Students should draw on the paper where they think the balloon representing storm water will flood their “coastal town.”
5. Now ask students to roll the balloon over their drawing, starting from the ocean side towards the land. The rolling of the balloon will represent winds blowing the storm onto the coast and causing a storm surge. As the balloon reaches the coast and is rolled past the “coastal town,” students should measure the top of the balloon representing storm surge levels at various points along the paper at the varying heights. Students should make observations and record on a separate sheet of paper how the man-made and natural features of their “coastal town” were flooded by the storm surge and then compare their observations to their predictions.
6. As the winds circulate during a hurricane (counterclockwise in the Northern Hemisphere), winds push water into the eye of the storm raising sea levels. This is chiefly noticed when the storm moves into shallow water and onto land. Now ask students to place their hands around the sides (not top or bottom) of the balloon, which represents ocean water during a hurricane. Ask students to push the balloon inward. Their hands pressing around the balloon represent winds pushing ocean storm water inward to the eye of the storm. Students will observe how the balloon’s vertical height increases. This is similar to what happens to sea levels inside the eye of a hurricane. Now students will repeat Step 5 and record observations about the amount of flooding.
7. Optional: Repeat this experiment (Steps 1-6) inside a clear plastic container with a balloon filled with water. Ask students to place their drawing facing inward along the length of the container and then roll the water filled balloon inside the container, starting at the end where the drawing indicates ocean. When the balloon reaches the land, ask students to release the water in their balloon to flood their landscape. Compare this to a hurricane which breaks apart and weakens as it moves further inland and away from the fueling warm water of the ocean.
The New Jersey Sea Grant Consortium (NJSGC) is an affiliation of colleges, universities and other groups dedicated to advancing knowledge and stewardship of New Jersey’s marine and coastal environment. NJSGC meets its mission through its innovative research, education and outreach programs. For more information about NJSGC, visit njseagrant.org.
25
The Education Program at the New Jersey Sea Grant Consortium 22 Magruder Road, Fort Hancock, NJ 07732 (732) 872-1300 www.njseagrant.org
UNDERSTANDING STORM SURGE
ACTIVITY 6 – SURGE OF THE STORM http://secoora.org/classroom/virtual_hurricane/surge_of_the_storm>
OVERVIEW Storms create winds that create waves. Storm waves can be unrelenting
along the shoreline, pushing water very far up onto land and creating storm surge. Students will examine how different shapes and slopes of shorelines are affected by storm surge.
MATERIALS
Plastic shoe boxes or other long rectangular-shaped containers
Clay and/or sand
Water, blue food coloring, and/or dish soap for thickener
Monopoly houses, Legos, sticks, rocks, or cardboard to represent houses
and other man-made structures on land
A wind-wave source, such as a wood or plastic paddle almost as wide as
the container
Topography cards (see below) for students to choose from
PROCEDURE 1. Divide students into groups of 2-4. Ask each group to select a topography
card (included at the end of this lesson). These cards will instruct students on how to mold the clay to create the land/beach area in their container to observe how different land forms are affected by storm surge.
2. Ask each student team to mold clay into a beach area according to the
directions on their topography card. Card options are: gentle sloping
beach with a rise (high) of 4 cm and a run (long) of 16 cm; moderate
sloping beach with a 5 cm rise and a run of 10 cm; steep sloping
beach with a 6 cm rise and a 6 cm run; convex beach; concave beach;
estuary with meandering river or barrier beach island.
The New Jersey Sea Grant Consortium (NJSGC) is an affiliation of colleges, universities and other groups dedicated to advancing knowledge and stewardship of New Jersey’s marine and coastal environment. NJSGC meets its mission through its innovative research, education and outreach programs. For more information about NJSGC, visit njseagrant.org.
26
3. In a separate container create “ocean water” by mixing equal parts water
with a few drops of blue food coloring and a thickener, such as dish liquid,
hair gel, or shampoo. The thicker liquid will help students better visualize
what happens on land during a storm surge since the thickened liquid will
not retreat as fast as water usually does.
4. Slowly add the “ocean water” to the empty side of the container. Add
about 1 cm of water. Students may add more if needed to just reach land,
surround the barrier island, and/or reach the mouth of the river or estuary
that they molded in their container. Students can add objects along the
water’s edge to represent man-made structures, such as houses, hotels,
cars, etc.
5. Option 1: Place toothpicks every centimeter from the water’s edge where
the water meets the land, moving perpendicular up onto the land to the
edge of the container. Place first toothpick at 1cm and continue adding
toothpicks at 1cm intervals to the edge of the container. With toothpicks in
place, students will be able to measure the distance and height that the
water level reaches at different points along the landform based on the
watermarks left on toothpicks. Students can create a graph with the
measurements of the height of the storm surge as it moved “inland.”
6. Option 2: On the side of the container, use an erasable marker and ruler
to place a mark every centimeter from where the water meets the sand all
the way up the landform to the top of the container. The mark at the edge
of the island should be 0. Label each mark 0, 1, 2, etc. where each mark
represents one centimeter. Students will make observations about how
the surge moves inland and how much land is eroded during the storm.
7. Ask students to create mild storm waves by pushing a paddle in the water
very gently towards land. Students should make a wave about every 1-2
seconds for 30 seconds and observe what happens to the land areas.
Record the distance these normal waves travel inland in the data table on
the worksheet in Observations #1. Answer questions 2 & 3.
8. Read this part carefully before beginning!!! Next ask students to
create a hurricane storm surge. To do this, they will need to push water
from the ocean onto land. Waves should be made as fast as possible or
at least every ½ second so the waves and water are not allowed to flow
back down into the ocean. Be sure to PUSH the water up onto the land,
not just splash. This demonstrates the same intense waves produced
during a surge. Answer observation question #4. Answer the remaining
observation questions and prepare your conclusion.
The New Jersey Sea Grant Consortium (NJSGC) is an affiliation of colleges, universities and other groups dedicated to advancing knowledge and stewardship of New Jersey’s marine and coastal environment. NJSGC meets its mission through its innovative research, education and outreach programs. For more information about NJSGC, visit njseagrant.org.
27
The Education Program at the
New Jersey Sea Grant Consortium
22 Magruder Road, Fort Hancock, NJ 07732 (732) 872-1300 www.njseagrant.org
UNDERSTANDING STORM SURGE
ACTIVITY 6 – SURGE OF THE STORM
Student worksheet/ data table Name of Topography Card: _______________________________________________
Type of disturbance Distance felt inland
Mild Storm Waves
Harsh Storm Wave- Storm Surge
1. Describe what happened in your model when you created mild storm waves.
2. Which area of your model was most affected by the mild storm waves? Explain why this
happened.
3. Explain how the slope or shape of the land impacted the areas affected by waves.
4. Describe what happened in the model when you created harsh storm with storm surge.
Explain what happened inland and the height of the surge observed on your toothpicks.
5. If you had an estuary or river form in your container, explain how the harsh storm (which is
formed in the ocean) impacted the inland shallow water areas.
6. Are estuaries and rivers also impacted by storm surge?
The New Jersey Sea Grant Consortium (NJSGC) is an affiliation of colleges, universities and other groups dedicated to advancing knowledge and stewardship of New Jersey’s marine and coastal environment. NJSGC meets its mission through its innovative research, education and outreach programs. For more information about NJSGC, visit njseagrant.org.
28
7. Was any area of your model “safe” from the storm surge during your harsh storm”? Explain
your answer.
8. If an evacuation had been ordered, how far should the people travel from the shore in order
to be out of harm’s way? Support your answer using ideas from the model and further
research if necessary.
9. What recommendations would you make to a developer who is interested in building on
coastal properties?
10. Describe how the effects of a storm surge can impact the lives of the people and the
economy of the community.
Conclusions:
Share observations and worksheet answers made for each topography card. Discuss what a
storm surge is, how it is produced, and how it could impact humans. Discuss with the other
groups with different land forms how storm surge impacted their models: How did storm surge
affect gentle slopes and low lying areas along the coast? How did the storm, which originated in
the ocean, impact estuaries and rivers near the coast?
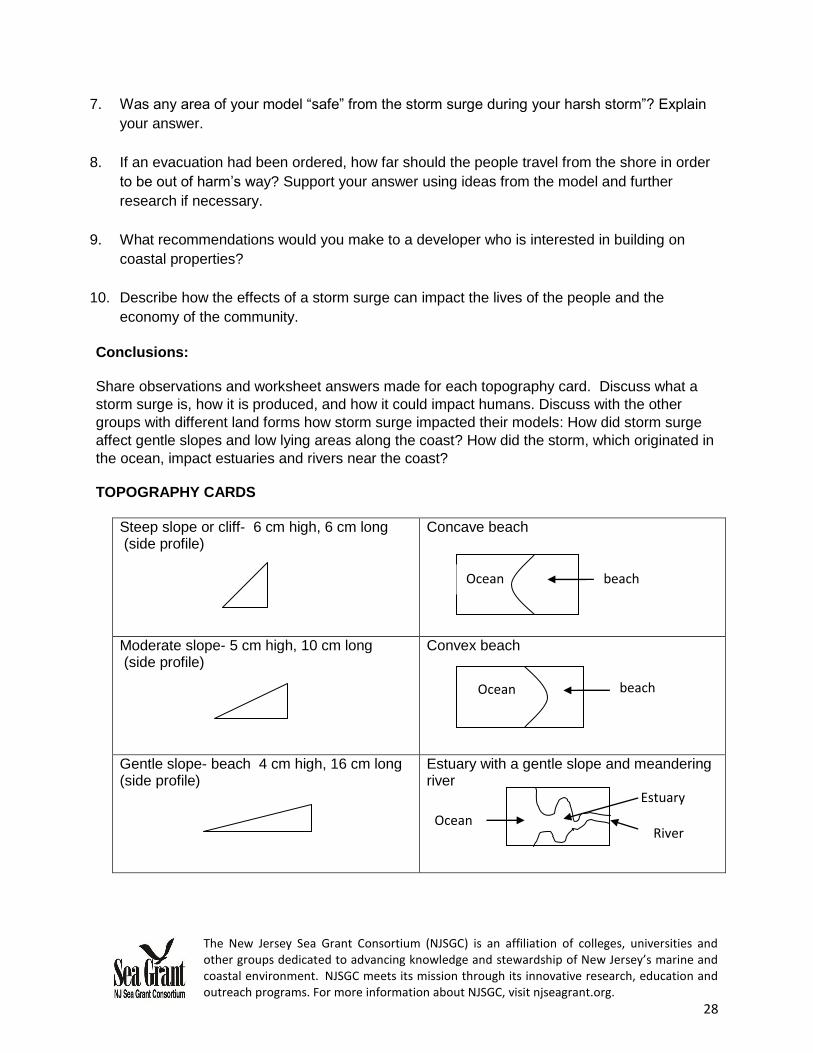
TOPOGRAPHY CARDS
Steep slope or cliff- 6 cm high, 6 cm long (side profile)
Concave beach
Moderate slope- 5 cm high, 10 cm long (side profile)
Convex beach
Gentle slope- beach 4 cm high, 16 cm long (side profile)
Estuary with a gentle slope and meandering river
beach
beach
Ocean
Estuary
River
Ocean
Ocean
The New Jersey Sea Grant Consortium (NJSGC) is an affiliation of colleges, universities and other groups dedicated to advancing knowledge and stewardship of New Jersey’s marine and coastal environment. NJSGC meets its mission through its innovative research, education and outreach programs. For more information about NJSGC, visit njseagrant.org.
29
Extensions:
Storm surge can be difficult to predict because storms can change at any time, making it difficult
for meteorologists to predict with high probabilities. Wind direction, speed, storm intensity, storm
size, and actual landfall can make a big difference between 20 feet of storm surge versus none,
or evacuating hundreds of people versus not doing so. Ask students to create a landscape with
varying slopes and landforms. Ask students to create wind using a straw at different locations
and at different intensities and angles towards the shore. Ask students to predict where they
may get the highest surge on their landscape and in which direction wind needs to blow from in
order to create the biggest surge.
Ask students to hypothesize and then experiment with their models to determine how the
impact of storm surge might be reduced. Students may think of ways humans might build
structures to reduce impact or how natural land forms, such as salt marshes or dunes, may
reduce the impact of storm surge.
Ask students to do the experiment again but add another ½ or 1 centimeter of water to
represent a storm surge impacting the coast during high tide. Have students report and discuss
how storm surge and tides can increase the impact of the surge along the coast.
Sea levels are rising and scientists predict that sea levels along the coast of New Jersey may
rise ½ meter to 3 meters within the next 20 years. Ask students to raise the sea levels in their
containers by 1, 2, or 3 centimeters and do the experiment again. Report the differences in how
storm surge impacted the land forms with a raised sea level(s).
Further Explanation:
The main factors that create a storm surge are:
1. A low pressure system that causes water levels to rise because less force is being
exerted onto the water.
2. The intensity of the storm forming strong winds. The intense wind piles water up as it
reaches land and creates relentless waves, which do not allow water to retreat back into
the ocean. This raises sea levels and pushes water inland. In this way, water can
spread hundreds of miles inland during a storm surge. This also creates waves that can
create a surge of water well before a storm even reaches land.
3. The spiraling of strong winds around a low pressure storm, which pushes water into the
center of a storm. In deep ocean this water sinks but when the storm reaches shallow
water, it cannot sink. This creates a high mound of water that raises the sea levels and
results in storm surge flooding on land.
The New Jersey Sea Grant Consortium (NJSGC) is an affiliation of colleges, universities and other groups dedicated to advancing knowledge and stewardship of New Jersey’s marine and coastal environment. NJSGC meets its mission through its innovative research, education and outreach programs. For more information about NJSGC, visit njseagrant.org.
30
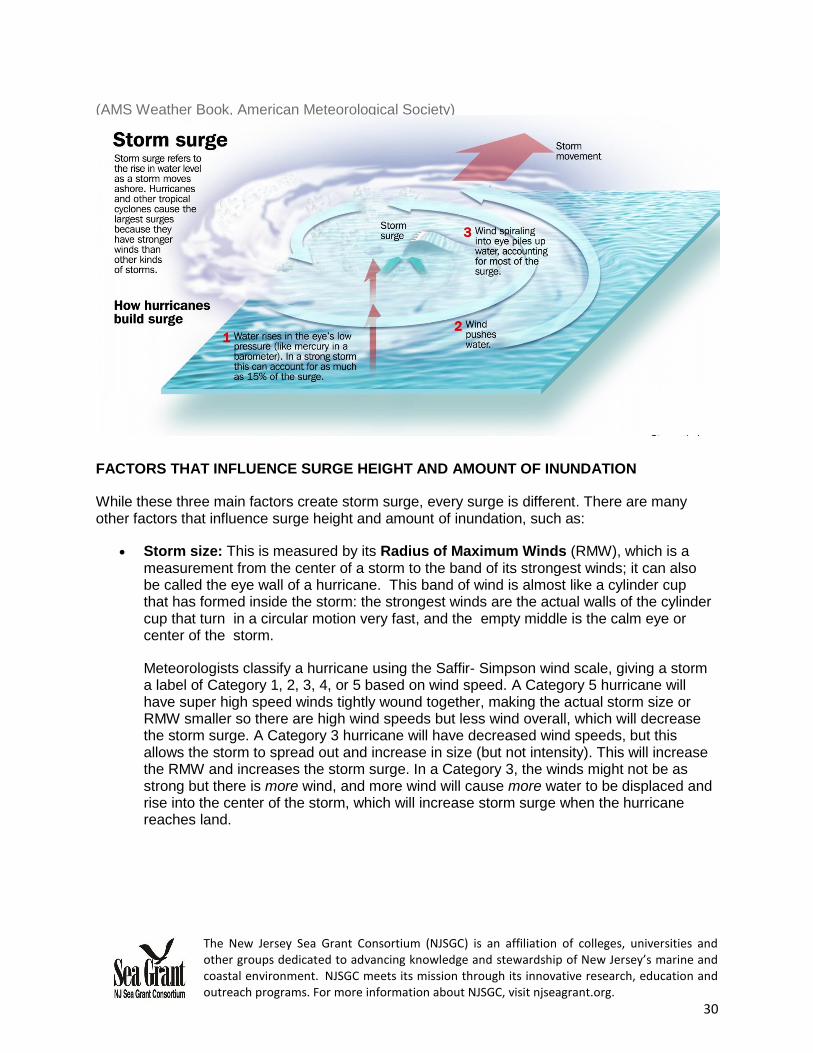
(AMS Weather Book, American Meteorological Society)
FACTORS THAT INFLUENCE SURGE HEIGHT AND AMOUNT OF INUNDATION
While these three main factors create storm surge, every surge is different. There are many other factors that influence surge height and amount of inundation, such as:
Storm size: This is measured by its Radius of Maximum Winds (RMW), which is a measurement from the center of a storm to the band of its strongest winds; it can also be called the eye wall of a hurricane. This band of wind is almost like a cylinder cup that has formed inside the storm: the strongest winds are the actual walls of the cylinder cup that turn in a circular motion very fast, and the empty middle is the calm eye or center of the storm.
Meteorologists classify a hurricane using the Saffir- Simpson wind scale, giving a storm a label of Category 1, 2, 3, 4, or 5 based on wind speed. A Category 5 hurricane will have super high speed winds tightly wound together, making the actual storm size or RMW smaller so there are high wind speeds but less wind overall, which will decrease the storm surge. A Category 3 hurricane will have decreased wind speeds, but this allows the storm to spread out and increase in size (but not intensity). This will increase the RMW and increases the storm surge. In a Category 3, the winds might not be as strong but there is more wind, and more wind will cause more water to be displaced and rise into the center of the storm, which will increase storm surge when the hurricane reaches land.
The New Jersey Sea Grant Consortium (NJSGC) is an affiliation of colleges, universities and other groups dedicated to advancing knowledge and stewardship of New Jersey’s marine and coastal environment. NJSGC meets its mission through its innovative research, education and outreach programs. For more information about NJSGC, visit njseagrant.org.
31
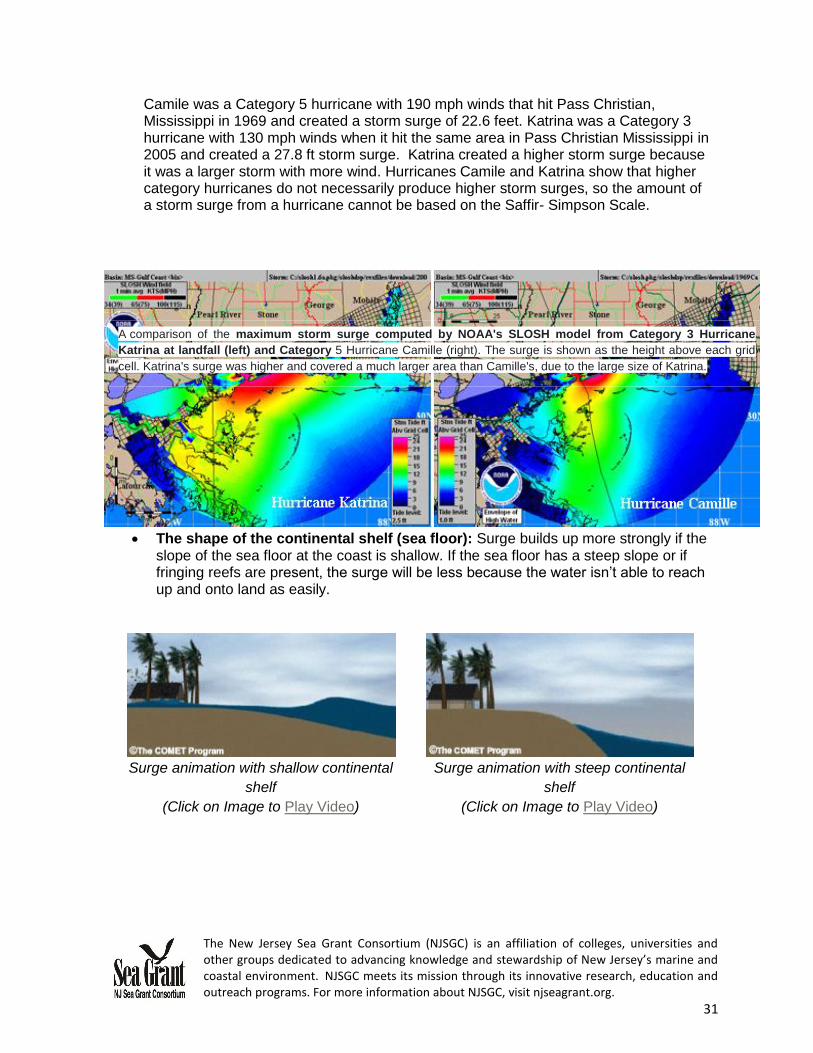
Camile was a Category 5 hurricane with 190 mph winds that hit Pass Christian, Mississippi in 1969 and created a storm surge of 22.6 feet. Katrina was a Category 3 hurricane with 130 mph winds when it hit the same area in Pass Christian Mississippi in 2005 and created a 27.8 ft storm surge. Katrina created a higher storm surge because it was a larger storm with more wind. Hurricanes Camile and Katrina show that higher category hurricanes do not necessarily produce higher storm surges, so the amount of a storm surge from a hurricane cannot be based on the Saffir- Simpson Scale.
The shape of the continental shelf (sea floor): Surge builds up more strongly if the slope of the sea floor at the coast is shallow. If the sea floor has a steep slope or if fringing reefs are present, the surge will be less because the water isn’t able to reach up and onto land as easily.
Surge animation with shallow continental
shelf
(Click on Image to Play Video)
Surge animation with steep continental
shelf
(Click on Image to Play Video)
A comparison of the maximum storm surge computed by NOAA's SLOSH model from Category 3 Hurricane
Katrina at landfall (left) and Category 5 Hurricane Camille (right). The surge is shown as the height above each grid
cell. Katrina's surge was higher and covered a much larger area than Camille's, due to the large size of Katrina.
The New Jersey Sea Grant Consortium (NJSGC) is an affiliation of colleges, universities and other groups dedicated to advancing knowledge and stewardship of New Jersey’s marine and coastal environment. NJSGC meets its mission through its innovative research, education and outreach programs. For more information about NJSGC, visit njseagrant.org.
32
The shape of the land: Land elevation, slope, and other local land features will be impacted by surge differently. Areas with gentle sloping beaches, shallow water, and low level land areas, such as marshes, will see the most storm surge. The location of the mouth of estuaries, inlets, and rivers also will be impacted differently by storm surge.
Storm speed: The quicker a storm hits land, the faster the surge water will pile up. Also
the faster the storm, the more powerful the winds and waves will become. As these waves reach shallow water and land, they grow even larger. These large waves push water even further onto land. Large breaking waves along the shoreline are powerful enough to knock down houses, destroy roadways, and wash away land.
Angle of approach: A storm hitting land in a perpendicular direction will have a much
harder impact than if it hits at a parallel or oblique angle. If the angle of the storm is a direct hit into the mouth of an estuary, inlet, or river, the surge will be amplified as these areas will funnel in water and intensify the storm surge.
The New Jersey Sea Grant Consortium (NJSGC) is an affiliation of colleges, universities and other groups dedicated to advancing knowledge and stewardship of New Jersey’s marine and coastal environment. NJSGC meets its mission through its innovative research, education and outreach programs. For more information about NJSGC, visit njseagrant.org.
33
The Education Program at the
New Jersey Sea Grant Consortium 22 Magruder Road, Fort Hancock, NJ 07732 (732) 872-1300 www.njseagrant.org
UNDERSTANDING STORM SURGE
HOW METEOROLOGISTS PREDICT AND MEASURE STORM SURGE
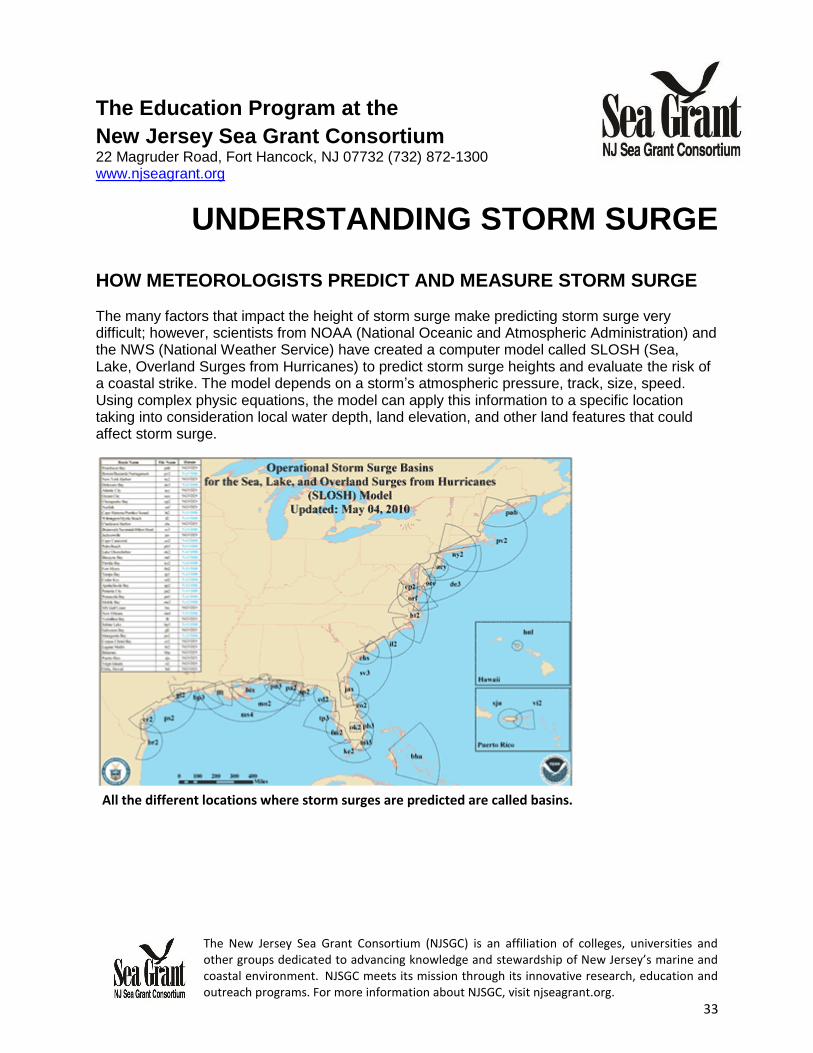
The many factors that impact the height of storm surge make predicting storm surge very difficult; however, scientists from NOAA (National Oceanic and Atmospheric Administration) and the NWS (National Weather Service) have created a computer model called SLOSH (Sea, Lake, Overland Surges from Hurricanes) to predict storm surge heights and evaluate the risk of a coastal strike. The model depends on a storm’s atmospheric pressure, track, size, speed. Using complex physic equations, the model can apply this information to a specific location taking into consideration local water depth, land elevation, and other land features that could affect storm surge.
All the different locations where storm surges are predicted are called basins.
The New Jersey Sea Grant Consortium (NJSGC) is an affiliation of colleges, universities and other groups dedicated to advancing knowledge and stewardship of New Jersey’s marine and coastal environment. NJSGC meets its mission through its innovative research, education and outreach programs. For more information about NJSGC, visit njseagrant.org.
34
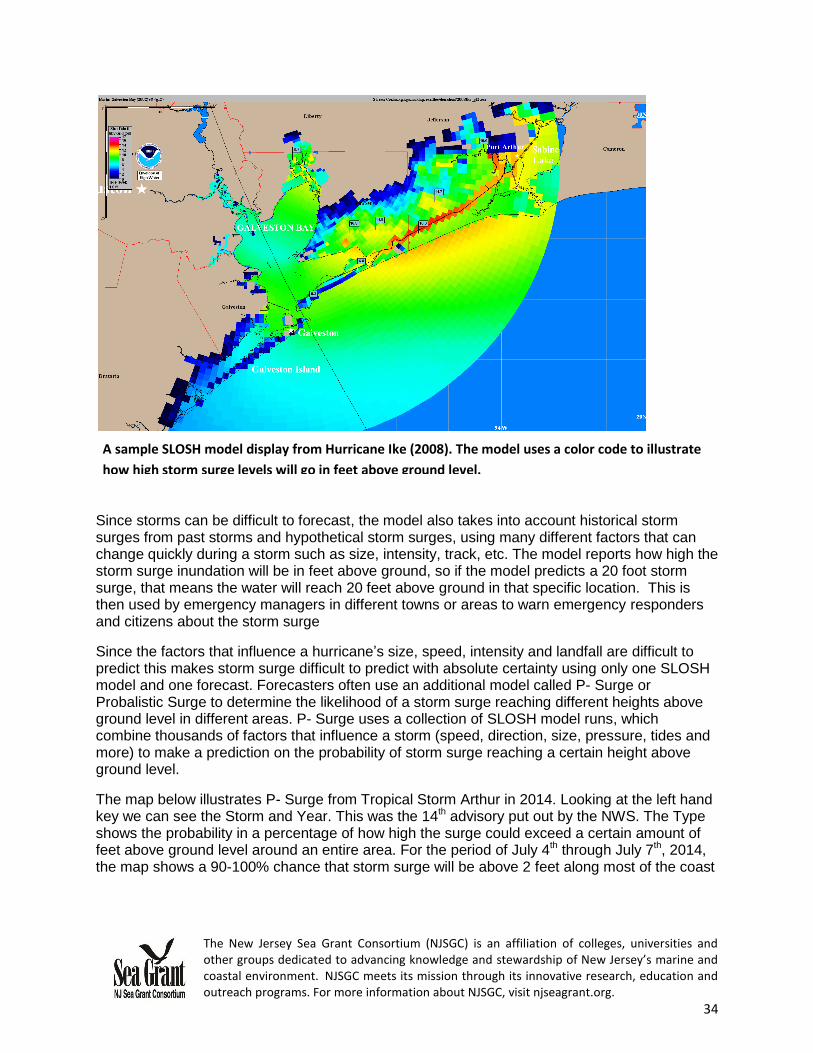
Since storms can be difficult to forecast, the model also takes into account historical storm surges from past storms and hypothetical storm surges, using many different factors that can change quickly during a storm such as size, intensity, track, etc. The model reports how high the storm surge inundation will be in feet above ground, so if the model predicts a 20 foot storm surge, that means the water will reach 20 feet above ground in that specific location. This is then used by emergency managers in different towns or areas to warn emergency responders and citizens about the storm surge
Since the factors that influence a hurricane’s size, speed, intensity and landfall are difficult to predict this makes storm surge difficult to predict with absolute certainty using only one SLOSH model and one forecast. Forecasters often use an additional model called P- Surge or Probalistic Surge to determine the likelihood of a storm surge reaching different heights above ground level in different areas. P- Surge uses a collection of SLOSH model runs, which combine thousands of factors that influence a storm (speed, direction, size, pressure, tides and more) to make a prediction on the probability of storm surge reaching a certain height above ground level.
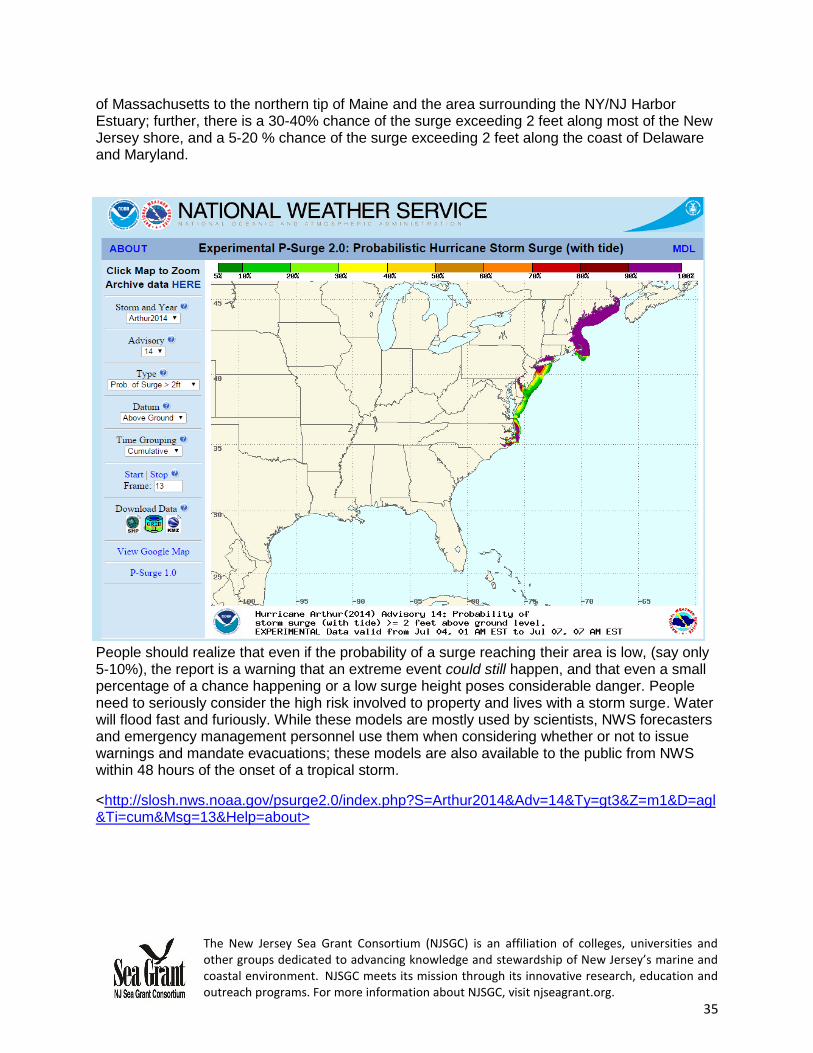
The map below illustrates P- Surge from Tropical Storm Arthur in 2014. Looking at the left hand key we can see the Storm and Year. This was the 14th advisory put out by the NWS. The Type shows the probability in a percentage of how high the surge could exceed a certain amount of feet above ground level around an entire area. For the period of July 4th through July 7th, 2014, the map shows a 90-100% chance that storm surge will be above 2 feet along most of the coast
A sample SLOSH model display from Hurricane Ike (2008). The model uses a color code to illustrate
how high storm surge levels will go in feet above ground level.
The New Jersey Sea Grant Consortium (NJSGC) is an affiliation of colleges, universities and other groups dedicated to advancing knowledge and stewardship of New Jersey’s marine and coastal environment. NJSGC meets its mission through its innovative research, education and outreach programs. For more information about NJSGC, visit njseagrant.org.
35
of Massachusetts to the northern tip of Maine and the area surrounding the NY/NJ Harbor Estuary; further, there is a 30-40% chance of the surge exceeding 2 feet along most of the New Jersey shore, and a 5-20 % chance of the surge exceeding 2 feet along the coast of Delaware and Maryland.
People should realize that even if the probability of a surge reaching their area is low, (say only 5-10%), the report is a warning that an extreme event could still happen, and that even a small percentage of a chance happening or a low surge height poses considerable danger. People need to seriously consider the high risk involved to property and lives with a storm surge. Water will flood fast and furiously. While these models are mostly used by scientists, NWS forecasters and emergency management personnel use them when considering whether or not to issue warnings and mandate evacuations; these models are also available to the public from NWS within 48 hours of the onset of a tropical storm.
<http://slosh.nws.noaa.gov/psurge2.0/index.php?S=Arthur2014&Adv=14&Ty=gt3&Z=m1&D=agl&Ti=cum&Msg=13&Help=about>
The New Jersey Sea Grant Consortium (NJSGC) is an affiliation of colleges, universities and other groups dedicated to advancing knowledge and stewardship of New Jersey’s marine and coastal environment. NJSGC meets its mission through its innovative research, education and outreach programs. For more information about NJSGC, visit njseagrant.org.
36
The Education Program at the
New Jersey Sea Grant Consortium 22 Magruder Road, Fort Hancock, NJ 07732 (732) 872-1300 www.njseagrant.org
UNDERSTANDING STORM SURGE
WHY SHOULD YOU CARE ABOUT UNDERSTANDING STORM SURGE?
Many people think winds are the most damaging and dangerous part a hurricane; however, storm surge is by far the most dangerous, destructive, and deadly part of a storm. It is the leading cause of death during a storm. In addition to the impact of surge water itself, water levels will climb even higher when combined with high tide. Directly along the shore, large waves are powerful enough to knock down buildings, roadways, and wash away the land.
Storm surge warnings are not about how you will be affected by wind, but how you will be affected by flood waters. Storm surge water can reach areas not affected by a storm’s wind. People are able to hide in their home or other nearby structures to be safe from a storm’s wind; however, it is much harder to escape when surge water enters a home.
Most emergency vehicles are not built to withstand surging flood waters so during a storm surge, a rescue is not possible. It is even difficult for a boat to attempt a rescue in fast and furious storm surge. There is almost no chance of being rescued from a storm surge until the storm has passed, and even then flood waters can still be a danger to lives.
WHAT SHOULD YOU DO IF YOU HEAR A STORM MIGHT HIT THE AREA YOU LIVE IN?
Pay attention to warnings to avoid severe damage to your property and your life! Listen and monitor a storm at www.weather.gov and/or listen to local radio and TV for storm watches, warnings, and mandated evacuations. Some social media sites can also be useful to find storm information and warnings. These include NOAA, National Weather Service, National Hurricane Center, FEMA, and the Red Cross who all have Facebook and Twitter pages.
Make an evacuation plan for you and your family. Where will you go? What will you do with pets? Which documents should you take? See these websites for how to prepare and plan.
<www.ready.gov> <http://hurricanesafety.org/>
<http://www.nws.noaa.gov/os/hurricane/resources/TropicalCyclones11.pdf>
<http://www.stormsurge.noaa.gov/preparedness-whattodo.html>
Storm surge watches and warnings for the public, separate from other cyclone/hurricane warnings, are being developed by NOAA and are being tested in the year 2016. Stay tuned! Stay safe!

The New Jersey Sea Grant Consortium (NJSGC) is an affiliation of colleges, universities and other groups dedicated to advancing knowledge and stewardship of New Jersey’s marine and coastal environment. NJSGC meets its mission through its innovative research, education and outreach programs. For more information about NJSGC, visit njseagrant.org.
37
The Education Program at the
New Jersey Sea Grant Consortium 22 Magruder Road, Fort Hancock, NJ 07732 (732) 872-1300 www.njseagrant.org
UNDERSTANDING STORM SURGE
NOAA’S TOP 10 TIPS FOR BEING READY FOR A STORM SURGE
<http://www.nhc.noaa.gov/surge/StormSurgeCanBeDeadly10tips-single.pdf>
1. Storm surge is often the greatest threat to life and property from a hurricane. It poses a significant threat for drowning. A mere six inches of fast-moving flood water can knock over an adult. It takes only two feet of rushing water to carry away most vehicles — including pickups and SUVs.
2. Storm surge can cause water levels to rise quickly and flood large areas — sometimes in just minutes, and you could be left with no time to take action if you haven’t already evacuated as instructed.
3. Storm surge values do not correspond well to the hurricane wind categories (of the Saffir-Simpson Hurricane Wind Scale) that range from 1 to 5. These categories are based only on winds and do not account for storm surge.
4. Tropical storms, category 1 or 2 hurricanes, major (category 3 to 5) hurricanes, and post-tropical cyclones can all cause life-threatening storm surge.
5. Storm surge can also occur with non-tropical storms like Nor’easters and other winter storms.
6. Many U.S. Gulf and East Coast areas are vulnerable to storm surge, including areas up to several miles inland from the coastline. Find out today, well before a hurricane ever approaches, if you live in a storm surge evacuation zone.
7. Storm surge can occur before, during, or after the center of a storm passes through an area. Storm surge can sometimes cut off evacuation routes, so do not delay leaving if an evacuation is ordered for your area.
8. During the peak of a storm surge event, it is unlikely that emergency responders will be able to reach you if you are in danger.
9. Even if your community is not directly affected by storm surge, it could experience other hazards from the storm and face dangerous conditions such as impassable roads, water and sewage problems, and power outages. If power remains on, downed electrical wires can pose an electrocution risk.
10. Weather conditions and the forecast can change. Local officials could issue evacuation or other instructions for many reasons. Always follow the instructions of local officials.

The New Jersey Sea Grant Consortium (NJSGC) is an affiliation of colleges, universities and other groups dedicated to advancing knowledge and stewardship of New Jersey’s marine and coastal environment. NJSGC meets its mission through its innovative research, education and outreach programs. For more information about NJSGC, visit njseagrant.org.
38
The Education Program at the
New Jersey Sea Grant Consortium
22 Magruder Road, Fort Hancock, NJ 07732 (732) 872-1300 www.njseagrant.org
UNDERSTANDING STORM SURGE
REFERENCES
<http://www.hurricanescience.org/society/impacts/stormsurge/>
<http://www.nhc.noaa.gov/surge/surge_intro.pdf>
<http://www.wunderground.com/hurricane/surge_misconceptions.asp?&MR=1>
<http://slosh.nws.noaa.gov/psurge2.0/index.php?S=Arthur2014&Adv=14&Ty=gt3&Z=m1&D=ag
l&Ti=cum&Msg=13&Help=about>
<http://www.nws.noaa.gov/om/hurricane/resources/surge_intro.pdf>
<http://geography.about.com/od/climate/a/windpressure.htm>
<http://www.carolina.com/teacher-resources/Interactive/modeling-the-coriolis-effect/tr10643.tr
<http://education.nationalgeographic.org/encyclopedia/storm-surge/>
<http://secoora.org/classroom/virtual_hurricane/surge_of_the_storm>
<http://www.bom.gov.au/cyclone/about/stormsurge.shtml>
ACKNOWLEDGEMENTS
This publication is the result of work sponsored by New Jersey Sea Grant with funds from the National
Oceanic and Atmospheric Administration (NOAA) Office of Sea Grant, U.S. Department of Commerce,
under NOAA grant #NA10OAR4170075 and the New Jersey Sea Grant Consortium. The statements,
findings, conclusions, and recommendations are those of the author(s) and do not necessarily reflect the
views of New Jersey Sea Grant or the U. S. Department of Commerce. NJSG-16-899