Embed Size (px)
Citation preview

Understanding Parkinson’s Disease: Model Based Approach
Venkatesh Atul Bhattaram*,
Ohid Siddiqui¶, Joga Gobburu**- Pharmacometrics, OCP, CDER/FDA
¶- Biometrics, OB, CDER/FDA

Acknowledgements• External
– Clinical• Stanley Fahn MD, Parkinson’s Study Group• Karl Kieburtz MD, NET-PD Steering Committee
– Statistics• David Oakes PhD, University of Rochester• Jordan Elm MS, Medical University of South Carolina
– Programmer• Arthur Watts BS, University of Rochester

Acknowledgements• Internal
– Robert Temple MD, Associate Director for Medical Policy
– Division of Neuropharmacological Drug Products• Russell Katz MD, John Feeney MD, Leonard Kapcala
MD– Office of Biostatistics
• Jim Hung PhD– OCP/DCP-1
• Mehul Mehta PhD, Ramana Uppoor PhD– Pharmacometrics Group, OCP

• The objective of this part of the presentation is to exemplify the application of disease models. Trial design and endpoints will be discussed at a future meeting.

Impetus• Drugs to slow the progression of diseases such as
Parkinson’s, Alzheimer’s are under development.
• Innovative trial designs/endpoints/analyses with model based statistical methodologies being proposed to discern ‘protective drug effect’.
• FDA is asked to comment on the acceptability of these trial designs and pre-specified analyses.– Critical to understand disease/baseline characteristics,
disease progression, placebo/drug effects, and statistical issues (Missing data, etc).

Initial ThoughtsDec 04
Concept DevelopmentJan 05
1st Internal MeetingFeb 05
Data CollectionSep 05
OCP/OB GroupDec 05
2nd Internal MeetingOct 05
Preliminary M/SMarch 05
3rd Internal MeetingApril 20, 06
4th Internal MeetingAug 2nd, 06
CPSCOct 06
DIAJan 07
Clinical/StatSpring 07
ACCP SymposiumSep 05

Single point analysis will not differentiate between protective and symptomatic effects
Unified Parkinson Disease Rating Scale (UPDRS) The UPDRS is a rating tool to follow the longitudinal course of Parkinson's Disease. It is made up of the 1) Mentation, Behavior, and Mood, 2) ADL and 3) Motor sections. These are evaluated by interview. 199 represents the worst (total) disability), 0--no disability.

2Extract Clinical Trial Information*
• BASELINE EFFECT/ MODEL
• PLACEBO MODEL
• DROP-OUT MODEL
• DESIGN
• PATIENT DEMOGRAPHICS
MECHANISM-SYMPTOMS-OUTCOMES
1IDENTIFY KEY QUESTION(S)
Build Disease & Drug Model
TIME
4Plug Sponsor Data,
Play & Decide (Go/No Go, trial design)
• TRIAL DESIGN
• PATIENT SELECTION
• SAMPLE SIZE
• SAMPLING TIMES
• ENDPOINTS, ANALYSIS
3Simulate Scenarios
UPDATE
Modeling CycleModeling Cycle
* Variety of model validation approaches were employed

Key Scientific Questions1. What are the influential demographic factors
influencing the baseline clinical scores and progression?
2. How do we describe the progression of Parkinson’s disease (Linear/Nonlinear)?
3. Why patients drop-out of these trials?

Parkinson’s Disease Database
Data Source #Patients Trial Duration
Trial#1 NDA 400 1yr + 3yr follow-up
Trial#2 External 400 1yr + follow-up
Trial#3 NDA 900 9mo + follow-up
Trial#4 NDA 200 9mo + follow-up
Trial#5 External 300 1.5yr

Patient Population Model

Demographics
• Influence of various demographics such as age, gender, disease duration, smoking, caffeine intake on baseline UPDRS scores were evaluated using regression techniques.

Disease Progression Characteristics

Mean (SD) of Total UPDRS scores for patients with Parkinson’s disease treated with levodopa alone or in combination with selegiline for 5 years and during the one-month washout period
Selegiline
Eur.J.Neurology, 1999, 6: 539-547

Mean (SD) of Total UPDRS scores for patients with Parkinson’s disease treated with levodopa alone or in combination with pramipexole for 4 years
Levodopa, Pramipexole
Arch.Neurology, 2004, 61: 1044-1053
Time, months

Creatine-Minocycline
Neurology, 2006, 66: 664-671
Mean (SD) of Total UPDRS scores for patients treated with placebo, creatine, minocycline for 52 weeks.

Disease progression model describes typical observed well

Disease progression model describes observed distribution well
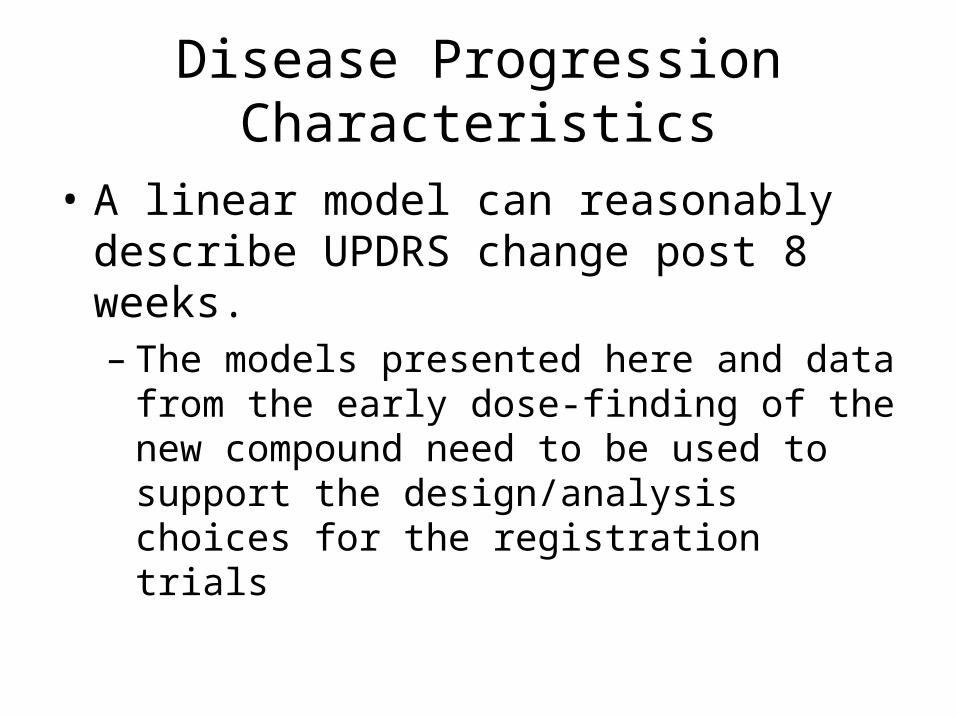
Disease Progression Characteristics
• A linear model can reasonably describe UPDRS change post 8 weeks.– The models presented here and data from the
early dose-finding of the new compound need to be used to support the design/analysis choices for the registration trials

Missing Data Mechanism

Understanding why patients drop-out of Parkinson’s trials
• Clearly patients who discontinued early had worse symptoms compared to those who stayed.
• Graphical displays were generated to understand the drop-out pattern.– UPDRS scores in patients who discontinued for
example in 0-16 versus 16-32 weeks were compared
• Specific risk factor for drop-outs (Parametric Hazard Models)– Δ UPDRS at last observed visit?
• Relative to baseline or previous visit?– Rate of Δ between first and last observed visit?

Higher scores lead to early treatment discontinuation
Rescuemedication
Time,

Is probability of drop-out related to change in scores from baseline visit?
Duration=20 weeks
Δ = 8 units
Time,
Duration adjusted UPDRS change

Is probability of drop-out related rate of change in scores from previous visit?
Δ = 6 units
2 weeks
Time,

Is probability of drop-out related to slope?
Time,
Slope

Drop-model: ValidationModel systematically deviates from observed

Drop-model: ValidationModel reproduces observed well

Summary of drop-out modeling
• Predominant reason for drop-out worsening of symptoms – Duration adjusted change and rate of change in
UPDRS scores from previous visit are principal determinants of discontinuation
• Validation to ensure the model predicts discontinuation rates well across varied trial designs (fixed vs. titration dosing) is in progress

Statistical Issues in Model Based Analysis and Simulations

Key Statistical Questions• Does a linear disease progression model
reasonably describe change in UPDRS post 8 weeks randomization?
• What are the reasonable trial design and endpoint choices?– What are the false-positive and false-negative rates
of concluding protective effect?
• How do we integrate the clinical pharmacology findings and statistical findings to address regulatory issues?
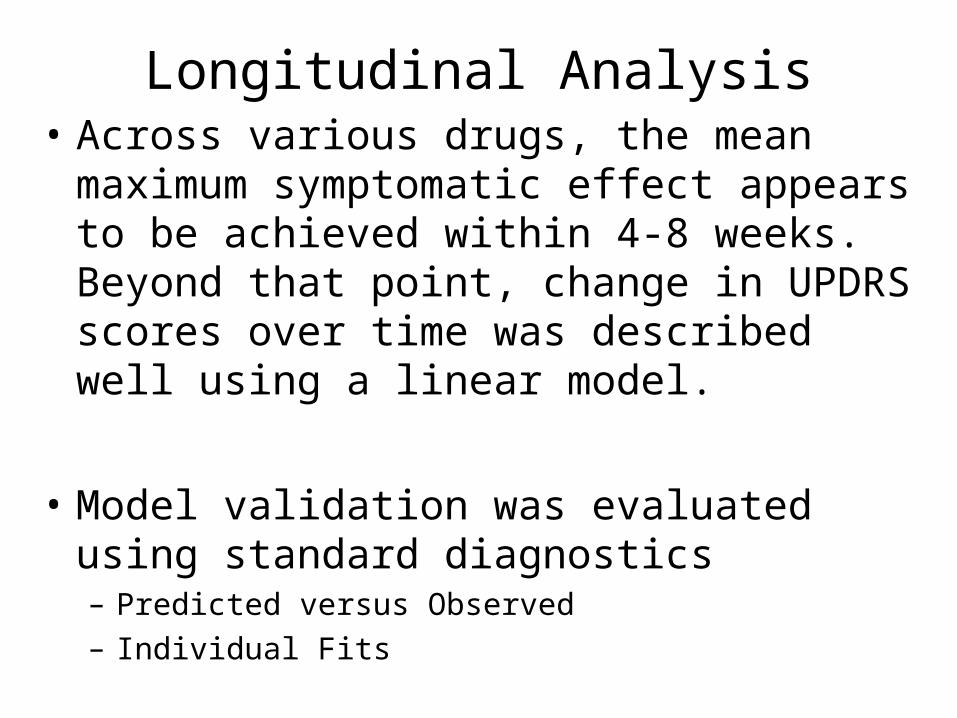
Longitudinal Analysis• Across various drugs, the mean maximum
symptomatic effect appears to be achieved within 4-8 weeks. Beyond that point, change in UPDRS scores over time was described well using a linear model.
• Model validation was evaluated using standard diagnostics– Predicted versus Observed– Individual Fits

Delayed start design (Alternate Model)

Explored endpoints to discern protective and symptomatic effects
• Placebo Phase– Compare the slope difference between the
placebo and drug groups at an alpha of 5%
• Active Phase– Compare the least square mean difference of
the placebo (now on drug) and drug groups, using repeated measures at an alpha of 5%

DiseaseDrugTrial
Models
Baseline UPDRS model Drop-out model
Trial design
Disease progression model No protective effect – Null model

• Sample Size : 500• Number of Arms: 2• Allocation : 1:1• Trial Duration : 72 weeks• Placebo Phase : 0-26 weeks• Active Phase : 26-72 weeks• Measurements : 0, 4, 8, 16, 20, 26, 32, 42, 52, 58, 72
weeks• Drop-outs : 30% per arm
Clinical trial simulations of a purely symptomatic drug
We considered three dropout scenarios.
(a) Equal dropouts in both drug and placebo groups
(b) Unequal dropouts (Higher in placebo group vs. drug group)
(c) Dropouts due to need for symptomatic treatment and toxicity leading to treatment discontinuation.

Delayed start design (No protective effect - Null Model)

1 Linear Random-effect regression model2 Repeated measures (MMRM) analyses
Dropout Scenario
Placebo Phase (Slope based Comparison-ITT sample) 1
Active Phase (Endpoint LS Means comparison)2
Available cases
LOCF- ITT sample
Dropout not related to drug or disease
5.20 5.00 5.80
Dropout due to lack of effectiveness (equal drop-outs)
5.15 16.35 22.60
Dropout due to lack of effectiveness (unequal drop-outs)
4.95 7.55 11.50
Dropout due to lack of effectiveness and/or toxicity
4.70 12.25 29.15
Dropout due to unobserved outcomes of the trial
6.05 30.15 40.60
Type-I Error rate Under Null (no protective effect) Model
• Placebo phase preserves Type I error rate

Manage and Leverage Knowledge
Knowledge
Placebo & Disease Models
Information
• Demographics • Time course• Drop-out• Drug Effects
Translation to recommendingprimary statistical analysis methodology for disease modifying agents in Parkinson’sdisease.

Questions to the Subcommittee
• Is the overall approach to quantifying various part of the disease models reasonable?
• Is the approach to qualifying the models reasonable?
• What appropriate forum does the committee suggest for sharing these advances with the public?