Embed Size (px)
Citation preview
RESEARCH ARTICLE
Understanding Genetic Diversity andPopulation Structure of a Poa pratensisWorldwide Collection through Morphological,Nuclear and Chloroplast Diversity AnalysisLorenzo Raggi1☯, Elena Bitocchi2☯, Luigi Russi1, Gianpiero Marconi1, Timothy F. Sharbel3,Fabio Veronesi1, Emidio Albertini1*
1 Dipartimento di Scienze Agrarie, Alimentari e Ambientali, Università degli Studi di Perugia, Perugia, Italy,2 Dipartimento di Scienze Agrarie, Alimentari ed Ambientali, Università Politecnica delle Marche, Ancona,Italy, 3 Department of Cytogenetics and Genome Analysis, Apomixis Research Group, Leibniz Institute ofPlant Genetics and Crop Plant Research (IPK), Gatersleben, Germany
☯ These authors contributed equally to this work.* [email protected]
AbstractPoa pratensis L. is a forage and turf grass species well adapted to a wide range of mesic to
moist habitats. Due to its genome complexity little is known regarding evolution, genome
composition and intraspecific phylogenetic relationships of this species. In the present
study we investigated the morphological and genetic diversity of 33 P. pratensis accessionsfrom 23 different countries using both nuclear and chloroplast molecular markers as well as
flow cytometry of somatic tissues. This with the aim of shedding light on the genetic diversity
and phylogenetic relationships of the collection that includes both cultivated and wild materi-
als. Morphological characterization showed that the most relevant traits able to distinguish
cultivated from wild forms were spring growth habit and leaf colour. The genome size analy-
sis revealed high variability both within and between accessions in both wild and cultivated
materials. The sequence analysis of the trnL-F chloroplast region revealed a low polymor-
phism level that could be the result of the complex mode of reproduction of this species. In
addition, a strong reduction of chloroplast SSR variability was detected in cultivated materi-
als, where only two alleles were conserved out of the four present in wild accessions. Con-
trarily, at nuclear level, high variability exist in the collection where the analysis of 11 SSR
loci allowed the detection of a total of 91 different alleles. A Bayesian analysis performed on
nuclear SSR data revealed that studied materials belong to two main clusters. While wild
materials are equally represented in both clusters, the domesticated forms are mostly be-
longing to cluster P2 which is characterized by lower genetic diversity compared to the clus-
ter P1. In the Neighbour Joining tree no clear distinction was found between accessions
with the exception of those from China and Mongolia that were clearly separated from all
the others.
PLOS ONE | DOI:10.1371/journal.pone.0124709 April 20, 2015 1 / 22
OPEN ACCESS
Citation: Raggi L, Bitocchi E, Russi L, Marconi G,Sharbel TF, Veronesi F, et al. (2015) UnderstandingGenetic Diversity and Population Structure of a PoapratensisWorldwide Collection throughMorphological, Nuclear and Chloroplast DiversityAnalysis. PLoS ONE 10(4): e0124709. doi:10.1371/journal.pone.0124709
Academic Editor: Manoj Prasad, National Institute ofPlant Genome Research, INDIA
Received: November 18, 2014
Accepted: March 8, 2015
Published: April 20, 2015
Copyright: © 2015 Raggi et al. This is an openaccess article distributed under the terms of theCreative Commons Attribution License, which permitsunrestricted use, distribution, and reproduction in anymedium, provided the original author and source arecredited.
Data Availability Statement: All relevant data arewithin the paper and its Supporting Information files.
Funding: The research was funded by the ItalianMinistry of Education and Scientific Research (MIUR)“Genetic aspects of seed production: genomic andfunctional characterization of candidate genes forapomictic reproduction” and by the Dipartimento diScienze Agrarie Alimentari e Ambientali of Universitàdegli Studi di Perugia. The funders had no role instudy design, data collection and analysis, decision topublish, or preparation of the manuscript.
IntroductionPoa pratensis L., also known as Kentucky bluegrass, is a hardy, persistent, and attractive forageand turf grass species that is well adapted to a wide range of mesic to moist habitats. It belongsto the Poaceae (subfamily Pooideae, tribe Poacea), a family with more than 500 described spe-cies [1] and can hybridize with P. secunda, P. arctica, P. alpina, P. nervosa, P. reflexa and P.palustris [2] to form allopolyploids, many of which are facultative apomicts [3]. Hybridizationis hypothetically facilitated by apomixis, as asexual reproduction provides an escape from thetypical reproductive problems associated with unbalanced or mixed genomes. Bashaw andFunk [4] suggested that the great adaptiveness of this species is likely associated with its vari-able ploidy, ranging from 2n = 22 [5] to 2n = 147 [6], and its versatile mode of reproduction[7]. In fact the perpetuation of a single genotype through apomixis is an advantage in deter-mining the P. pratensis circumpolar distribution [8] while sexual reproduction represent animportant source of new genetic variation [3,9]. Studying a core collection of this species,Wieners and collaborators reported that the majority of the populations contained facultativeapomicts (with a combination of reduced, zygotic and unreduced, parthenogenic embryo pro-duction), in addition to obligate sexual or obligate apomictic accessions [10].
An allopolyploid origin of P. pratensis is supported by its great polyploid and aneuploidvariation, a consequence of which is that little is known regarding its evolution, genome com-position and intraspecific phylogenetic relationships. Based on morphological, cytologicaland species diversity, it is generally accepted that P. pratensis originated mainly from Europeand Asia [11,12], followed by introduction to North America by European settlers in theSeventeenth Century [13]. According to other authors, some populations found in remotemountain meadows of western USA or the Appalachian mountains might be considered native[14,15] together with some ecotypes identified in the Rocky Mountains [16]. As karyology is bydefinition difficult in Poa, flow cytometry has been employed to investigate its genome size[10,17,18] and of other turfgrass species [19]. Since variation in DNA content may not be ac-counted for using different molecular markers, but may nonetheless have a significant role indetermining the ultimate phenotype, this rapid and inexpensive method is useful in polyploids[10]. In addition genome size per se has adaptive significance influencing the phenotype by theexpression of its genic content and by the physical effects of its mass and/or volume [20], andmay additionally affect cross compatibility between genotypes. Finally, in angiosperms, DNAamount can correlate with a several relevant characters such as minimum generation time andecological behaviour [18], and therefore deserves some attention in phylogenetic studies.
Kentucky bluegrass cultivars and accessions have previously been characterized using ran-dom amplified polymorphic DNA (RAPD) [21–23], inter-simple sequence repeat (ISSR) [24]and, only very recently, using simple sequence repeats markers (SSR) [25,26]. Although micro-satellites are codominant markers, the difficulty in identifying the number of allele copies inpolyploids limits their use. Here we attempt to overcome this hurdle by investigating the mor-phological and genetic diversity of 33 P. pratensis accessions using flow cytometry, sequencingof the trnL-F chloroplast region, in addition to nuclear and chloroplast microsatellite markers.
Materials and Methods
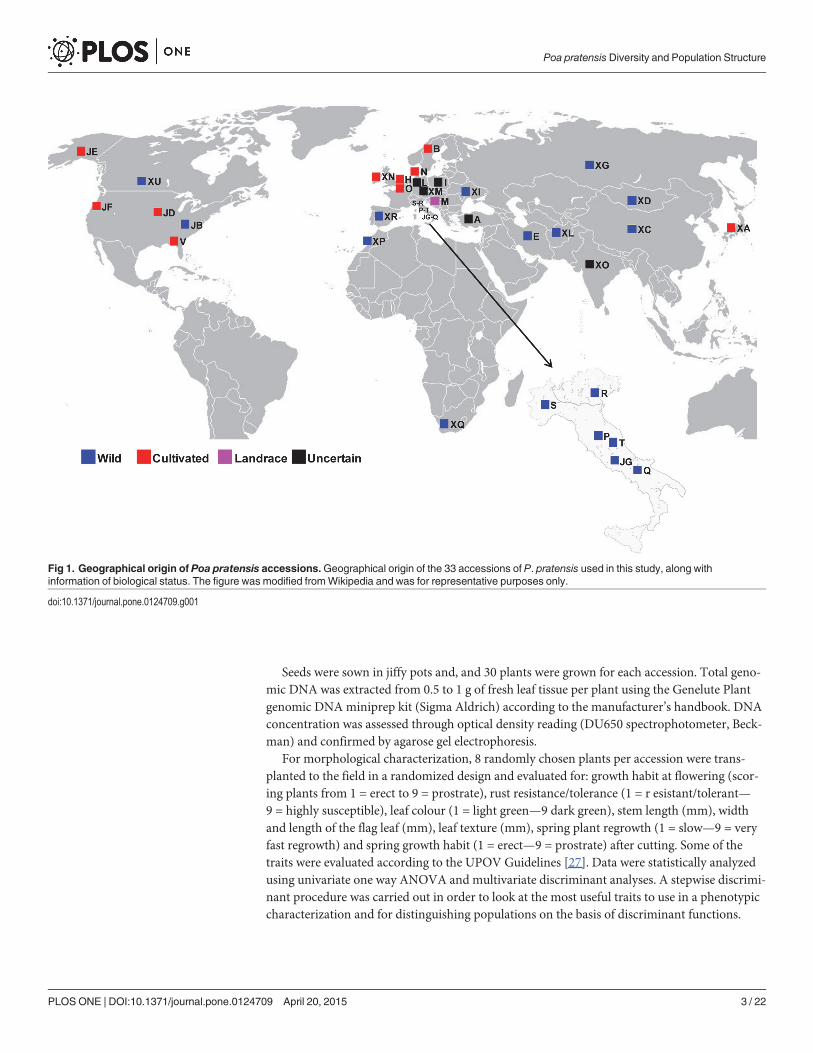
Plant materials, morphological characterization and total DNA extractionThe phenotypic and genomic variability of 33 cultivated and wild accessions of P. pratensisfrom 23 different countries and 4 continents (Europe, Asia, America and Africa) were investi-gated (Fig 1; Table 1).
Poa pratensis Diversity and Population Structure
PLOS ONE | DOI:10.1371/journal.pone.0124709 April 20, 2015 2 / 22
Competing Interests: The authors confirm thatEmidio Albertini is an Academic Editor and that thisdoes not alter the authors' adherence to PLOS ONEEditorial policies and criteria.
Seeds were sown in jiffy pots and, and 30 plants were grown for each accession. Total geno-mic DNA was extracted from 0.5 to 1 g of fresh leaf tissue per plant using the Genelute Plantgenomic DNAminiprep kit (Sigma Aldrich) according to the manufacturer’s handbook. DNAconcentration was assessed through optical density reading (DU650 spectrophotometer, Beck-man) and confirmed by agarose gel electrophoresis.
For morphological characterization, 8 randomly chosen plants per accession were trans-planted to the field in a randomized design and evaluated for: growth habit at flowering (scor-ing plants from 1 = erect to 9 = prostrate), rust resistance/tolerance (1 = r esistant/tolerant—9 = highly susceptible), leaf colour (1 = light green—9 dark green), stem length (mm), widthand length of the flag leaf (mm), leaf texture (mm), spring plant regrowth (1 = slow—9 = veryfast regrowth) and spring growth habit (1 = erect—9 = prostrate) after cutting. Some of thetraits were evaluated according to the UPOV Guidelines [27]. Data were statistically analyzedusing univariate one way ANOVA and multivariate discriminant analyses. A stepwise discrimi-nant procedure was carried out in order to look at the most useful traits to use in a phenotypiccharacterization and for distinguishing populations on the basis of discriminant functions.
Fig 1. Geographical origin of Poa pratensis accessions.Geographical origin of the 33 accessions of P. pratensis used in this study, along withinformation of biological status. The figure was modified fromWikipedia and was for representative purposes only.
doi:10.1371/journal.pone.0124709.g001
Poa pratensis Diversity and Population Structure
PLOS ONE | DOI:10.1371/journal.pone.0124709 April 20, 2015 3 / 22

Flow cytometry analysis of somatic tissueKaryotyping was difficult and inaccurate due to the high numbers of chromosomes and vari-able ploidy levels, hence we estimated genome size through flow cytometric measurements ofrelative total DNA content in somatic tissues. Fifteen plants from each accession were grown ina greenhouse at the Leibniz Institute of Plant Genetics and Crop Plant Research (IPK, Gatersle-ben, Germany), and an average of seven plants were randomly selected for flow cytometry.Nuclei were collected from young leaves of single plants by manual chopping them with arazor blade in the following staining buffer: 100 mM Tris-HCl, 5.3 mMMgCl2, 86 mM NaCl,
Table 1. List of studied accessions.
# Accession name Geographic origin Sources Type of accession Mean DNA content
1 A Turkey PI 119684† Uncertain improvement status 7.3 (14.2)
2 B Sweden PI 198075† Cultivated 9.0 (4.9)
3 E Iran PI 227381† Wild material 7.6 (12.3)
4 H Netherland PI 266209† Prato 8.8 (4.7)
5 I Poland, Lublin PI 274645† Uncertain improvement status 5.7 (8.9)
6 L Germany PI 283959† Uncertain improvement status 9.2 (13.9)
7 M Hungary PI 298096† Landrace 4.91
8 N Denmark PI 303057† Cultivar 6.3 (9.7)
9 O Belgium PI 303061† Cultivar 9.8 (5.5)
10 P Italy, Tuoro (PG) DSA3 3479* Wild material 7.1 (10.3)
11 Q Italy, Rionero Sannitico (IS) DSA3 3481* Wild material 6.4 (9.4)
12 R Italy, Chioggia (VE) DSA3 3484* Wild material 6.8
13 S Italy, Dormelleto (NO) DSA3 3478* Wild material 6.1
14 T Italy, Serravalle del Chienti (MC) DSA3 4678* Wild material 8.0 (11.6)
15 V United States, North Carolina DSA3 5943* PRINCETON -
16 JB United States, New York W6 19117† Wild material 6.9 (8.7)
17 JD United States, Illinois PI 578835† Cultivar 6.8
18 JE United States, Alaska PI 562649† NUGGET 9.7
19 JF United States, Oregon PI 601107† MIDNIGHT 7.5 (12.0)
20 JG Italy, Colle di Tora (RI) DSA3 4676* Wild material -
21 XA Japan PI 438529† Cultivar 7.5
22 XC China PI 618751† Wild material 8.6 (13.2)
23 XD Mongolia PI 618768† Wild material 6.87
24 XG Russian Federation PI 539048† Wild material 6.74
25 XI Ukraine W6 21787† Wild material 7.0 (11.0)
26 XL Afghanistan PI 221949† Wild material 11.3
27 XM Czech Republic PI 286210† Uncertain improvement status 6.4
28 XN United Kingdom PI 349801† MONARCH 8.7
29 XO India PI 355956† Uncertain improvement status 10.9 (12.7)
30 XP Morocco PI 436002† Wild material 7.9
31 XQ South Africa PI 208179† Wild material 8.5 (13.8)
32 XR Spain PI 423139† Wild material 7.2 (11.8)
33 XU Canada, Alberta PI 387935† Wild material 6.3 (11.3)
Accession name, geographic origin, GeneBank accession number, type of accession and mean somatic DNA content (pg) of the majority of plants
sampled (in brackets the mean content of fewer plant within the same accession with a contrasting value).
*DSA3, Dipartimento di Scienze Agrarie, Alimentari e Ambientali.
† USDA GeneBank.
doi:10.1371/journal.pone.0124709.t001
Poa pratensis Diversity and Population Structure
PLOS ONE | DOI:10.1371/journal.pone.0124709 April 20, 2015 4 / 22
0.03 mM sodium citrate, 7.3 mM Triton X-100, 3 μM 4‘-6-diamidino-2-phenylindole (DAPI),pH 7.0. After filtration through nylon tissue (30-μmmesh) to remove large debris the tubeswere stored in the dark on ice for 1 to 4 h before measurement [28]. Fluorescence intensity ofDAPI–stained nuclei was measured on a Ploidy Analyser PA (Partec, Münster, Germany).
For each sample the standardized 2C DNA content was obtained by using the followingequation: position of sample main peak times position of the internal control main peak (a trip-loid Boechera holboellii genotype) divided by mean position of the peak of the internal control.The repeated measure of the internal control over multiple days allowed to standardize themain peak position of each P. pratensis samples. The final DNA quantification in pictogramswas then estimated through a simple linear regression based on four accessions (PI 286210, PI298096, PI 355956 and PI 601107) characterized by Wieners and collaborators [10] and com-mon in both studies (R2 = 0.91, P<0.05). Since individual plants within the same accessionmight show different somatic tissue DNA content, particularly when multiple reproductivepathways occur, standard errors would be misleading and were therefore not calculated [10].Differences between wild, cultivated and accessions with uncertain improvement status wereanalysed by one way ANOVA.
trnL-F region amplification and sequencingA fragment of the chloroplast trnL-F region was PCR amplified from DNA extracted from70 randomly chosen individuals representing all 33 collected accessions using primers “c”(CGAAATCGGTAGACGCTACG) and “f” (ATTTGAACTGGTGACACGAG) of Taberletand collaborators [29]. Ten μl of the PCR products were electrophoresed on a 1.5% (w/v) aga-rose gel and visualized by ethidium bromide staining. Successful amplifications were purifiedusing Qiaquik PCR purification Kit (Qiagen) following manufacture instructions. Sequencingreactions were performed for both DNA strands using the ABI PRISM BigDye TerminatorCycle Sequencing Ready Reaction Kit (Applied Biosystems) on an ABI 3700 genetic analyseraccording to the manufacturer’s instruction. Amplification primers used for PCR were alsoused for sequencing. All sequence alignments were carried out using MEGA version 4 software[30].
trnL-F region CAPS marker development and analysisSince only one Single Nucleotide Polymorphism (SNP) was detected in the chloroplast se-quenced region (see below) we developed a Cleaved Amplified Polymorphic Sequences(CAPS) marker to test the allelic condition at the locus. PCR primers were developed usingPRIMER 3 [31] from multiple alignments of sequences obtained in this study and those re-trieved from public databases, and the restriction endonuclease was selected according to theCAPS differential cleavage sites. The allelic condition for the developed CAPS marker was test-ed on eight individuals randomly chosen from each accession (hereafter population) for a totalof 264 individuals. PCR amplifications were carried out using the developed cpCAPfor andcpCAPrew (Table 2) in a 20 μl volume containing 25 ng genomic DNA, 1× PCR buffer
Table 2. Characteristics of CAPS primer developed.
Primer name Primer sequence (5'-3') Ta (°C) Frag. lenght (bp)
cpCAPfor GCAATCCTGAGCCAAATCCGTGTT 52 429
cpCAPrew ATGGGACTCTCTCTTTGTCCTCGT 54
Primer name, sequence, annealing temperature (Ta) and Fragment (Frag.) length in base pair (bp) of the CAPS primer developed.
doi:10.1371/journal.pone.0124709.t002
Poa pratensis Diversity and Population Structure
PLOS ONE | DOI:10.1371/journal.pone.0124709 April 20, 2015 5 / 22
(Invitrogen), 200 μM dNTPs, 0.5 μg of Bovine Serum Albumin (BSA), 10 pMol of the cpCAPsfand cpCAPsr primers, and 1 U of Taq DNA polymerase (Invitrogen).
All reactions were performed using the following cycling parameters: 94°C for 5 min, fol-lowed by 38 cycles of 94°C for 30 s, 51°C for 30 s, and 72°C for 45 s. Aliquots of 11 μl PCRproduct were digested with 2 units of BsmI in 1× Buffer R for 2 h at 37°C in a total volume of25 μl. After digestion, 15 μl of the reaction was electrophoresed on a 2% (w/v) agarose gel andvisualized by ethidium bromide staining.
Nuclear and chloroplast SSR analysesA total of 11 nuclear and two chloroplast single sequence repeat (SSR) markers were used to ge-notype the 264 P. pratensis samples tested for the CAPS marker allelic condition (Table 3).
Concerning microsatellites derived from P. alpina and P. arachnifera, PCR amplificationwas performed in a total volume of 20 μl containing 30 ng genomic DNA: 1× PCR buffer (NewEngland Biolabs), 200 μM dNTPs, 3,5 pM of the Forward and Reverse primers and 0,75 U of
Table 3. List of nuclear and chloroplast SSR primers.
Primer name Species/family DNA type Primer sequence Total amplified alleles
Poa287 For Poa alpina nuclear 5'-AAGCAGCTCGGTCTCTTTTG-3' 17 *
Poa287 Rev Poa alpina nuclear 5'-TGCAGGCACCCAGATAAAGT-3' *
Poa290 For Poa alpina nuclear 5'-GGAAACCCAGAATCAGCAAA-3' 18 *
Poa290 Rev Poa alpina nuclear 5'-CCATATTGGGAGTTCCTCATC-3' *
Poa310 For Poa arachnifera nuclear 5'-AGTCCCTTTACGGTTTACCT-3' - *
Poa310 Rev Poa arachnifera nuclear 5'-CCATATACCGGTGTCTTCTC-3' *
Poa406 For Poa arachnifera nuclear 5'-CTACCTGTCAGTCTCAAGGC-3' - *
Poa406 Rev Poa arachnifera nuclear 5'-ATACATTCCCGTAAATGGA-3' *
Poa414 For Poa arachnifera nuclear 5'-GTGGATCAGAATGGGTGCTT-3' 10 *
Poa414 Rev Poa arachnifera nuclear 5'-AAGCAGGCATGGTCAGAATC-3' *
Poa416 For Poa arachnifera nuclear 5'-AGATGCAATAAGGCGAATGG-3' 3 *
Poa416 Rev Poa arachnifera nuclear 5'-AGGGTCTTGGGCTTGTTCTT-3' *
Poa420 For Poa arachnifera nuclear 5'-GGAAGTCCGCACTTGACAAT-3' 2 *
Poa420 Rev Poa arachnifera nuclear 5'-GCGCTTGAAGCAAACAATCT-3' *
Poa410 For Poa arachnifera nuclear 5'-TACAGAGGCCAGGGTTTCAC-3' 10 *
Poa410 Rev Poa arachnifera nuclear 5'-AGCTTGGAGCATGTCAGAGG-3' *
Poa415 For Poa arachnifera nuclear 5'-GTCACCTTGAAGCACGGTTT-3' 18 *
Poa415 Rev Poa arachnifera nuclear 5'-TCTAGCTGCAGGTGAGATGC-3' *
AE5 For Poa pratensis nuclear 5'-TCTCCCTCATAACCTAACAGAATTA-3' 12 †
AE5 Rev Poa pratensis nuclear 5'-GAGAAGGCATCTGTAAATGATACAG-3' †
AE11 For Poa pratensis nuclear 5'-TCTAGGAAGAAGGTGATATAA-3' 1 †
AE11 Rev Poa pratensis nuclear 5'-GCCTCGGGCAGCCCCACG-3' †
rpoC2 For Poaceae chloroplast 5'-TTATTTATTTCAAAGCTATTTCGG-3' 1 +
rps2 Rev Poaceae chloroplast 5'-AATATCTTCTTGTCATTTTTTCC-3' +
atpB For Poaceae chloroplast 5'-GATTGGTTCTCATAATTATCAC-3' 4 +
rbcL Rev Poaceae chloroplast 5'-TATTGAATTAACTAATTCATTTCC-3' +
Primer name, species or family for which primer were originally developed, DNA type amplified, primer sequences and total amplified alleles of nuclear
and chloroplast SSR primer used in the study.
* Bryan K Kindiger, Agricultural Research Service (USDA), personal communication.
† Albertini et al. 2003.
+ Provan et al. 2004.
doi:10.1371/journal.pone.0124709.t003
Poa pratensis Diversity and Population Structure
PLOS ONE | DOI:10.1371/journal.pone.0124709 April 20, 2015 6 / 22
Taq DNA polymerase (New England Biolabs). Since primer were not originally developed forP. pratensis a touchdown PCR method was used to optimize yield of amplified DNA and am-plification specificity [32]. The reactions were performed using the same cycling parameters:94°C for 3 min, followed by 10 cycles of 92°C for 30 s, 58°C for 40 s (decreasing of 0.7°C foreach cycle) and 72°C for 60 s and 25 cycles of 92°C for 30 s, 50°C for 30 s and 72°C for 60 s. Allothers amplifications were performed in a total volume of 12 μl containing 15 ng genomicDNA: 1× PCR buffer (Sigma Aldrich), 1.5 mMMgCl2, 200 μM dNTPs, 4 pM of the Forwardand Reverse primer and 0,75 U of Taq DNA polymerase (Sigma Aldrich). The following PCRcycling parameters were used: 94°C for 3 min, 35 cycles of 94°C for 30 s, 56°C for 30 s, 72°C for30 s, and an extension final step of 72°C for 20 min. Amplification products were resolved andanalyzed with an ABI 3100 Genetic Analyzer (Applied Biosystems), using Dye Set G5 (ABI) la-belled primers. Size calculation and data record of generated amplicons were performed usingGeneMapper 3.0 software (Applied Biosystems).
Population structure analysisConsidering variable ploidy in P. pratensis and the fact that it was not possible to infer relativedosage of PCR products, nuclear SSR alleles were scored as dominant markers (i.e. presence/absence of amplicons). We carried out the analysis by using the software STRUCTURE ver.2.3.4 [33,34] to investigate the genetic population structure of the 264 P. pratensis individualsfrom 33 populations. This software has been successfully used to evaluate genetic structure ofindividuals on different apomictic species, such as for example those belonging to Crataegus,Brachiaria, Panicum, Taraxacum, and Paspalum genera [35–39]. The approach uses a MarkovChain Monte Carlo (MCMC) algorithm to group individuals into populations (clusters) on thebasis of multilocus genotype data [33,34]. In this study the procedure that accounts appropri-ately for the genotypic ambiguity inherent in dominant markers [40] was followed. The num-ber of clusters (K) was estimated by carrying out ten independent runs for each K (from 1 to10), using 30,000 MCMC repetitions and 30,000 burn-in periods, assuming correlated allelefrequencies (Run 1). No a priori population information was used. The percentage of member-ship (q) of each individual in each of the inferred K clusters was computed by one additionalSTRUCTURE run for 100,000 MCMC repetitions and 100,000 burn-in periods (Run 2).
Two different approaches were used to set the number of clusters (K), the ad hoc statisticΔK [41] and the change in H’ (average symmetric similarity coefficient) from CLUMPP soft-ware [42]. The latter indicates the goodness of fit to assign each individual to a given cluster(s),consistently across STRUCTURE independent runs. For each K, the results of Run 2 were com-pared with those obtained by merging the 10 initial STRUCTURE simulations (Run 1) usingthe CLUMPP software. CLUMPP was used with the Greedy Algorithm method.
Data on chloroplast DNA variation for both cpSSR (atpB-rbcL) and CAPS marker (trnL-F)were used to classify individuals into different groups on the basis of their relative alleles.
Genetic diversity and phylogeographic analysisGenetic diversity analysis was carried out using i) the nuclear SSR raw data of the 33 popula-tions and ii) the clusters identified by the software STRUCTURE. For the former analysis, thegene diversity Hj, analogous to the unbiased expected heterozygosity He [43], was computedfrom allele frequencies estimated following the approach of Lynch &Milligan [44]. The esti-mates were obtained by AFLPSURV [45], a software using a Bayesian method based on a non-uniform prior distribution of the allele frequencies [46], and able to produce unbiased esti-mates in dominant markers [47]. For the latter analysis, the FK parameter for each of the Kclusters [34] was estimated using the software STRUCTURE. The parameter FK represents the
Poa pratensis Diversity and Population Structure
PLOS ONE | DOI:10.1371/journal.pone.0124709 April 20, 2015 7 / 22
estimated drift from the inferred common ancestor of all populations, thus similar to FST butspecific for each cluster and expected to be proportional to the divergence from a common an-cestral population. A low FK value indicates little drift away from the ancestral state. TheTukey-Kramer HSD (Honestly significant difference) procedure was used to test for differencesin gene diversity estimates among the 33 populations, while the Wilcoxon signed-ranks non-parametric test for two groups, arranged for paired observations, (i.e. one pair of estimates foreach locus) [48], and Bonferroni correction for multiple comparisons was used to test for sig-nificant differences among clusters identified by STRUCTURE analyses.
Finally, to further shed light on the relationships among populations, a consensus NJ treebased on FST estimates between the 33 populations was obtained; 500 matrices of FST werecomputed by bootstrapping over loci by using AFLP-SURV [45] on the basis of allele frequen-cies estimated by the Zhivotovsky [46] approach. The CONSENSE procedure implemented inthe PHYLIP software package [49] was used to infer bootstrap values.
Correlation testsThe association between the clusters, as obtained by a genetic diversity analysis at nuclear SSR,and the chloroplast data, for both cpSSR (atpB-rbcL) and CAPS marker (trnL-F), was testedby analysis of contingency tables with the likelihood ratio chi-squared (χ2) test. To evaluatewhether the nuclear DNA content was significantly associated with membership coefficients ofidentified K clusters and alleles of chloroplast markers a bivariate and one way analysis wereperformed. Finally, a correlation between morphological traits and DNA content was carriedout on mean population values. All the test were performed using the JMP 8.0 software (SASInstitute Inc. 2008, Cary, NC, USA).
Results
Morphological characterizationThe phenotypic characterization of 32 P. pratensis populations (no plants of XD accession sur-vived transplanting) showed highly significant differences for each of the examined traits(P<0.001; Table 4).
When populations of known origin were separated into cultivated and wild groups, traitssuch as spring growth habit, leaf colour, leaf texture and spring regrowth, showed significantdifferences (P<0.05), with cultivated accessions more prostrate, more tolerant to rust, having adarker green colour and slower spring regrowth as compared to wild accessions (Table 4).Stem length, a trait normally used to characterize a variety for registration procedures, washigher in wild compared to cultivated populations. Leaf texture and width of the flag leaf werehigher in cultivated accessions, while no statistical significances were found for inflorescencepigmentation and flag leaf length (Table 4).
The stepwise discriminant procedure included all recorded traits and increased in each stepthe averaged scored canonical correlation (P<0.001). Out of the ten possible discriminantfunctions found, the first eight were highly significant, with the first three able to explain over66% of the total variability (29, 23 and 14%, respectively). The first discriminant function washighly and positively correlated with spring growth habit (0.61), the second negatively correlat-ed with leaf colour (-0.70) and the third positively correlated with pigmentation of the inflores-cence (0.64) and spring regrowth (0.60). The centroids of the class means, plotted according tothe first three functions, showed that cultivated and wild accessions were clearly separated bythe first discriminant function (cultivated accession being more prostrate than wild); no clearcut was observed according to the second discriminant function, although the leaf colour ofsome cultivars (B, N and V) were generally darker than many wild accessions (E, XC, XI). The
Poa pratensis Diversity and Population Structure
PLOS ONE | DOI:10.1371/journal.pone.0124709 April 20, 2015 8 / 22
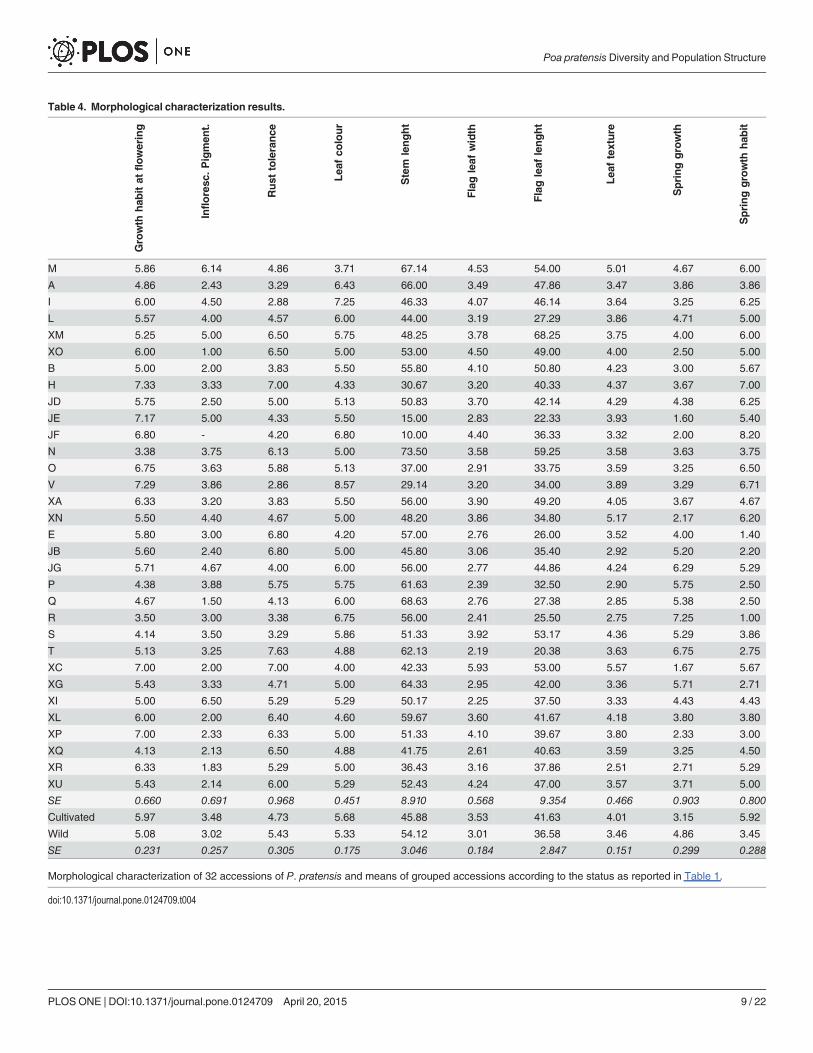
Table 4. Morphological characterization results.
Growth
hab
itat
flowering
Infloresc
.Pigmen
t.
Rust
tolerance
Lea
fco
lour
Stem
lenght
Flagleaf
width
Flagleaf
lenght
Lea
ftexture
Springgrowth
Springgrowth
hab
it
M 5.86 6.14 4.86 3.71 67.14 4.53 54.00 5.01 4.67 6.00
A 4.86 2.43 3.29 6.43 66.00 3.49 47.86 3.47 3.86 3.86
I 6.00 4.50 2.88 7.25 46.33 4.07 46.14 3.64 3.25 6.25
L 5.57 4.00 4.57 6.00 44.00 3.19 27.29 3.86 4.71 5.00
XM 5.25 5.00 6.50 5.75 48.25 3.78 68.25 3.75 4.00 6.00
XO 6.00 1.00 6.50 5.00 53.00 4.50 49.00 4.00 2.50 5.00
B 5.00 2.00 3.83 5.50 55.80 4.10 50.80 4.23 3.00 5.67
H 7.33 3.33 7.00 4.33 30.67 3.20 40.33 4.37 3.67 7.00
JD 5.75 2.50 5.00 5.13 50.83 3.70 42.14 4.29 4.38 6.25
JE 7.17 5.00 4.33 5.50 15.00 2.83 22.33 3.93 1.60 5.40
JF 6.80 - 4.20 6.80 10.00 4.40 36.33 3.32 2.00 8.20
N 3.38 3.75 6.13 5.00 73.50 3.58 59.25 3.58 3.63 3.75
O 6.75 3.63 5.88 5.13 37.00 2.91 33.75 3.59 3.25 6.50
V 7.29 3.86 2.86 8.57 29.14 3.20 34.00 3.89 3.29 6.71
XA 6.33 3.20 3.83 5.50 56.00 3.90 49.20 4.05 3.67 4.67
XN 5.50 4.40 4.67 5.00 48.20 3.86 34.80 5.17 2.17 6.20
E 5.80 3.00 6.80 4.20 57.00 2.76 26.00 3.52 4.00 1.40
JB 5.60 2.40 6.80 5.00 45.80 3.06 35.40 2.92 5.20 2.20
JG 5.71 4.67 4.00 6.00 56.00 2.77 44.86 4.24 6.29 5.29
P 4.38 3.88 5.75 5.75 61.63 2.39 32.50 2.90 5.75 2.50
Q 4.67 1.50 4.13 6.00 68.63 2.76 27.38 2.85 5.38 2.50
R 3.50 3.00 3.38 6.75 56.00 2.41 25.50 2.75 7.25 1.00
S 4.14 3.50 3.29 5.86 51.33 3.92 53.17 4.36 5.29 3.86
T 5.13 3.25 7.63 4.88 62.13 2.19 20.38 3.63 6.75 2.75
XC 7.00 2.00 7.00 4.00 42.33 5.93 53.00 5.57 1.67 5.67
XG 5.43 3.33 4.71 5.00 64.33 2.95 42.00 3.36 5.71 2.71
XI 5.00 6.50 5.29 5.29 50.17 2.25 37.50 3.33 4.43 4.43
XL 6.00 2.00 6.40 4.60 59.67 3.60 41.67 4.18 3.80 3.80
XP 7.00 2.33 6.33 5.00 51.33 4.10 39.67 3.80 2.33 3.00
XQ 4.13 2.13 6.50 4.88 41.75 2.61 40.63 3.59 3.25 4.50
XR 6.33 1.83 5.29 5.00 36.43 3.16 37.86 2.51 2.71 5.29
XU 5.43 2.14 6.00 5.29 52.43 4.24 47.00 3.57 3.71 5.00
SE 0.660 0.691 0.968 0.451 8.910 0.568 9.354 0.466 0.903 0.800
Cultivated 5.97 3.48 4.73 5.68 45.88 3.53 41.63 4.01 3.15 5.92
Wild 5.08 3.02 5.43 5.33 54.12 3.01 36.58 3.46 4.86 3.45
SE 0.231 0.257 0.305 0.175 3.046 0.184 2.847 0.151 0.299 0.288
Morphological characterization of 32 accessions of P. pratensis and means of grouped accessions according to the status as reported in Table 1.
doi:10.1371/journal.pone.0124709.t004
Poa pratensis Diversity and Population Structure
PLOS ONE | DOI:10.1371/journal.pone.0124709 April 20, 2015 9 / 22
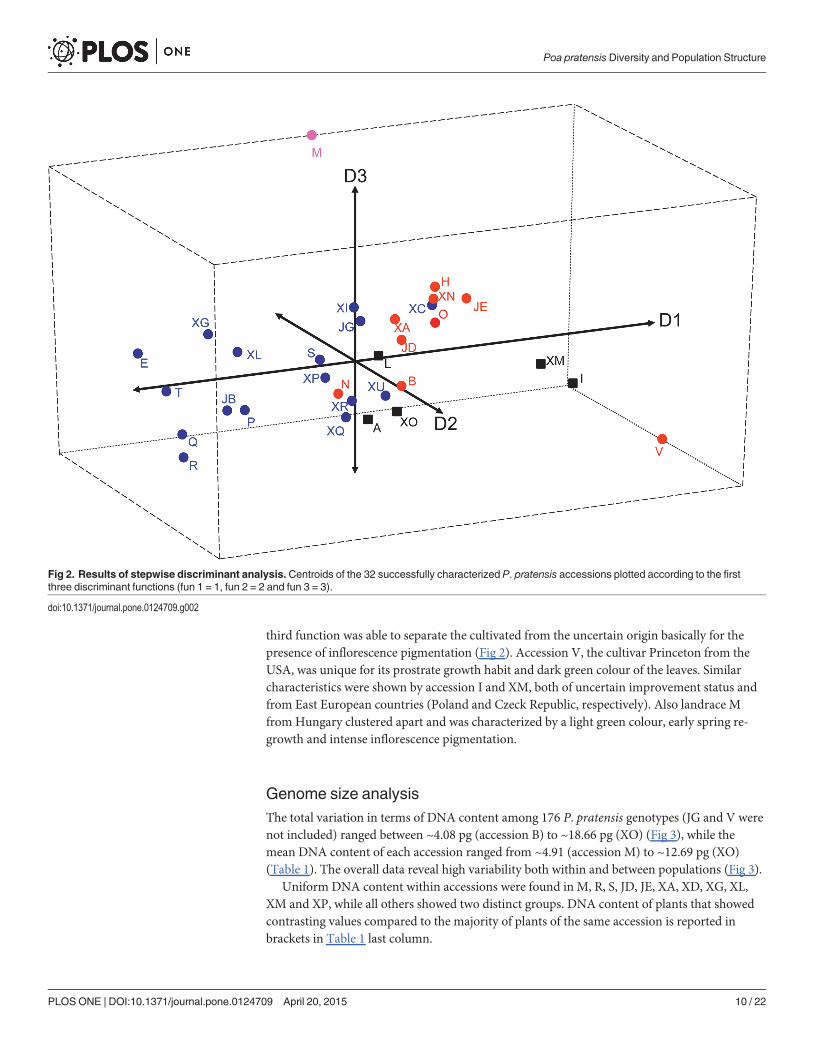
third function was able to separate the cultivated from the uncertain origin basically for thepresence of inflorescence pigmentation (Fig 2). Accession V, the cultivar Princeton from theUSA, was unique for its prostrate growth habit and dark green colour of the leaves. Similarcharacteristics were shown by accession I and XM, both of uncertain improvement status andfrom East European countries (Poland and Czeck Republic, respectively). Also landrace Mfrom Hungary clustered apart and was characterized by a light green colour, early spring re-growth and intense inflorescence pigmentation.
Genome size analysisThe total variation in terms of DNA content among 176 P. pratensis genotypes (JG and V werenot included) ranged between ~4.08 pg (accession B) to ~18.66 pg (XO) (Fig 3), while themean DNA content of each accession ranged from ~4.91 (accession M) to ~12.69 pg (XO)(Table 1). The overall data reveal high variability both within and between populations (Fig 3).
Uniform DNA content within accessions were found in M, R, S, JD, JE, XA, XD, XG, XL,XM and XP, while all others showed two distinct groups. DNA content of plants that showedcontrasting values compared to the majority of plants of the same accession is reported inbrackets in Table 1 last column.
Fig 2. Results of stepwise discriminant analysis. Centroids of the 32 successfully characterized P. pratensis accessions plotted according to the firstthree discriminant functions (fun 1 = 1, fun 2 = 2 and fun 3 = 3).
doi:10.1371/journal.pone.0124709.g002
Poa pratensis Diversity and Population Structure
PLOS ONE | DOI:10.1371/journal.pone.0124709 April 20, 2015 10 / 22
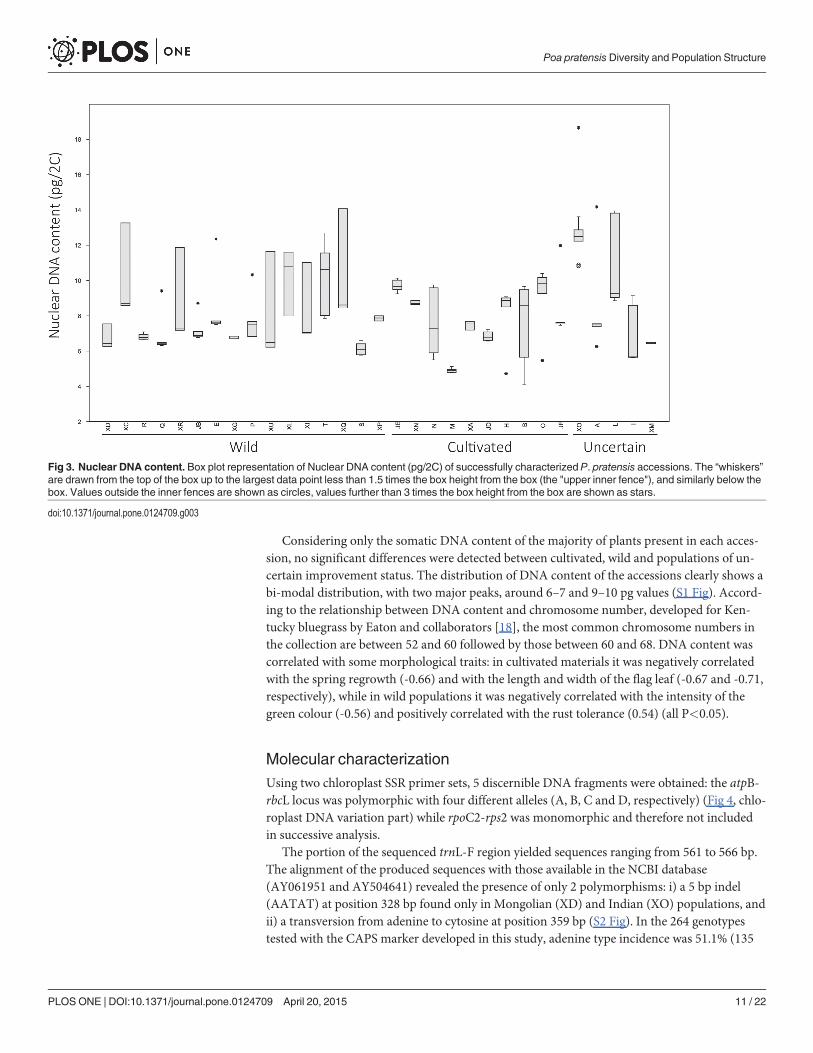
Considering only the somatic DNA content of the majority of plants present in each acces-sion, no significant differences were detected between cultivated, wild and populations of un-certain improvement status. The distribution of DNA content of the accessions clearly shows abi-modal distribution, with two major peaks, around 6–7 and 9–10 pg values (S1 Fig). Accord-ing to the relationship between DNA content and chromosome number, developed for Ken-tucky bluegrass by Eaton and collaborators [18], the most common chromosome numbers inthe collection are between 52 and 60 followed by those between 60 and 68. DNA content wascorrelated with some morphological traits: in cultivated materials it was negatively correlatedwith the spring regrowth (-0.66) and with the length and width of the flag leaf (-0.67 and -0.71,respectively), while in wild populations it was negatively correlated with the intensity of thegreen colour (-0.56) and positively correlated with the rust tolerance (0.54) (all P<0.05).
Molecular characterizationUsing two chloroplast SSR primer sets, 5 discernible DNA fragments were obtained: the atpB-rbcL locus was polymorphic with four different alleles (A, B, C and D, respectively) (Fig 4, chlo-roplast DNA variation part) while rpoC2-rps2 was monomorphic and therefore not includedin successive analysis.
The portion of the sequenced trnL-F region yielded sequences ranging from 561 to 566 bp.The alignment of the produced sequences with those available in the NCBI database(AY061951 and AY504641) revealed the presence of only 2 polymorphisms: i) a 5 bp indel(AATAT) at position 328 bp found only in Mongolian (XD) and Indian (XO) populations, andii) a transversion from adenine to cytosine at position 359 bp (S2 Fig). In the 264 genotypestested with the CAPS marker developed in this study, adenine type incidence was 51.1% (135
Fig 3. Nuclear DNA content. Box plot representation of Nuclear DNA content (pg/2C) of successfully characterized P. pratensis accessions. The “whiskers”are drawn from the top of the box up to the largest data point less than 1.5 times the box height from the box (the "upper inner fence"), and similarly below thebox. Values outside the inner fences are shown as circles, values further than 3 times the box height from the box are shown as stars.
doi:10.1371/journal.pone.0124709.g003
Poa pratensis Diversity and Population Structure
PLOS ONE | DOI:10.1371/journal.pone.0124709 April 20, 2015 11 / 22
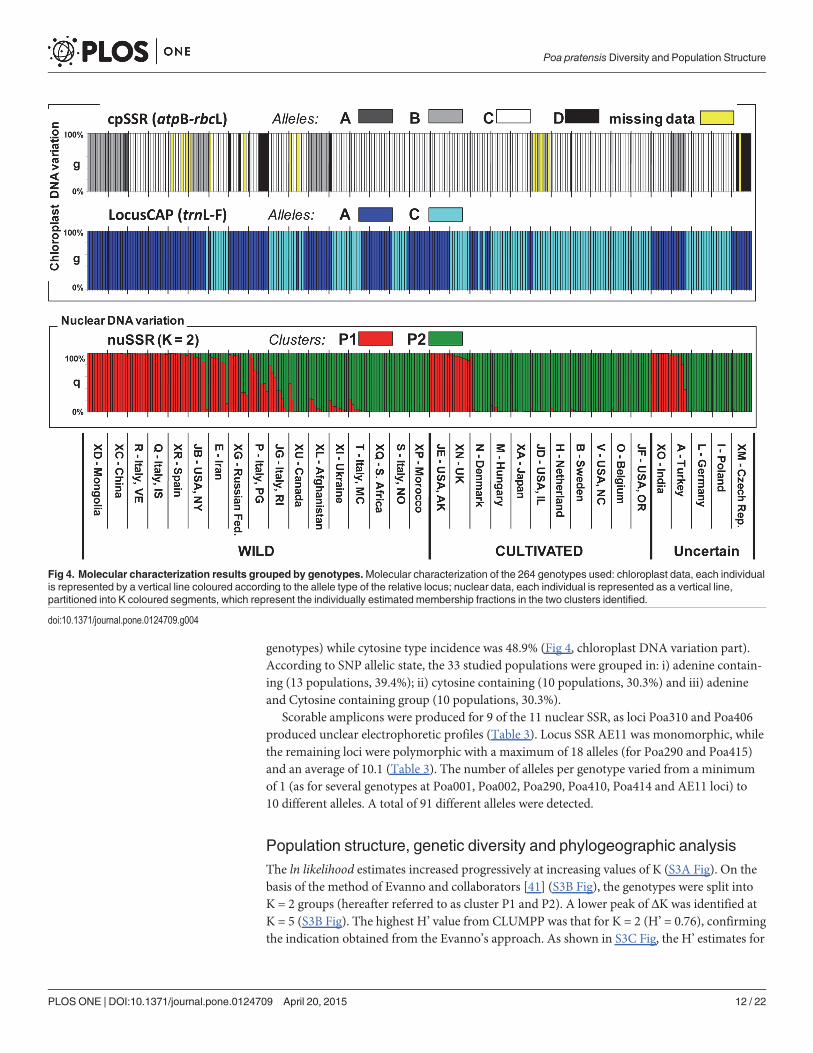
genotypes) while cytosine type incidence was 48.9% (Fig 4, chloroplast DNA variation part).According to SNP allelic state, the 33 studied populations were grouped in: i) adenine contain-ing (13 populations, 39.4%); ii) cytosine containing (10 populations, 30.3%) and iii) adenineand Cytosine containing group (10 populations, 30.3%).
Scorable amplicons were produced for 9 of the 11 nuclear SSR, as loci Poa310 and Poa406produced unclear electrophoretic profiles (Table 3). Locus SSR AE11 was monomorphic, whilethe remaining loci were polymorphic with a maximum of 18 alleles (for Poa290 and Poa415)and an average of 10.1 (Table 3). The number of alleles per genotype varied from a minimumof 1 (as for several genotypes at Poa001, Poa002, Poa290, Poa410, Poa414 and AE11 loci) to10 different alleles. A total of 91 different alleles were detected.
Population structure, genetic diversity and phylogeographic analysisThe ln likelihood estimates increased progressively at increasing values of K (S3A Fig). On thebasis of the method of Evanno and collaborators [41] (S3B Fig), the genotypes were split intoK = 2 groups (hereafter referred to as cluster P1 and P2). A lower peak of ΔK was identified atK = 5 (S3B Fig). The highest H’ value from CLUMPP was that for K = 2 (H’ = 0.76), confirmingthe indication obtained from the Evanno’s approach. As shown in S3C Fig, the H’ estimates for
Fig 4. Molecular characterization results grouped by genotypes.Molecular characterization of the 264 genotypes used: chloroplast data, each individualis represented by a vertical line coloured according to the allele type of the relative locus; nuclear data, each individual is represented as a vertical line,partitioned into K coloured segments, which represent the individually estimated membership fractions in the two clusters identified.
doi:10.1371/journal.pone.0124709.g004
Poa pratensis Diversity and Population Structure
PLOS ONE | DOI:10.1371/journal.pone.0124709 April 20, 2015 12 / 22
other K values were comprised between 0.59 at K = 3 and 0.45 at K = 7, thus not supportingany lower hierarchical structure. The percentages of memberships (q values) at K = 2 werethen recalculated by a new run based on 100,000 repetitions and burn-in periods. The q valuesso obtained were consistent with those of CLUMPP (H’ = 0.82), hence we used those from theSTRUCTURE’s run. A threshold value of q = 0.70 was used to assign genotypes to one of theinferred K clusters (Fig 4).
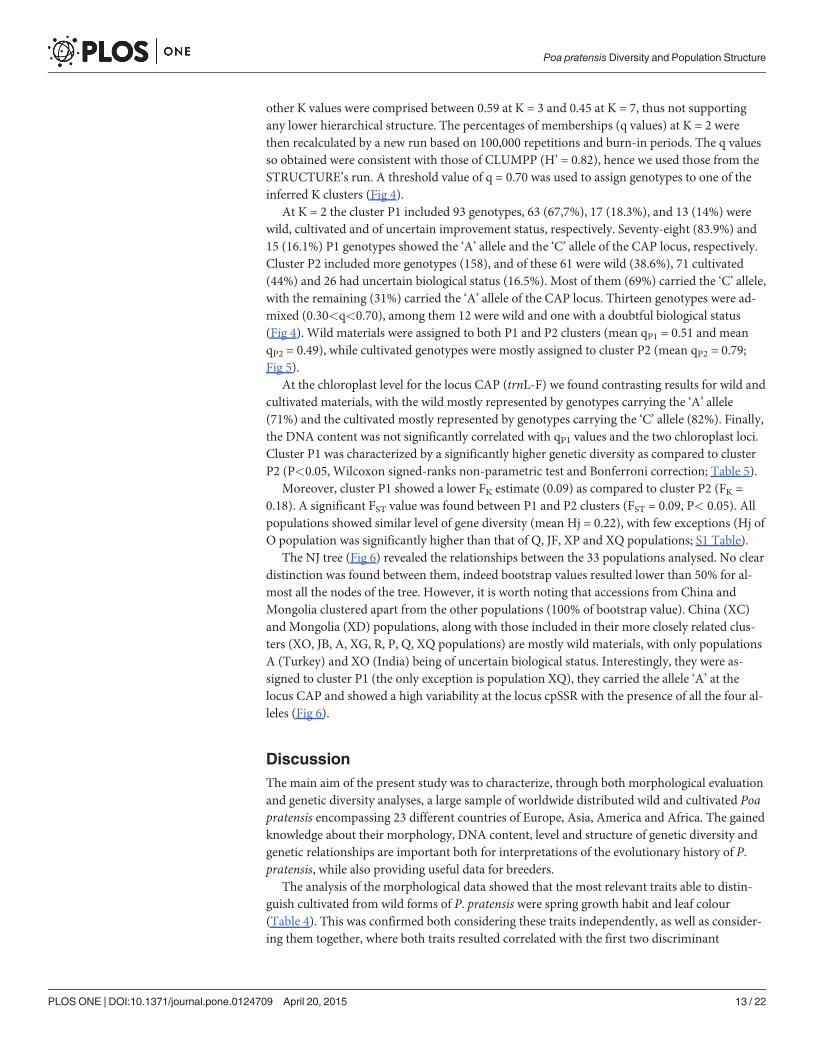
At K = 2 the cluster P1 included 93 genotypes, 63 (67,7%), 17 (18.3%), and 13 (14%) werewild, cultivated and of uncertain improvement status, respectively. Seventy-eight (83.9%) and15 (16.1%) P1 genotypes showed the ‘A’ allele and the ‘C’ allele of the CAP locus, respectively.Cluster P2 included more genotypes (158), and of these 61 were wild (38.6%), 71 cultivated(44%) and 26 had uncertain biological status (16.5%). Most of them (69%) carried the ‘C’ allele,with the remaining (31%) carried the ‘A’ allele of the CAP locus. Thirteen genotypes were ad-mixed (0.30<q<0.70), among them 12 were wild and one with a doubtful biological status(Fig 4). Wild materials were assigned to both P1 and P2 clusters (mean qP1 = 0.51 and meanqP2 = 0.49), while cultivated genotypes were mostly assigned to cluster P2 (mean qP2 = 0.79;Fig 5).
At the chloroplast level for the locus CAP (trnL-F) we found contrasting results for wild andcultivated materials, with the wild mostly represented by genotypes carrying the ‘A’ allele(71%) and the cultivated mostly represented by genotypes carrying the ‘C’ allele (82%). Finally,the DNA content was not significantly correlated with qP1 values and the two chloroplast loci.Cluster P1 was characterized by a significantly higher genetic diversity as compared to clusterP2 (P<0.05, Wilcoxon signed-ranks non-parametric test and Bonferroni correction; Table 5).
Moreover, cluster P1 showed a lower FK estimate (0.09) as compared to cluster P2 (FK =0.18). A significant FST value was found between P1 and P2 clusters (FST = 0.09, P< 0.05). Allpopulations showed similar level of gene diversity (mean Hj = 0.22), with few exceptions (Hj ofO population was significantly higher than that of Q, JF, XP and XQ populations; S1 Table).
The NJ tree (Fig 6) revealed the relationships between the 33 populations analysed. No cleardistinction was found between them, indeed bootstrap values resulted lower than 50% for al-most all the nodes of the tree. However, it is worth noting that accessions from China andMongolia clustered apart from the other populations (100% of bootstrap value). China (XC)and Mongolia (XD) populations, along with those included in their more closely related clus-ters (XO, JB, A, XG, R, P, Q, XQ populations) are mostly wild materials, with only populationsA (Turkey) and XO (India) being of uncertain biological status. Interestingly, they were as-signed to cluster P1 (the only exception is population XQ), they carried the allele ‘A’ at thelocus CAP and showed a high variability at the locus cpSSR with the presence of all the four al-leles (Fig 6).
DiscussionThe main aim of the present study was to characterize, through both morphological evaluationand genetic diversity analyses, a large sample of worldwide distributed wild and cultivated Poapratensis encompassing 23 different countries of Europe, Asia, America and Africa. The gainedknowledge about their morphology, DNA content, level and structure of genetic diversity andgenetic relationships are important both for interpretations of the evolutionary history of P.pratensis, while also providing useful data for breeders.
The analysis of the morphological data showed that the most relevant traits able to distin-guish cultivated from wild forms of P. pratensis were spring growth habit and leaf colour(Table 4). This was confirmed both considering these traits independently, as well as consider-ing them together, where both traits resulted correlated with the first two discriminant
Poa pratensis Diversity and Population Structure
PLOS ONE | DOI:10.1371/journal.pone.0124709 April 20, 2015 13 / 22
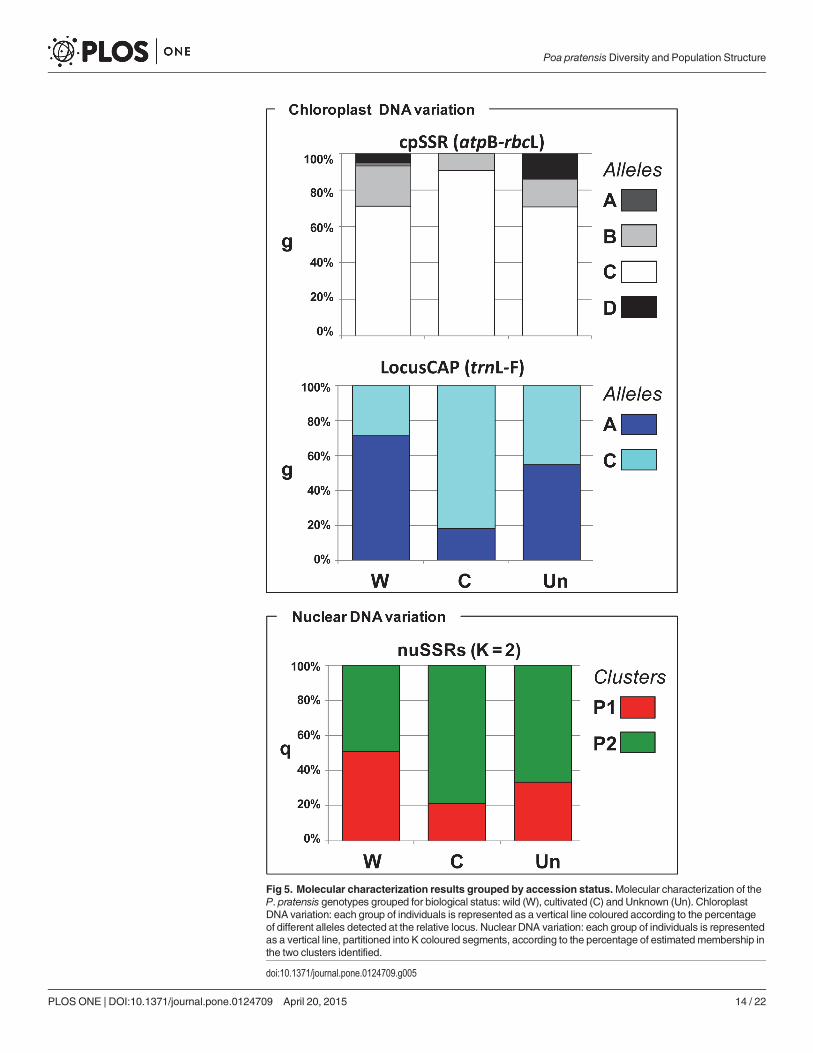
Fig 5. Molecular characterization results grouped by accession status.Molecular characterization of theP. pratensis genotypes grouped for biological status: wild (W), cultivated (C) and Unknown (Un). ChloroplastDNA variation: each group of individuals is represented as a vertical line coloured according to the percentageof different alleles detected at the relative locus. Nuclear DNA variation: each group of individuals is representedas a vertical line, partitioned into K coloured segments, according to the percentage of estimated membership inthe two clusters identified.
doi:10.1371/journal.pone.0124709.g005
Poa pratensis Diversity and Population Structure
PLOS ONE | DOI:10.1371/journal.pone.0124709 April 20, 2015 14 / 22
functions able to explain 52% of total variation. These traits are some of the most importanttraits that underwent selection during domestication, first, and breeding later [50]. In particu-lar, rust tolerance, prostrate growth habit and dark green colour are among the most importanttraits selected by breeders for any new turf variety [50]. In fact, the dark green colour and rusttolerance are commonly associated with a healthy turf, while the prostrate growth habit with abetter ground cover. Moreover, shorter basal internodes (short stature), higher tiller density,narrow leaf blades, high ground cover, all characteristics related to growth habit, were pursuedsince domestication [50,51]. Thus, our phenotypic analyses provide evidence that breeding se-lection for growth habit and leaf colour contributed to the cultivated phenotype. In contrast,traits such as inflorescence pigmentation and flag leaf length were apparently not influenced byanthropic selection pressures, as individuals with extreme values were found almost equallydistributed between wild and cultivated forms (Table 4).
In recent years, flow cytometry has become the preferred technique for estimating nuclearDNA content because of its ease of utilization and accuracy [52,53]. The DNA content valuesfound in this study were similar to those reported by other authors. Studying 38 accessions of aUSDA core collection of Kentucky bluegrass, Wieners and collaborators [10] observed valuesranging from 4.85 to 15.70 pg. In a different study on twenty-two commercial cultivars of thisspecies, values ranging from 5.39 to 17.69 pg were reported [18]. The continue distribution ofDNA content (S1 Fig) of the studied collection suggests the presence of several aneuploids inboth wild and cultivated P. pratensis accessions and confirm the high genome variability of thisspecies [10,18]. In fact, as suggested in previous studies DNA content can be efficiently used asa means to determining ploidy level in Kentucky bluegrass [18].
Genome size estimation in a polyploid species can be very important since molecular mark-ers alone can fail in detecting the diversity caused by gene dosage effect, which may, in turn, af-fect the phenotypic diversity between accessions. Accordingly, we identified correlationsbetween genome size and morphological traits related to both plant morphology, growth habitand rust tolerance in both wild and cultivated P. pratensis accessions. This supports previousstudies which showed that variation of nuclear DNA content is associated with morphologicalcharacters in different plant species, for example negative correlations between nuclear DNAcontent and mean leaf length and width have been reported in Dasypyrum villosum (species ofannual grass in the Poaceae family) [54]. The overall flow cytometry data produced in thisstudy revealed the existence of both intra-and inter-population variation in P. pratensis DNAcontent. As suggested by Mowforth and Grime [55] intra-population variation in DNA contentcan arise through opposing forces: i) natural selection acting to reduce DNA amount, ii) thedisposition of some genomes to accumulate “selfish” DNA, and iii) the existence of ecologicaladvantages or disadvantages associated with large and small DNA amounts. The same authors
Table 5. Genetic diversity comparison.
Cluster (K = 2) N Hj† SDHj FK‡
P1 93 0.20A 0.017 0.09
P2 158 0.17B 0.017 0.18
MIX1 13 0.21A 0.015 na
Genetic diversity and FK estimates for the clusters identified by STRUCTURE analysis. The K = 2 partition
was considered.1Admixed genotypes (0.30 < qP1 < 0.70) were grouped as MIX population.
† Hj values followed by different letters are significantly different at P<0.05.
‡ na, not applicable.
doi:10.1371/journal.pone.0124709.t005
Poa pratensis Diversity and Population Structure
PLOS ONE | DOI:10.1371/journal.pone.0124709 April 20, 2015 15 / 22

postulated that in in P. annua, individuals with large genomes have an advantage under winterand early spring conditions, sufficient to guarantee their survival compared to faster-growingindividuals characterized by small genomes. The negative correlation between genome size andspring-regrowth detected in this study may suggests a similar role for the DNA content in thedistribution of P. pratensis, with respect of climate and growing season length. On the otherhand, the presence of individuals with contrasting genome size in cultivated accessions (Fig 3),subjected to intense breeding selection, as documented in this study may also suggest the natu-ral disposition of Poa genome to accumulate DNA. This tendency is even more clearly evident
Fig 6. Cluster analysis results.Neighbor-joining tree based on nuclear SSR data compared with thepercentage of membership for the 33 accessions computed for the two clusters identified and the allelic stateof the two chloroplast loci. Only bootstrap values higher than 50% are showed.
doi:10.1371/journal.pone.0124709.g006
Poa pratensis Diversity and Population Structure
PLOS ONE | DOI:10.1371/journal.pone.0124709 April 20, 2015 16 / 22

in wild populations where as many as 10 out of 16 (62.5%) were found to be characterized by atleast two ploidy levels. In fact, as early suggested by Bashaw and Funk, the great adaptivenessof this species could be closely related to its variable ploidy and by the presence of asexual re-production that provides an escape from the typical reproductive problems associated with un-balanced genomes [4].
Chloroplast genes have been used in numerous phylogenetic studies and have proven to beuseful in distinguishing different species belonging to the same genus. Patterson and collabora-tors used chloroplast markers to dissected the relationships among different species of the com-plex Poa genus [56]. Data produced in this study on both wild and cultivated P. pratensisaccessions, showed low polymorphism level in the trnL-F region. This condition was suggestedby Stoneberg Holt and collaborators [57] studying three P. pratensis varieties. However, ourdata (S1 File), originated from a world wild collection, allow to speculate a situation of wide-spread homogeneity in this species.
The low diversity here observed could be both related to the low nucleotide substitution ratein plastid DNA and to the mode of reproduction of the species. In fact, the existence of two dif-ferent asexual reproduction mechanisms (i.e. apomixis and rhizomes production) couldstrongly reduce plastid diversity within accessions that can derive from one or very few mater-nal individuals clonally propagated. It is noteworthy that wild and cultivated accessions werewell separated according to the allelic state of the SNP position identified in the chloroplast se-quence suggesting a strong phylogenetic value for polymorphisms in this region.
Differently from the chloroplast analysis, the high level of polymorphism observed at thenuclear level confirms the suitability of SSR markers in genetic studies of Kentucky bluegrass.In fact, the number of alleles detected per SSR locus (from 1 to 18) was similar to that reportedby Honig and collaborators (7–25) [26]. The high level of genome variability here reported, interms of somatic DNA content and SSR allelic diversity, is not surprising considering the highvariable ploidy level repeatedly documented for the species [10,18], the coexistence of apomic-tic and sexual reproduction in wild populations [7,9] and the pollen recognition system, whichconfers a strong ability to hybridize and retain alien genomes [58], all factors contributing tothe extreme complexity of the genome of this species [59].
Only a modest relationship between genetic divergence and geographical origins was re-ported in P. pratensis by several authors [22,23]. A general lack of separation between cultivat-ed and wild materials at molecular level was reported by Johnson and collaborators [23], whoevaluated a USDA P. pratensis collection using RAPDmarkers and found a wide overlap of 17commercial cultivars with clusters formed by wild accessions. Our results are consistent withthese findings; indeed both the NJ and population structure analyses indicated that a clear dis-tinction between wild and domesticated was not found (bootstrap values in NJ are almost alllower than 50% and, for STRUCTURE, wild and domesticated were attributed to both the twoclusters, even if domesticated were mostly attributed to P2). The main reason of a similar ge-netic structure could rely on breeding activities used to develop new cultivars of Kentuckybluegrass starting from ecotypes. Finally, the widespread distribution of some ecotypes cangenerate confusion on the improvement status and on the geographical origin of some acces-sions that can be wrongly considered native of a given place.
However, the analyses of both chloroplast and nuclear data highlighted some differences be-tween wild and cultivated materials. In particular, considering the chloroplast cpSSR a strongreduction of variability was detected in cultivated materials, where only two alleles were con-served out of the four detected in wild accessions. Concerning the chloroplast locus trnL-Fmost of the cultivated accessions showed the ‘C’ allele (82%), while, by contrast a predomi-nance of the ‘A’ allele (71%) was found for the wild accessions. A higher variability was presentat nuclear level for wild forms, where the two different clusters were equally represented
Poa pratensis Diversity and Population Structure
PLOS ONE | DOI:10.1371/journal.pone.0124709 April 20, 2015 17 / 22
(average qP1 = 0.51 and qP2 = 0.49), while the domesticated forms were mostly belonging tocluster P2 (average qP2 = 0.79), which showed also a significantly lower genetic diversity com-pared to the cluster P1. Thus, in spite of specific characteristics of the species that, as men-tioned above, could make difficult a distinction between wild and domesticated forms, effectsof domestication and breeding, were detected at molecular level by our analysis, with a certainloss of genetic variability in domesticated forms as expected due to founder effects and selec-tion at the target loci.
The analyses at molecular level showed also interesting results related to the origin of thespecies. In this regard, we first focused our attention on the NJ tree. It showed the relationshipsbetween the different populations, with the main result being a clear and well supported subdi-vision, due to the 100% bootstrap value between the two wild populations from Asia (MongoliaXD and China, XC) and all the others. These two populations were included in cluster P1, theone with a lower FK estimate compared to cluster P2 [34]. FK parameter is similar to FST but itis specific for each population and is expected to be proportional to the divergence from a com-mon ancestral population, thus suggesting a more ancient origin of P1 germplasm. Moreover,Mongolian and Chinese populations carried the ‘A’ allele at the chloroplast locus trnL-F, themost represented allele in wild forms and also among the individuals assigned to cluster P1. Allthese outcomes seem to indicate China and Mongolia as the most probable geographical areasof origin of the species.
Population XO (India) and JB (USA, NJ) were those most closely related to China and Mon-golia in the NJ tree, even if their position was not statistically supported by bootstrap. Althoughboth populations belong to cluster P1 and carry the ‘A’ allele, JB is a cultivated form and XO isof uncertain biological status, hence it is difficult to clearly understand their role and origin.
Within the limits of resolution of the present study, the molecular evidences here presentedsuggest Mongolia and China as the most probable center of origin of P. pratensis. However,further studies, including a wider sample of P. pratensis accessions from Asia would be neededto obtain a more detailed picture on the topic.
Supporting InformationS1 Fig. Nuclear DNA content distribution. Histograms representation of Nuclear DNA con-tent (pg/2C) distribution of successfully characterized P. pratensis accessions.(TIF)
S2 Fig. trnL-F chloroplast region sequences alignment. Portion of the trnL-F sequencesalignment showing both 5bp indel and SNP position. In the alignment, P. pratensis individualsnames are built by population name and individuals number (i.e. B29 is individual 29 frompopulation B). For reference sequences Gene Bank accession number is reported.(TIF)
S3 Fig. Inference of the most probable K-value. a) Average ln likelihood value over 10 runs ±SD for increasing K-values, from 1 to 10. b) ΔK values over 10 runs for increasing K-values, from2 to 9. c) Average symmetric similarity coefficient (H’) for K from 2 to 10.(TIF)
S1 File. SSR, cpSSR and LocusCAP dataset.(XLSX)
S1 Table. Genetic diversity estimates for the 33 P. pratensis populations.(DOCX)
Poa pratensis Diversity and Population Structure
PLOS ONE | DOI:10.1371/journal.pone.0124709 April 20, 2015 18 / 22

AcknowledgmentsThe work carried out here is an integral part of L. Raggi Ph.D. investigations. Authors wish tothank COST Action FA0903. Authors wish also to thank Prof. Mario Falcinelli, Dr. Luca Pal-lottini and Dr. Paolo Pesaresi.
Author ContributionsConceived and designed the experiments: EA TFS FV. Performed the experiments: L. Raggi EAGM L. Russi. Analyzed the data: L. Raggi EB L. Russi. Contributed reagents/materials/analysistools: EA TFS FV. Wrote the paper: L. Raggi EB L. Russi EA.
References1. Soreng R. Chloroplast-DNA phylogenetics and biogeography in a reticulating group: study in Poa (Poa-
ceae). Am J Bot 1990; 77: 1383–1400. Available: http://www.jstor.org/stable/10.2307/2444749. Ac-cessed 9 May 2013.
2. Welsh S, Atwood N, Goodrich S, Higgins L. A Utah Flora (Great Basin Naturalist Memoirs Number 9).Provo, UT: Brigham Young University. 1987.
3. Clausen J. Introgression facilitated by apomixis in polyploid Poas. Euphytica 1961; 10: 87–94. Avail-able: http://link.springer.com/article/10.1007/BF00037208. Accessed 9 May 2013.
4. Bashaw E, Funk C. Apomictic grasses. In: Fehr WR, editor. Principles of Cultivar Development. Vol. 2Crop Species. New York, NY: Macmillan. 1987; pp. 40–82.
5. Muntzing A. Further studies on apomixis and sexuality in Poa. Hereditas 1940; 26: 115–188. Available:http://onlinelibrary.wiley.com/doi/10.1111/j.1601-5223.1940.tb03230.x/abstract. Accessed 9 May2013.
6. Löve A. Preparatory studies for breeding Icelandic Poa irrigata. Hereditas 1952; 38: 11–32. Available:http://onlinelibrary.wiley.com/doi/10.1111/j.1601-5223.1952.tb02912.x/abstract. Accessed 14 May2013.
7. Åkerberg E. Apomictic and sexual seed formation in Poa pratensis. Hereditas 1939; 25: 359–370.Available: http://onlinelibrary.wiley.com/doi/10.1111/j.1601-5223.1939.tb02702.x/abstract. Accessed 9May 2013.
8. Kellog E. Variation and species limits in agamosphermous grasses. Syst Bot 1990; 15: 112–123.
9. Huff D, Bara J. Determining genetic origins of aberrant progeny from facultative apomictic Kentuckybluegrass using a combination of flow cytometry and silver-stained RAPDmarkers. Theor Appl Genet1993; 87: 201–208. Available: http://link.springer.com/10.1007/BF00223765. doi: 10.1007/BF00223765 PMID: 24190213
10. Wieners RR, Fei S, Johnson RC. Characterization of a USDA Kentucky Bluegrass (Poa pratensis L.)Core Collection for Reproductive Mode and DNA Content by Flow Cytometry. Genet Resour Crop Evol2006; 53: 1531–1541. Available: http://www.springerlink.com/index/10.1007/s10722-005-7766-0. Ac-cessed 25 September 2012.
11. Hartley W. Studies on the origin, evolution and distribution of the Gramineae. IV. The genus Poa L.Aust J Bot 1961; 9: 152–161.
12. Huff D. Kentucky bluegrass. In: Casler M, Duncan R, editors. Turfgrass biology, genetics, and breeding.JohnWiley & Sons Hoboken, NJ. 2003; pp. 27–38.
13. Carrier L, Bort L. The history of Kentucky bluegrass and white clover in the United States. Agron J1916; 8: 256–266.
14. Cronquist A, Holmgren N, Holmgren P, Reveal J. Intermountain Flora: Vascular Plants of the Inter-mountain West, U.S.A., Volume 6. New York, NY,: Columbia University Press. 1977.
15. Duell R. The bluegrasses. In: Heath M, Barnes R, Metcalfe D, editors. Forages—The science of grass-land agriculture. Ames, IA: Iowa State University. 1985; pp. 188–197.
16. Soreng R. Poa L. in NewMexico, with a key to middle and Southern Rocky Mountain species (Poa-ceae). West North Am Nat 1985; 45: 395–422. Available: https://ojs.lib.byu.edu/ojs/index.php/wnan/article/viewArticle/2034. Accessed 9 May 2013.
17. Murovec J, Kastelec D, Vilhar B. High variability of nuclear DNA content in cultivars and natural popula-tions of Poa pratensis L. in relation to morphological characters. Acta Biol Cracoviensia 2009; 51: 45–52. Available: http://www.ib.uj.edu.pl/abc/pdf/51_2/06_murovec.pdf. Accessed 14 May 2013.
Poa pratensis Diversity and Population Structure
PLOS ONE | DOI:10.1371/journal.pone.0124709 April 20, 2015 19 / 22

18. Eaton T, Curley J, Williamson R, Jung G. Determination of the level of variation in polyploidy amongKentucky bluegrass cultivars by means of flow cytometry. Crop Sci 2004; 44: 2168–2174. Available:https://www.crops.org/publications/cs/abstracts/44/6/2168. Accessed 14 May 2013.
19. Arumuganathan K, Tallury S, Fraser M. Nuclear DNA content of thirteen turfgrass species by flow cy-tometry. Crop Sci 1999; 39: 1518–1521. Available: https://www.soils.org/publications/cs/abstracts/39/5/1518. Accessed 28 March 2013.
20. Bennett M, Leitch I. Nuclear DNA amounts in angiosperms. Ann Bot: 1995; 113–176. Available: http://rstb.royalsocietypublishing.org/content/274/933/227.short. Accessed 10 September 2014.
21. Curley J, Jung G. RAPD-Based Genetic Relationships in Kentucky Bluegrass. Crop Sci 2004; 44:1299–1306. Available: https://www.agronomy.org/publications/cs/abstracts/44/4/1299?access=0&view = article. Accessed 22 May 2013.
22. Fard JR, Zamani Z, MoghaddamMRF, Kafi M. Evaluation of genetic diversity among some genotypesof Kentucky bluegrass by RAPDmolecular markers. Hortic Environ Biotechnol 2012; 53: 298–303.Available: http://link.springer.com/10.1007/s13580-012-0120-5. Accessed 22 May 2013.
23. Johnson RC, Johnston WJ, Golob CT, Nelson MC, Soreng RJ. Characterization of the USDA Poa pra-tensis collection using RAPDmarkers and agronomic descriptors. Genet Resour Crop Evol 2002; 49:349–361.
24. Goldman JJ. The use of ISSRmarkers to identify Texas bluegrass interspecific hybrids. Plant Breed2008; 127: 644–646. Available: http://doi.wiley.com/10.1111/j.1439-0523.2008.01526.x. Accessed 9May 2013.
25. Honig JA, Bonos SA, Meyer WA. Isolation and Characterization of 88 Polymorphic Microsatellite Mark-ers in Kentucky Bluegrass (Poa pratensis L.). Hortscience 2010; 45: 1759–1763.
26. Honig J, Averello V, Bonos SA, Meyer WA. Classification of Kentucky Bluegrass (Poa pratensis L.) Cul-tivars and Accessions Based on Microsatellite (Simple Sequence Repeat) Markers. Hortscience 2012;47: 1356–1366. Available: http://hortsci.ashspublications.org/content/47/9/1356.short. Accessed 25October 2012.
27. UPOV (Union Internationale Pour La Protection Des Obtentions Vegetales). Guidelines for the conductof tests for distinctness, homogeneity and stability: Kentucky bluegrass: (apomictic varieties). UPOVweb site (http://www.upov.int/about/en/list_publications.html).: UPOV web site (http://www.upov.int/about/en/list_publications.html). Available: UPOV web site (http://www.upov.int/about/en/list_publications.html). 1990.
28. Matzk F, Meister A, Schubert I. An efficient screen for reproductive pathways using mature seeds ofmonocots and dicots. Plant J 2000; 21: 97–108. Available: http://www.ncbi.nlm.nih.gov/pubmed/10652155. PMID: 10652155
29. Taberlet P, Gielly L, Pautou G, Bouvet J, Biologie L De, et al. Universal primers for amplification ofthree non-coding regions of chloroplast DNA. Plant Mol Biol 1991; 17: 1105–1109. PMID: 1932684
30. Tamura K, Dudley J, Nei M, Kumar S. MEGA4: molecular evolutionary genetics analysis (MEGA) soft-ware version 4.0. Mol Biol Evol 2007; 24: 1596–1599. Available: http://www.ncbi.nlm.nih.gov/pubmed/17488738. Accessed 14 May 2013. PMID: 17488738
31. Rozen S, Skaletsky H. Primer3 on theWWW for general users and for biologist programmers. In: Kra-wetz S, Misener S, editors. Bioinformatics Methods and Protocols: Methods in Molecular Biology.Totowa, NJ: Humana Press. 2000; pp. 365–386.
32. Don RH, Cox PT, Wainwright BJ, Baker K, Mattick JS. “Touchdown” PCR to circumvent spurious prim-ing during gene amplification. Nucleic Acids Res 1991; 19: 4008. Available: http://www.pubmedcentral.nih.gov/articlerender.fcgi?artid=3318507&tool = pmcentrez&rendertype = abstract. PMID: 1861999
33. Pritchard JK, Stephens M, Donnelly P. Inference of population structure using multilocus genotypedata. Genetics 2000; 155: 945–959. Available: http://www.pubmedcentral.nih.gov/articlerender.fcgi?artid=1461096&tool = pmcentrez&rendertype = abstract. PMID: 10835412
34. Falush D, Stephens M, Pritchard JK. Inference of population structure using multilocus genotype data:linked loci and correlated allele frequencies. Genetics 2003; 164: 1567–1587. Available: http://www.pubmedcentral.nih.gov/articlerender.fcgi?artid=1462648&tool = pmcentrez&rendertype = abstract.PMID: 12930761
35. Lo EYY, Stefanović S, Dickinson TA. Population genetic structure of diploid sexual and polyploid apo-mictic hawthorns (Crataegus; Rosaceae) in the Pacific Northwest. Mol Ecol 2009; 18: 1145–1160.Available: http://www.ncbi.nlm.nih.gov/pubmed/19243504. Accessed 3 November 2014. doi: 10.1111/j.1365-294X.2009.04091.x PMID: 19243504
36. Jungmann L, Vigna BBZ, Boldrini KR, Sousa a CB, do Valle CB, et al. Genetic diversity and populationstructure analysis of the tropical pasture grass Brachiaria humidicola based on microsatellites,
Poa pratensis Diversity and Population Structure
PLOS ONE | DOI:10.1371/journal.pone.0124709 April 20, 2015 20 / 22
cytogenetics, morphological traits, and geographical origin. Genome 2010; 53: 698–709. Available:http://www.ncbi.nlm.nih.gov/pubmed/20924419. Accessed 3 November 2014. doi: 10.1139/g10-055PMID: 20924419
37. Vigna BBZ, Jungmann L, Francisco PM, Zucchi MI, do Valle CB, et al. Genetic Diversity and PopulationStructure of the Brachiaria brizantha Germplasm. Trop Plant Biol 2011; 4: 157–169. Available: http://link.springer.com/10.1007/s12042-011-9078-1. Accessed 6 November 2014.
38. Majeský L, Vašut RJ, Kitner M, Trávníček B. The pattern of genetic variability in apomictic clones of Tar-axacum officinale indicates the alternation of asexual and sexual histories of apomicts. PLoS One2012; 7: e41868. Available: http://www.pubmedcentral.nih.gov/articlerender.fcgi?artid=3411577&tool = pmcentrez&rendertype = abstract. Accessed 27 October 2014. doi: 10.1371/journal.pone.0041868 PMID: 22870257
39. Cidade FW, Vigna BB, de Souza FH, Valls JFM, Dall’Agnol M, et al. Genetic variation in polyploid for-age grass: assessing the molecular genetic variability in the Paspalum genus. BMCGenet 2013; 14:50. Available: http://www.biomedcentral.com/1471-2156/14/50. Accessed 3 November 2014. doi: 10.1186/1471-2156-14-50 PMID: 23759066
40. Falush D, Stephens M, Pritchard JK. Inference of population structure using multilocus genotype data:dominant markers and null alleles. Mol Ecol Notes 2007; 7: 574–578. Available: http://www.pubmedcentral.nih.gov/articlerender.fcgi?artid=1974779&tool = pmcentrez&rendertype = abstract. Ac-cessed 28 February 2013. PMID: 18784791
41. Evanno G, Regnaut S, Goudet J. Detecting the number of clusters of individuals using the softwareSTRUCTURE: a simulation study. Mol Ecol 2005; 14: 2611–2620. Available: http://www.ncbi.nlm.nih.gov/pubmed/15969739. Accessed 28 February 2013. PMID: 15969739
42. Jakobsson M, Rosenberg NA. CLUMPP: A cluster matching and permutation program for dealing withlabel switching and multimodality in analysis of population structure. Bioinformatics 2007; 23: 1801–1806. doi: 10.1093/bioinformatics/btm233 PMID: 17485429
43. Nei M. Estimation of average heterozygosity and genetic distance from a small number of individuals.Genetics 1978; 89: 583–590. Available: http://www.genetics.org/content/89/3/583.short. Accessed 14May 2013. PMID: 17248844
44. Lynch M, Milligan B. Analysis of population genetic structure with RAPDmarkers. Mol Ecol 1994; 3:91–99. Available: http://onlinelibrary.wiley.com/doi/10.1111/j.1365-294X.1994.tb00109.x/abstract. Ac-cessed 14 May 2013. PMID: 8019690
45. Vekemans X. AFLP-SURV, version 1.0. Distributed by the author. Laboratoire de Génétique et Ecolo-gie Végétale, Université Libre de Bruxelles, Belgium. 2002.
46. Zhivotovsky LA. Estimating population structure in diploids with multilocus dominant DNAmarkers. MolEcol 1999; 8: 907–913. Available: http://www.ncbi.nlm.nih.gov/pubmed/10434412. PMID: 10434412
47. Krauss SL. Accurate gene diversity estimates from amplified fragment length polymorphism (AFLP)markers. Mol Ecol 2000; 9: 1241–1245. Available: http://www.ncbi.nlm.nih.gov/pubmed/10972764.PMID: 10972764
48. Sokal R, Rohlf F. Biometry: the Principles and Practice of Statistics in Biological Research. 4th ed.New York: FreemanWH and Co. 2012.
49. Felsenstein J. Phylogeny Inference Package (PHYLIP). Version 3.5. Distributed by the author. Depart-ment of Genetics. University of Washington, Seattle, USA. 1993.
50. Casler MD. Perennial grasses for turf, sport and amenity uses: evolution of form, function and fitnessfor human benefit. J Agric Sci 2006; 144: 189. Available: http://journals.cambridge.org/abstract_S0021859606006137. Accessed 5 November 2014.
51. Harlan J. Crops and Man, 2nd Edition. Madison, WI.: American Society of Agronomy. 1992.
52. Rayburn AL, Auger JA, Benzinger EA, Hepburn AG. Detection of Intraspecific DNA Content Variationin Zea mays L. by Flow Cytometry. J Exp Bot 1989; 40: 1179–1183. Available: http://jxb.oxfordjournals.org/content/40/11/1179.short. Accessed 14 May 2013.
53. Heslop-Harrison J. Flow cytometry and genome analysis. Probe (Lond) 1995; 5: 14–17.
54. Caceres ME, De Pace C, Scarascia Mugnozza GT, Kotsonis P, Ceccarelli M, et al. Genome size varia-tions within Dasypyrum villosum: correlations with chromosomal traits, environmental factors and plantphenotypic characteristics and behaviour in reproduction. Theor Appl Genet 1998; 96: 559–567. Avail-able: http://link.springer.com/article/10.1007/s001220050774. Accessed 17 September 2014.
55. Mowforth M, Grime J. Intra-population variation in nuclear DNA amount, cell size and growth rate inPoa Annua L. Funct Ecol 1989; 3: 289–295.
Poa pratensis Diversity and Population Structure
PLOS ONE | DOI:10.1371/journal.pone.0124709 April 20, 2015 21 / 22
56. Patterson JT, Larson SR, Johnson PG. Genome relationships in polyploid Poa pratensis and other Poaspecies inferred from phylogenetic analysis of nuclear and chloroplast DNA sequences. Genome 2005;48: 76–87. doi: 10.1139/G04-102 PMID: 15729399
57. Stoneberg Holt S, Horová L, Bures P, Janecek J, Cernoch V. The trnL-F plastid DNA characters ofthree Poa pratensis (Kentucky bluegrass) varieties. Plant Soil Environ 2005; 51: 94–99. Available:http://agris.fao.org/agris-search/search/display.do?f=2005/CZ/CZ0506.xml;CZ2005000531. Accessed14 May 2013.
58. Wedin W, Huff D. Cool-Season Forage Grasses. In: Moser L, editor. Cool-Season Forage Grasses.Madison, WI: American Society of Agronomy Monograph Series. 1996.
59. Porceddu A, Albertini E, Barcaccia G, Falistocco E, Falcinelli M. Linkage mapping in apomictic and sex-ual Kentucky bluegrass (Poa pratensis L.) genotypes using a two way pseudo-testcross strategy basedon AFLP and SAMPLmarkers. Theor Appl Genet 2002; 104: 273–280. Available: http://www.ncbi.nlm.nih.gov/pubmed/12582697. PMID: 12582697
Poa pratensis Diversity and Population Structure
PLOS ONE | DOI:10.1371/journal.pone.0124709 April 20, 2015 22 / 22