Embed Size (px)
Citation preview

Understanding Barriers to Antenatal Care and Institutional Delivery in Rajsamand, Rajasthan- Survey
Page | 0
Understanding Barriers to Antenatal Care and Institutional Delivery-Survey Part 1 –Survey of Women Who Recently Delivered a Child Rajsamand, Rajasthan
July 2015
DR. ESHA SHETH
Mr. Kshitiz Sisodia
Mr. Dinesh Songara
Working paper Series Model Districts Health Project
Columbia Global Centers | South Asia (Mumbai)
Earth Institute, Columbia University
Express Towers 11th Floor, Nariman Point, Mumbai 400021
globalcenters.columbia.edu/Mumbai

Understanding Barriers to Antenatal Care and Institutional Delivery in Rajsamand, Rajasthan- Survey
Page | 1
Table of Contents List of Acronyms ...................................................................................................................................... 4
Acknowledgments ................................................................................................................................... 5
Executive Summary ................................................................................................................................. 6
Columbia Global Centers | South Asia (Mumbai) ................................................................................. 10
Model Districts Health Project .............................................................................................................. 10
Introduction - Study .............................................................................................................................. 11
Background ........................................................................................................................................... 11
Antenatal Care .................................................................................................................................. 11
Anaemia and Nutrition ..................................................................................................................... 12
Institutional and Home Delivery ....................................................................................................... 13
Situation-Rajsamand: ........................................................................................................................ 14
Purpose of Study ................................................................................................................................... 14
Study Objectives ............................................................................................................................... 15
Materials and Methods ......................................................................................................................... 15
Sampling Frame ................................................................................................................................ 15
Mixed Methods Study ....................................................................................................................... 15
Part I- Quantitative Component- Survey .............................................................................................. 16
Study Design and Procedures ........................................................................................................... 16
Results ................................................................................................................................................... 17
A. Household and Background characteristics of Study Respondents ......................................... 17
1. Type of delivery and Block .................................................................................................... 17
2. Size of the family ................................................................................................................... 17
3. Household Head of the Family .............................................................................................. 17
4. Ration card, Job card, Agricultural land and Bank accounts ................................................. 18
5. Cell Phone Access .................................................................................................................. 18
6. Age group of respondents .................................................................................................... 18
7. Educational Background of the respondent ......................................................................... 20
8. Occupation of respondent .................................................................................................... 21
9. Information on Husband of respondent ............................................................................... 21
B. Antenatal Care (ANC) Services .................................................................................................. 23
1. Visit to a Health Facility for ANC check up ............................................................................ 23
2. Facility for First ANC Check Up .............................................................................................. 23
3. Personnel registering and conducting first ANC ................................................................... 24
4. Month of First ANC ............................................................................................................... 24

Understanding Barriers to Antenatal Care and Institutional Delivery in Rajsamand, Rajasthan- Survey
Page | 2
5. Reason for ANC Check Ups ................................................................................................... 25
6. ANC Check up by Dais/ Traditional Birth Attendants............................................................ 25
7. Number of times ANC check-up received ............................................................................. 26
8. Facilities accessed by women for ANCs ................................................................................ 27
9. People influencing women to go for ANC Check ups ........................................................... 27
10. ANC Tests and Examinations ............................................................................................. 27
11. Advice received during ANC check ups ............................................................................. 29
12. ASHA visits during pregnancy ........................................................................................... 30
13. Complications encountered during pregnancy ................................................................. 30
C. Nutrition and Iron Folic Acid Tablets during pregnancy ........................................................... 30
1. Diet during pregnancy ........................................................................................................... 30
2. IFA Received during pregnancy ............................................................................................. 31
3. IFA intake during pregnancy ................................................................................................. 31
4. Referral for Anaemia ............................................................................................................. 33
D. Delivery Information ................................................................................................................. 33
1. Number of Home and Institutional Deliveries ...................................................................... 33
2. Place of delivery .................................................................................................................... 35
3. People who accompanied women to facility/institution of delivery .................................... 38
4. Main person who assisted woman to conduct the delivery ................................................. 38
5. Mode of transport to reach institution/facility of delivery .................................................. 39
6. Distance, time and cost to reach delivery facility ................................................................. 40
7. Complications during the delivery ........................................................................................ 41
8. Expenditure incurred during delivery (other than transportation) ...................................... 43
9. Status of JSY received from public facilities .......................................................................... 45
E. Mamta Card Data ...................................................................................................................... 45
Discussion and Recommendations Based on Triangulation of Data .................................................... 46
1. Improve the perception of importance of ANC and Institutional delivery ............................... 46
2. Providing quality services to generate demand ....................................................................... 47
3. Improving MCHN Day Standards .............................................................................................. 47
4. Diverting Home Deliveries to Institutions – Addressing the Barriers ....................................... 48
5. Family Planning ......................................................................................................................... 49
6. Nutrition – Community Based Prevention ................................................................................ 50
7. Community Involvement- Do not depend on ASHA s alone ..................................................... 51
Conclusion ............................................................................................................................................. 51
Understanding Barriers to Antenatal Care and Institutional Delivery in Rajsamand, Rajasthan- Survey
Page | 3
References ............................................................................................................................................ 53
List of tables
Table 1: Type Of Delivery and Respondent’s Block .............................................................................. 17
Table 2: Cell Phone Accessibility ........................................................................................................... 18
Table 3: Age of Respondent at First pregnancy .................................................................................... 19
Table 4: Age of Respondent at Time of Marriage ................................................................................. 20
Table 5: Cross tabulation- Type of Delivery and Years of Schooling Completed .................................. 20
Table 6: Type of Delivery and Living Status with Husband ................................................................... 21
Table 7: Years of Schooling Completed by Husband ............................................................................ 22
Table 8: Occupation of Husband ........................................................................................................... 22
Table 9: Visit to Health Facility for ANC ................................................................................................ 23
Table 10: Facility visited for first ANC ................................................................................................... 23
Table 11: Personnel conducting first ANC ............................................................................................ 24
Table 12: Month of Pregnancy during first ANC cross tabulated with Type of Delivery ...................... 24
Table 13: Cross tabulation of number of ANCs and type of delivery .................................................... 26
Table 14: Cross tabulation- Number of ANC check-ups and blood test ............................................... 28
Table 15: Cross tabulation- Number of ANC check-ups and weight measured .................................... 28
Table 16: Table 17: Cross tabulation- Number of ANC check-ups and BP measured ........................... 29
Table 18: Cross tabulation- Number of ANC check-ups and urine test ................................................ 29
Table 19: Complication Information ..................................................................................................... 30
Table 20: IFA Tablets- Amount Consumed............................................................................................ 32
Table 21: IFA Tablets- Frequency of Consumption ............................................................................... 32
Table 22: Pregnant women who stopped IFA consumption................................................................. 33
Table 23: Cross tabulation: Type of delivery recently and number of home deliveries pregnant
woman has ever had ............................................................................................................................. 34
Table 24: Type of delivery recently and number of institutional deliveries ever had .......................... 35
Table 25: Home Delivery: Place ............................................................................................................ 35
Table 26: Reasons delivered at home ................................................................................................... 36
Table 27: Place of Institutional Delivery ............................................................................................... 37
Table 28: Person Accompanied to Place of delivery (Institutional) ...................................................... 38
Table 29: Person Assisted to conduct delivery ..................................................................................... 38
Table 30: Mode of Transport (Institutional Delivery) ........................................................................... 39
Table 31: Distance to Facility for delivery (Institutional) ...................................................................... 40
Table 32: Time to Reach Institution for Delivery .................................................................................. 40
Table 33: Cost to Reach facility for Delivery ......................................................................................... 41
Table 34: Complication during delivery ................................................................................................ 41
Table 35: Complication related information ......................................................................................... 42
Table 36: Time to reach referral facility ................................................................................................ 43
Table 37: Cost to reach referral facility ................................................................................................. 43
Table 38: Expenses incurred during delivery ........................................................................................ 43
Table 39: Expenditure for Delivery in Public and Private Institutions .................................................. 44
Table 40: JSY incentive status (Institutional Delivery) .......................................................................... 45

Understanding Barriers to Antenatal Care and Institutional Delivery in Rajsamand, Rajasthan- Survey
Page | 4
List of Acronyms
AHS Annual Health Survey
ANC Antenatal Care
ANM Auxiliary Nurse Midwife
APL Above Poverty Line
ASHA Accredited Social Health Activist
BPL Below Poverty Line
CES Coverage Evaluation Survey
EI Earth Institute
Hb Haemoglobin
HPD High Priority District
HD Home Delivery
ID Institutional Delivery
IFA Iron Folic Acid
IMR Infant Mortality Rate
JSY Janani Suraksha Yojana
LHV Lady Health Visitor
MCHN Maternal and Child Health and Nutrition Day
MDG Millennium Development Goals
MDHP Model Districts Health Project
MDP Model Districts Project
MMR Maternal Mortality Ratio
MNREGA Mahatma Gandhi National Rural Employment Guarantee Act
NFHS National Family Health Survey
NRHM National Rural Health Mission
PCTS Pregnancy Child Tracking Health Services and Management System
RMNCH+A Reproductive Maternal Neonatal Child and Adolescent Health
SIFHW State Institute of Family and Health Welfare
TBA Traditional Birth Attendant
WHO World Health Organization

Understanding Barriers to Antenatal Care and Institutional Delivery in Rajsamand, Rajasthan- Survey
Page | 5
Acknowledgments This research paper would not have been possible without the support of many people. The
MDHP team wishes to express their gratitude to Dr. Pritam B. Yashwant, IAS, former District
Collector and Dr. Tarun Chaudhary former Chief Medical Health Officer (now Project
Director, Maternal Health) of Rajsamand, Rajasthan for their invaluable assistance and
support during the conceptualization of the study. We would like to thank the District
Program Manager Mr. Vinit Dave, for his assistance and inputs during the implementation of
this research. We express our sincere appreciation to the team members of Prayas,
Chittorgarh who have supported the implementation of the study and to Mr. Kshitiz Sisodia
who co-analysed the survey data. Special thanks to Mission Director, National Health
Mission Rajasthan Mr. Naveen Jain, IAS, Dr. Anuradha Oswal, State Program Manager and
Dr. Tarun Chaudhary for their time, consideration and inputs during discussion of the study
results. Deepest gratitude is also due to the researchers Gargi Wable and Andrew Thorne-
Lyman for the preparation of the initial needs assessment, study and instrument design. We
express our appreciation to all the health personnel and study participants, who have given
us insightful perspectives on the situation and barriers to antenatal care and institutional
delivery in Rajsamand District. Finally, the team expresses immense appreciation to their
donor – IKEA Foundation for their continuous support.

Understanding Barriers to Antenatal Care and Institutional Delivery in Rajsamand, Rajasthan- Survey
Page | 6
Executive Summary The National Rural Health Mission focuses on extensive antenatal care and institutional
delivery services for pregnant women and their children in order to achieve Millennium
Development Goals 1, 4 and 5 related to nutrition, child and mortality. The network of
ANMs, ASHAs and Medical officers are crucial to provide the benefits of the established
public health system. However, implementation challenges prevent people from accessing
these services and health personnel from providing them.
Rajsamand is one such district of Rajasthan in India where poor ANC indicators and
stagnation of institutional delivery rates, especially in tribal zones was observed. At the
request of the (then) leadership in the district, Earth institute at Columbia University
conducted a study to assess the barriers experienced in antenatal care, nutrition, and
institutional delivery in two blocks, Bhim and Kumbhalgarh. However the results and
observations of this study hold true to many areas across different regions of Rajasthan,
based on the discussion with the State Health leadership.
The study used a mixed methods approach with a quantitative and qualitative component.
The survey with women who had delivered recently at home or an institution, gauged the
situation of ANC and delivery services. Late registrations and quality of care were the
primary concern highlighted in the data. The reasons varied from structural barriers like
distance and time to consumer related barriers such as superstition and low importance
perceived of benefits. Reasons for home delivery were related to delay in decision making
coupled with ‘convenience ‘factor of home. Key informant interviews with health personnel
highlighted the system and beneficiary barriers which make it tough for them to perform
their duties. Focus group observations with community members (ASHAs, mother in-laws,
religious leaders and Dais) showed that Dais are still trusted members in many communities
that depend on their experience and skill for conducting deliveries. Therefore communities
do not always see the advantages of delivering at an institution. Misconceptions about
nutrition prevent them for continuing with their normal diet which includes buttermilk and
ghee. One of the reasons for delivering at home was also people not willing to stay for 48
hours at an institution. Migration in these areas makes it difficult to track a pregnant woman
from pregnancy to delivery and providing her the full coverage of services.

Understanding Barriers to Antenatal Care and Institutional Delivery in Rajsamand, Rajasthan- Survey
Page | 7
Based on the triangulation of information from the survey, key Informant Interviews and
focus group discussions, the following recommendations need consideration and
prioritization:
1. Improve the perception of importance of ANC and Institutional delivery
Late ANC registration reduces the number of check-ups and contact with ANM for
health related information. Barriers related to attending MCHN day impedes full
coverage. Therefore efforts need to be focused on improving the awareness of
benefits of ANC and institutional delivery through more rigorous IEC. Only when the
perception improves will there be a more permanent change in demand.
2. Providing quality services to generate demand
The want for quality services play a role in where the woman and her family choose
to deliver. This is apparent through the benefits they perceive at a private
institution-manpower, attentive care, faster delivery and fewer days of stay. Trust in
Dais or experienced health personnel’s skills also influence their decision making.
3. Improving MCHN Day Standards and Supervision
Having skilled ANMs is crucial to motivate the women to attend ANCs and help her
understand the benefits. The basic tests are not being conducted rigorously. Quality
supervision is required not only to monitor the quality of ANMs work, but also to
draw out the implementation challenges to resolve bottlenecks.
4. Diverting Home Deliveries to Institutions – Addressing the Barriers
Analysis of barriers related to access institutions for delivery highlighted that
although most villages are located within an hour of reach, difficult terrains, cell
phone access barrier, higher use of private vehicles leading to out of pocket
expenditure, might influence families to choose the more ‘convenient’ option of
home delivery.
Strengthening Subcenters as delivery points to address access and
delayed decision making

Understanding Barriers to Antenatal Care and Institutional Delivery in Rajsamand, Rajasthan- Survey
Page | 8
A plan for better use and monitoring of government sanctioned
vehicles
A systematic transport and referral plan for sectors with high home
deliveries
IEC that uses risk messages with positive framing should be applied.
Involving the Panchayat to bring awareness in the community
regarding timely access for pregnant women and the child is crucial.
5. Family Planning
Efforts to delay first pregnancy needs further stress. IEC strategy with innovative
ways of reach and communicate must be adopted. Counsel cannot be simply given
to women, but to men and their community as well. Indirect effects and benefits of
delaying early pregnancies, including health benefits for the child and economic
benefits for the family must be emphasized.
6. Nutrition – Community Based Prevention
Based on the study results, focus on community based prevention of malnutrition is
crucial.
If woman were to more clearly understand the benefits of IFA not only for
themselves, but their child, may be uptake would be better. Adolescent girls
who already have poor nutrition get married and pregnant early. If
community members instead of just the ASHA and ANM counsel pregnant
and lactating women, the acceptance will be better.
Dietary misconceptions regarding ‘ghee and buttermilk’ intake during
pregnancies should be cleared
Good nutrition should be discussed as a community norm. Women might not
perceive its importance as they don’t understand the developmental and
cognitive effects it has on the child.
7. Community Involvement- Do not depend on ASHA s alone

Understanding Barriers to Antenatal Care and Institutional Delivery in Rajsamand, Rajasthan- Survey
Page | 9
Results show that there is no one key person who influences decision making of the
woman regarding her pregnancy care and delivery. But the community norms as a
whole do. Involvement of more peer women, committees or groups and the
Panchayat would help the ASHA and ANM in their work.
Only when practices about good nutrition, ANC and institutional delivery become a
norm in the community is acceptance better and it creates a demand from the
consumer side to access the benefits of a public health system.
This Working Paper is a three part Series where the results of each of the 3 study
components- Survey, Key Informant Interviews and Focus Group, has been separately
presented. However the key recommendations provided are a triangulation of the data
and findings from all 3 components of this mixed methods study. This is Part I of the
Series- Survey.

Understanding Barriers to Antenatal Care and Institutional Delivery in Rajsamand, Rajasthan- Survey
Page | 10
Columbia Global Centers | South Asia (Mumbai) The Columbia Global Centers | South Asia is part of a network of Columbia Global Centers
that the University has launched around the world. The Center seeks to engage in activities
and research linked to business, health, environment, education, urban planning,
infrastructure, economic development, arts and culture, by providing a base throughout
South Asia. It is a platform for academic partnerships, schools and programs at the
University and locally in this region to collaboratively examine discuss and find solutions to
complex issues in the various disciplines. Through leveraging its world-class thought leaders,
sharing resources, and conducting innovative projects using a multidisciplinary approach,
Columbia Global Centers | South Asia aims to engage students, faculty and stakeholders in a
truly global conversation.
Model Districts Health Project The Model Districts Health Project was launched in 2010 as a joint initiative between the
Earth Institute and Ministry of Health and Family Welfare, Government of India. Its aim was
to demonstrate and support health and nutrition based interventions and activities to
address the policy–practice gaps that were highlighted in the mid –term evaluation of
NRHM by Earth Institute (Bajpai et al, 2011). More specifically the focus is on the
Millennium Development Goals 1, 4 and 5. Currently the project is under the Center for
Sustainable Development at Earth Institute and is working in three states- Rajasthan,
Telangana and Jharkhand. Within these states EI works in two districts, one which was
selected for the Model Districts Project and one High Priority District where EI is the lead
development partner for RMNCH+A. In Rajasthan, Dausa and Rajsamand (HPD), in
Telangana, Medak and Mahbubnagar (HPD) and in Jharkhand, Khunti and Simdega (HPD)
were selected for implementation of the Models District concept.
The Model Districts Project focuses on health systems strengthening through
implementation research, strategic technical advice, monitoring and evaluation, and policy
advocacy to help ensure the successful scaling up of services. It is ultimately the district
governments and district health units that are responsible for implementing the quality
improvements, best practices, and innovations based on the situational analysis. State

Understanding Barriers to Antenatal Care and Institutional Delivery in Rajsamand, Rajasthan- Survey
Page | 11
governments and NRHM offices have a key role to play in driving innovations at a district
level, and providing additional funding on evidence based need.
Introduction - Study NRHM provides an extensive array of maternal health services to improve the health
outcomes for women and children to achieve Millennium Development Goals 1, 4 and 5.
The packages are comprehensive ranging from family planning services, nutrition, antenatal
care, and safe deliveries, post-natal care for mother and child and management of
complications at all crucial stages. Monetary incentives for the mothers to render these
services and for health cadre to provide them efficiently are given to optimize usage and
motivate them to engage with the health system. Providing services which are accessible
and affordable play a crucial role in improving health indicators.
Under the Reproductive, Maternal, Neonatal Child and Adolescent Health (RMNCH+A)
program a continuum of care is maintained at different stages. However implementation
challenges at ground level impede and slow down the processes of achieving positive
changes. Assessing factors that can be changed or approached differently based on ground
reality, practicality and feasibility is important while designing health systems for equitable
health care.
Earth institute at Columbia University is the lead development partner for RMNCH+A
activities in Rajsamand and works closely with the District Health Team providing technical
support and conducting regular gap assessments. Some of the tribal regions in the district
had poor indicators for antenatal care, anaemia and pockets of high home delivery load.
This study was undertaken at the request of the then District Collector and in consultation
with the Chief Medical Health Officer to assess the situation and specifically focus on the
barriers faced in Rajsamand.
Background
Antenatal Care
NRHM offers ANC which includes at least 4 ANCs check-ups, early registration within first
trimester along with physical and abdominal examinations, Hb estimation and urine

Understanding Barriers to Antenatal Care and Institutional Delivery in Rajsamand, Rajasthan- Survey
Page | 12
investigation, two doses of Tetanus Immunization and consumption of IFA tablets1. However
there are barriers related to structure, norms, capacity and monitoring that impede efficient
and effective ANC care. A community based study carried out in a tribal district of India
highlighted that although a significantly high percentage of women were receiving ANC care
at least 3 or more times, early registration rates were still poor as women were not
motivated to come on their own accord for check-ups. Additionally the quality of ANC was
poor (Bhaisare, Rao, & Khakase, 2015). In the rural north region of India, it was evaluated
that although pregnant women had good knowledge on ANC, age and literacy had a
significant association with utilization rates. 80% of women were delivering at institutions
but registration within first trimester was still very low (Gupta et al., 2015). Another study
assessed the coverage of ANC services at subcenters. Although 70% of women registered for
ANCs, only 50% registered in the first trimester and only 29% had at least 3 visits.
Additionally the women who had IFA for 100 days or more, was negligible (Singh et al.,
2015). Although Maternal Mortality rates have decreased from 212 in 2007 to 167 in 2013,
the progress has been slow (MMR Bulletin). ASHAs role in informing about ANC services and
ANM providing them is crucial to the success of timely and key ANC services. Although
NRHM has been able to set up services in most remote regions quality and coverage are
crucial at this stage.
Anaemia and Nutrition
Anaemia during pregnancy has important consequences for both a mother and her child. It
is responsible for 120,000 maternal deaths each year globally, and 18% of maternal
mortality in low and middle income countries (WHO 2009). According to the World Health
Organization, anaemia affects half a billion women of reproductive age worldwide. In 2011,
29 % (496 million) of non-pregnant and 38% (32 million) of pregnant women aged 15-49
years were anaemic (WHO 2011). South Asia and Central and West Africa bear most of the
burden of anaemia cases (WHO Anaemia Policy Brief). The prevalence of anaemia in
pregnant women in India is 58% and accounts for 20% maternal deaths (National Iron Plus
Initiative). Therefore the National Iron Plus Initiative has recommended, Iron Folic Acid
Supplementation for 100 days during pregnancy and post-partum. However distribution and
compliance for IFA consumption has been an issue. A study in southern India found that the
1 National Rural Health Mission

Understanding Barriers to Antenatal Care and Institutional Delivery in Rajsamand, Rajasthan- Survey
Page | 13
compliance of IFA was moderate; with the main reasons for noncompliance being
forgetfulness, travel, constipation and vomiting. The side effects noted were vomiting and
gastritis (Mithra et al., 2013). A study in Bihar found that women were more likely to receive
IFA if they had higher number of counselling and ANC services, and IFA consumption would
be optimum if she has at least 4 ANC visits or more (Wendt et al., 2015). The prevalence of
anaemia among women in Rajasthan increased from 1998 to 2005, from 48.0% to 53.7%
(Balarajan et al., 2013). As per NFHS 3 prevalence of anaemia among pregnant women (15-
49) in Rajasthan was 61.7%. These figures highlight the importance of reducing anaemia in
pregnancy for a substantial impact on maternal and child health indicators.
Institutional and Home Delivery
Skilled birth attendance is a key factor in determining maternal and child outcomes along
the continuum of care. These health professionals are expected to manage normal
pregnancies, deliveries, and postnatal care, and identify, manage, or refer complications for
women who are delivering and infants (WHO 2005). It has been estimated that almost 40%
of pregnancies could require specialized services, and about 15% of all pregnant women
develop complications during the intra-partum and immediate post-partum period needing
access to emergency obstetric care (Fauveau 2004). A review on Global causes of maternal
deaths from 2003-2009 showed that 73% of all deaths from the sample were due to
obstetric causes (Sal et al.). Delivery at an institution provides not only skilled birth
attendance but also equipment and referral mechanisms to handle basic and emergency
obstetric complications. As per CES 2009, institutional delivery rate was 68% in rural India.
Improvement of institutional delivery rates, improves the coverage of skilled birth
attendance with the advantages of having it at a facility. A study examined trends from two
nationally representative survey sample determined that economic status is a more
important determinant of institutional birth rather than access and distance. The
importance of focusing on generating demand from users was highlighted. The influence of
family member’s role in decision making has not always been consistent and holds differing
level of importance. Therefore although this should be considered within the framework for
planning improvement in intuitional delivery, other factors influencing women should be
explored (Bruce et al., 2015).

Understanding Barriers to Antenatal Care and Institutional Delivery in Rajsamand, Rajasthan- Survey
Page | 14
Situation-Rajsamand:
Rajsamand is a small, hilly district in Rajasthan with an area of 4500 square kilometers. It has
a population of 1.2 million, 84% of which live in rural areas. Female literacy remains low at
48%2.
Maternal Mortality: While MMR in Rajsamand has apparently declined from 364 in 2010-11
to 265 in 2012-2013 as per AHS it remains far behind the state’s MDG target of 248
maternal deaths per 1,00,000 live births by 2012-133.
Anaemia: In 2012-2013 the number of women who had haemoglobin below 11 gm/dl was
20735 against 36588 registered for ANC (57%)4. In 2013-2014 the number of women who
had haemoglobin below 11gm/dl was 26931 against 32932 registered for ANC (82%)5.
ANC Registration: In 2012-2013 18701 women registered in first trimester against 36588
ANC (51%)4. In 2013-2014 19550 women registered in first trimester against 32932 ANCs
registered (59%)5. Although it is improving, it is low and requires special focus.
Percentage of Institutional Delivery: Institutional deliveries amongst the total deliveries
reported for the district was 89.06% in 2013-20144 vs 89% in 2012-20135. This underscored
stagnation in the rate of institutional deliveries in Rajsamand. Additionally the number
unreported home delivery is a concern.
Purpose of Study
Based on the national, state and district scenario, a joint decision between Earth Institute
and the District Unit was undertaken for EI to conduct a study to understand the status of
antenatal care services and the reasons for home deliveries in Rajsamand, focusing on
barriers. Findings of the study would enable data driven informed decision making at all
levels of the health system by the State, District and development partners to
collaboratively address the gaps and re-think strategy where applicable. As most issues cut
across all districts in Rajasthan, many of the findings would be relevant to other parts of the
state as well.
2 Census 2011
3 Annual Health Survey 2012-2013
4 Pregnancy Child Tracking Health Services Management System2012-2013
5 Pregnancy Child Tracking Health Services Management System2013-2014

Understanding Barriers to Antenatal Care and Institutional Delivery in Rajsamand, Rajasthan- Survey
Page | 15
Study Objectives
1. Explain barriers and facilitators of antenatal care
2. Explain reasons for home delivery to make evidence based- recommendations
a. Assess the factors influencing delivery outside of institutions/home deliveries
and perceptions about how those factors could be addressed among
community members and healthcare providers
3. Explain the barriers and facilitators to prevention and treatment of anaemia during
pregnancy
a. Assess coverage of preventive iron-folic acid - distribution and compliance
among pregnant women
Materials and Methods
Sampling Frame
Kumbhalgarh and Bhim blocks were selected for the sampling frame as they have a high
proportion of tribal population and highest number of reported home deliveries compared
to other blocks (834 in Kumbhalgarh and 713 in Bhim, the total for Rajsamand being 33795).
They contribute to almost 50% of home deliveries for the whole block. Over 50% of public
health facilities are understaffed. Access to health facilities in these blocks is also difficult
and not easy for all users of the health system, given the hilly terrain and hard-to-reach
areas.
Mixed Methods Study
This study consisted of 3 components to understand the study objectives:
1. A quantitative survey which included women who had delivered a child in the last 1
year (age group 18-45 years)
2. Focus Groups with ASHAs, traditional birth attendants (dais), religious leaders and
mother-in-laws
3. Key Informant Interviews with health service providers –ANMs, LHVs, Medical
Officers, ASHA facilitators
Understanding Barriers to Antenatal Care and Institutional Delivery in Rajsamand, Rajasthan- Survey
Page | 16
Part I- Quantitative Component- Survey
Study Design and Procedures
Sampling
A purposive stratified sampling approach was used. Bhim and Kumbhalgarh was the
sampling frame for the study. Each of these blocks is divided into sectors. From each sector
one or two health facilities was chosen that had a high number of reported home deliveries
in their catchment area based on analysis on one and half year data in PCTS. Registers from
these facilities were used to choose the sample of women who delivered at an institution
and at those who delivered at home, to assess antenatal care and delivery experience.
Study Subjects and Sample Size
Women who had delivered a child in the last 1 year at the time of the survey (November
2013 to October 2014) in the age group of 18-45 years were included in the survey. A total
of 426 women participated. Four were excluded from analysis due to inconsistencies in
data. Therefore the sample size for analysis was 422.
Study Instrument and Data Collection
A comprehensive questionnaire was designed that covered respondent’s household and
background information, ANC services undertaken, iron folic acid consumption and child
delivery information in different sections. The questionnaire was translated in Hindi and
piloted in the field by Prayas, Chittorgarh. The survey team from Prayas was trained by
MDHP to administer the interview based questionnaire at a household level.
Ethical Approval
The study was approved by the Columbia University Institutional Review Board and Prayas
Chittorgarh, Ethical Committee provided the in country approval. Before administering the
survey informed consent was taken from the participants.
Statistical procedures
Data cleaning and descriptive analysis was carried out in SPSS, conjointly by researcher from
MDHP, EI and Prayas, Chittorgarh.

Understanding Barriers to Antenatal Care and Institutional Delivery in Rajsamand, Rajasthan- Survey
Page | 17
Results
A. Household and Background characteristics of Study Respondents
(Women Age group 18-45 who had delivered a child in the last 1 year)
1. Type of delivery and Block
Table 1: Type Of Delivery and Respondent’s Block
Type of Delivery Block of Respondent Total
Kumbhalgarh Bhim
Home Delivery 100 (48%) 108 (52%) 208
Institutional Delivery 109 (51%) 105 (49%) 214
Total 209 213 422
422 women’s surveys were analysed from Bhim and Kumbhalgarh blocks in Rajsamand.
209 and 213 women from Kumbhalgarh and Bhim were surveyed respectively
Home Deliveries: 208 women from the sample had undergone a home delivery for
their last delivery. 48% of them belonged to Kumbhalgarh and 52% were from Bhim
Institutional deliveries: 214 women from the sample had undergone institutional
deliveries, 51% of them were from Kumbhalgarh and 49% from Bhim.
2. Size of the family
Majority (62%) of the women from the total sample belonged to families that had 5-
8 members living in the household.
20% of the sample belonged to a family size of 1-4 members while 15% belonged to
a 9-12 member family size.
More than half, 53%, of the sample belonged to extended families while the rest
47% belonged to nuclear family.
There was no significant difference observed in the proportion between the two groups
(women who delivered at home and at an institution) in comparing the type of families
(nuclear or extended) they belonged to.
3. Household Head of the Family
The general pattern observed were males being the household head (93%).
56% of women responded that their husbands were heads
36% of the women responded their father in law were head of the family
In 5% of the families, mother in laws were found to be head of their family

Understanding Barriers to Antenatal Care and Institutional Delivery in Rajsamand, Rajasthan- Survey
Page | 18
4. Ration card, Job card, Agricultural land and Bank accounts
97% families of respondents had at least some type of ration card available
o 65% had Blue Ration card (APL)
o 26% had Red Ration card (BPL)
o 6% had Pink Card Ration card (Antodaya)
60% the women responded that at least one member in the family had the MNREGA
job card
400 (95%) of the women’s family had their own agricultural land
86% of the surveyed women or somebody else in their family had bank account.
5. Cell Phone Access
More than half of the women (53%) were found not to have their own cell phones
68% of the women reported that no one from their family and friends had cell
phones
41% of the women were found to have no access to cell phones at all; since neither
they nor anybody in their family had cell phones.
This data highlights the difficulty that could be potentially faced by them to contact ASHAs
and referral services in case of emergencies.
Table 2: Cell Phone Accessibility
Respondent has her own cell phone
Family/Friends/neighbours Own Cell phone
Total
No Yes
No 170 (40.7%) 50 (12%) 220
Yes 116 (28%) 81 (19.3%) 197
Total 286 131 417 Note: Percentages are calculated by keeping total (417) as the denominator and missing values are not
accounted in the total, hence the total 417 instead of 422.
6. Age group of respondents
Most of the women belonged to the age groups 21-25 years and 26-30 years. About 12% of
the women to the age category of 18-20 year and since we took the women who delivered
in last 1 year as inclusion criteria in for the sample, it also demonstrates early pregnancies in
this group.

Understanding Barriers to Antenatal Care and Institutional Delivery in Rajsamand, Rajasthan- Survey
Page | 19
Figure 1: Age Group of Respondents
Table 3: Age of Respondent at First pregnancy
Age of the respondent at the
time of their first pregnancy
Frequency Percent Cumulative Percent
16-20 Years 311 74 74
21-25 Years 105 25 99
26-30 3 0.7 99
31-35 1 0.2 100
Total 420 100 Note: Missing values not accounted in analysis
As it can be seen from the above table that about 74% of the women had their
pregnancy within the age group of 16-20 years. This highlights the prevalence of
early pregnancies at a young age which could pose a threat to their health.
Only 25% of the women had their first pregnancy in the age group of 21-25 years,
while 1% of the women had it after 25 years of age.
Understanding Barriers to Antenatal Care and Institutional Delivery in Rajsamand, Rajasthan- Survey
Page | 20
Table 4: Age of Respondent at Time of Marriage
Age-Group of the
Respondent at the time
of her marriage
Frequency Percent Valid Percent Cumulative
Percent
10 years & Under 24 5.7 5.7 5.7
11-17 Years 198 46.9 46.9 52.6
18-24 Years 197 46.7 46.7 99.3
25-31 Years 3 0.7 0.7 100.0
Total 422 100.0 100.0
53% of the women in the sample had got married before attaining the legal age of
marriage. Early marriage leads to early pregnancies which could fall into the category
of high risk pregnancies.
46.7% of the women got married between the age group of 18-24 years.
1% of the women who got married in the age group of 25-31 years.
7. Educational Background of the respondent
56% of the women have never attended school and a very few (1.5%) of them have
attended school till 12 or above.
Women having home deliveries and not having attended school previously (63%) are
a little more in number than women who had institutional deliveries (50%)
Table 5: Cross tabulation- Type of Delivery and Years of Schooling Completed
Type of Delivery
Years of School Completed by the Respondent Total
No Schooling
1st to 4th Std.
5th to 7th Std.
8th to 11th Std.
12 or Above
Home Deliveries
129 (62.6%)
33 (16%) 31 (15.1%) 12 (5.8%) 1 (.5%) 206
Institutional Deliveries
106 (49.5%)
34 (15.9%) 34 (15.9%) 34 (15.9%) 6 (2.8%) 214
Total 235 (56%) 67 (16%) 65 (15.5%) 46 (11%) 7 (1.5%) 420 Note: Percentage is calculated on total home deliveries and institutional deliveries and missing values are not accounted in the total, hence the total 420 instead of 422.

Understanding Barriers to Antenatal Care and Institutional Delivery in Rajsamand, Rajasthan- Survey
Page | 21
Figure 2: Bar Chart- Years of Schooling Completed by Respondent
8. Occupation of respondent
Almost 98% of the women were home makers and very less few were engaged in
any primary occupation.
9. Information on Husband of respondent
Location of Husband: There is no apparent difference between the two groups -
women who delivered at institution and at home and if they live with their husband.
The factor of living with husband does not seem to play a prominent role and
affecting the outcome of delivering at home or institution
Table 6: Type of Delivery and Living Status with Husband
Living with Husband Frequency Percent
Valid
Percent
Cumulative
Percent
Home Delivery Currently Living with her
husband 147 70.7 70.7 70.7
Husband is out for work 61 29.3 29.3 100.0
Total 208 100.0 100.0
Institutional
Delivery
Currently Living with her
husband 151 70.6 70.6 70.6
Husband is out for work 61 28.5 28.5 99.1
Divorcee/Widow 2 0.9 0.9 100
Total 214 100 100

Understanding Barriers to Antenatal Care and Institutional Delivery in Rajsamand, Rajasthan- Survey
Page | 22
Schooling of Husband: Most of the respondents’ husband had attended school from
5th to 7th Std. (26%) and 8th to 11th Std. (40%)
About 47% of the respondents’ husbands have received education up to 8th grade or
higher
There did not seem to be any major difference in schooling years of husband
between the group of women who had institutional delivery and home delivery
Table 7: Years of Schooling Completed by Husband
Schooling Years of Husband Frequency Percent Cumulative Percent
No Schooling 60 14.3 14.3
1st to 4th Std. 56 13.3 27.6
5th to 7th Std. 109 26.0 53.6
8th-11th Std. 165 39.3 92.9
12 or Above 24 5.7 98.6
Don’t Know 6 1.4 100.0
Total 420 100.0
Note: 2 missing responses not considered
Occupation of Husband: Most of the respondents’ husbands (60.3%) were labourers.
Migratory labour constituted the 21.7% of the total respondents’ husband
occupation, with no significant difference between the group of women who had
institutional delivery and home delivery.
Table 8: Occupation of Husband
Occupation of the Respondents’
husband Frequency Percent
Cumulative
Percent
Shop owner/Business 35 8.3 8.3
Farm Owner 58 13.8 22.1
Labour in Farms 60 14.3 36.4
Migrated Labour 91 21.7 58.1
Labour in Mines 53 12.6 70.7
Labour 49 11.7 82.4
Others 74 17.6 100.0
Total 420 100.0

Understanding Barriers to Antenatal Care and Institutional Delivery in Rajsamand, Rajasthan- Survey
Page | 23
Note: 2 missing responses not considered
B. Antenatal Care (ANC) Services
1. Visit to a Health Facility for ANC check up
Table 9: Visit to Health Facility for ANC
Women who delivered child in last
1 year had visited facility for ANC Frequency Percent Valid Percent
Cumulative
Percent
Home Delivery No 6 2.9 2.9 2.9
Yes 202 97.1 97.1 100.0
Total 208 100.0 100.0
Institutional Delivery Yes 214 100.0 100.0 100.0
From 422 women in the sample 416 registered and visited the health facility for ANC check-
up. The 6 women who did not were eventual cases of home delivery.
Out of the 416 who did visit the facility and register for a check-up for ANC check-up,
1 woman was not able to have any check-ups as she reached the facility late and did
not try going again.
98% of the women who registered reported that they received a Mamta Card.
However within a year or less only 302 participants were able to show the card at
the time of the survey.
2. Facility for First ANC Check Up Table 10: Facility visited for first ANC
Facility visited for First ANC Frequency Percentage
PHC/CHC/Higher Facility 34 8%
Sub-center 26 7%
MCHN day 336 81%
Private NGO Trust Hospital /Clinic/Maternity Home 19 4%
Total 415 100%
N/A 7
Sample Size 422
81% of 415 women who had an ANC check-up, had their first ANC check-up at MCHN
days
8% had their first ANC at PHCs, CHCs or higher district level facilities

Understanding Barriers to Antenatal Care and Institutional Delivery in Rajsamand, Rajasthan- Survey
Page | 24
4% had their first ANC at a private maternity home, institution/clinic/NGO
3. Personnel registering and conducting first ANC
83% were registered by the ANMs at SCs and MCHN days and 13% by Government
Staff nurse.
Table 11: Personnel conducting first ANC
Health personnel
conducted the first
ANC check up
Frequency Percent Valid Percent Cumulative
Percent
ANM 328 77.7 79.0 79.0
Doctor 30 7.1 7.2 86.3
Nurse 57 13.5 13.7 100.0
Total 415 98.3 100.0
NA 7 1.7
Total 422 100.0
4. Month of First ANC
48% women had first ANC after first trimester
Women who delivered at home: Less than half the women, 45%, had their first ANC
check up in the first trimester
Women who delivered at institution: Just over half the women, 60% had their first
ANC in the first trimester. Therefore a higher proportion of women who had
registered in the first trimester delivered at an institution rather than home.
Table 12: Month of Pregnancy during first ANC cross tabulated with Type of Delivery
Month of
First ANC Frequency Percent Valid Percent
Cumulative
Percent
Home
Delivery
2 8 3.8 4.0 4.0
3 83 39.9 41.3 45.3
4 39 18.8 19.4 64.7
5 30 14.4 14.9 79.6
6 25 12.0 12.4 92.0
7 11 5.3 5.5 97.5
8 2 1.0 1.0 98.5
9 2 1.0 1.0 99.5
DK 1 0.5 0.5 100.0

Understanding Barriers to Antenatal Care and Institutional Delivery in Rajsamand, Rajasthan- Survey
Page | 25
Total 201 96.6 100.0
NA 7 3.4
Total 208 100.0
Institutional
Delivery
2 22 10.3 10.3 10.3
3 106 49.5 49.5 59.8
4 37 17.3 17.3 77.1
5 22 10.3 10.3 87.4
6 14 6.5 6.5 93.9
7 11 5.1 5.1 99.1
8 2 .9 .9 100.0
Total 214 100.0 100.0
Reason for ANC check-up after first trimester
195 out of 415 women had their check up after first trimester because:
126 women were not aware that they had to register within 12 weeks
81 one did not feel it was necessary because they did not have health problem
40 claimed that they were not informed that they were to register with 12 weeks
42 women were shy to inform anyone
5. Reason for ANC Check Ups
92% of the women who had received check-up stated that it was only for ANC and
8% went due to a problem
47% (almost half) of the women reported that nobody explained to them why ANC
was being done
Reasons reported by the women for not having even 1 ANC check up
They did not think it was necessary
They did not have transportation to go for a check up
ASHA did not inform them
Their family did not allow them to go
Reached late and MCHN day was over
6. ANC Check up by Dais/ Traditional Birth Attendants
Only 8 women went to a Dai for a check-up mostly during the later months, in the
third trimester if they had problem, to get their abdomen examined.

Understanding Barriers to Antenatal Care and Institutional Delivery in Rajsamand, Rajasthan- Survey
Page | 26
7. Number of times ANC check-up received
69% of the women who delivered at home and 85% of the women who delivered at
an institution had at least 3 ANC check ups
Within the sample of women who eventually delivered at home 25% had 4 ANC
check-ups or more while 43% of women who eventually delivered at institutions had
4 ANC check-ups or more.
Therefore the trend in the data shows that if a woman had more ANC check-ups,
there were higher chances of delivering at an institution.
Table 13: Cross tabulation of number of ANCs and type of delivery
Delivery
Type
Number of
ANCs
Frequency Percent Valid Percent Cumulative
Percent
Home
delivery 1 16 7.7 8.0 8.0
2 46 22.1 22.9 30.8
3 87 41.8 43.3 74.1
4 33 15.9 16.4 90.5
5 10 4.8 5.0 95.5
6 6 2.9 3.0 98.5
7 1 .5 .5 99.0
8 2 1.0 1.0 100.0
Total 201 96.6 100.0
NA 7 3.4
Total 208 100.0
Institutional
Delivery 1 5 2.3 2.3 2.3
2 27 12.6 12.6 15.0
3 91 42.5 42.5 57.5
4 48 22.4 22.4 79.9
5 20 9.3 9.3 89.3
6 15 7.0 7.0 96.3
7 4 1.9 1.9 98.1
8 3 1.4 1.4 99.5
11 1 .5 .5 100.0
Total 214 100.0 100.0
Reasons described for not completing 3 ANCs
95 women could not complete a minimum required 3 ANCs

Understanding Barriers to Antenatal Care and Institutional Delivery in Rajsamand, Rajasthan- Survey
Page | 27
68 (71%) women thought it was not necessary
22 women did not remember to go
15 women did not have anyone to accompany them
14 women stated that ASHA did not inform them
13 women had no time to go
8. Facilities accessed by women for ANCs
Out of 415 women who had their ANC:
361 attended MCHN days
85 women went to SCs
69 women went to PHCs
48 women went to CHCs
80 women accessed private institutions/clinics/maternity homes/NGOs
9. People influencing women to go for ANC Check ups
It does not seem that particularly mother-in-laws or ASHAs or husbands influence a
women’s decision to access ANC care. It might vary family to family and each pregnant
woman’s circumstance might be different. Therefore focusing on raising the importance of
ANC to the community as a whole is more crucial rather than targeting once specific group
of people within the family or community.
191 women went on their own accord
123 reported their husbands also told them to get ANC done
108 women were influenced by ASHAs
47 were influenced by their mother-in –law
10. ANC Tests and Examinations
Women that reported the following tests and examinations were conducted during ANC (at
least once)
Weight Measured – 91%
Blood Pressure- 91%
Blood test – 90%
Urines Test- 61%
Abdomen- 74%

Understanding Barriers to Antenatal Care and Institutional Delivery in Rajsamand, Rajasthan- Survey
Page | 28
General Well Being- 54%
40% of women in the sample had under a sonogram out of which 60% went to a
private facility
Number of times tested/examined
Although most of the above results look positive, the number of times each test has
been conducted is low as compared to the requirement, as reported by the women.
When the number of times each test/examination was done was compared to the
number of ANCs reported, women who had at least 3 ANCs or more showed a
downward trend of the number of times they were tested or examined for individual
tests.
Table 14: Cross tabulation- Number of ANC check-ups and blood test
Number of
ANC check ups
Number of times blood test done during ANC check ups
Total 1 2 3 4 5 6 7
1 12 0 0 0 0 0 0 12
2 32 28 0 0 0 0 0 60
3 61 52 49 1 0 0 0 163
4 27 26 12 13 0 0 0 78
5 9 11 6 1 2 0 0 29
6 3 3 10 2 0 3 0 21
7 2 1 0 0 0 0 2 5
8 0 2 2 1 0 0 0 5
11 0 0 1 0 0 0 0 1
Total 146 123 80 18 2 3 2 374
Out of 302 who had 3 ANCs or more 65% had their blood tested 2 times or less
Table 15: Cross tabulation- Number of ANC check-ups and weight measured
Number of ANC
check ups
Number of times weight was measured during ANC check ups Total
1 2 3 4 5 6
1 12 0 0 0 0 0 12
2 13 52 0 0 0 0 65
3 30 68 61 0 0 0 159
4 15 29 20 15 0 0 79
5 3 10 14 1 1 0 29
6 2 2 9 3 0 5 21
7 1 1 2 1 0 0 5
8 1 3 1 0 0 0 5
11 0 0 0 1 0 0 1
Total 77 165 107 21 1 5 376
Understanding Barriers to Antenatal Care and Institutional Delivery in Rajsamand, Rajasthan- Survey
Page | 29
Out of 299 who had 3 ANCs or more, 55% had weight measured 2 times or less
Table 16: Table 17: Cross tabulation- Number of ANC check-ups and BP measured
Number of ANC
check ups
How many times was BP measured during ANC check ups Total
1 2 3 4 5 6 7
1 14 0 0 0 0 0 0 14
2 18 47 1 0 0 0 0 66
3 38 60 67 0 0 0 0 165
4 17 29 13 17 0 0 0 76
5 5 11 10 0 2 0 0 28
6 1 2 10 2 0 4 0 19
7 0 2 0 1 0 1 1 5
8 0 3 1 1 0 0 0 5
11 1 0 0 0 0 0 0 1
Total 94 154 102 21 2 5 1 379
56% of 299 women who had 3 ANCs or more, had they BP checked less than 3 times
Table 18: Cross tabulation- Number of ANC check-ups and urine test
Number of ANC
check ups
How many times was urine test during ANC check ups
Total 1 2 3 4 5 6
1 5 0 0 0 0 0 5
2 25 9 0 0 0 0 34
3 53 34 21 1 0 0 109
4 31 15 10 3 0 0 59
5 9 8 3 0 1 0 21
6 5 4 6 0 0 2 17
7 2 1 1 1 0 0 5
8 4 0 0 0 0 0 4
11 1 0 0 0 0 0 1
Total 135 71 41 5 1 2 255
Out of 219 women who had ANC at least 3 times or more, 76% had urine test less than 3
times
11. Advice received during ANC check ups
Women who reported receiving the following advice during ANCs
Delivery Date: 67%
Rest During pregnancy: 83%
Diet during pregnancy: 89%
Benefits of IFA: 92%
Institutional Delivery: 82%

Understanding Barriers to Antenatal Care and Institutional Delivery in Rajsamand, Rajasthan- Survey
Page | 30
Transportation Services: 73%
12. ASHA visits during pregnancy
85% (352) of women reported that they had been visited by an ASHA during their
pregnancy
34% were very satisfied and 64% were somewhat satisfied with the support given by
them
13. Complications encountered during pregnancy
Table 19: Complication Information
Complication Frequency (out of the 415 women who had ANC)
Percentage that sought care
Most common facility reported where care was sought
Severe Fever 58 90% SC, PHC, CHC, Govt. Facility
Persistent Vomiting
94 76% Doctor Nurse at Govt. Hospital/CHC or PHC
Palpitation/Fatigue 17 63% Private
Breathlessness at Rest
51 77% Doctor Nurse at Govt. Hospital/CHC or PHC
Swelling of legs, body and face
66 69% Doctor Nurse at Govt. Hospital/CHC or PHC
Severe Headache and blurred vision
46 71% Doctor Nurse at Govt. Hospital/CHC or PHC
Vaginal Bleeding 8 86% Private
Weak/No Movement of Foetus
20 90% Doctor Nurse at Govt. Hospital/CHC or PHC OR Private
Abnormal Vaginal itching and burning
10 78 Private
C. Nutrition and Iron Folic Acid Tablets during pregnancy
1. Diet during pregnancy
358 out of 422 women (85%) received supplementary nutrition from Aganwadi
Centre
Women were asked if they ate less or more during their pregnancy to assess any
changes in diet, or adoption of healthy nutrition practices
o 20% women said they ate more than usual

Understanding Barriers to Antenatal Care and Institutional Delivery in Rajsamand, Rajasthan- Survey
Page | 31
o 10% of these claimed that they had more green vegetables and 7% claimed
that had more pulses during pregnancy.
From the 36% women who had meat during pregnancy 70% had it once a month
These points highlight that majority of the women do not specially take nutritious food
to maintain a healthy pregnancy, a proper level of haemoglobin and sufficient protein.
2. IFA Received during pregnancy
Free IFA
378 out of 422 (90%) women received free IFA from ANM/Nurse.
Facility from where IFA was received:
o MCHN Day: 322 women
o SC: 42 women
o PHC: 26 women
Purchase IFA/Syrup
47 out of 422 women purchased IFA tablets or syrup
Reasons for Purchase of IFA
55% purchased it because private doctor had requested them
15% claimed that they had not received IFA during pregnancy
11% reported they did not like the taste of IFA received during ANC
Amount of IFA received/purchased
45% out of 394 women received/purchased 90 or more IFA tablets (ranging from
90-240 tablets)
Therefore the required amount of IFA during ANC was accessed by less than half the women
in the sample.
3. IFA intake during pregnancy
IFA tablets consumed during pregnancy
10% (43) respondents claimed that they consumed none of the tablets because
o 25 women did not like the taste of IFA
o 29 women vomited or felt nauseous and sick

Understanding Barriers to Antenatal Care and Institutional Delivery in Rajsamand, Rajasthan- Survey
Page | 32
Table 20: IFA Tablets- Amount Consumed
IFA
Consumption
Frequency Percent Valid Percent Cumulative
Percent
All tablets 222 52.6 56.3 56.3
Half of the tablets
71 16.8 18.0 74.4
Few (Less than Half)
58 13.7 14.7 89.1
None of the tablets
43 10.2 10.9 100.0
Total 394 93.4 100.0
NA 28 6.6
Total 422 100.0
Frequency of IFA consumption
Of the 351 women that did consume IFA tablets, 32% consumed IFA ‘sometimes’
because:
o 80 women felt nauseous or sick
o 21 women did not like the taste
o 19 women did not remember to take it regularly
Table 21: IFA Tablets- Frequency of Consumption
IFA
Consumption
Frequency
Frequency Percent Valid
Percent
Cumulative
Percent
As per dose
prescribed by
ANM/Nurse/Doc
tor
238 56.4 67.4 67.4
Sometimes 112 26.5 31.7 99.2
DK 3 .7 .8 100.0
Total 353 83.6 100.0
NA 69 16.4
Total 422 100.0

Understanding Barriers to Antenatal Care and Institutional Delivery in Rajsamand, Rajasthan- Survey
Page | 33
Stopping IFA tablets
Out of 351who took IFA, 55 women completely stopped taking IFA because
o 31 women felt nauseous after taking tablets
o 16 women vomited after taking tablets
o 10 women did not like the taste
Table 22: Pregnant women who stopped IFA consumption
Completely stopped
taking IFA during
Pregnancy
Frequency Percent Valid Percent Cumulative
Percent
No 295 69.9 84.3 84.3
Yes 55 13.0 15.7 100.0
Total 350 82.9 100.0
Missing 1 .2
NA 71 16.8
Total 72 17.1
Total 422 100.0
Therefore although 90% women claimed that they took IFA tablets during their pregnancy,
the above data highlights that in many instances it was taken sometimes, irregularly and/or
completely stopped at some point.
4. Referral for Anaemia
Out of 422 women, 30 women (7%) were referred for getting iron sucrose
injection/blood transfusion
26 (87%) of those women did receive treatment. The 4 who did not were mainly due
to decision of staff based on health status of woman
Half these women were given injection/transfusion once, while 5 women received it
3 times or more
50 % of the cases received treatment at CHCs/PHCs or private hospitals
D. Delivery Information
1. Number of Home and Institutional Deliveries
The outcome of recent place of delivery for the chosen sample was compared with
where their previous deliveries took place.

Understanding Barriers to Antenatal Care and Institutional Delivery in Rajsamand, Rajasthan- Survey
Page | 34
Table 23: Cross tabulation: Type of delivery recently and number of home deliveries pregnant woman has ever had
Recent Outcome
of Delivery
Number of
home deliveries
the woman has
ever had Frequency Percent Valid Percent
Cumulative
Percent
Home Delivery 1 82 39.4 39.4 39.4
2 46 22.1 22.1 61.5
3 35 16.8 16.8 78.4
4 19 9.1 9.1 87.5
5 10 4.8 4.8 92.3
6 5 2.4 2.4 94.7
7 8 3.8 3.8 98.6
8 1 .5 .5 99.0
9 1 .5 .5 99.5
10 1 .5 .5 100.0
Total 208 100.0 100.0
Institutional
Delivery
0 138 64.5 64.5 64.5
1 30 14.0 14.0 78.5
2 15 7.0 7.0 85.5
3 16 7.5 7.5 93.0
4 6 2.8 2.8 95.8
5 4 1.9 1.9 97.7
6 3 1.4 1.4 99.1
7 2 .9 .9 100.0
Total 214 100.0 100.0
65% of the 214 women who delivered at an institution this time have never
delivered at home (this includes first time pregnancies). This is a positive indicator
that more than half the sample of women who had institutional deliveries
demonstrated preference for it, instead of home deliveries.

Understanding Barriers to Antenatal Care and Institutional Delivery in Rajsamand, Rajasthan- Survey
Page | 35
Table 24: Type of delivery recently and number of institutional deliveries ever had
Present
Outcome of
delivery
Number of
institutional
deliveries the woman
has ever had Frequency Percent
Valid
Percent
Cumulative
Percent
Home Delivery 0 117 56.2 56.2 56.2
1 66 31.7 31.7 88.0
2 19 9.1 9.1 97.1
3 4 1.9 1.9 99.0
4 2 1.0 1.0 100.0
Total 208 100.0 100.0
Institutional
Delivery
1 95 44.4 44.4 44.4
2 65 30.4 30.4 74.8
3 42 19.6 19.6 94.4
4 11 5.1 5.1 99.5
6 1 .5 .5 100.0
Total 214 100.0 100.0
From the above table it can be deduced that about 44% of the 208 women who
delivered at home this time had institutional deliveries before. Therefore this time
they either opted or were forced to deliver at home for one reason or the other.
56% women of the 208 women who delivered at home this time, have never had an
institutional delivery before (this includes first time pregnancies).
2. Place of delivery
Home Deliveries
Table 25: Home Delivery: Place
Delivery
Type
Place of Delivery Frequency Percent Valid
Percent
Cumulative
Percent
Home
Delivery
Husband’s home 163 78.4 78.4 78.4
Parent's home 14 6.7 6.7 85.1
Dais home 1 .5 .5 85.6
Home Other 25 12.0 12.0 97.6
Private Vehicle 4 1.9 1.9 99.5
En route Other 1 .5 .5 100.0
Total 208 100.0 100.0

Understanding Barriers to Antenatal Care and Institutional Delivery in Rajsamand, Rajasthan- Survey
Page | 36
From the 208 home deliveries in the sample majority (78%) took place at
respondent’s/husbands home.
7% of women went to their parents’ home to deliver.
Out of the 25 women who have a home delivery at “Home Others” 19 of them
delivered at the home of LHV. These are currently working LHVs who conduct private
deliveries at their residence. These cannot be classified as “private” as they did not
take place at a formal institution or maternity home. People trust the LHVs skill and
therefore prefer approaching her privately for quality services.
2% of deliveries occurred on the way to the hospital/institution, however once the
women delivered they did not see it necessary to access the hospitals for post-natal
care.
Reasons why women delivered at home
Table 26: Reasons delivered at home
Reason for home delivery Frequency Percentage
Did not Feel it was necessary 93 45%
No time to go to the facility 78 38%
No transport was available 47 23%
Facility was too far to reach 17 8%
Enroute delivery 5 2%
Others (wanted to deliver at institution)
4 2%
*207 out of 208 women answered this question
If we consider (1) women who had no transport available to reach, (2) deliveries
happened enroute and (3) others who expressed indirectly that they wanted to
deliver at an institution, it shows that 56 (29%) women (home delivery) had the
intention to deliver at an institution.
78 women did not have time to go to the facility. This highlights possible delay in
decision making.
93 women felt that it was not necessary, which shows the poor perception of
importance of delivering at an institution.

Understanding Barriers to Antenatal Care and Institutional Delivery in Rajsamand, Rajasthan- Survey
Page | 37
Institutional Deliveries
Table 27: Place of Institutional Delivery
Delivery Type Place of Delivery Frequency Percent Valid
Percent
Cumulative
Percent
Institutional
Delivery
Govt. municipal
hospital 39 18.2 18.2 18.2
UHC/Family
Welfare Center 2 .9 .9 19.2
CHC/Rural Hospital 51 23.8 23.8 43.0
PHC 57 26.6 26.6 69.6
Sub Center 36 16.8 16.8 86.4
Public Other 4 1.9 1.9 88.3
Pvt. hospital/Clinic 15 7.0 7.0 95.3
NGO/Trust
Hospital/Clinic 10 4.7 4.7 100.0
Total 214 100.0 100.0
Out of the 214 deliveries majority (50%) took place at the PHC (57) or CHC (51)
18% took place at higher district level institution while 17% took place at sub centres
12% women delivered at a private institution/NGO.
This data highlights that there is a scope for selective strengthening of sub centres
that are able to handle simple deliveries, which might be currently resulting in home
deliveries.
Reasons Why Women Delivered at an Institution
163 women believed it was safer (demonstrates want for quality care)
79 women reported that ANM or Doctor had convinced them during ANC
68 women were motivated by the JSY incentive and benefits as informed by the
ASHA

Understanding Barriers to Antenatal Care and Institutional Delivery in Rajsamand, Rajasthan- Survey
Page | 38
3. People who accompanied women to facility/institution of delivery
Table 28: Person Accompanied to Place of delivery (Institutional)
Person accompanied to facility of delivery
Frequency Percentage (214)
Husband 139 65%
Mother-in-Law 127 59%
Parents 49 23%
ASHA 40 19%
Relatives or Friends 58 27%
76% were accompanied by more than 1 person
23% were accompanied by more than 2 people
Currently JSY supports only 1 person to accompany her. Therefore the cost to a
family is higher, as in most cases family members accompany women to look after
her. JSY money does not alone motivate a woman to deliver at an institution and in
many cases women who prefer the convenience of their home.
4. Main person who assisted woman to conduct the delivery
Table 29: Person Assisted to conduct delivery
Person Assisted to
conduct delivery
Frequency Percent Valid
Percent
Cumulative
Percent
Home
Delivery
ANM/Nurse/LHV 25 12.0 12.7 12.7
Other Health
Professional 5 2.4 2.5 15.2
Dai (TBA) 134 64.4 68.0 83.2
Mother/ Mother-in-
law/ Aunt 25 12.0 12.7 95.9
Friend/Neighbor 1 .5 .5 96.4
No One 7 3.4 3.6 100.0
Total 197 94.7 100.0
Missing 11 5.3
Total 208 100.0
Institutional
Delivery
Doctor 59 27.6 27.6 27.6
ANM/Nurse/LHV 149 69.6 69.6 97.2
Mother/ Mother-in-
law/ Aunt 1 .5 .5 97.7
ASHA 3 1.4 1.4 99.1
No One 1 .5 .5 99.5
Other 1 .5 .5 100.0
Total 214 100.0 100.0

Understanding Barriers to Antenatal Care and Institutional Delivery in Rajsamand, Rajasthan- Survey
Page | 39
Home Deliveries Assisted by:
o 68% (134 women) home delivery cases were assisted by Dais
o The number and proportion of Dai assisted cases was higher in Bhim than
Kumbhalgrah (81 cases V/s 53). Dais conducted 50% of home delivery cases
in Kumbhalgarh and 75% of home deliveries in Bhim.
o ANMs/LHVs assisted in 12% of the home deliveries
Institutional Deliveries Assisted by:
o 70% of institutional delivery cases were conducted by Nurse/ANM/LHV. This
highlights the capability of nursing staff and further potential for training to
handle basic cases at sub-centre level and more complicated cases for ANMs
and Nurses who demonstrate proficient skills.
o 1 person who delivered at an institution also reported that nobody assisted
her, and the nurse simply cut the cord once the baby was out
5. Mode of transport to reach institution/facility of delivery
Table 30: Mode of Transport (Institutional Delivery)
Mode of Transport
to Delivery Facility
Frequency Percent Valid Percent Cumulative
Percent
On foot 8 3.7 3.7 3.7
Family-owned motor
vehicle 11 5.1 5.1 8.9
Hired private vehicle 117 54.7 54.7 63.6
Government
sanctioned vehicle 78 36.4 36.4 100
Total 214 100 100
More than half the women and their families hired a private vehicle to access the
facility (55%)
Only 36% used government sanctioned vehicles, either 104 or 108 to reach the
facility.
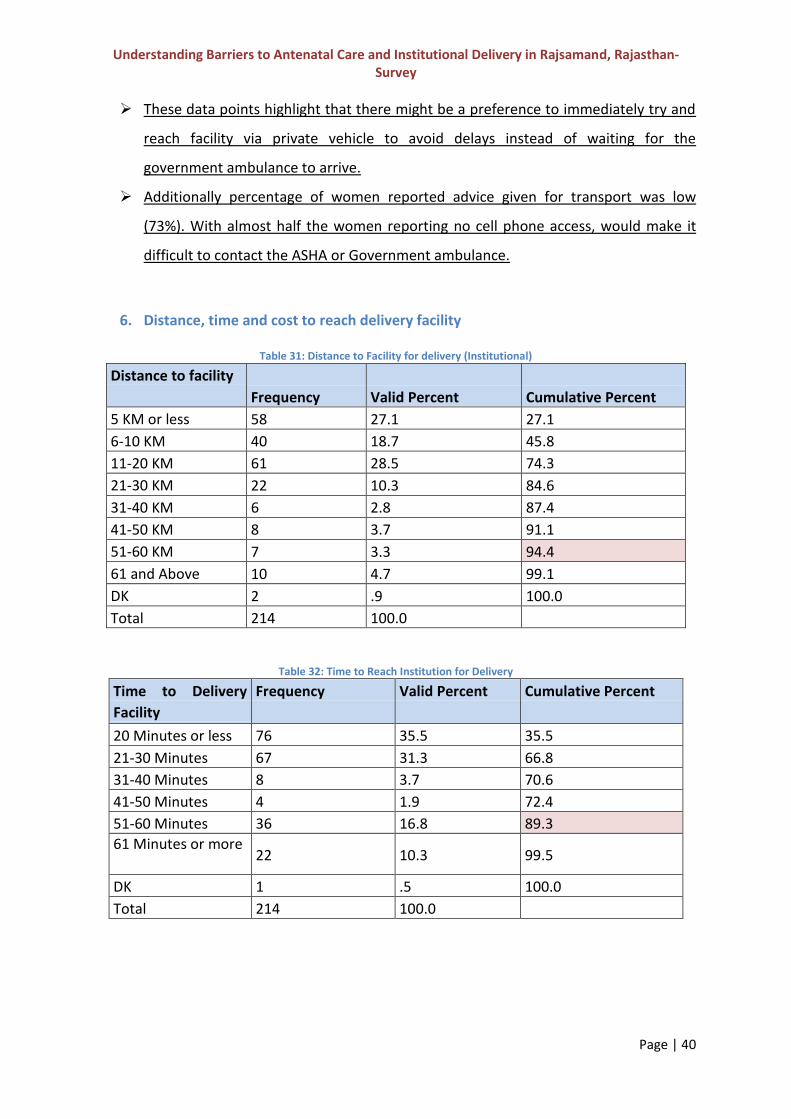
Understanding Barriers to Antenatal Care and Institutional Delivery in Rajsamand, Rajasthan- Survey
Page | 40
These data points highlight that there might be a preference to immediately try and
reach facility via private vehicle to avoid delays instead of waiting for the
government ambulance to arrive.
Additionally percentage of women reported advice given for transport was low
(73%). With almost half the women reporting no cell phone access, would make it
difficult to contact the ASHA or Government ambulance.
6. Distance, time and cost to reach delivery facility
Table 31: Distance to Facility for delivery (Institutional)
Distance to facility
Frequency Valid Percent Cumulative Percent
5 KM or less 58 27.1 27.1
6-10 KM 40 18.7 45.8
11-20 KM 61 28.5 74.3
21-30 KM 22 10.3 84.6
31-40 KM 6 2.8 87.4
41-50 KM 8 3.7 91.1
51-60 KM 7 3.3 94.4
61 and Above 10 4.7 99.1
DK 2 .9 100.0
Total 214 100.0
Table 32: Time to Reach Institution for Delivery
Time to Delivery
Facility
Frequency Valid Percent Cumulative Percent
20 Minutes or less 76 35.5 35.5
21-30 Minutes 67 31.3 66.8
31-40 Minutes 8 3.7 70.6
41-50 Minutes 4 1.9 72.4
51-60 Minutes 36 16.8 89.3
61 Minutes or more 22 10.3 99.5
DK 1 .5 100.0
Total 214 100.0

Understanding Barriers to Antenatal Care and Institutional Delivery in Rajsamand, Rajasthan- Survey
Page | 41
The above two tables demonstrate two positive points: majority of the facilities
accessed by people were within 60 km radius (94%) and within 60 minutes from
their home (89%).
However this does not take into consideration the time it took for government or
private vehicle to come from the facility, time and difficulty to access a private
vehicle, especially at night time and the difficult terrain that some families had to
overcome to reach the vehicle. Therefore the time between labour pains initiation
and actually reaching the facility would be possibly more.
Table 33: Cost to reach facility for Delivery
Cost to reach
Delivery Facility
Frequency Valid Percent Cumulative Percent
0 94 43.9 43.9
250 Rupees or Less 23 10.7 54.7
251-500 Rupees 44 20.6 75.2
501-750 Rupees 17 7.9 83.2
751-1000 Rupees 16 7.5 90.7
1000 and Above 18 8.4 99.1
DK 2 .9 100.0
Total 214 100.0
Almost half the women (46%) spent more than the JSSK scheme reimbursable cost of
Rs.250 on transport to reach institution for delivery
8% of the total women spent Rs.1000 or above
This highlights the fact that people are not able to reach place of delivery within the
sanctioned Rs.250 unless they come by government ambulance. However only 36%
used the ambulance.
7. Complications during the delivery
Type of Complications
Table 34: Complication during delivery
Complications Frequency Percent
At least one complication 61 14.5%
Excessive Bleeding 10 16.4%
High Blood Pressure 8 13.11%
Premature Labour 22 36%
Prolonged Labour >8 hours 23 37.7%

Understanding Barriers to Antenatal Care and Institutional Delivery in Rajsamand, Rajasthan- Survey
Page | 42
Prolonged Labour >4 hours 9 14.75%
Convulsions 2 3.27%
Others 6 9.8%
Among all the women surveyed (422) 61 (14.5%) of them reported one or more
complications during their last delivery.
Of these 61 women, 28% delivered at home. It is a positive finding that most women
that reported experiencing a complication delivered at an institution.
Most of the women had premature (36%) or prolonged labour >8 hours (38%) as a
complication. Preterm birth can have serious implications on the development and
survival of a child. Multiple births, high BP and infections are some of the reasons as
explained by WHO6 for preterm delivery.
10 women reported excessive bleeding and 8 reported high blood pressure as a
complication during their delivery.
Table 35: Complication related information
Type of Delivery
Complications during delivery
Women referred for Complications
Percentage of complications referred to a higher facility
Went to the facility where referred
Home Delivery 17 1 5.8% 1
Institutional Delivery
44 24 54.5% 23
Total 61 25 41%
Referral for Complications
Out of all the 61 women who had some kind of complications, 25 (41%) were
referred to higher facility.
But out of all the women who delivered at home and had complications only 1
woman was referred out of 17 women.
From those who delivered at institutions, almost 55% were referred to the higher
facility.
It’s possible that the complications must have been dealt at the facility itself in case
of institutional delivery cases that were not referred. But the women who delivered
6 http://www.who.int/mediacentre/factsheets/fs363/en/

Understanding Barriers to Antenatal Care and Institutional Delivery in Rajsamand, Rajasthan- Survey
Page | 43
at home are at very high risk since most of them did not go to institutions, even after
they self-reported complications experienced.
Table 36: Time to reach referral facility
Time to Reach Referral Facility Frequency Percentage
30 minutes or less 12 50%
30-60 minutes 6 25%
More than 60 minutes 6 25%
Don’t Know 0 0%
Total 24 100% *1 missing response not included in analysis
Table 37: Cost to reach referral facility
Cost incurred to reach referral facility
Frequency Percentage
0 13 54.17%
1 – 250 rupees 2 8.33%
More than 250 8 33.33%
Don’t Know 1 4.17%
Total 24 100% *1 missing response not included in analysis
Though it took less than 30 minutes for half of the women to reach the referral
facility, 25% of women referred still had to travel more than 60 minutes to reach.
Nearly 42% of the women referred had to spend some amount of money to reach to
the referral facility. The fact that they had to incur cost indicates either non
availability of government transport at the facilities from where they were referred
or if the transportation was provided they had to pay out of pocket as well.
8. Expenditure incurred during delivery (other than transportation)
Table 38: Expenses incurred during delivery
Type of Delivery Cost incurred Categories Frequency Percentage
Home Deliveries
Any additional Cost incurred during delivery 56 26.9%
Cost incurred on Diagnostics 0 0%
Cost incurred on Medicines 16 7.69%
Money Paid to TBA 39 18.75%
Money Paid to Nursing Staff 13 6.25%
Total No. of Home Deliveries 208
Any additional Cost incurred during delivery 61 28.5%
Cost incurred on Diagnostics 11 5%
Cost incurred on Medicines 30 14.01%

Understanding Barriers to Antenatal Care and Institutional Delivery in Rajsamand, Rajasthan- Survey
Page | 44
Institutional Deliveries
Money Paid to TBA 4 1.89%
Money Paid to Nursing Staff 53 24.7%
Total Institutional Deliveries 214 Note: The denominators used to calculate percentages in this table were the total number of home or
institutional deliveries.
27% of the women have reported that they had to pay some amount of money on
medicines, diagnostics or traditional birth attendants etc.
Among institutional deliveries, 25% reported paying nursing staff (in many cases it
was reported that it was their own wish to pay) and 14% paid for medicines
Among those who incurred expenditure in home deliveries, 70% (39/56) paid the
TBAs for their services.
Table 39: Expenditure for Delivery in Public and Private Institutions
Place of Delivery No. of people delivered No. of people incurred additional cost (not transport) in relevant institution
Public Hospital 189 (88%) 41 (21%)
Private Hospital/ NGO Trust hospitals
25 (12%) 20 (79%)
Total 214 61
Delivered at Public facilities: 21% of those women had to spend some amount of
additional cost other than transportation cost
o Almost the same proportion (27% - Table 38) of the women who delivered at
home had spent some money on additional costs.
Therefore apart from transport women are paying some additional costs, be it they deliver
at home or at an institution.

Understanding Barriers to Antenatal Care and Institutional Delivery in Rajsamand, Rajasthan- Survey
Page | 45
9. Status of JSY received from public facilities
Table 40: JSY incentive status (Institutional Delivery)
Received JSY Cheques
Frequency Percent Valid Percent Cumulative
Percent
In full amount 185 86.4 86.4 86.4
Did not receive the JSY in
full amount 6 2.8 2.8 89.3
Did not receive the JSY
incentive 23 10.7 10.7 100.0
Total 214 100.0 100.0
About 86% of the women reported to have received JSY incentive to deliver at
institutions while 11% of the women did not receive JSY incentives. The above table
only tells us if they have received the cheque from the public institutions. Having the
money in their actual accounts has not been validated. During interactions with the
participants of the study it was clear many did not have bank accounts of their own
and the cheque had not been encashed.
Out of all the women who received JSY cheques, about 90% of them have received it
from the place of delivery and on time.
E. Mamta Card Data
The relevance and importance of Mamta card has to be rethought so that both the
system and the woman can benefit from this information document.
Majority of the Mamta cards had some missing information
Data entered did not seem valid based on observation (interval data entry pattern,
precise value of BP with decimal points where no automatic BP machines were
available, and Hb value incorrect entries).
Expected Delivery Dates of 150 and 142 Mamta cards from Kumbhalgarh and Bhim
respectively, for which data was available was compared with the actual delivery
dates. 41% and 57% respectively from the 2 blocks had a difference of more than 15
Understanding Barriers to Antenatal Care and Institutional Delivery in Rajsamand, Rajasthan- Survey
Page | 46
days with a maximum of 3 month difference. May be this is due to women giving
incorrect last menstrual period date, ANM calculating it wrong or an error of entry in
the Mamta card. The aim of providing an expected delivery date: alerting family,
alerting ambulances and providing them with lists, is lost.
Discussion and Recommendations Based on Triangulation of Data (Survey, Key Informant Interviews and Focus Groups)
Based on the triangulation of information from the survey, key Informant Interviews and
focus group discussions, the following facts need consideration and prioritization.
1. Improve the perception of importance of ANC and Institutional
delivery
- Within the sample 45% of the women who delivered at home and 60% of the
women who delivered at an institution had registered in the first trimester. The
reasons quoted for late registration within the survey point out that they were not
aware, were not informed to register early or had no apparent health problem.
a. Although the ASHA is making efforts to inform women, they face the obvious
challenge of pregnancy identification. The reasons are varied from women not
informing them due to fear of bad omen, being shy to reveal pregnancy and fear
of abortion risks. This in turn ties into the perception of ‘importance’ as many
believe no ANC check-up is required as such unless they face a problem.
b. 47% of the sample belonged to nuclear families. There was not much difference
between these in the group that delivered at home verses an institution.
However the service providers do feel that this issue to some extent influences
the support the women has to access health facilities. She is not able to leave her
other children at home if there is no one to look after them. Even if she does
deliver at an institution, she is sometimes unable to visit the once a month
MCHN day due to the same reason, as it does take up a significant proportion of
her day. This in turn affects the number of ANC check-ups.
Efforts need to be focused on improving the awareness of benefits of ANC so that women
and community members perceive early registration and ANC follow up as very important.

Understanding Barriers to Antenatal Care and Institutional Delivery in Rajsamand, Rajasthan- Survey
Page | 47
Only when the perception improves will there be a change in demand from the community
for these services.
2. Providing quality services to generate demand
- Education is crucial to understanding the counsel of ANCs, benefits of delivering at
institution and importance of nutrition during the life cycle of an individual. More
than half the sample (56%) did not have any schooling. There was not much
difference in proportion of women who delivered at home and at an institution in
schooling years. It is clear via the data in this study that apart from education, there
are other important factors that play a role in the outcome of place of delivery. For
example:
a. The women and the community’s perception of the importance and benefits
of ANC and delivery at an institution and the 48 hour stay are poor.
b. Even if they understand the benefits of delivering at an institution, there is a
want for quality services. This is apparent through the benefits they perceive
at a private institution-manpower, attentive care, faster delivery and fewer
days of stay. Trust in Dais, who they also perceived as more skilled to conduct
deliveries rather than being referred from facilities even for simple deliveries,
leads to the high numbers of reported and unreported home deliveries.
c. Manpower also determines the quality of services that the system can
provide. Specialized personnel, lady gynaecologists and availability of 24x7
doctors generate better demand from people.
Changing the perception is not enough. This has to be followed by provision of quality to
maintain the continuum of increased service delivery efforts.
3. Improving MCHN Day Standards
- Over 80% of the women had their first ANC check-ups at MCHN days by the ANM.
Therefore the ANM is crucial to motivate the women to attend ANCs and help her
understand the benefits.
Understanding Barriers to Antenatal Care and Institutional Delivery in Rajsamand, Rajasthan- Survey
Page | 48
a. Assessment by SIFHW has already pointed out that the basic skills of ANMs need
strengthening through quality based trainings. However to improve the quality,
better supervision is necessary.
b. The data in this survey highlighted that, 50%-80% women who had undergone 3
ANCs, had not undergone the relevant basic tests even 3 times. 47% women
reported that they were not explained why the different check-ups during ANCs
had been done.
Quality Supervision: Supervision is required not only to monitor the quality of ANMs work,
but also to draw out the implementation challenges so that the block and district officials
can actively discuss how to resolve bottlenecks in a participatory way. This will also be
motivate well performing ANMs and ASHAs and identify personnel that are not carrying out
their duties. Currently our interaction has revealed that supervisors sometimes only come to
drop off the vaccines.
4. Diverting Home Deliveries to Institutions – Addressing the Barriers
a. Distance and Time: Although data revealed that 90% of women were
reaching facilities within 60 minutes and they were placed within 60km,
many deliveries are still occurring at home. This is because it does not take
into consideration the time it takes for transport to be contacted and reach
the woman’s home.
b. Terrain: Difficult terrain makes it tough for woman to reach the road where
the vehicle is waiting. 55% of the women hired private vehicles which points
to less use of the government sanctioned vehicle. The response of vehicles,
especially at night and when they have to navigate difficult terrain is poor.
c. Cost: Almost half the women had to pay more than Rs.250 for transportation
cost. In fact proportion of women paying additional costs at public
institutions is close to that of women delivering at home and incurring
additional costs.
d. Case Load: Most of the case load is going to PHCs and CHCs as per the data.
The subcenters are underutilized for deliveries.
Understanding Barriers to Antenatal Care and Institutional Delivery in Rajsamand, Rajasthan- Survey
Page | 49
e. Cell Phone Barrier: Within the sample 53% women were found to have no
cell phones of their own. 41% of women had no cell phone access (did not
own a cell phone, neither did husband or close by living family/friends). This
highlights the fact that although ASHAs and ANMs may provide them with
their own numbers, with relevant numbers for referral and transport
services, but people might not be able to make the prompt contact as
required. This might also lead to delay while reaching an institution. Many of
these areas have poor cell phone network making it difficult even for the
ASHA to contact ambulances and private vehicles.
Strengthening Subcenters as delivery points to address some of the above barriers related
to access and delayed decision making will be crucial to better uptake of services.
Monitoring of government sanctioned vehicles must be heightened as women and their
families are spending even above Rs.1000 to reach the delivery facility, out of pocket.
A Systematic transport and referral plan needs to be in place for each village based on the
access (road and cell phone network) and needs to contact and reach facilities, (based on
broader guidelines provided). A similar plan to reach functional First Referral Units also
needs to be in place to avoid delay of high risk cases reaching these facilities. Additionally a
systematic and simple plan also motivates people to use facilities. Private vehicles might be
more convenient for people and also within closer reach. The challenges faced to access
them should be addressed.
IEC and involving the Panchayat and prominent community members to bring more
awareness in the community regarding timely access for pregnant women and the child is
crucial in improving the perception of the community to deliver at institutions. IEC that uses
risk messages with positive framing should be applied.
5. Family Planning
- 53% of the sample had married before the legal age. 74% of these women had their
first pregnancy between the age of 16-20 years.

Understanding Barriers to Antenatal Care and Institutional Delivery in Rajsamand, Rajasthan- Survey
Page | 50
a. An effort to delay first pregnancy via family planning education for this
vulnerable age group is crucial to bring change, even though it is a sensitive
topic to address in communities.
b. Women who do get pregnant early on are more shy to come forward for ANC
and sometimes do not realize they are pregnant within the first trimester.
Their young age already puts them at high risk.
IEC Strategy for family planning and spacing needs to be given more focus and innovative
ways of reach and communication must be adopted. Family Planning advice and counsel
cannot be simply given to women, but to men and their community. For example may be
the focus should be on indirect effects and benefits of late marriage and delaying early
pregnancies. This includes health benefits for the child and economic benefits for the family.
6. Nutrition – Community Based Prevention
- There is already an initiative towards community based management of
malnutrition. However based on the data this program also needs to include focus
on community based prevention of malnutrition.
a. IFA consumption is low and irregular mainly because women feel nauseous
and sick. However if they were to more clearly understand the benefits that
their health has on the developing foetus, rather than just understanding
how IFA benefits the “blood and delivery process” may be they would make a
better effort for uptake.
b. Adolescent girls who marry young, and have poor nutrition are further at risk
if they become pregnant early on.
c. From the interviews it was apparent that ASHAs and other personnel within
the health system do not give the required focus and face challenges related
to beliefs and family’s access to a diversified diet.
d. If community members instead of just the ASHA and ANM convince
adolescent, pregnant and lactating women to take iron supplementation and
complement it with a balanced nutrition, the acceptance will be better.
e. Based on the focus groups and interviews women stop taking buttermilk and
ghee based products during pregnancy as the community believes it will
accumulate on the head of the child make delivery difficult. These

Understanding Barriers to Antenatal Care and Institutional Delivery in Rajsamand, Rajasthan- Survey
Page | 51
misconceptions prevent them from even consuming their normal diet let
alone adopting a healthy diet.
f. Good nutrition is not a community norm and women do not understand the
reason for increased requirements during pregnancy and lactation. They
might not perceive this as important as they don’t understand the
developmental and cognitive effects it has on the child. Anaemic women are
at higher risk of giving birth to low birth weight babies. Poor nutrition affects
development which affects the productivity of the generation. This vicious
cycle continues.
Reinforcement via risk messaging in a positive frame is a potential strategy for improved
diet and community based management of prevention of malnutrition.
7. Community Involvement- Do not depend on ASHA s alone
- It was apparent from the interviews of the ASHAs and mother-in laws that there is
no one key person who influences decision making of the woman regarding her
pregnancy care and delivery.
- When the ASHA alone tries to deal with difficult cases there is the attitude that “she
is doing it for money” which also demotivates the ASHA to carry out her work.
Involvement of more peer women, committees or groups and the Panchayat would help the
ASHA and ANM in their work.
Conclusion Based on the discussion and recommendations, improving the quality of ANC care, nutrition
and institutional delivery needs to be a joint effort of the Health Unit and the community.
However the community involvement has to be propelled by the State and District Health
teams. Encouraging women to go for the required ANC check-ups and further deliver at a
facility has to be coupled with quality services by the health care workers so that the people
feel motivated, trust the system and perceive its benefits. Only when practices about good
nutrition, ANC and institutional delivery become a norm in the community is acceptance
better and it creates a demand from the consumer side to access the benefits of a public
health system. Additionally structural and system barriers related to poor roads and cell
phone connectivity needs to be addressed by district and state leadership, and not just the

Understanding Barriers to Antenatal Care and Institutional Delivery in Rajsamand, Rajasthan- Survey
Page | 52
health department. Convergence between different departments although tough, is crucial,
as a platform for shared goals is necessary. Education, nutrition, health, sanitation and
access to services are interdependent to a large extent.

Understanding Barriers to Antenatal Care and Institutional Delivery in Rajsamand, Rajasthan- Survey
Page | 53
References
1. Bajpai, N., Towle M., Vynatheya J. (2011) Model Districts as a Roadmap for Public
Health Scale-up in India. Working Paper Series No. 4. Retrieved from:
http://globalcenters.columbia.edu/mumbai/files/globalcenters_mumbai/Model_Dis
tricts_Working_Paper_4_v28JULY2011.pdf
2. Balarajan, Y. S., Fawzi, W. W., & Subramanian, S. V. (2013). Changing patterns of
social inequalities in anaemia among women in India: cross-sectional study using
nationally representative data. BMJ Open, 3(3), e002233. doi:10.1136/bmjopen-
2012-002233
3. Bhaisare, K. A., Rao, D. H., & Khakase, G. M. (2015). Study of utilization of antenatal care services iin tribal area of Thane district. Int J Reprod Contracept Obstet Gynecol, 4(2), 378-383.
4. Bruce, S. G., Blanchard, A. K., Gurav, K., Roy, A., Jayanna, K., Mohan, H. L., . . . Avery,
L. (2015). Preferences for infant delivery site among pregnant women and new mothers in Northern Karnataka, India. BMC Pregnancy Childbirth, 15, 49. doi: 10.1186/s12884-015-0481-8
5. Fauveau, V. (2004). UNFPA strategy for increasing access to skilled birth attendants
in institutions (with special focus on rural/isolated areas). Regional Workshop on
skilled birth attendants in South and West Asia, 19-21 April 2004. Islamabad.
6. Guidelines for Control of iron Deficiency Anaemia. National Iron Plus Initiative,
Ministry of Health and Family welfare, Government of India. Retrieved from:
http://www.pbnrhm.org/docs/iron_plus_guidelines.pdf
7. Gupta RK, Shora TN, Verma AK, Jan R. (2015) Knowledge regarding antenatal care
services, its utilization, and delivery practices in mothers (aged 15-49 years) in a rural
area of North India. Trop J Med Res ;18:89-94
8. Kohli C, Kishore J, Sharma S, Nayak H. (2015) Knowledge and practice of Accredited
Social Health Activists for maternal healthcare delivery in Delhi. J Family Med Prim
Care 2015;4:359-63
9. Mithra, P., Unnikrishnan, B., Rekha, T., Nithin, K., Mohan, K., Kulkarni, V., … Agarwal,
D. (2013). Compliance with iron-folic acid (IFA) therapy among pregnant women in
an urban area of south India. African Health Sciences,13(4), 880–885.
doi:10.4314/ahs.v13i4.3

Understanding Barriers to Antenatal Care and Institutional Delivery in Rajsamand, Rajasthan- Survey
Page | 54
10. MMR Bulletin from Census of India: http://www.censusindia.gov.in/vital_statistics/mmr_bulletin_2011-13.pdf
11. Say, L., Chou, D., Gemmill, A., Tunçalp, Ö., Moller, A.-B., Daniels, J., . . . Alkema, L.
Global causes of maternal death: a WHO systematic analysis. The Lancet Global Health, 2(6), e323-e333. doi: 10.1016/S2214-109X(14)70227-X
12. Singh, G., Mathur, B., Chaturvedi, S., & Rai, P. (2015). A cross sectional study at
subcentre level reflecting need for improving coverage of maternal health
services. Indian Journal Of Community Health, 27(1), 117-124. Retrieved from:
http://iapsmupuk.org/journal/index.php/IJCH/article/view/924
13. Wendt, A., Stephenson, R., Young, M., Webb-Girard, A., Hogue, C., Ramakrishnan, U.,
& Martorell, R. (2015). Individual and Facility-Level Determinants of Iron and Folic
Acid Receipt and Adequate Consumption among Pregnant Women in Rural Bihar,
India. PLoS ONE, 10(3), e0120404. doi:10.1371/journal.pone.0120404
14. WHO. (2005). World Health Report 2005: Make Every Mother and Child Count.
Geneva. Retrieved From: http://www.who.int/whr/2005/whr2005_en.pdf
15. WHO. 2009. Global health risks: mortality and burden of disease attributable to
selected major risks. Geneva: World Health Organization: Retrieved from
http://www.who.int/healthinfo/global_burden_disease/GlobalHealthRisks_report_f
ull.pdf
16. WHO. 2011. The Global Prevalence of Anaemia in 2011 http://apps.who.int/iris/bitstream/10665/177094/1/9789241564960_eng.pdf
17. WHO Anaemia policy brief, Global nutrition targets 2025 WHO/NMH/NHD/14.
Retrieved from:
http://apps.who.int/iris/bitstream/10665/148556/1/WHO_NMH_NHD_14.4_eng.pd
f?ua=1