Embed Size (px)
Citation preview

UNCERTAINTIES IN BLACK CARBON EMISSIONS AND MODEL PREDICTIONS:
A SOUTH ASIAN PERSPECTIVE
Chandra VenkataramanDepartment of Chemical Engineering
Indian Institute of Technology, Bombay, India
Collaborators: M. Shekar Reddy, Gazala Habib, Manish Shrivastava, Shubha Verma-IIT Bombay
Olivier Boucher, Jean-François Léon, Bertrand Crouzille - LOA, FranceToni Miguel, Arantza Fernandez, Sheldon Friedlander - UCLA
Presented at “Black Carbon Emissions and Climate Change: A Technical Workshop,” San Diego, USA, October 13-15, 2004

OUTLINEOUTLINE
Emissions estimation: industrial/transport, residential, open burning• Level of sectoral detail • Fuel composition and technology information• Developing / measuring emission factors• Assumptions in spatial distributions• Seasonal and interannual variability• Estimated uncertainties and strategies for their reduction
BC transport and radiative forcing using a general circulation model• Evaluation of model predictions• Sensitivity study• Optical depth and radiative forcing

EMISSIONS ESTIMATION APPROACHEMISSIONS ESTIMATION APPROACH
-emission rates (kg y-1) or densities (kg km-2 y-1) from fuel consumptions and specific emissions (or emission factors).
-at the global, national, regional, urban level (0.5-1 km for urban; 25-100 km for regional and global).
-Includes, in principle, all sources that emit into that atmosphere.
Emission Rate = Activity Data x Pollutant Emission Factor
Activity Data: Emission Factor:
- fuel used (Gg y-1) kg pollutant (Gg fuel)-1
- industrial production (Gg y-1) kg pollutant (Gg product)-1
- km y-1 travelled by vehicle g pollutant (km)-1

0 1000 2000 3000 4000 5000
Coal
Lignite
Petrol
HSDO
LDO
FO
Natural gas
LPG
Kerosene
Naphtha
Energy consumption (PJ)
Domestic TransportUtilities Iron and SteelCement FertilisersOther Inds.
Domestic3%Other Inds.
22%
Iron and Steel10%
Fertilisers8%
Cement3%
Transport17%
Utilities37%
FUEL CONSUMPTION - INDIAFUEL CONSUMPTION - INDIA
Fossil: 9,411 PJ (1 PJ = 1015 J) Biofuel/biomass: 8,213 PJ
0 50 100 150 200 250 300
Biofuels / biomass (Gg)
Fuelwood Dung-cake Crop wasteCrop waste open burning Forest fire
0 50 100 150 200 250 300
278
63
37
168
39
6%11%
47%
29%
7%

IND/TRA: SECTORAL DETAILIND/TRA: SECTORAL DETAIL
OthersLarge point sourcesUtilities (power)Iron and steelCementFertilisers & Refineries
Plant fuel use Transport
RoadRail
ResidentialRuralUrban
Industry
BC emissions @ 0.250 x 0.250 resolution
Plant Tech./ APCD
EF
Appropriate proxy
EF EF EF
BC emissions
Petroleum fuels Gaseous fuelsCoal/Lignite
Fuel Use Data/ State Level

IND/TRA: FUEL & TECHNOLOGY ANALYSISIND/TRA: FUEL & TECHNOLOGY ANALYSIS
PC-Wet bottom
15%
Not reported
15%Others*1%
PC-Dry/wet bottom
15%
PC-Dry bottom
54%ESP73%
MC3%
ESP+MC+Scrubb
er3%Scrubber
0%
ESP+MC18%
Not reported
2%
ESP+Scrubber
1%
Boiler Type Installed APCD
e.g. ELECTRIC UTILITIESe.g. ELECTRIC UTILITIES

0.00E+00 5.00E+05 1.00E+06 1.50E+06 2.00E+06 2.50E+06
HyderabadVishakapat
PatnaAhmedaba
SuratVadodaraBangalore
CochinMumbaiNagpur
PuneBhopalIndore
LudhianaJaipur
ChennaiCoimbatore
MadhuraiKanpurLucnow
VaranasiCalcutta
Delhi
Petrol Vehicles
12%
83%
4%1%
2Stroke-2 Wheeler-Passenger
2Stroke-3 Wheeler- Passenger
2Stroke-3 Wheeler- Goods
4Stroke-4 Wheeler-Passenger
Diesel Vehicles
3%6%9% 11%
34%7%
30%
LDV(Taxis)
LDV(Jeeps)
LDV(Others)
HDV(Tractors)
HDV(Buses)
HDV(Trucks)
HDV(Trailers)
IND/TRA: FUEL & TECHNOLOGY ANALYSISIND/TRA: FUEL & TECHNOLOGY ANALYSIS
e.g. TRANSPORT Vehicle count in 22 major cities

IND/TRA: EMISSION FACTORSIND/TRA: EMISSION FACTORSSize Specific PM Emission Factors for Coal Combustion in Dry Bottom Boilers
* ESP: Electrostatic PrecipitatorsA= coal ash weight percent, as fired. For example, if coal ash weight is 40%, then A=40. Source: U.S. EPA AP-42 Compilation of emissions factors for stationary sources
Cumulative Mass % < Stated Size Cumulative Emission Factor g kg-1
ParticleSize (µm)
Un-controlled
MultipleCyclone
ESP Un-controlled MultipleCyclone
ESP
1510 6 2.5 1.25 1.00 0.625
3223176221
5429143111
79675029171412
1.60A1.15A0.85A0.30A0.10A0.10A0.05A
0.54A0.29A0.14A0.03A0.01A0.01A0.01A
0.032A0.027A0.012A0.012A0.005A0.005A0.005A
BC/PM ratios for Coal Boilers: 2.2-6.4% (Henry and Knapp, 1980; Shibaoka, 1986; Veranth, 2000)

Road Transport: PM, BC/PM, OC/PM Literature reported measurements for diesel (LDV,
HDV) and petroleum (leaded, unleaded) vehicles
Rail Transport: Values reported by US EPA [1998].
Fuel/vehicle type PM avg. (g kg -1)
BC avg. (% of PM)
OC avg. (% of PM)
Diesel/ HDV a 4.62 42 36
Diesel/ LDV b 3.13 67 24
Leaded petrol 0.84 6 47
Un-leaded petrol/WCC c 0.36 23 73
aLDV: heavy duty vehicles; b LDV: light duty vehicles; c WCC: without catalytic converters
IND/TRA: EMISSION FACTORSIND/TRA: EMISSION FACTORS

IND/TRA:SPATIAL &IND/TRA:SPATIAL &SEASONAL DISTRIBUTIONSSEASONAL DISTRIBUTIONS
Assumed no seasonal variability in industrial and transport emissions.
Proxies from state to district and down to 25 km x 25 km resolution• Point sources: - district power generation, cement /
steel / industrial production.• Transport: road - vehicle population in 22 cities.
- balance district urban population. rail - district geographical area.

IND/TRA: BLACK CARBON EMISSIONSIND/TRA: BLACK CARBON EMISSIONS
BC: 90 Gg y-1
5 25 60 120 250 500 kg km-2 y-1
Bricks24%
Utilities15%
Transport59%
Other1%

•Activity data statistics : 20-40%•Emission factors :
- applicability of non-region-specific emfacs? - validation needed through measurements.- factor of 4-5 (300-400%).
•Needs : Transport > modelled emission factors.> on-road emissions measurement (mixed fleet, urban, interstate).> possible fuel-adulteration effects on emissions.Brick kilns> emissions from representative kiln types.
IND/TRA: UNCERTAINTIESIND/TRA: UNCERTAINTIES

RESIDENTIALRESIDENTIAL
• Energy surveys : high uncertainty and low representative-ness for biofuels (kg capita-
1 day-1).• User population : not estimated. • Unquantifiable uncertainties.• Highly uncertain emission factors for
biofuels.

Statewise cooking energy consumption from 6 fuel types (PJy-1)
Specific cooking energy (MJ kg-1 of food cooked)
Statewise cooking fuel use for 6 fuel types (Tgy-1)Statewise cooking fuel use for 6 fuel types (Tgy-1)
Statewise average food items consumed (kgc-1m-1) (NSS, 2001)
Cooking device
efficiencies (%)
Calorific value (MJ kg-1)
Statewise rural and urban fraction of fuel user population for 6 fuel types (Fuelwood,
dung-cake, crop waste, coal, LPG and kerosene) (NFHS, 2000)
Statewise population using 6 fuel types
Statewise rural, urban population (Census, 2001)
Statewise end use energy (PJy-1) in four cooking process and 6 fuel types
Statewise food items consumption in 4 cooking process (boiling, skillet-baking,
leavened-baking, meat cooking)
RES: SECTORAL/TECHNOLOGY DETAILRES: SECTORAL/TECHNOLOGY DETAIL

RES: BIOFUEL ACTIVITY DATA

RES: EMISSION FACTOR MEASUREMENTRES: EMISSION FACTOR MEASUREMENTStove fuel system used Traditional single pot mud stove
5-wood species, dung-cake and 10-crop waste types
High and low power phases
Dilution samplerOptimized for aerosol stabilization
Mass of fuel, duct velocity, temperatures in combustion zone, duct and plenum recorded each minute
Pollutant measurement
PM2.5: Multi-stream cyclone sampler
OC-BC: Thermal optical transmittance (S. California Particle Centre and Supersite)SO2, NO2, ions, trace elements and absorption
Dilution sampler Burn cycle
Multi-stream aerosol sampler
AIHL Cyclone
Equilibration cylinder
Inlet for air
Filter holders
Cyclone outlet pipe
Connection to Pump
Critical Orifices for flow control

OC-EC MEASUREMENTOC-EC MEASUREMENT
Front QFF for sample OC
Front Teflon filter
Back-up QFF for collection of artifact OC
PM2.5 sampler
inlet
Typical thermogram OC artifact measurement

0.0 0.2 0.4 0.6 0.8 1.0
BC emission factors (gkg-1)
Wood-LBR
Wood-HBRWoody crop stalks
Fibrous crop stalksRice straw
Dried cattle manureKerosene
LPG
Bio
fue
l ty
pe
RES: EMISSION FACTORS FROM COOKINGRES: EMISSION FACTORS FROM COOKING
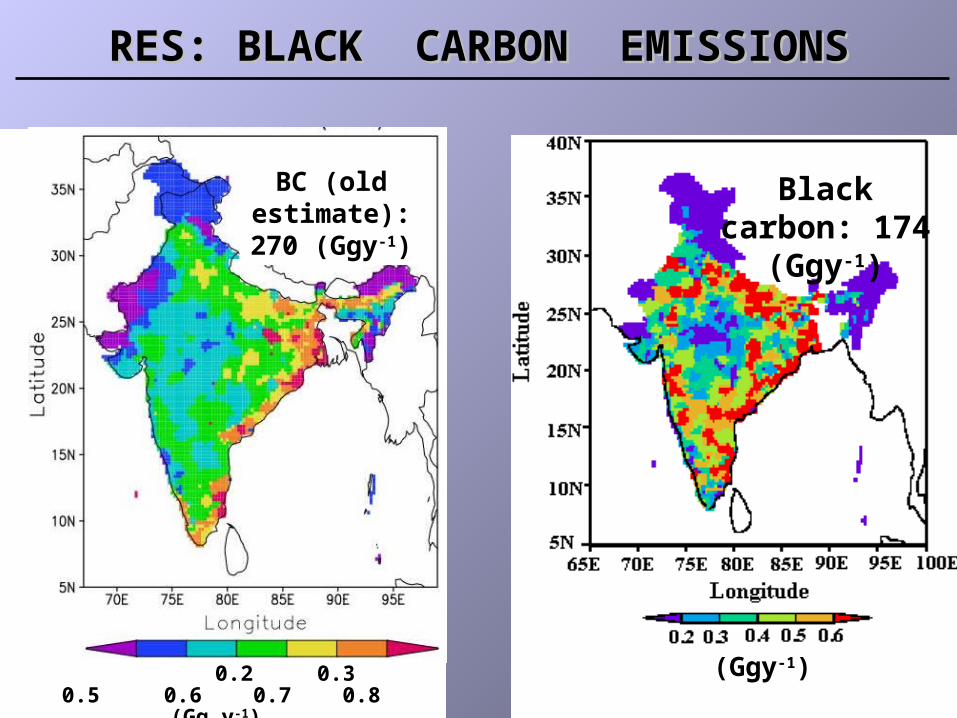
RES: BLACK CARBON EMISSIONSRES: BLACK CARBON EMISSIONS
Wood Crop waste
81%
17%2% 0.34%
Dried cattle manure
Kerosene LPG
Black carbon: 174 (Ggy-1)
(Ggy-1)
Fuelwood: 281x103 (Ggy-1)
(Ggy-1) 0.2 0.3 0.5 0.6 0.7 0.8(Gg y-1)
BC (old estimate): 270
(Ggy-1)

•Activity data statistics : - cooking (various fuel categories) ~45-85%
•Emission factors :- cooking (traditional stoves / various fuel categories) ~20-100%
•Needs : - water heating / space heating ~unknown- emission factors for mixed fuel use ”- emissions from improved cooking technologies ”- outdoor penetration of residential emissions ”
RES: UNCERTAINTIESRES: UNCERTAINTIES

OPEN BURNINGOPEN BURNING
MODIS vegetation map Forest / grassland / shrubland:E = A . AFL . CE . EF•uncertain A (area under different land types).•uncertain AFL, CE.•seasonal / interannual variability.•shifting cultivation practices (Jhum)
Agricultural waste burning in croplands:E = CP . RPR. F. DM. CE. EF• uncertain F, CE.•systematic spatial/temporal variation.

OB: INTERANNUAL-SEASONAL VARIABILITYOB: INTERANNUAL-SEASONAL VARIABILITY
12month
1monthmonth) jj, (ii,
MODIS_ffr
month) jj, (ii,MODIS_ffr x
j) (i,EM
month) j, (i,
EM
ij
ii
jj
Integrating bottom-up and top-down approaches:• biomass burnt from bottom up methods.• temporal / spatial distribution from active fires and vegetation data.• high resolution, co-location.
Annual Emissions per grid (bottom-up estimate)

OB: AG WASTE MASS BALANCEOB: AG WASTE MASS BALANCE
Fodder kg/animal/day
% Crop waste in fodder
Statewise crop production(FAI 1999-2000)
Statewise cattle and livestock population (BAHS, 1999)
Statewise major crop waste
generated (Tgy-1)
Statewise annual crop waste use as fodder
(Tgy-1)
Statewise unutilized crop waste (TgyStatewise unutilized crop waste (Tgy-1-1) = generation - uses) = generation - usesStatewise unutilized crop waste (TgyStatewise unutilized crop waste (Tgy-1-1) = generation - uses) = generation - uses
National % of CW use: industrial fuel
Statewise major crop waste (cereals, pulses, oilseed and fibre crop) used as fodder, domestic fuel, thatching and industrial fuel (Tgy-1)
Statewise crop waste use for cooking (Tgy-1)
National use of rice straw for thatching (% of generation)
Crop waste /grain ratio

OB: UNUTILIZED AG WASTEOB: UNUTILIZED AG WASTE
0 5 10 15 20 25 30 35 40
Unutilized crop waste (Tgy-1)
Total unutilized crop waste 116 (60-217) Tg y-1

0
5
10
15
20
25
J F M A M J J A S O N DMonth
% o
f em
issi
ons/
biom
ass
0
5
10
15
20
25
% o
f em
issi
ons/
biom
assPM2.5 - 492
BC - 80
OM - 214
Biomass 81x10^3
Total (Gg/y)
AG WASTE: SEASONAL EMISSIONSAG WASTE: SEASONAL EMISSIONS
704 114 306 116 x 103

AG WASTE: AG WASTE: SPATIAL-TEMPORAL VARIABILITYSPATIAL-TEMPORAL VARIABILITY
MODIS fire map: Oct 10, 2002

INDIA BC EMISSIONS SUMMARY (Gg yINDIA BC EMISSIONS SUMMARY (Gg y-1-1))This work Mayol-
Bracero et al., 2002
Dickerson et al., 2002
Reddy and Venkataraman, 2002; Reddy et
al., 2002
Streets et al., 2003
Bond et al., 2004
Base year 2000 2000-01
2000-2001 1999-00 2000 1996
Total all sources
426 (156-1365)a
(200%)
503 414 600 597[671]
Biofuel: 174 (86-360)(100%)b
399 420 167 420(350%)
330[351]d
OpenBrn: crop wst
Forest
114 (45-295)(160%)
38 (5-305)(700%)
- 29c 147 87(700%)
87
Fossil fuel:
65 54 90 (20-405)(350%)
97(350%)
233
Amean and range; buncertainty at 95% CI; conly for forest fire; dUpgraded for current base year using rural population as proxy.

Simulations of the INDOEX Simulations of the INDOEX ““intensive field intensive field phasephase”” in the LMDZ-GCM in the LMDZ-GCM
Introduction of multi-component aerosols: sulphate, black carbon, organic matter, fly-ash, dust (<1µm; 1-10µm) and sea-salt (8 size bins).
India emissions at 0.25ox0.25o with ground level and elevated sources (MSR/CV 2002a, b). Asia emissions (Streets et al. 2003).
Seasonal/inter-annual BC emissions from biomass open burning distributed using ATSR fire counts.
Nudged to ECMWF winds from Nov 1998 to March 1999.
Parameterisation for carbonaceous aerosol growth from hydrophobic to hydrophilic state.
Wavelength depended aerosol optical properties at different relative humidity.

Evaluation with measurements:Evaluation with measurements:Surface concentrations at Goa (Surface concentrations at Goa (15.5N, 73.8E)15.5N, 73.8E)
Days of February-March
BC
con
cen
trat
ion
(
g m
-3)
Measurements: Chazette, 2003

Ron Brown cruise track
Evaluation with measurements:Evaluation with measurements:Surface concentrations over ocean (Ron Brown)Surface concentrations over ocean (Ron Brown)

Sensitivity to Asian BC emissions: Sensitivity to Asian BC emissions: Surface concentrations at KCO Surface concentrations at KCO 4.9N, 73.5E
(Chowdhury et al., 2001)

Sensitivity to Asian BC emissions: AODSensitivity to Asian BC emissions: AOD
1.1
1.08
1.05
1.04
1.02
1.01
1.8
1.5
1.4
1.3
1.2
1.1

Sensitivity to Asian BC emissions: SSASensitivity to Asian BC emissions: SSA
15.5N, 73.8E 4.9N, 73.5E

TOA
SUR
ATM
CONTROL 2 x BC POLDER
Sensitivity to Asian BC emissions: Radiative forcingSensitivity to Asian BC emissions: Radiative forcing

SUMMARY / NEEDSSUMMARY / NEEDS
• Uncertainties in S. Asian BC emissions can be constrained within factor of 2 (or 100%). - emission factors ~ vehicle classes (on-road emissions), industrial plants, brick kilns, etc.- open burning amounts and seasonal / interannual variability. - missing sources ~ agro-industries e.g. spice / tea drying, small-scale industries - restaurants/ confectioners, glass and bangle making, crematoriums.
• Present model estimates show systematic under-prediction. - restricted to winter monsoon – check seasonal / interannual variability. - wind data that drive model.- assimilate satellite derived AOD.
• Ambient measurements.- network of aethalometer measured “BC” being set up.- need ambient measurements.

RELATED PAPERSRELATED PAPERS
• M.S. Reddy and C. Venkataraman (2002). Inventory of Aerosol and Sulphur Dioxide Emissions from India: I – Fossil Fuel Combustion, Atmospheric Environment, 36 (4), 677-697.
• M.S. Reddy and C. Venkataraman (2002). Inventory of Aerosol and Sulphur Dioxide Emissions from India: II – Biomass Combustion, Atmospheric Environment, 36 (4), 699-712.
• G. Habib, C. Venkataraman, M. Shrivastava, R. Banerji, J. Stehr and R. Dickerson (2004). New methodology for estimating biofuel consumption for cooking: Atmospheric emissions of black carbon and sulfur dioxide from India, Global Biogeochemical Cycles, 18, GB3007, doi:10.1029/2003GB002157.
• M.S. Reddy, O. Boucher, C. Venkataraman, S. Verma, N. Bellouin and M. Pham (2004). GCM estimates of aerosol transport and radiative forcing during INDOEX, Journal of Geophysical Research, 109, D16205, doi:10.1029/2004JD004557.
• C. Venkataraman, G. Habib, A. Eiguren-Fernandez, A.H. Miguel and S.K. Friedlander (2004). Carbonaceous aerosol emissions from residential biofuel combustion in S. Asia and climate implications, submitted.
• G. Habib, C. Venkataraman, T.C. Bond and J.J. Schauer, A. Eiguren-Fernandez, A.H. Miguel, S.K. Friedlander (2004). Primary particle emissions biofuel combustion: Chemical composition, size distribution and optical properties, in preparation.


![[Venkataraman] at the Speed of Light](https://img.dokumen.tips/doc/110x75/55cf8cd75503462b139013a3/venkataraman-at-the-speed-of-light.jpg)