Embed Size (px)
Citation preview

1722 IEEE TRANSACTIONS ON ULTRASONICS, FERROELECTRICS, AND FREQUENCY CONTROL, VOL. 63, NO. 11, NOVEMBER 2016
Ultrasound Vector Flow Imaging—Part II:Parallel Systems
Jørgen Arendt Jensen, Fellow, IEEE, Svetoslav Ivanov Nikolov, Senior Member, IEEE,Alfred C. H. Yu, Senior Member, IEEE, and Damien Garcia
Abstract— This paper gives a review of the current state-of-the-art in ultrasound parallel acquisition systems for flow imagingusing spherical and plane waves emissions. The imaging methodsare explained along with the advantages of using these very fastand sensitive velocity estimators. These experimental systems arecapable of acquiring thousands of images per second for fastmoving flow as well as yielding the estimates of low velocityflow. These emerging techniques allow the vector flow systems toassess highly complex flow with transitory vortices and movingtissue, and they can also be used in functional ultrasound imagingfor studying brain function in animals. This paper explains theunderlying acquisition and estimation methods for fast 2-D and3-D velocity imaging and gives a number of examples. Futurechallenges and the potentials of parallel acquisition systems forflow imaging are also discussed.
Index Terms— Plane wave imaging, synthetic aperture imaging,vector flow imaging, velocity estimation.
I. INTRODUCTION
THIS paper gives a review of the current development ofparallel acquisition systems for flow imaging. Currently,
most scanners use a sequential acquisition of data, where asingle direction in the image is acquired at a time. For flowestimation, this entails emitting sound in the same direction anumber of times, and then estimating the velocity from the dataas described in the accompanying paper [1] for vector flowor for more traditional systems as described in [2] and [3].This acquisition method severely limits the amount of dataavailable for the estimation, and thereby, the ability to detectvelocity with a high precision as the estimation variance isproportional to the number of observations. In addition, thedynamic range of the flow is limited as the highest velocitypossible to estimate is limited by the pulsing rate, and thelowest velocity is limited by the pulse repetition frequencyfprf divided by the number of emissions.
Manuscript received February 4, 2016; accepted July 17, 2016. Date ofpublication August 5, 2016; date of current version November 1, 2016.This work was supported in part by the Danish National AdvancedTechnology Foundation under Grant 82-2012-4, in part by BK Ultrasound,Herlev, Denmark, and in part by the Natural Sciences and EngineeringResearch Council of Canada under Grant RPGIN-2016-04042,Grant RGPIN-2015-04217, and Grant RGPAS-477914-2015.
J. A. Jensen is with the Center for Fast Ultrasound Imaging, Department ofElectrical Engineering, Technical University of Denmark, DK-2800 KongensLyngby, Denmark.
S. I. Nikolov is with BK Ultrasound, DK-2730 Herlev, Denmark.A. C. H. Yu is with the Department of Electrical and Computer Engineering,
University of Waterloo, Waterloo, ON N2L 3G1, Canada.D. Garcia is with the Research Center, CRCHUM, University of Montreal
Hospital, Montreal, H2X 0A9, Quebec, Canada.Digital Object Identifier 10.1109/TUFFC.2016.2598180
The approach to break these limits is to insonify a largeregion using either spherical or plane waves, and make asequence, which is repeated over a short time duration. Suchacquisition schemes have attracted a lot of attention in thelast two decades, and the major principles are described inthis paper. In Section II, the methods based on sphericalemissions are described, and plane wave emissions are givenin Section III for 2-D velocity estimates. Estimation of the full3-D velocity vector is detailed in Section V.
There are major advantages to such schemes. Foremost, theybreak the tie between frame rate, region of interest (ROI),and precision of the estimates. Continuously available dataallow very high frame rates for a large ROI for following thedynamics of, e.g., the heart and complex vortices at hundredsto thousands of frames per second. Furthermore, the data toaverage in the estimators are only limited by the stationarityof the flow. This is determined by the flow acceleration andoften 128 rather than eight emissions can be used for velocityestimation, which significantly lowers the velocity variance togive quantitative results. This also makes it easier to deriveprecise quantitative measures for, e.g., volume flow, stenosisdegree, turbulence indices, and pressure gradients. For low-velocity flow, the change is even more pronounced, as theacceleration often is low, and both accuracy and detectabilitycan be enhanced by averaging over many emissions. Thecomplete data sets also make it possible to beamform in anydirection. The flow can therefore be precisely tracked in anydirection, which makes it possible to employ all the differenttechniques developed for 2-D and 3-D velocity estimation asdescribed in the accompanying paper [1]. These advantagesare shown in the clinical examples attained so far and aredescribed in Section VI.
One drawback of parallel imaging is the huge amountof data and the corresponding calculation demand. Often20–100 GB of data are acquired from the transducer elements,and full images have to be generated for each emission in2-D, 3-D, or even 4-D (directional beamforming in a 3-Dvolume). This is a major challenge, but the evolution ingraphics processing units (GPUs) will probably solve thiswithin the next 5–10 years. In addition, major efforts areconducted in deriving more efficient beamforming in theFourier domain, using dual-stage beamforming, row–columnprobes, or recursive imaging. Many more approach will likelybe developed in the following years, and the future challengesand possibilities in this exciting field are described in theconcluding part of this paper in Section VII.
0885-3010 © 2016 IEEE. Personal use is permitted, but republication/redistribution requires IEEE permission.See ht.tp://ww.w.ieee.org/publications_standards/publications/rights/index.html for more information.

JENSEN et al.: ULTRASOUND VECTOR FLOW IMAGING—PART II: PARALLEL SYSTEMS 1723
Fig. 1. Acquisition and processing for STA imaging. Spherical waves areemitted, and the signals received on all the transducer elements to yield LRIs.Combination of these yields a HRI dynamically focused in both transmit andreceive (from [4]).
II. SYNTHETIC APERTURE FLOW IMAGING
Synthetic aperture imaging (SAI), as shown in Fig. 1,insonifies a whole ROI using spherical waves [5], [6].A single element is used in transmit and sends out a sphericalwave. Signals are then received on all elements, and a fullimage can be focused in receive to yield a low resolutionimage (LRI), as there is no transmit focusing. A new elementthen transmits and yields a new LRI. Combining all the LRIsfor all emissions then gives a high resolution image (HRI),which is dynamically focused in transmit. This is due to thepartial focusing performed in each LRI, where the propagationtime from the origin of the emission to the focusing point istaken into account for all points. This results in a dynamictransmit focusing, when all the LRIs are combined.
Focusing is attained by summing the received signals inphase. The geometric distance from the emitting element to theimaging point denoted by �rp and back to the receiving elementdivided by the speed of sound c gives the time instance tp(i, j)for receiving the sample from the point. This time is [6]
tp(i, j) = |�rp − �re(i)| + |�rp − �rr ( j)|c
(1)
where �re(i) denotes the position of the transmitting element iand �rr ( j) the receiving element j ’s position. All points in theLRI are then focused, and this is performed for all the LRIsto form the HRI signal y f (�rp)
y f (�rp) =N∑
j=1
M∑
i=1
a(tp(i, j), i, j)yr(tp(i, j), i, j) (2)
where yr (t, i, j) is the received signal for emission i onelement j , a(tp(i, j), i, j) is the weighting function (apodiza-tion) applied onto this signal, N is the number of transducerelements, and M is the number of emissions. The calculationof both transmit and receive times are dynamic and changedthroughout the image. SAI, thus, gives the best possiblefocusing, when delay-and-sum beamforming is employed and
has been extensively studied in the literature [6]. Note that thepoint �rp can be freely selected within the image plane, andfocusing can, thus, be attained in any direction and in any orderin the imaging plane. This gives a large flexibility in combiningthe focusing schemes with the velocity estimation methods.
SAI has been investigated since the late 1960s and early1970s [7], [8]. For single element transducers, monostatic SAIhas been studied by Ylitalo and Ermert [9]. SAI with arrayshas been investigated since the early 1980s [8], [10]–[13].
In the 90s, a method intended for intravascularimaging based on SAI was suggested using a circularaperture [14]–[16]. Lockwood and Foster [17] andLockwood et al. [18] investigated the sparse syntheticaperture systems for 3-D imaging applications, andNikolov et al. [19] suggested recursive ultrasound imaging.
A major problem is the low energy transmitted from asingle element and a diverging beam. This was addressed bycombining a number of elements to transmit a spherical waveas suggested by Karaman et al. [15]. Furthermore, combiningwith coded excitation as suggested by [20]–[24] can yield SAultrasound images with a nearly 50% higher penetration depththan the traditional images from the summation of all theLRIs [25]. This has also been demonstrated to yield better clin-ical images than traditional sequential acquisitions [26], [27],which has led to the introduction of commercial SA scan-ners. Chiao et al. [28] introduced the definition of syn-thetic transmit aperture (STA) imaging and developed spatialencoding to enable transmission on several elements simul-taneously. They separated out the individual transmissionsduring receive processing using addition and subtraction of thereceived signals. Another approach by Chiao and Thomas [29]used orthogonal Golay codes to increase the signal-to-noiseratio (SNR) by transmitting simultaneously on several ele-ments. Gran and Jensen [30] suggested to use a division intofrequency bands to increase the frame rate in SA imaging.This could increase SNR and could be used for velocityestimation [31]. Later, a method based on correlation codeswas suggested [32].
The major challenge with synthetic aperture flow imagingis that the blood scatterers move between emissions, andthis de-correlates the LRIs. It is shown in Fig. 2, where atwo-emission SA sequence is shown. Fig. 2 (top) shows theemission sequence with the point spread function (PSF) forLRIs, and the combined HRIs H (n) are shown at the bottom.The motion is purely axial toward the transducer, and it can beseen that H (n−3) is not directly comparable with H (n−2) due tothe different PSFs. However, H (n−1) is a translated version ofH (n−3), which has been moved a distance of 2�z = 2vz Tprf ,where vz is the axial-velocity component and Tprf is the timebetween emissions. The LRI PSFs are not perfectly aligned,so the image will be slightly unsharp, but highly correlatedbetween H (n−1) and H (n−3). Ideally the velocity can, thus, befound from any of the methods mentioned in [1]. This wasnoticed and introduced by Nikolov and Jensen [4], [33] andNikolov [5].
This might seem like a small detail, but it has majorimplications for flow estimation. SA imaging insonifies thewhole ROI, so that data are available continuously for

1724 IEEE TRANSACTIONS ON ULTRASONICS, FERROELECTRICS, AND FREQUENCY CONTROL, VOL. 63, NO. 11, NOVEMBER 2016
Fig. 2. SA flow imaging uses a short emission sequence. The low resolutionPSFs are combined to yield HRIs, which pairwise can be correlated, when thesame emission sequence is used. This yields continuous data for the wholeimage region (from [33]).
Fig. 3. First in-vivo SA flow imaging obtained. The carotid artery wasscanned using only 24 emissions, with the possibility of yielding thousandsof images per second (from [33]).
all positions. This also makes it possible to beamform in alldirections at all the places in the image. SA flow sequences canbe made short, thus, enabling very fast imaging with hundredto thousands of frames per second. The continuously availabledata allow averaging over very long times only limited by theacceleration of the flow to lower the standard deviation (SD) ofthe estimates. It also makes stationary echo canceling easier, asthere is no initialization of the filter, so long filter of arbitraryorder or complexity can be used.
The fast imaging advantages can be seen from the firstin-vivo SA flow image shown in Fig. 3, where a four emissionlong SA sequence was used and repeated six times for acombined total of 24 emissions [33]. This yields 290 frames/s
Fig. 4. Flow profiles using directional SA flow imaging. Top graph: individualprofiles. Bottom graph: mean ± 3 SDs. The relative SD is 0.3%, thus, yieldinga fully quantitative flow (from [34]).
for a pulse repetition frequency fprf of 7 kHz, where a normalframe rate is between 20 to 50 Hz. fprf could be increased to25 kHz for this depth resulting in 1042 images per second,or the whole heart could be covered for a penetration depthof 11 cm. The images can actually be updated at the rate ofthe pulse repetition frequency as described for recursive SAultrasound imaging [19]. Here, the oldest emission is replacedby the newest one, and an exponential decay can be introducedto gradually decrease the importance of old emissions. Thiscould be adapted to the acceleration of the flow to always havethe maximum amount of data for the estimation.
A. Directional Beamforming
The advantage of a complete data set has been used in theflow profiles estimated and shown in Fig. 4, where an eightemission long SA sequence was used together with directionalbeamforming for 128 emissions [34]. The mean profile ± threeSDs are shown in Fig. 4 (bottom), and a relative SD of 0.3%was obtained, which is at least ten times more accurate thanfor sequential acquisition systems. In Fig. 4, the angle wasknown before beamforming or could be estimated from theanatomic image. In the clinic, the angle has to be determinedfor all positions in the image for each frame, and a methodto make this was suggested by Jensen and Oddershede [35].Directional beamforming is here performed in all directions,and the normalized correlation function with the highest valueindicates the flow angle. Another approach for robust angleestimation was devised by Villagómez Hoyos et al. [36] basedon the individual LRIs and then finding the most probableangle.
The inter emission motion will decorrelate the beamformeddata, and this degradation has been quantified in [37]. Thiscan, for certain combinations of velocities and fprf , give areduction of up to 10 dB for axial motions and 5 dB forlateral motions depending on the setup. Motion compensationcan, however, be applied on the complete data sets to recover

JENSEN et al.: ULTRASOUND VECTOR FLOW IMAGING—PART II: PARALLEL SYSTEMS 1725
some of the loss. This has also been performed for anatomicSA image, where the 2-D motion is estimated from a short SAsequence and used for compensating a long in-vivo anatomicSA sequence [38]. Gran and Jensen [30] suggested to use afrequency division approach for obtaining information fromseveral emissions simultaneously by using separation in thefrequency domain. This was combined with the directionalbeamforming approach to yield velocity estimates [31].
B. Speckle Tracking and Echo Canceling
Speckle tracking can also be used with diverging waves.In 2014, Takahashi et al. [39] showed the feasibility oftransthoracic intraventricular vector flow imaging in adults bymeans of diverging waves emitted by a phased array. In thesein-vivo studies, the main challenge was to remove the echosignals generating by the surrounding tissues.
The presence of high-amplitude tissue clutters representsthe most major issue of ultrasound cardiac flow imag-ing, especially when large (instead of focused) wavefrontsare transmitted. Clutter filtering has long been the sub-ject of a number of investigations in focused ultrasoundimaging [40], [41]. More investigations have to be made to fur-ther improve clutter filtering for parallel beamforming-basedimaging. Although more computationally expensive, eigen-based filters may represent a promising approach [42], [43].
C. High Dynamic Range Flow Imaging
The fast data frames and continuous data permit detection ofboth high-velocity flow in, e.g., the carotid artery [44] and lowvelocity flow as indicated by Bercoff et al. [45] for plane waveemissions. High fprf and the cross correlation approaches orspeckle tracking can find the high velocities. The continuousdata make it possible to average over long times only limitedby the decorrelation of the correlation functions from the flowacceleration. A high dynamic range can be attained as thedata are continuously available at all positions in the image,and this has been used by Villagomez-Hoyos et al. [46], [47]to adapt the vector velocity estimation to both high and lowvelocities. The approach enables the visualization of the flowin both the systolic and diastolic parts of the cardiac cycle forthe carotid artery, and this could be applied to many other flowsituations. The continuous data also makes it possible to haveas many spectral displays as needed in the image to visualizethe spectral evolution at multiple sites [45].
D. Synthetic Aperture Sequential Beamforming
A major problem in SA imaging and especially in flowimaging is the large amount of calculations. Evolution inGPU processing will solve part of the problem [48], [49], butless demanding schemes for beamforming can also contributesignificantly. Kortbek et al. [50] suggested using a dual-stage approach called synthetic aperture sequential beamform-ing (SASB). This is essentially a monostatic approach wherea simple fixed-focused beamformer combines the data andreduces it down to one signal. A second-stage dynamic beam-former then makes the HRIs from a combination of the first-stage signals. This reduces the data amount and processing
Fig. 5. Plane wave focusing. The geometric distance for the samples tosum is found by projecting the vector to the image point into the propagationdirection of the plane wave.
demand by a factor of 64, and it was shown to have thesame image quality in the clinical studies as normal sequentialimaging for both linear [51] and nonlinear imaging [52].
The approach has been extended by Li and Jensen [53]using SASB and directional beamforming. A full colormap image was acquired in 48 emissions using a fouremission long sequence and had a SD of 4.3% at 65°.Hemmsen et al. [54] has demonstrated that a directionalcross correlation estimator and its beamforming can beimplemented on an HTC Nexus 9 tablet, where all processingis performed by the Tablet’s GPU. This indicates that a fullyportable system can be implemented using SA imaging.
III. PLANE WAVE FLOW IMAGING
In plane wave imaging, a large region is insonified byemitting a plane wave in a given direction. Usually, the fullaperture is used, and delays are adjusted to yield a wave, whichpropagates in one direction as shown in Fig. 5. A full LRI (notransmit focusing) can then be reconstructed from the receiveddata. The plane wave can be steered in other directions, andmultiple emissions can be combined to enhance the imagequality.
This kind of emissions necessitates a modified delay calcu-lation for the emitted field as shown in Fig. 5. Here, �rr is thereference point for the plane wave and �rd is a unit vectorcharacterizing its propagation direction. The field point isgiven by �rp , and the time tdp it takes the plane wave to arriveat the field point is given by
tdp = �rd · (�rp − �rr )
cassuming that emission takes place at time t = 0 at �rr .The time tr for the scattered signal to arrive at the receivingelement is
tr (�ri , �rp) = |�ri − �rp |c
(3)

1726 IEEE TRANSACTIONS ON ULTRASONICS, FERROELECTRICS, AND FREQUENCY CONTROL, VOL. 63, NO. 11, NOVEMBER 2016
which is the geometric distance from the image point to thetransducer element position �ri divided by the speed of sound c.This assumes that the scattering is spherical and that the speedof sound can be considered constant. The total time fromtransmission to reception is then tdp + tr (�ri , �rp), which is thetime for selecting a sample in the received signal. Multipliedwith the sampling frequency gives the sample index for thesignals to be summed in the focusing process.
The first to use plane wave imaging for motion estimationwere Tanter et al. [55] and Bercoff et al. [56] in 2001, wherea single plane wave in transmission was used for transientelastography. The receiving aperture was then split in two forestimating the motion at two different angles similar to multi-beam flow estimation. This gave the motion vector with theadvantage of continuously available data for beamforming andestimation. The variance of especially the lateral componentcould be improved by using tilted plane waves for a numberof directions. The motion was then estimated for each of thesedirections, and the resulting motions were averaged to decreasevariance. The compounding of estimates was, thus, performedafter estimation of the motions.
A. Plane Wave Speckle Tracking
High frame-rate flow speckle tracking by cross correlationwas first described by Sandrin et al. [57] in 2001 in anexperimental vortex. The first in-vivo experiments of thehigh frame-rate blood vector velocity imaging was reportedin 2005 by Udesen et al. [58], [59]. They used a single planewave for emission and speckle tracking for flow estimation.Forty speckle images were averaged giving a true framerate of ∼100 Hz to yield the images with a high temporaland spatial resolution. Time-resolved velocity fields weredetermined in the frontal plane of the common carotid arteryusing plane waves. The blood signals were enhanced bytemporal high-pass filtering (clutter filtering).
More recently, high frame-rate speckle tracking was suc-cessfully applied in the fast-beating hearts of neonates:in 2014, Fadnes et al. [60] quantified the vector flow inventricular septal defects transthoracically with a linear arrayand plane wave transmits.
B. Increasing Sensitivity by Combining Plane Waves
Combining more plane waves in the focusing as theapproach used in SA imaging in Section II was suggestedin [45] and [48]. Here, plane waves are emitted in severaldirections and the LRIs are focused and combined to an HRIfor flow estimation. This was used for conventional axialvelocity estimation and showed to increase the sensitivityof the estimation at the same time as the advantage of acontinuous data stream is available in all parts of the image.The authors call it compounding as presented by [61], wherethe envelope data are combined, or the estimates are combinedas in [55] and [56], but it is important to emphasize thatbeamformed RF data are combined as in [33]. The number ofplane wave directions employed Np lowers the pulse repetitionfrequency by a factor of Np , and hence the maximumdetectable velocity with the same factor, if a phase or
frequency estimator is used. These approaches are, thus, bestsuited for low velocity flow, and this was elegantly demon-strated in the scans of a rat brain by Macé et al. [62], [63].The excellent sensitivity of the combined plane wavesequences was demonstrated in following the evolution offlow in a rat brain (see also Section VI on clinical examples).
C. Multidirection Velocity Estimation
In recent years, with a series of advances in theresearch purpose ultrasound imaging systems [64]–[67]and channel-domain data acquisition technology [68]–[70],new implementations of cross-beam Doppler flow vectorestimation have been reported. These newer schemes haveappeared in the forms of: 1) single-line, multigate flow vectorestimation [71], [72] and 2) flow vector mapping over theentire field of view [73]–[75]. One key feature, which isshared among these new formulations, is the use of planewave excitation schemes for transmission [76], [77], so as toenhance the frame rate as described earlier in this paper. It isworth noting that high frame-rate, least-squares flow vectorestimation technology [78] will become clinically availableas a real time, high frame-rate diagnostic mode as part ofMindray’s new Resona 7 platform in 2016.
SAI has also been combined with a spread spectrumapproach to increase the frame rate by the emitted frequencycoded waveforms in parallel from a number of elements at thesame time [32]. This has also been shown to work for velocityimaging [79].
D. Plane Wave Transverse Oscillation
Plane wave imaging has also been used together with trans-verse oscillation (TO) to find the 2-D velocity vector for tissuemotion [80], and it has also been adapted to blood velocityestimation [81]. An efficient frequency domain estimator wasused to find the velocity estimates.
IV. MULTILINE TRANSMISSION SCHEMES
An alternative for high frame-rate blood speckle track-ing is the multiline transmit (MLT) scheme [82]–[84].In the MLT approach, series of several beams are transmittedat the same time. MLT has not yet been tested in the context ofvector flow imaging; whether the MLT crosstalks significantlyalter the blood flow signal must be investigated. One way ofseparating out the parallel beams is to make a frequency divi-sion as suggested in [85]. Here, the available frequency bandis divided into smaller bands suitable for velocity estimation,and this can increase the frame rate by the number of bandsor several spectral displays can be made simultaneously.
V. 3-D VECTOR FLOW IMAGING
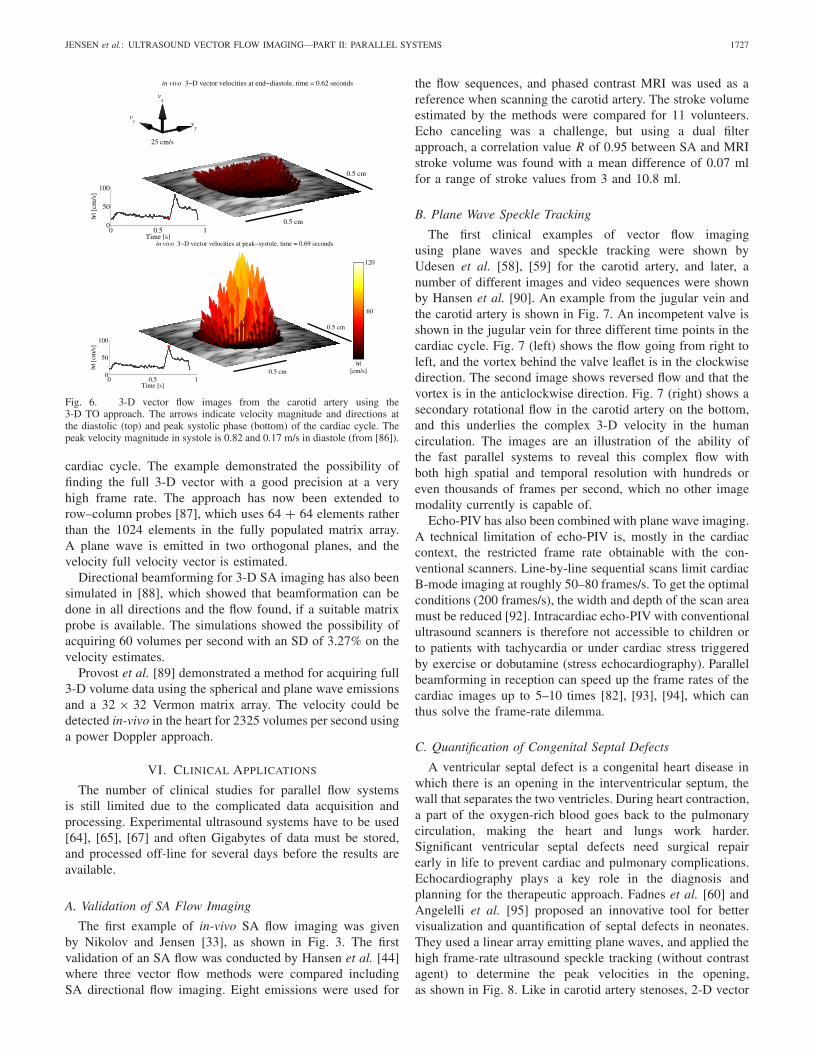
3-D vector flow imaging has been developed for a singleplane using the TO approach by Holbek et al. [86]. Here,a 32 × 32 Vermon matrix array was used, and the focusedemissions in five directions were continuously made to attainthe frame rates up to 2.1 kHz. An example from the carotidartery is shown in Fig. 6 for two different time points in the
JENSEN et al.: ULTRASOUND VECTOR FLOW IMAGING—PART II: PARALLEL SYSTEMS 1727
Fig. 6. 3-D vector flow images from the carotid artery using the3-D TO approach. The arrows indicate velocity magnitude and directions atthe diastolic (top) and peak systolic phase (bottom) of the cardiac cycle. Thepeak velocity magnitude in systole is 0.82 and 0.17 m/s in diastole (from [86]).
cardiac cycle. The example demonstrated the possibility offinding the full 3-D vector with a good precision at a veryhigh frame rate. The approach has now been extended torow–column probes [87], which uses 64 + 64 elements ratherthan the 1024 elements in the fully populated matrix array.A plane wave is emitted in two orthogonal planes, and thevelocity full velocity vector is estimated.
Directional beamforming for 3-D SA imaging has also beensimulated in [88], which showed that beamformation can bedone in all directions and the flow found, if a suitable matrixprobe is available. The simulations showed the possibility ofacquiring 60 volumes per second with an SD of 3.27% on thevelocity estimates.
Provost et al. [89] demonstrated a method for acquiring full3-D volume data using the spherical and plane wave emissionsand a 32 × 32 Vermon matrix array. The velocity could bedetected in-vivo in the heart for 2325 volumes per second usinga power Doppler approach.
VI. CLINICAL APPLICATIONS
The number of clinical studies for parallel flow systemsis still limited due to the complicated data acquisition andprocessing. Experimental ultrasound systems have to be used[64], [65], [67] and often Gigabytes of data must be stored,and processed off-line for several days before the results areavailable.
A. Validation of SA Flow Imaging
The first example of in-vivo SA flow imaging was givenby Nikolov and Jensen [33], as shown in Fig. 3. The firstvalidation of an SA flow was conducted by Hansen et al. [44]where three vector flow methods were compared includingSA directional flow imaging. Eight emissions were used for
the flow sequences, and phased contrast MRI was used as areference when scanning the carotid artery. The stroke volumeestimated by the methods were compared for 11 volunteers.Echo canceling was a challenge, but using a dual filterapproach, a correlation value R of 0.95 between SA and MRIstroke volume was found with a mean difference of 0.07 mlfor a range of stroke values from 3 and 10.8 ml.
B. Plane Wave Speckle Tracking
The first clinical examples of vector flow imagingusing plane waves and speckle tracking were shown byUdesen et al. [58], [59] for the carotid artery, and later, anumber of different images and video sequences were shownby Hansen et al. [90]. An example from the jugular vein andthe carotid artery is shown in Fig. 7. An incompetent valve isshown in the jugular vein for three different time points in thecardiac cycle. Fig. 7 (left) shows the flow going from right toleft, and the vortex behind the valve leaflet is in the clockwisedirection. The second image shows reversed flow and that thevortex is in the anticlockwise direction. Fig. 7 (right) shows asecondary rotational flow in the carotid artery on the bottom,and this underlies the complex 3-D velocity in the humancirculation. The images are an illustration of the ability ofthe fast parallel systems to reveal this complex flow withboth high spatial and temporal resolution with hundreds oreven thousands of frames per second, which no other imagemodality currently is capable of.
Echo-PIV has also been combined with plane wave imaging.A technical limitation of echo-PIV is, mostly in the cardiaccontext, the restricted frame rate obtainable with the con-ventional scanners. Line-by-line sequential scans limit cardiacB-mode imaging at roughly 50–80 frames/s. To get the optimalconditions (200 frames/s), the width and depth of the scan areamust be reduced [92]. Intracardiac echo-PIV with conventionalultrasound scanners is therefore not accessible to children orto patients with tachycardia or under cardiac stress triggeredby exercise or dobutamine (stress echocardiography). Parallelbeamforming in reception can speed up the frame rates of thecardiac images up to 5–10 times [82], [93], [94], which canthus solve the frame-rate dilemma.
C. Quantification of Congenital Septal Defects
A ventricular septal defect is a congenital heart disease inwhich there is an opening in the interventricular septum, thewall that separates the two ventricles. During heart contraction,a part of the oxygen-rich blood goes back to the pulmonarycirculation, making the heart and lungs work harder.Significant ventricular septal defects need surgical repairearly in life to prevent cardiac and pulmonary complications.Echocardiography plays a key role in the diagnosis andplanning for the therapeutic approach. Fadnes et al. [60] andAngelelli et al. [95] proposed an innovative tool for bettervisualization and quantification of septal defects in neonates.They used a linear array emitting plane waves, and applied thehigh frame-rate ultrasound speckle tracking (without contrastagent) to determine the peak velocities in the opening,as shown in Fig. 8. Like in carotid artery stenoses, 2-D vector

1728 IEEE TRANSACTIONS ON ULTRASONICS, FERROELECTRICS, AND FREQUENCY CONTROL, VOL. 63, NO. 11, NOVEMBER 2016
Fig. 7. Plane wave vector flow imaging of the jugular vein (top vessel) and the carotid artery for three different times in the cardiac cycle (from [91]). Notethe clockwise vortex in the left image, and the counterclockwise vortex behind the incompetent valve leaflet in the middle image.
Fig. 8. High frame-rate vector flow imaging in a neonate ventricularseptal defect using high frame-rate speckle tracking [60]. The streamlinesare superimposed on the axial velocity estimates for better visualization.
flow imaging avoided the angle and Doppler gate positionissues. Using a particle-based flow visualization technique,they also generated cine loops, which highlighted the shuntflow very clearly, as shown in Fig. 8.
D. Low Velocity Flow Estimation
The ability of plane wave flow imaging to estimate and showlow velocity flow was demonstrated by [62] and [63] as shown
in Fig. 9, which compares a normal flow image [Fig. 9(a)] witha plane wave power Doppler image [Fig. 9(b)]. It shows howthe continuous data can be used to increase sensitivity anddetectability for flow imaging. Fig. 9(c) shows a functionalultrasound image, where the change in cerebral blood flow isindicated by a color scale. Fig. 9(c) (orange area) indicates aregion with increased blood flow in the brain. The increasedbrain activity came from mechanically stimulating one whiskerof the rat. This technique has been used to map out the 3-Dvasculature of the rat brain [96], and can also generate thespectral content at any position as shown in [45]. The tech-nique is sensitive enough to detect the change in blood flowfrom activity in the brain, which was demonstrated by follow-ing an epileptic seizure in a rat brain [62]. The slow movingbrain waves could also be detected by following the changein blood flow. The fast plane wave imaging gives an excellenttime resolution in the submillisecond range combined withsubmillimeter resolution. This unique imaging modality can,thus, follow events with both high spatial and temporal resolu-tion, which is currently not possible with any other modality.
VII. DISCUSSION
With the advent of high frame-rate ultrasound imaging,one may expect an increased clinical interest, since the time-resolved high-quality vector flow maps can now be obtained.Parallel acquisition systems in medical ultrasound have shown

JENSEN et al.: ULTRASOUND VECTOR FLOW IMAGING—PART II: PARALLEL SYSTEMS 1729
Fig. 9. (a) Cerebral blood flow in a rat using conventional velocity imaging and (b) plane waves. (c) Functional ultrasound imaging, where the color indicatesa change in blood flow due to stimulation of the rats’ whiskers (from [48]).
to give considerable advantages in terms of frame rate, esti-mation precision and accuracy, and sensitivity for both thespherical and plane wave emissions. Several methods forultrafast imaging with thousands of frames per second havebeen developed, which can reveal the true 2-D velocity vectorand can quantitatively show complex pulsating flow withturbulence and vortices. The time resolution is in millisecond,and submillimeter resolution has been attained to reveal thetrue hemodynamics. Early indications also show that thesemethods can be translated to a full 3-D flow with acquisitionsof volume data and estimation of the complete 3-D vector.
The major advantage of these systems is the continuouslyavailable data for the full image, and the advantages gainedfrom this are really captured in Figs. 7 and 9. Fig. 7 showsthe ability to estimate high velocity flow in any directionwith a high temporal and spatial resolution. The same typeof acquisition sequence is applied in Fig. 9, where lowvelocity flow is estimated from using many data points andemploys averaging. The complete data sets make it possibleto decide on the processing after data acquisition, and both thevector velocity, slow flow, and spectral content can be foundretrospectively with a high precision.
The resulting data are accurate enough to be used in thehigher order estimates for, e.g., pressure gradient estimationand functional ultrasound imaging. This has led to the devel-opment of the systems capable of showing brain function withexquisite resolution in both time and space, which are capableof revealing the time course of, e.g., epileptic seizures in arat brain [62].
Several challenges still exist for this type of imaging. Theamounts of data and processing demands are huge. Oftenbetween 10 GB/s of data for 2-D imaging up to 140 GB/sfor fully populated 2-D arrays are acquired per second, whichhas to be beamformed for full images for every emission.This gives a large data expansion, and the processing demandsare for several Tflops for real-time imaging [48]. Currently,no real-time parallel flow systems exist, and there is a realneed for faster hardware and more efficient schemes forbeamforming. SASB can reduce the processing demands by afactor of 64 and Fourier beamforming by a factor of 20, sothese methods can be a path to real-time implementations.
Another challenge is the visualization of flow and how thismassive amount of information should be used in the clinic.Especially for 3-D vector flow image and high frame-ratemethods, it is unclear how to handle this. The introduction of
ever faster GPUs with larger bandwidths will in combinationwith more efficient algorithms ultimately solve the real-timeproblem and give a large range of interesting flow systemswith the capability of deriving useful clinical indices.
DISCLOSURE
The authors have been involved in the development of manyof the techniques presented in this review. J. A. Jensen holdspatents on SA flow imaging and directional VFI. He earnsroyalty from the selling of TO VFI systems by BK Ultrasound.S. I. Nikolov is employed by BK Ultrasound. A. C. H. Yu hasa provisional patent on vector projectile imaging that formsthe basis of Mindrays V-Flow option.
REFERENCES
[1] J. A. Jensen, S. I. Nikolov, A. Yu, and D. Garcia, “Ultrasound vectorflow imaging—Part I: Sequential systems,” IEEE Trans. Ultrason.,Ferroelectr., Freq. Control, vol. 63, no. 11, pp. 1704–1721, Nov. 2016.
[2] D. H. Evans and W. N. McDicken, Doppler Ultrasound: Physics,Instrumentation and Signal Processing. Hoboken, NJ, USA: Wiley,2000.
[3] J. A. Jensen, Estimation of Blood Velocities Using Ultrasound: A SignalProcessing Approach. New York, NY, USA: Cambridge Univ. Press,1996.
[4] S. I. Nikolov and J. A. Jensen, “Velocity estimation using syn-thetic aperture imaging,” in Proc. IEEE Ultrason. Symp., Oct. 2001,pp. 1409–1412.
[5] S. Nikolov, “Synthetic aperture tissue and flow ultrasound imaging,”Ph.D. dissertation, Dept. Electr. Eng., Tech. Univ. Denmark, Lyngby,Denmark, 2001.
[6] J. A. Jensen, S. I. Nikolov, K. L. Gammelmark, and M. H. Pedersen,“Synthetic aperture ultrasound imaging,” Ultrasonics, vol. 44,pp. e5–e15, Dec. 2006.
[7] J. J. Flaherty, K. R. Erikson, and V. M. Lund, “Synthetic apertureultrasonic imaging systems,” U.S. Patent 3 548 642, Dec. 22, 1970.
[8] C. B. Burckhardt, P.-A. Grandchamp, and H. Hoffmann, “An experimen-tal 2 MHz synthetic aperture sonar system intended for medical use,”IEEE Trans. Sonics Ultrason., vol. SU-21, no. 1, pp. 1–6, Jan. 1974.
[9] J. T. Ylitalo and H. Ermert, “Ultrasound synthetic aperture imag-ing: Monostatic approach,” IEEE Trans. Ultrason., Ferroelectr., Freq.Control, vol. 41, no. 3, pp. 333–339, May 1994.
[10] P. D. Corl, P. M. Grant, and G. S. Kino, “A digital synthetic focusacoustic imaging system for NDE,” in Proc. IEEE Ultrason. Symp.,Sep. 1978, pp. 263–268.
[11] G. S. Kino, D. Corl, S. Bennett, and K. Peterson, “Real time syntheticaperture imaging system,” in Proc. IEEE Ultrason. Symp., Nov. 1980,pp. 722–731.
[12] D. K. Peterson and G. S. Kino, “Real-time digital image reconstruction:A description of imaging hardware and an analysis of quantizationerrors,” IEEE Trans. Sonics Ultrason., vol. SU-31, no. 4, pp. 337–351,Jul. 1984.
[13] K. Nagai, “A new synthetic-aperture focusing method for ultrasonicB-scan imaging by the Fourier transform,” IEEE Trans. Sonics Ultrason.,vol. SU-32, no. 4, pp. 531–536, Jul. 1985.

1730 IEEE TRANSACTIONS ON ULTRASONICS, FERROELECTRICS, AND FREQUENCY CONTROL, VOL. 63, NO. 11, NOVEMBER 2016
[14] M. O’Donnell and L. J. Thomas, “Efficient synthetic aperture imagingfrom a circular aperture with possible application to catheter-basedimaging,” IEEE Trans. Ultrason., Ferroelectr., Freq. Control, vol. 39,no. 3, pp. 366–380, May 1992.
[15] M. Karaman, P.-C. Li, and M. O’Donnell, “Synthetic aperture imagingfor small scale systems,” IEEE Trans. Ultrason., Ferroelectr., Freq.Control, vol. 42, no. 3, pp. 429–442, May 1995.
[16] M. Karaman and M. O’Donnell, “Subaperture processing for ultrasonicimaging,” IEEE Trans. Ultrason., Ferroelectr., Freq. Control, vol. 45,no. 1, pp. 126–135, Jan. 1998.
[17] G. R. Lockwood and F. S. Foster, “Design of sparse arrayimaging systems,” in Proc. IEEE Ultrason. Symp., Nov. 1995,pp. 1237–1243.
[18] G. R. Lockwood, J. R. Talman, and S. S. Brunke, “Real-time 3-Dultrasound imaging using sparse synthetic aperture beamforming,” IEEETrans. Ultrason., Ferroelectr., Freq. Control, vol. 45, no. 4, pp. 980–988,Jul. 1998.
[19] S. Nikolov, K. Gammelmark, and J. A. Jensen, “Recursive ultra-sound imaging,” in Proc. IEEE Ultrason. Symp., vol. 2. Oct. 1999,pp. 1621–1625.
[20] Y. Takeuchi, “An investigation of a spread energy method for medicalultrasound systems: Part one: Theory and investigation,” Ultrasonics,vol. 17, pp. 175–182, Jul. 1979.
[21] M. O’Donnell, “Coded excitation system for improving the pen-etration of real-time phased-array imaging systems,” IEEE Trans.Ultrason., Ferroelectr., Freq. Control, vol. 39, no. 3, pp. 341–351,May 1992.
[22] T. Misaridis and J. A. Jensen, “Use of modulated excitation signals inmedical ultrasound. Part I: Basic concepts and expected benefits,” IEEETrans. Ultrason., Ferroelectr., Freq. Control, vol. 52, no. 2, pp. 177–191,Feb. 2005.
[23] T. Misaridis and J. A. Jensen, “Use of modulated excitation signals inmedical ultrasound. Part II: Design and performance for medical imagingapplications,” IEEE Trans. Ultrason., Ferroelectr., Freq. Control, vol. 52,no. 2, pp. 192–207, Feb. 2005.
[24] T. Misaridis and J. A. Jensen, “Use of modulated excitation signals inmedical ultrasound. Part III: High frame rate imaging,” IEEE Trans.Ultrason., Ferroelectr., Freq. Control, vol. 52, no. 2, pp. 208–219,Feb. 2005.
[25] K. L. Gammelmark and J. A. Jensen, “Multielement synthetic transmitaperture imaging using temporal encoding,” IEEE Trans. Med. Imag.,vol. 22, no. 4, pp. 552–563, Apr. 2003.
[26] M. H. Pedersen, K. L. Gammelmark, and J. A. Jensen, “In-vivoevaluation of convex array synthetic aperture imaging,” Ultrasound Med.Biol., vol. 33, pp. 37–47, Jan. 2007.
[27] W. H. Kim et al., “Synthetic aperture imaging in breast ultrasound:A preliminary clinical study,” Acad. Radiol., vol. 19, pp. 923–929,Aug. 2012.
[28] R. Y. Chiao, L. J. Thomas, and S. D. Silverstein, “Sparse arrayimaging with spatially-encoded transmits,” in Proc. IEEE Ultrason.Symp., Oct. 1997, pp. 1679–1682.
[29] R. Y. Chiao and L. J. Thomas, “Synthetic transmit aperture imagingusing orthogonal Golay coded excitation,” in Proc. IEEE Ultrason.Symp., Oct. 2000, pp. 1677–1680.
[30] F. Gran and J. A. Jensen, “Frequency division transmission imaging andsynthetic aperture reconstruction,” IEEE Trans. Ultrason., Ferroelectr.,Freq. Control, vol. 53, no. 5, pp. 900–911, May 2006.
[31] F. Gran and J. A. Jensen, “Directional velocity estimation using a spatio-temporal encoding technique based on frequency division for synthetictransmit aperture ultrasound,” IEEE Trans. Ultrason., Ferroelectr., Freq.Control, vol. 53, no. 7, pp. 1289–1299, Jul. 2006.
[32] F. Gran and J. A. Jensen, “Spatial encoding using a code division tech-nique for fast ultrasound imaging,” IEEE Trans. Ultrason., Ferroelectr.,Freq. Control, vol. 55, no. 1, pp. 12–23, Jan. 2008.
[33] S. I. Nikolov and J. A. Jensen, “In-vivo synthetic aperture flow imag-ing in medical ultrasound,” IEEE Trans. Ultrason., Ferroelectr., Freq.Control, vol. 50, no. 7, pp. 848–856, Jul. 2003.
[34] J. A. Jensen and S. I. Nikolov, “Directional synthetic aperture flowimaging,” IEEE Trans. Ultrason., Ferroelectr., Freq. Control, vol. 51,no. 9, pp. 1107–1118, Sep. 2004.
[35] J. A. Jensen and N. Oddershede, “Estimation of velocity vectors insynthetic aperture ultrasound imaging,” IEEE Trans. Med. Imag., vol. 25,no. 12, pp. 1637–1644, Dec. 2006.
[36] C. A. Villagómez Hoyos, M. B. Stuart, K. L. Hansen, M. B. Nielsen,and J. A. Jensen, “Accurate angle estimator for high-frame-rate 2-Dvector flow imaging,” IEEE Trans. Ultrason., Ferroelectr., Freq. Control,vol. 63, no. 6, pp. 842–853, Jun. 2016.
[37] N. Oddershede and J. A. Jensen, “Effects influencing focusing in syn-thetic aperture vector flow imaging,” IEEE Trans. Ultrason., Ferroelectr.,Freq. Control, vol. 54, no. 9, pp. 1811–1825, Sep. 2007.
[38] K. L. Gammelmark and J. A. Jensen, “2-D tissue motion compen-sation of synthetic transmit aperture images,” IEEE Trans. Ultrason.,Ferroelectr., Freq. Control, vol. 61, no. 4, pp. 594–610, Apr. 2014.
[39] H. Takahashi, H. Hasegawa, and H. Kanai, “Echo speckle imaging ofblood particles with high-frame-rate echocardiography,” Jpn. J. Appl.Phys., vol. 53, no. 7S, p. 07KF08, Jul. 2014.
[40] S. Bjærum, H. Torp, and K. Kristoffersen, “Clutter filters adapted totissue motion in ultrasound color flow imaging,” IEEE Trans. Ultrason.,Ferroelectr., Freq. Control, vol. 49, no. 6, pp. 693–704, Jun. 2002.
[41] H. Torp, “Clutter rejection filters in color flow imaging: A theoreticalapproach,” IEEE Trans. Ultrason., Ferroelectr., Freq. Control, vol. 44,no. 2, pp. 417–424, Mar. 1997.
[42] A. C. H. Yu and L. Løvstakken, “Eigen-based clutter filter design forultrasound color flow imaging: A review,” IEEE Trans. Ultrason.,Ferroelectr., Freq. Control, vol. 57, no. 5, pp. 1096–1111,May 2010.
[43] C. Demené et al., “Spatiotemporal clutter filtering of ultrafast ultrasounddata highly increases Doppler and fultrasound sensitivity,” IEEE Trans.Med. Imag., vol. 34, no. 11, pp. 2271–2285, Nov. 2015.
[44] K. L. Hansen et al., “In vivo comparison of three ultrasound vectorvelocity techniques to MR phase contrast angiography,” Ultrasonics,vol. 49, pp. 659–667, Dec. 2009.
[45] J. Bercoff et al., “Ultrafast compound Doppler imaging: Providingfull blood flow characterization,” IEEE Trans. Ultrason., Ferroelectr.,Freq. Control, vol. 58, no. 1, pp. 134–147, Jan. 2011.
[46] C. A. Villagomez-Hoyos, M. B. Stuart, and J. A. Jensen, “Increasing thedynamic range of synthetic aperture vector flow imaging,” Proc. SPIE,vol. 9040, pp. 904011, Mar. 2014.
[47] C. A. Villagomez-Hoyos, M. B. Stuart, and J. A. Jensen, “In-vivo highdynamic range vector flow imaging,” in Proc. IEEE Ultrason. Symp.,Oct. 2015, pp. 1–4.
[48] M. Tanter and M. Fink, “Ultrafast imaging in biomedical ultrasound,”IEEE Trans. Ultrason., Ferroelectr., Freq. Control, vol. 61, no. 1,pp. 102–119, Jan. 2014.
[49] H. So, J. Chen, B. Yiu, and A. Yu, “Medical ultrasound imaging:To GPU or not to GPU?” IEEE Micro, vol. 31, no. 5, pp. 54–65,Sep./Oct. 2011.
[50] J. Kortbek, J. A. Jensen, and K. L. Gammelmark, “Sequential beam-forming for synthetic aperture imaging,” Ultrasonics, vol. 53, no. 1,pp. 1–16, 2013.
[51] M. C. Hemmsen et al., “In vivo evaluation of synthetic aperturesequential beamforming,” Ultrasound Med. Biol., vol. 38, no. 4,pp. 708–716, 2012.
[52] A. H. Brandt et al., “Clinical evaluation of synthetic aperture harmonicimaging for scanning focal malignant liver lesions,” Ultrasound Med.Biol., vol. 41, no. 9, pp. 2368–2375, 2015.
[53] Y. Li and J. A. Jensen, “Directional synthetic aperture flow imagingusing a dual stage beamformer approach,” in Proc. IEEE Ultrason.Symp., Oct. 2011, pp. 1254–1257.
[54] M. C. Hemmsen, L. Lassen, T. Kjeldsen, J. Mosegaard, and J. A. Jensen,“Implementation of real-time duplex synthetic aperture ultrasonogra-phy,” in Proc. IEEE Ultrason. Symp., Oct. 2015, pp. 1–4.
[55] M. Tanter, J. Bercoff, L. Sandrin, and M. Fink, “Ultrafast compoundimaging for 2-D motion vector estimation: Application to transient elas-tography,” IEEE Trans. Ultrason., Ferroelectr., Freq. Control, vol. 49,no. 10, pp. 1363–1374, Oct. 2002.
[56] J. Bercoff, M. Tanter, L. Sandrin, S. Catheline, and M. Fink, “Ultrafastcompound imaging for 2D displacement vector measurements: Applica-tion to transient elastography and color flow mapping,” in Proc. IEEEUltrason. Symp., Oct. 2001, pp. 1619–1622.
[57] L. Sandrin, S. Manneville, and M. Fink, “Ultrafast two-dimensionalultrasonic speckle velocimetry: A tool in flow imaging,” Appl. Phys.Lett., vol. 78, no. 8, pp. 1155–1157, 2001.
[58] J. Udesen, F. Gran, and J. A. Jensen, “Fast color flow mode imag-ing using plane wave excitation and temporal encoding,” Proc. SPIE,vol. 5750, pp. 427–436, Jun. 2005.
[59] J. Udesen, F. Gran, K. L. Hansen, J. A. Jensen, C. Thomsen, andM. B. Nielsen, “High frame-rate blood vector velocity imaging usingplane waves: Simulations and preliminary experiments,” IEEE Trans.Ultrason., Ferroelectr., Freq. Control, vol. 55, no. 8, pp. 1729–1743,Aug. 2008.
[60] S. Fadnes, S. A. Nyrnes, H. Torp, and L. Lovstakken, “Shunt flowevaluation in congenital heart disease based on two-dimensional speckletracking,” Ultrasound Med. Biol., vol. 40, no. 10, pp. 2379–2391, 2014.

JENSEN et al.: ULTRASOUND VECTOR FLOW IMAGING—PART II: PARALLEL SYSTEMS 1731
[61] S. K. Jespersen, J. E. Wilhjelm, and H. Sillesen, “Multi-angle compoundimaging,” Ultrason. Imag., vol. 20, pp. 81–102, Apr. 1998.
[62] E. Macé, G. Montaldo, I. Cohen, M. Baulac, M. Fink, and M. Tanter,“Functional ultrasound imaging of the brain,” Nature Methods, vol. 8,no. 8, pp. 662–664, 2011.
[63] E. Macé, G. Montaldo, B. Osmanski, I. Cohen, M. Fink, and M. Tanter,“Functional ultrasound imaging of the brain: Theory and basic princi-ples,” IEEE Trans. Ultrason., Ferroelectr., Freq. Control, vol. 60, no. 3,pp. 492–506, Mar. 2013.
[64] J. A. Jensen et al., “Ultrasound research scanner for real-time syntheticaperture data acquisition,” IEEE Trans. Ultrason., Ferroelectr., Freq.Control, vol. 52, no. 5, pp. 881–891, May 2005.
[65] P. Tortoli, L. Bassi, E. Boni, A. Dallai, F. Guidi, and S. Ricci,“ULA-OP: An advanced open platform for ultrasound research,”IEEE Trans. Ultrason., Ferroelectr., Freq. Control, vol. 56, no. 10,pp. 2207–2216, Oct. 2009.
[66] R. E. Daigle and P. J. Kaczdowski, “High frame rate quan-titative Doppler flow imaging using unfocused transmit beams,”U.S. Patent 2009 0 326 379 A1, Dec. 31, 2009.
[67] J. A. Jensen et al., “SARUS: A synthetic aperture real-time ultrasoundsystem,” IEEE Trans. Ultrason., Ferroelectr., Freq. Control, vol. 60,no. 9, pp. 1838–1852, Sep. 2013.
[68] C. C. P. Cheung et al., “Multi-channel pre-beamformed data acquisitionsystem for research on advanced ultrasound imaging methods,” IEEETrans. Ultrason., Ferroelectr., Freq. Control, vol. 59, no. 2, pp. 243–253,Feb. 2012.
[69] M. Walczak, M. Lewandowski, and N. Zołek, “Optimization of real-time ultrasound PCIe data streaming and OpenCL processing for SAFTimaging,” in Proc. IEEE Ultrason. Symp., Jul. 2013, pp. 2064–2067.
[70] M. Walczak, M. Lewandowski, and N. Zołek, “A real-time streamingDAQ for ultrasonix research scanner,” in Proc. IEEE Ultrason. Symp.,Sep. 2014, pp. 1257–1260.
[71] S. Ricci, L. Bassi, and P. Tortoli, “Real-time vector velocity assessmentthrough multigate Doppler and plane waves,” IEEE Trans. Ultrason.,Ferroelectr., Freq. Control, vol. 61, no. 2, pp. 314–324, Feb. 2014.
[72] S. Ricci, D. Vilkomerson, R. Matera, and P. Tortoli, “Accurate bloodpeak velocity estimation using spectral models and vector Doppler,”IEEE Trans. Ultrason., Ferroelectr., Freq. Control, vol. 62, no. 4,pp. 686–696, Apr. 2015.
[73] B. Y. S. Yiu, S. S. M. Lai, and A. C. H. Yu, “Vector projectile imag-ing: Time-resolved dynamic visualization of complex flow patterns,”Ultrasound Med. Biol., vol. 40, no. 9, pp. 2295–2309, Sep. 2014.
[74] I. K. Ekroll, A. Swillens, P. Segers, T. Dahl, H. Torp, and L. Lovstakken,“Simultaneous quantification of flow and tissue velocities based onmulti-angle plane wave imaging,” IEEE Trans. Ultrason., Ferroelectr.,Freq. Control, vol. 60, no. 4, pp. 727–738, Apr. 2013.
[75] S. Fadnes, I. K. Ekroll, S. A. Nyrnes, H. Torp, and L. Løvstakken,“Robust angle-independent blood velocity estimation based on dual-angle plane wave imaging,” IEEE Trans. Ultrason., Ferroelectr., Freq.Control, vol. 62, no. 10, pp. 1757–1767, Oct. 2015.
[76] J. Flynn, R. Daigle, L. Pflugrath, K. Linkhart, and P. Kaczkowski,“Estimation and display for vector Doppler imaging using planewavetransmissions,” in Proc. IEEE Ultrason. Symp., Oct. 2011, pp. 413–418.
[77] J. Flynn, R. Daigle, L. Pflugrath, and P. Kaczkowski, “High frameratevector velocity blood flow imaging using a single planewave transmis-sion angle,” in Proc. IEEE Ultrason. Symp., Oct. 2012, pp. 323–325.
[78] C. H. A. Yu and Y. S. Yiu, “Apparatus for ultrasound flow vector imagingand methods thereof,” WO Patent 2015 074 511 A1, May 28, 2015.
[79] F. Gran, J. Udesen, M. B. Nielsen, and J. A. Jensen, “Coded ultrasoundfor blood flow estimation using subband processing,” IEEE Trans.Ultrason., Ferroelectr., Freq. Control, vol. 55, no. 10, pp. 2211–2220,Oct. 2008.
[80] S. Salles, A. J. Y. Chee, D. Garcia, A. C. H. Yu, D. Vray, andH. Liebgott, “2-D arterial wall motion imaging using ultrafast ultrasoundand transverse oscillations,” IEEE Trans. Ultrason., Ferroelectr., Freq.Control, vol. 62, no. 6, pp. 1047–1058, Jun. 2015.
[81] M. Lenge, A. Ramalli, P. Tortoli, C. Cachard, and H. Liebgott, “Plane-wave transverse oscillation for high-frame-rate 2-D vector flow imag-ing,” IEEE Trans. Ultrason., Ferroelectr., Freq. Control, vol. 62, no. 12,pp. 2126–2137, Dec. 2015.
[82] D. P. Shattuck, M. D. Weinshenker, S. W. Smith, and O. T. von Ramm,“Explososcan: A parallel processing technique for high speed ultrasoundimaging with linear phased arrays,” J. Acoust. Soc. Amer., vol. 75, no. 4,pp. 1273–1282, 1984.
[83] T. X. Misaridis and J. A. Jensen, “Space–time encoding for highframe rate ultrasound imaging,” Ultrasonics, vol. 40, pp. 593–597,May 2002.
[84] L. Tong, A. Ramalli, R. Jasaityte, P. Tortoli, and J. D’hooge, “Multi-transmit beam forming for fast cardiac imaging—Experimental valida-tion and in vivo application,” IEEE Trans. Med. Imag., vol. 33, no. 6,pp. 1205–1219, Jun. 2014.
[85] N. Oddershede, F. Gran, and J. A. Jensen, “Multi-frequency encodingfor fast color flow or quadroplex imaging,” IEEE Trans. Ultrason.,Ferroelectr., Freq. Control, vol. 55, no. 4, pp. 778–786, Apr. 2008.
[86] S. Holbek, M. J. Pihl, C. Ewertsen, M. B. Nielsen, and J. A. Jensen,“In vivo 3-D vector velocity estimation with continuous data,” in Proc.IEEE Ultrason. Symp., Oct. 2015, pp. 1–4.
[87] S. Holbek, T. L. Christiansen, M. Stuart, C. Beers, E. V. Thomsen, andJ. A. Jensen, “3-D vector flow estimation with row-column addressedarrays,” IEEE Trans. Ultrason., Ferroelectr., Freq. Control, to bepublished.
[88] J. A. Jensen and S. I. Nikolov, “A method for real-time three-dimensionalvector velocity imaging,” in Proc. IEEE Ultrason. Symp., Oct. 2003,pp. 1582–1585.
[89] J. Provost et al., “3D ultrafast ultrasound imaging in vivo,” Phys. Med.Biol., vol. 59, no. 19, pp. L1–L13, 2014.
[90] K. L. Hansen, J. Udesen, F. Gran, J. A. Jensen, and M. B. Nielsen,“In-vivo examples of flow patterns with the fast vector velocity ultra-sound method,” Ultraschall Med., vol. 30, no. 5, pp. 471–476, 2009.
[91] K. L. Hansen, J. Udesen, F. Gran, J. A. Jensen, and M. B. Nielsen,“Fast blood vector velocity imaging using ultrasound: In-vivo examplesof complex blood flow in the vascular system,” in Proc. IEEE Ultrason.Symp., Nov. 2008, pp. 1068–1071.
[92] H. Abe et al., “Contrast echocardiography for assessing left ventricularvortex strength in heart failure: A prospective cohort study,” Eur. HeartJ.-Cardiovascular Imag., vol. 14, no. 11, pp. 1049–1060, Nov. 2013.
[93] M. Cikes, L. Tong, G. R. Sutherland, and J. D’hooge, “Ultrafast car-diac ultrasound imaging: Technical principles, applications, and clinicalbenefits,” JACC, Cardiovascular Imag., vol. 7, no. 8, pp. 812–823, 2014.
[94] C. Moore et al., “Live high-frame-rate echocardiography,” IEEE Trans.Ultrason., Ferroelectr., Freq. Control, vol. 62, no. 10, pp. 1779–1787,Oct. 2015.
[95] P. Angelelli, S. R. Snare, S. A. Nyrnes, S. Bruckner, H. Hauser, andL. Løvstakken, “Live ultrasound-based particle visualization of bloodflow in the heart,” in Proc. 30th Spring Conf. Comput. Graph., 2014,pp. 13–20.
[96] C. Demené et al., “4D microvascular imaging based on ultrafast Dopplertomography,” Neuroimage, vol. 127, pp. 472–483, Feb. 2015.
Jørgen Arendt Jensen (M’93–SM’02–F’12)received the Master of Science degree in electricalengineering in 1985 and the Ph.D. degree in 1989,both from the Technical University of Denmark. Hereceived the Dr.Techn. degree from the universityin 1996.
Since 1993, he has been Full Professor ofBiomedical Signal Processing with the Departmentof Electrical Engineering, Technical University ofDenmark and head of the Center for Fast UltrasoundImaging since its inauguration in 1998. He has
published more than 450 journal and conference papers on signal processingand medical ultrasound and the book Estimation of Blood Velocities UsingUltrasound (Cambridge Univ. Press), 1996. He is also the developer andmaintainer of the Field II simulation program. He has been a visiting scientistat Duke University, Stanford University, and the University of Illinois atUrbana-Champaign. He was head of the Biomedical Engineering groupfrom 2007 to 2010. In 2003, he was one of the founders of the biomedicalengineering program in Medicine and Technology, which is a joint degreeprogram between the Technical University of Denmark and the Faculty ofHealth and Medical Sciences at the University of Copenhagen. The degreeis one of the most sought-after engineering degrees in Denmark. He waschairman of the study board from 2003 to 2010 and Adjunct Professorwith the University of Copenhagen from 2005 to 2010. He has given anumber of short courses on simulation, synthetic aperture imaging, and flowestimation at international scientific conferences and teaches biomedicalsignal processing and medical imaging at the Technical University ofDenmark. His research is centered around simulation of ultrasound imaging,synthetic aperture imaging, vector blood flow estimation, and construction ofultrasound research systems.
Dr. Jensen has given more than 60 invited talks at international meetingsand received several awards for his research.

1732 IEEE TRANSACTIONS ON ULTRASONICS, FERROELECTRICS, AND FREQUENCY CONTROL, VOL. 63, NO. 11, NOVEMBER 2016
Svetoslav Ivanov Nikolov (SM’11) received theM.Sc. degree in electrical engineering from theTechnical University of Sofia, Sofia, Bulgaria,in 1996, and the Ph.D. degree from the TechnicalUniversity of Denmark (DTU), Kongens Lyngby,Denmark, in 2001.
He was an Associate Professor in electronics andsignal processing with the DTU from 2001 to 2009.In 2008, he joined BK Ultrasound, Herlev, Denmark,to work on the commercial implementation of thetechnologies developed at DTU.
Dr. Nikolov has been an Analogic Fellow since 2015 as a recognition forhis work in research and development.
Alfred C. H. Yu (S’99–M’07–SM’12) receivedthe bachelor’s degree in electrical engineering fromthe University of Calgary, Calgary, AB, Canada,in 2002, and the M.A.Sc. and Ph.D. degreesin biomedical engineering from the University ofToronto, Toronto, ON, Canada, in 2004 and 2007,respectively.
He was an Intern with Philips ResearchNorth America, Cambridge, MA, USA, in 2005.Before he relocated to the University of Waterloo,Waterloo, ON, Canada, he was a Research Assistant
Professor with The University of Hong Kong, Hong Kong, where he foundedand served as the Principal Investigator of the HKU Biomedical UltrasoundLaboratory. He is currently an Associate Professor with the Department ofElectrical and Computer Engineering, University of Waterloo. His currentresearch interests include ultrasound imaging innovations and therapeuticultrasound discoveries.
Dr. Yu is a Senior Member of the American Institute of Ultrasound inMedicine. He is currently an Associate Editor of IEEE TRANSACTIONS ON
ULTRASONICS, FERROELECTRICS, AND FREQUENCY CONTROL and anEditorial Board Member of Ultrasound in Medicine and Biology. He alsoserves on the Technical Program Committee of the IEEE UltrasonicsSymposium and International Symposium for Therapeutic Ultrasound.
Damien Garcia received the Engineering degreein mechanical engineering from the Ecole Centralede Marseille, Marseille, France, in 1997, and thePh.D. degree in biomedical engineering from theUniversity of Montreal, Montreal, QC, Canada, in2003.
He was a Postdoctoral Fellow with theDepartment of Echocardiography, Gregorio MarañónHospital, Madrid, Spain, from 2006 to 2008.He is currently Director of the Research Unitof Biomechanics & Imaging in Cardiology,
University of Montreal Hospital Research Centre, Montreal, and an AssistantProfessor with the Department of Radiology, Radio-Oncology and NuclearMedicine, University of Montreal. His current research interests includecardiac/cardiovascular ultrasound imaging, mostly in fluid dynamics andflow imaging.
Dr. Garcia is currently an Associate Editor of IEEE TRANSACTIONS ONULTRASONICS, FERROELECTRICS, AND FREQUENCY CONTROL. He serveson the Technical Program Committee of the IEEE Ultrasonics Symposium.