Embed Size (px)
Citation preview
Ultrasound Technology and Ultrasound Technology and Compressed Air AuditsCompressed Air Audits
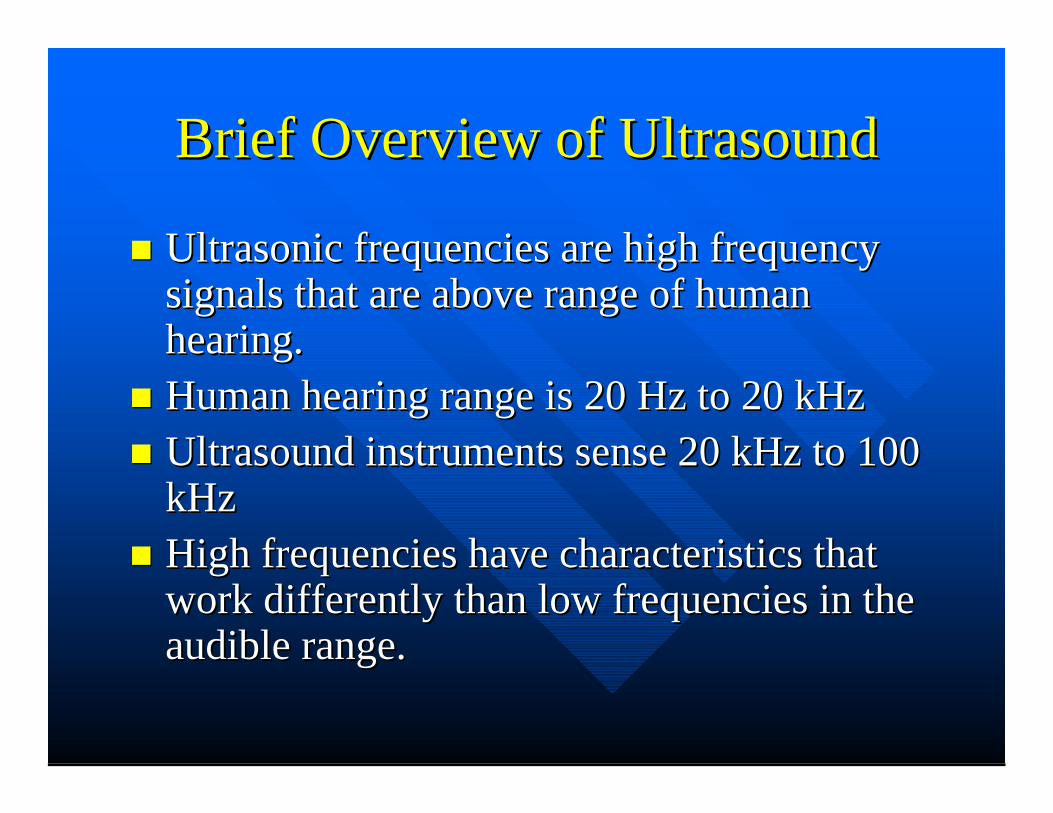
Brief Overview of UltrasoundBrief Overview of Ultrasound
Ultrasonic frequencies are high frequency Ultrasonic frequencies are high frequency signals that are above range of human signals that are above range of human hearing. hearing. Human hearing range is 20 Hz to 20 kHzHuman hearing range is 20 Hz to 20 kHzUltrasound instruments sense 20 kHz to 100 Ultrasound instruments sense 20 kHz to 100 kHzkHzHigh frequencies have characteristics that High frequencies have characteristics that work differently than low frequencies in the work differently than low frequencies in the audible range. audible range.
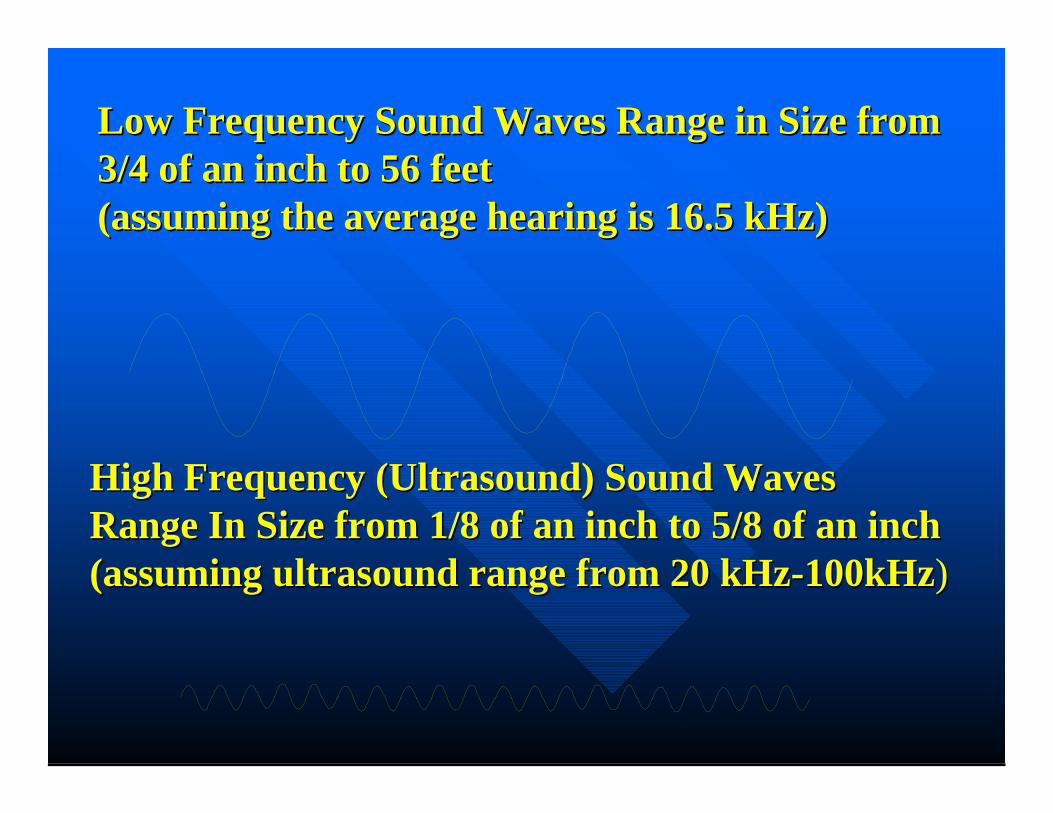
Low Frequency Sound Waves Range in Size fromLow Frequency Sound Waves Range in Size from3/4 of an inch to 56 feet3/4 of an inch to 56 feet(assuming the average hearing is 16.5 kHz)(assuming the average hearing is 16.5 kHz)
High Frequency (Ultrasound) Sound WavesHigh Frequency (Ultrasound) Sound WavesRange In Size from 1/8 of an inch to 5/8 of an inchRange In Size from 1/8 of an inch to 5/8 of an inch(assuming ultrasound range from 20 kHz(assuming ultrasound range from 20 kHz--100kHz100kHz))
Ultrasonic CharacteristicsUltrasonic Characteristics
Characteristics of short wave sounds:Characteristics of short wave sounds:
They are directional/detectableThey are directional/detectableThey are localized to the source of emissionThey are localized to the source of emissionThey will reflect and not penetrate solid objects They will reflect and not penetrate solid objects making them easy to block/shieldmaking them easy to block/shieldThey can be sensed in loud, noisy environmentsThey can be sensed in loud, noisy environmentsSubtle changes can be noted to provide early Subtle changes can be noted to provide early warning of failurewarning of failure
SOUND PENETRATIONSOUND PENETRATION
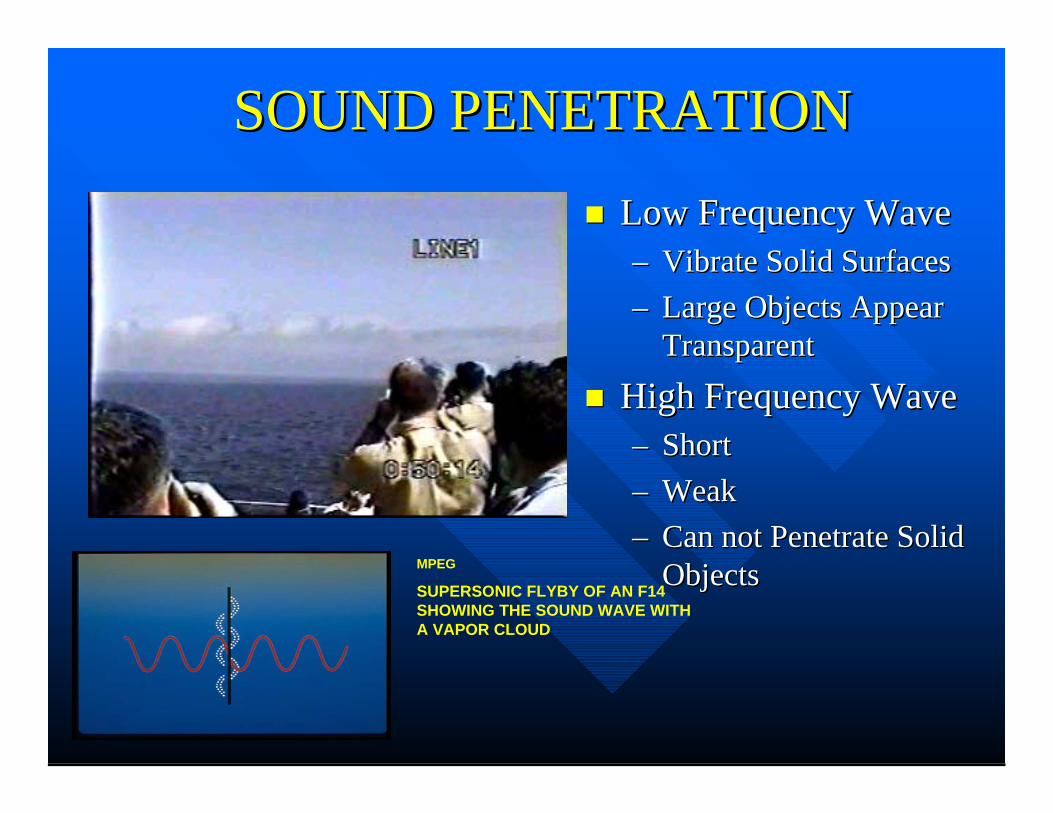
Low Frequency WaveLow Frequency Wave–– Vibrate Solid SurfacesVibrate Solid Surfaces–– Large Objects Appear Large Objects Appear
TransparentTransparent
High Frequency WaveHigh Frequency Wave–– ShortShort–– WeakWeak–– Can not Penetrate Solid Can not Penetrate Solid
ObjectsObjectsMPEG
SUPERSONIC FLYBY OF AN F14 SHOWING THE SOUND WAVE WITH A VAPOR CLOUD
How Do We Detect Ultrasound?How Do We Detect Ultrasound?
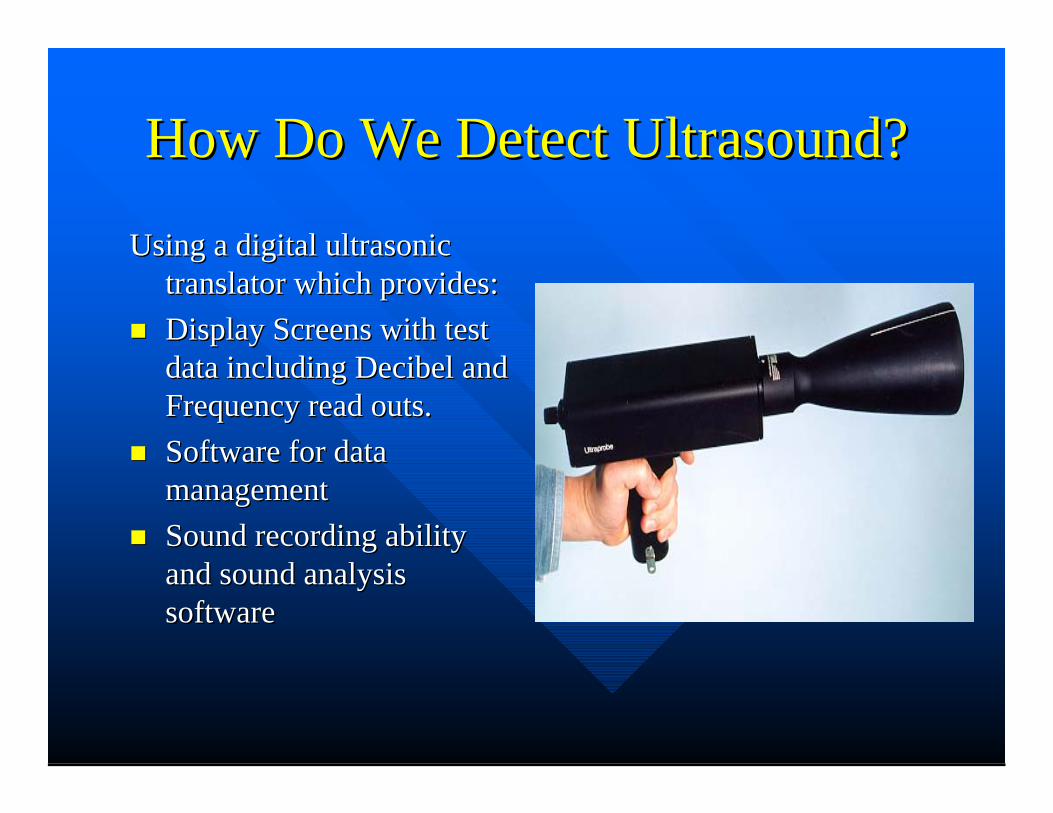
Using a digital ultrasonic Using a digital ultrasonic translator which provides:translator which provides:Display Screens with test Display Screens with test data including Decibel and data including Decibel and Frequency read outs.Frequency read outs.Software for data Software for data managementmanagementSound recording ability Sound recording ability and sound analysis and sound analysis software software
TYPICAL ULTRASONIC TYPICAL ULTRASONIC TRANSLATORTRANSLATOR
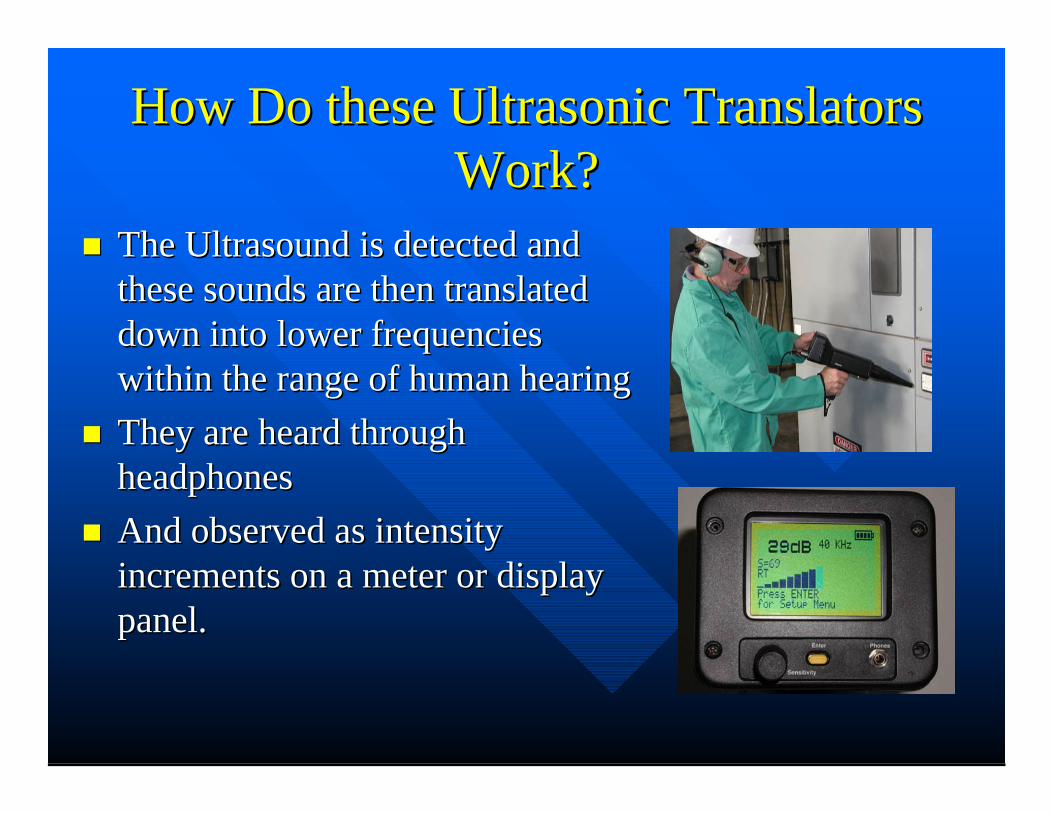
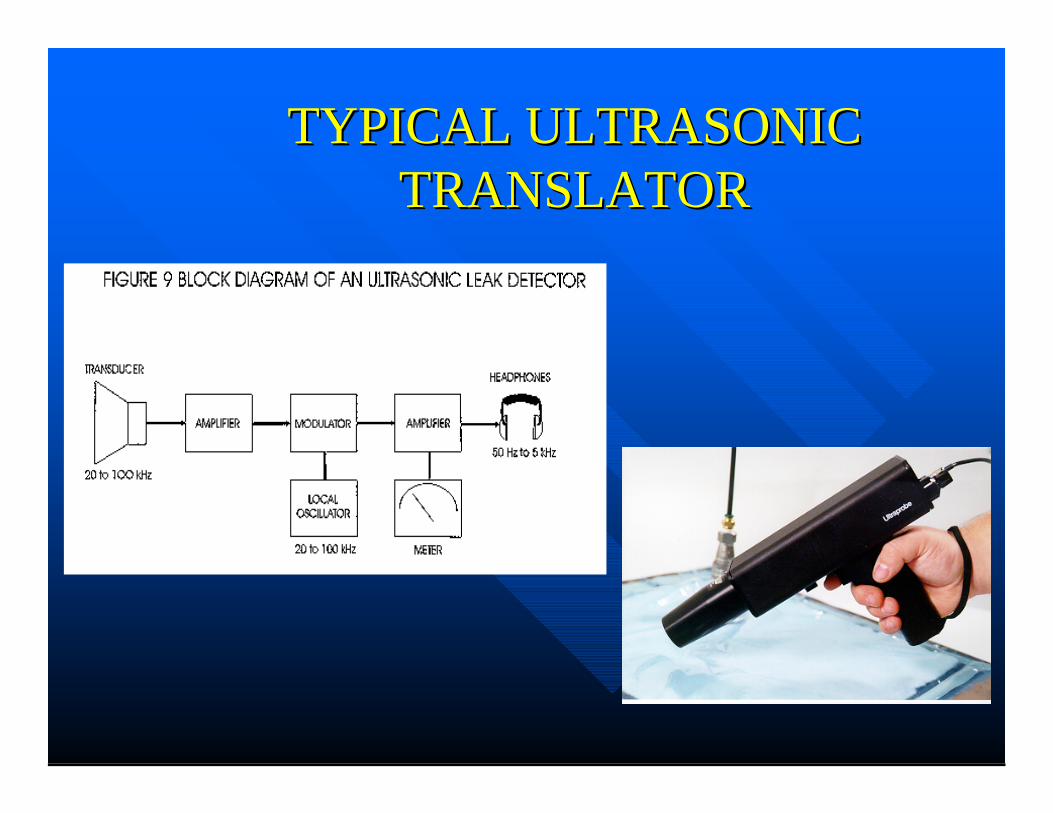
How Do these Ultrasonic Translators How Do these Ultrasonic Translators Work?Work?
The Ultrasound is detected and The Ultrasound is detected and these sounds are then translated these sounds are then translated down into lower frequencies down into lower frequencies within the range of human hearingwithin the range of human hearingThey are heard through They are heard through headphonesheadphonesAnd observed as intensity And observed as intensity increments on a meter or display increments on a meter or display panel.panel.
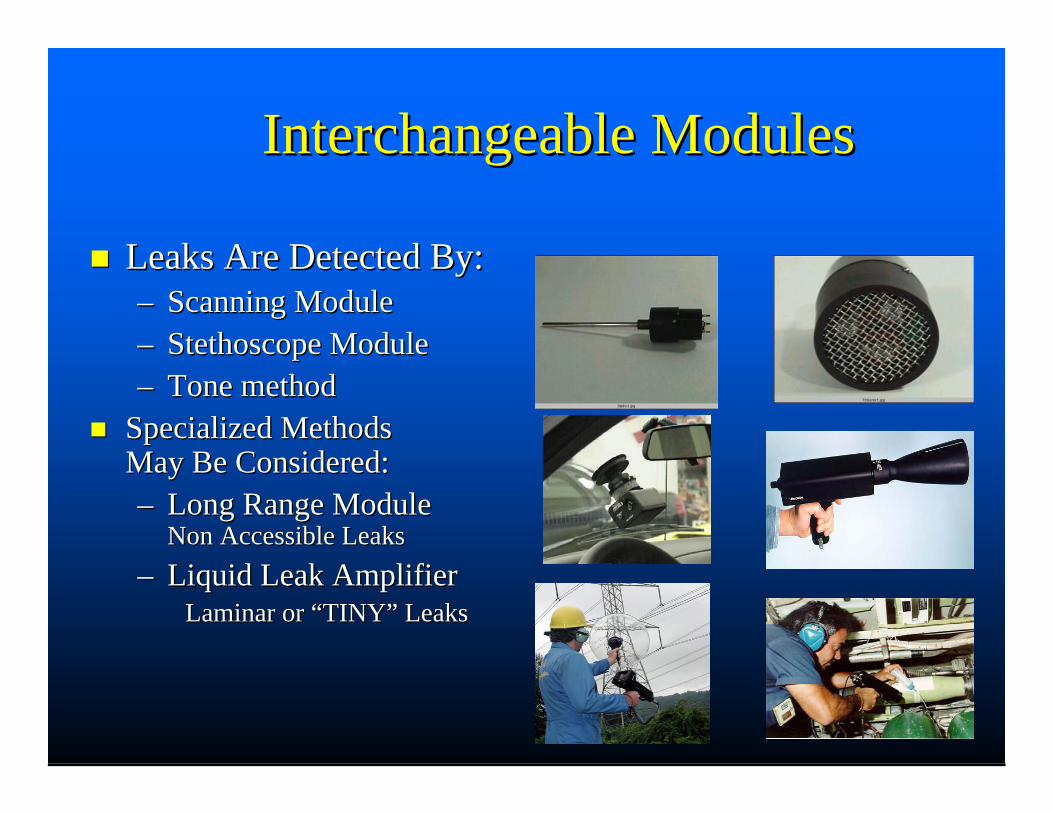
Interchangeable Modules Interchangeable Modules
Leaks Are Detected By:Leaks Are Detected By:–– Scanning ModuleScanning Module–– Stethoscope ModuleStethoscope Module–– Tone methodTone method
Specialized Methods Specialized Methods May Be Considered:May Be Considered:–– Long Range Module Long Range Module
Non Accessible LeaksNon Accessible Leaks–– Liquid Leak Amplifier Liquid Leak Amplifier
Laminar or “TINY” LeaksLaminar or “TINY” Leaks
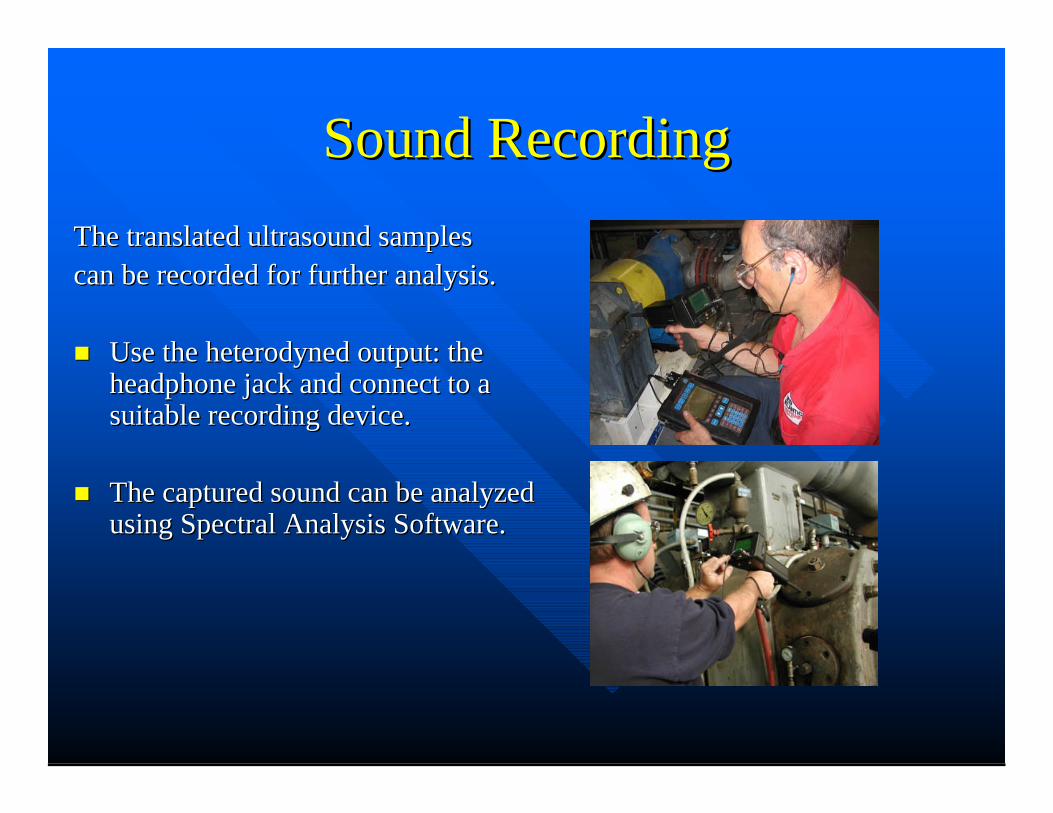
Sound RecordingSound RecordingThe translated ultrasound samplesThe translated ultrasound samplescan be recorded for further analysis.can be recorded for further analysis.
Use the heterodyned output: the Use the heterodyned output: the headphone jack and connect to a headphone jack and connect to a suitable recording device.suitable recording device.
The captured sound can be analyzed The captured sound can be analyzed using Spectral Analysis Software.using Spectral Analysis Software.
Where Do Air Leaks Occur?Where Do Air Leaks Occur?
Mechanical SealsMechanical SealsThreaded FittingsThreaded FittingsSealant Problems Sealant Problems GasketsGasketsCorrosion/ErosionCorrosion/ErosionStructure PenetrationsStructure Penetrations
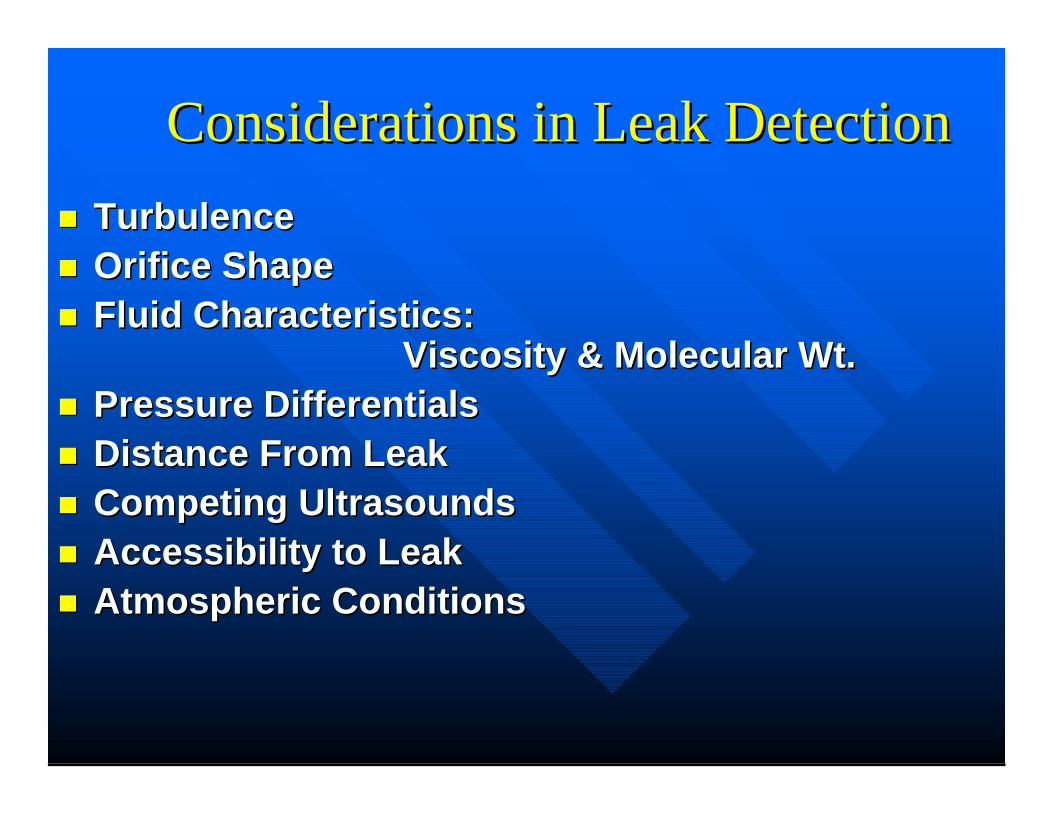
Considerations in Leak DetectionConsiderations in Leak DetectionTurbulenceTurbulenceOrifice ShapeOrifice ShapeFluid Characteristics: Fluid Characteristics:
Viscosity & Molecular Wt.Viscosity & Molecular Wt.Pressure DifferentialsPressure DifferentialsDistance From LeakDistance From LeakCompeting UltrasoundsCompeting UltrasoundsAccessibility to LeakAccessibility to LeakAtmospheric ConditionsAtmospheric Conditions
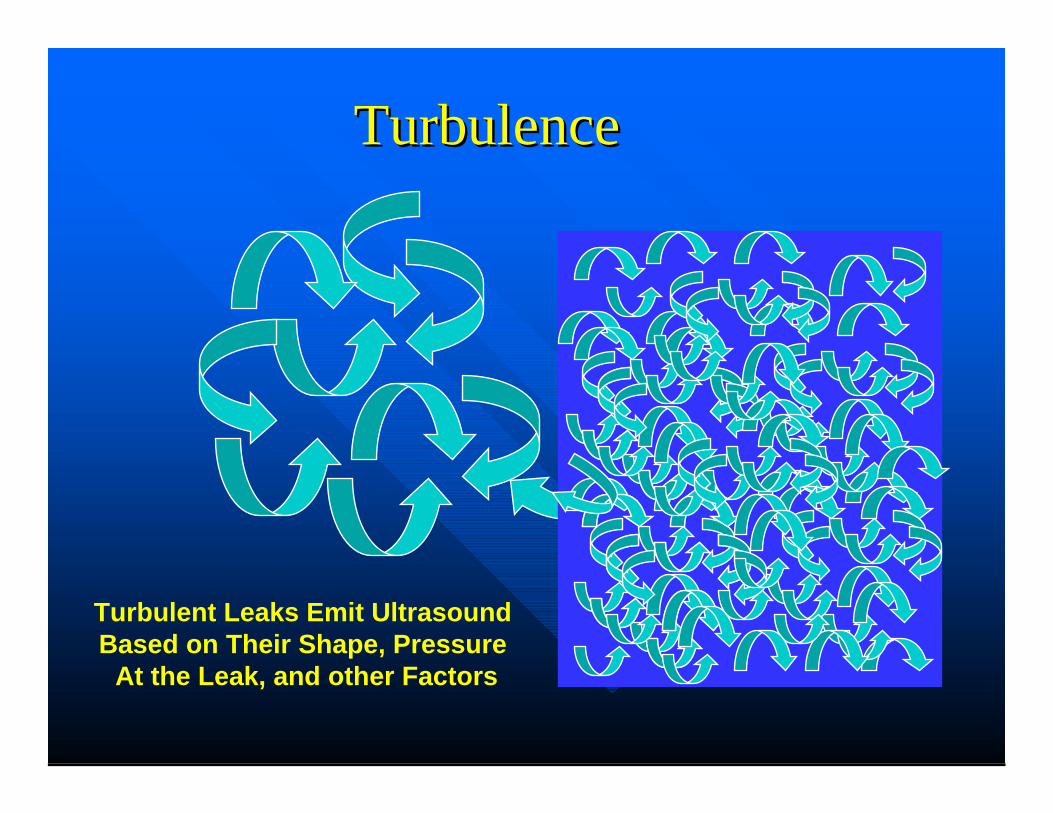
TurbulenceTurbulence
Turbulent Leaks Emit Ultrasound Based on Their Shape, Pressure
At the Leak, and other Factors
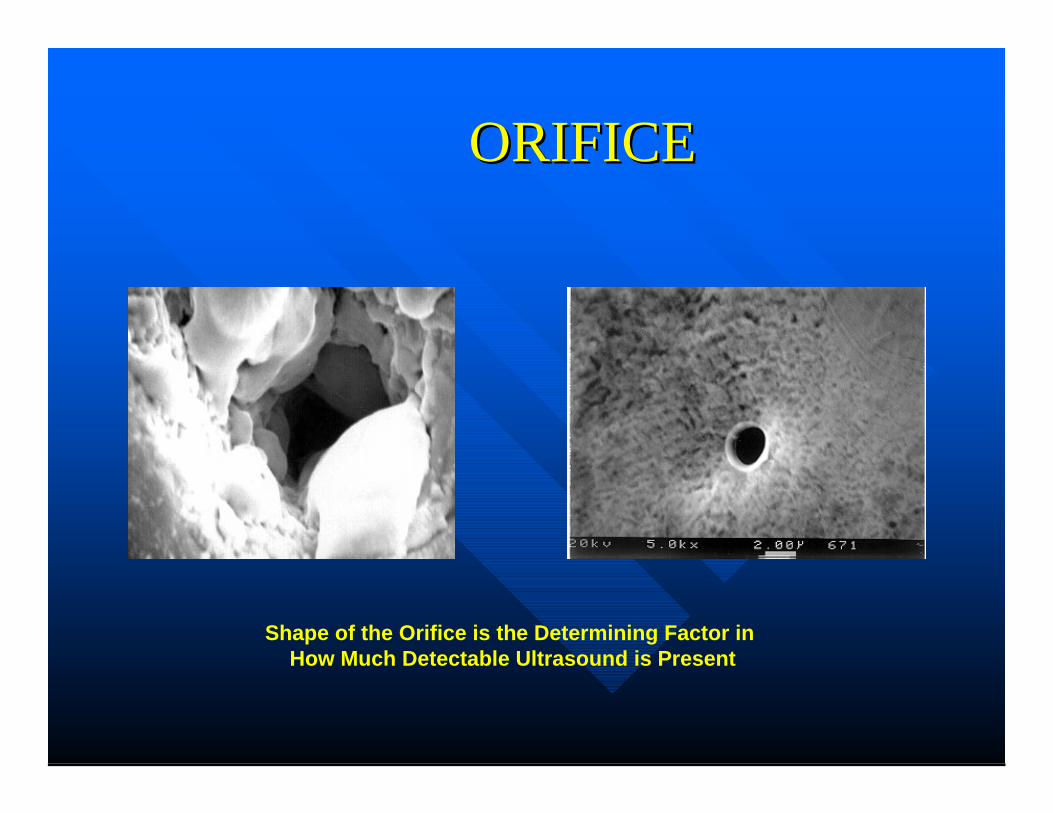
ORIFICEORIFICE
Shape of the Orifice is the Determining Factor in How Much Detectable Ultrasound is Present
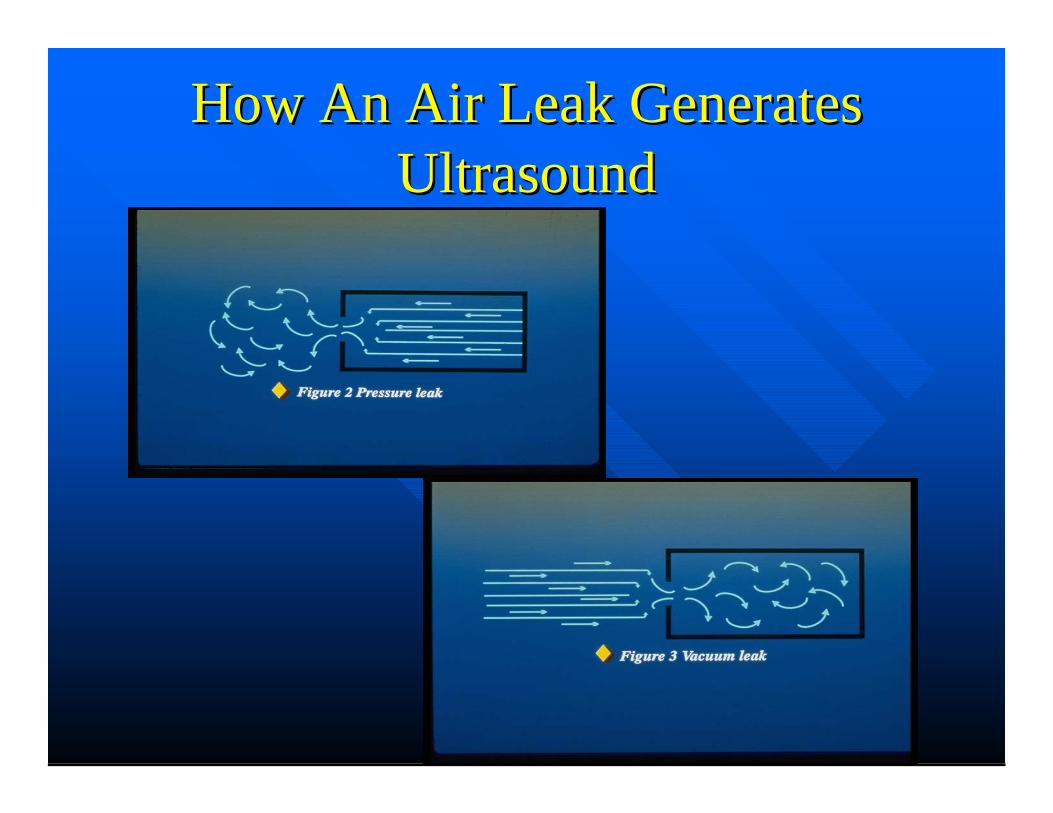
How An Air Leak Generates How An Air Leak Generates UltrasoundUltrasound
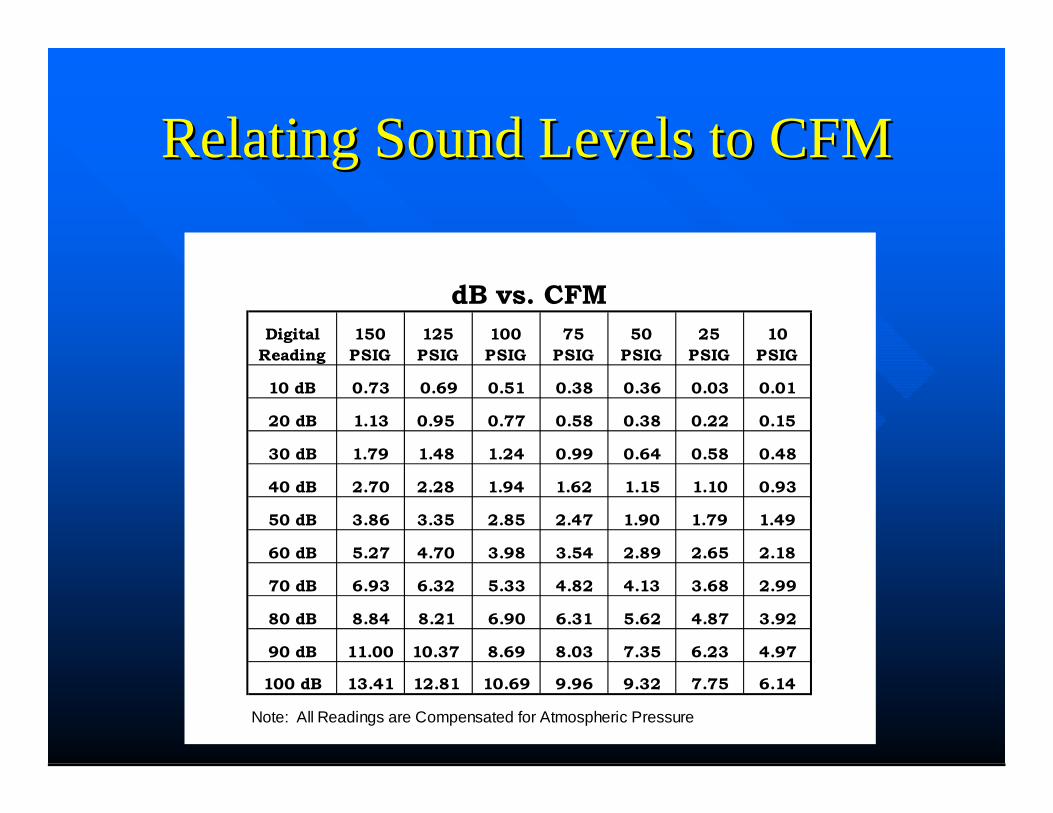
Relating Sound Levels to CFMRelating Sound Levels to CFM
dB vs. CFMDigital
Reading150 PSIG
125 PSIG
100 PSIG
75 PSIG
50 PSIG
25 PSIG
10 PSIG
10 dB 0.73 0.69 0.51 0.38 0.36 0.03 0.01
20 dB 1.13 0.95 0.77 0.58 0.38 0.22 0.15
30 dB 1.79 1.48 1.24 0.99 0.64 0.58 0.48
40 dB 2.70 2.28 1.94 1.62 1.15 1.10 0.93
50 dB 3.86 3.35 2.85 2.47 1.90 1.79 1.49
60 dB 5.27 4.70 3.98 3.54 2.89 2.65 2.18
70 dB 6.93 6.32 5.33 4.82 4.13 3.68 2.99
80 dB 8.84 8.21 6.90 6.31 5.62 4.87 3.92
90 dB 11.00 10.37 8.69 8.03 7.35 6.23 4.97
100 dB 13.41 12.81 10.69 9.96 9.32 7.75 6.14
Note: All Readings are Compensated for Atmospheric Pressure
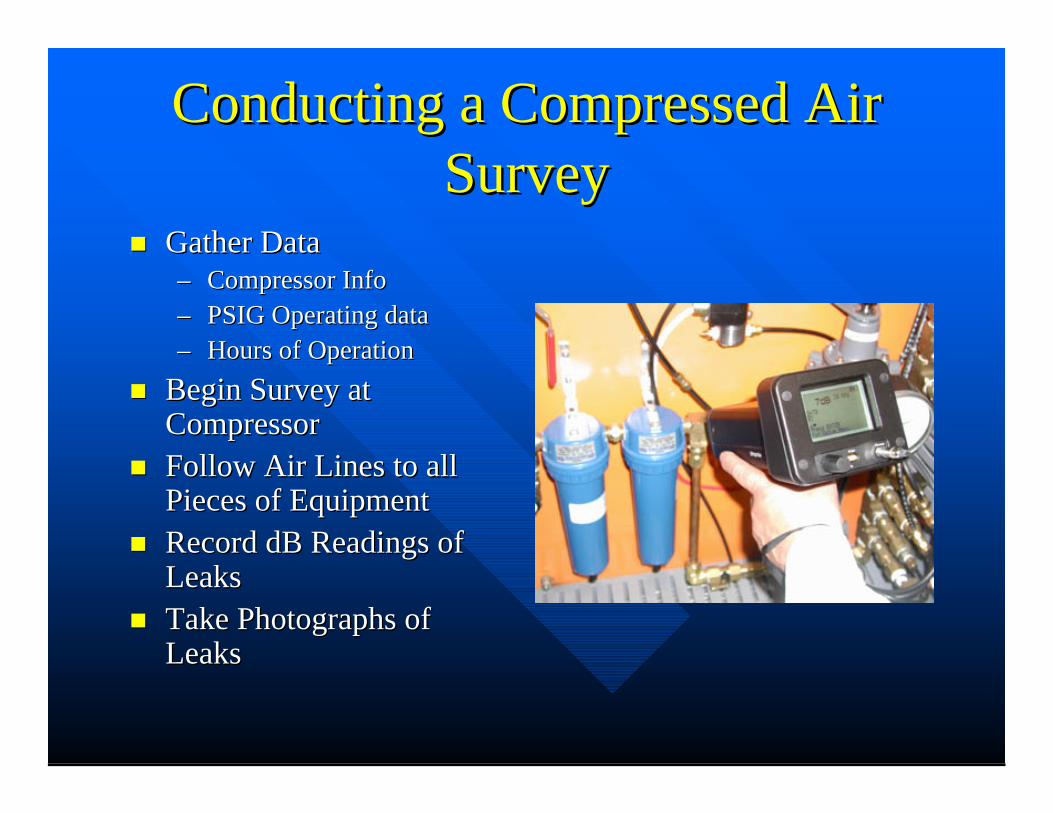
Conducting a Compressed Air Conducting a Compressed Air SurveySurvey
Gather DataGather Data–– Compressor InfoCompressor Info–– PSIG Operating dataPSIG Operating data–– Hours of OperationHours of Operation
Begin Survey at Begin Survey at CompressorCompressorFollow Air Lines to all Follow Air Lines to all Pieces of EquipmentPieces of EquipmentRecord dB Readings of Record dB Readings of LeaksLeaksTake Photographs of Take Photographs of LeaksLeaks
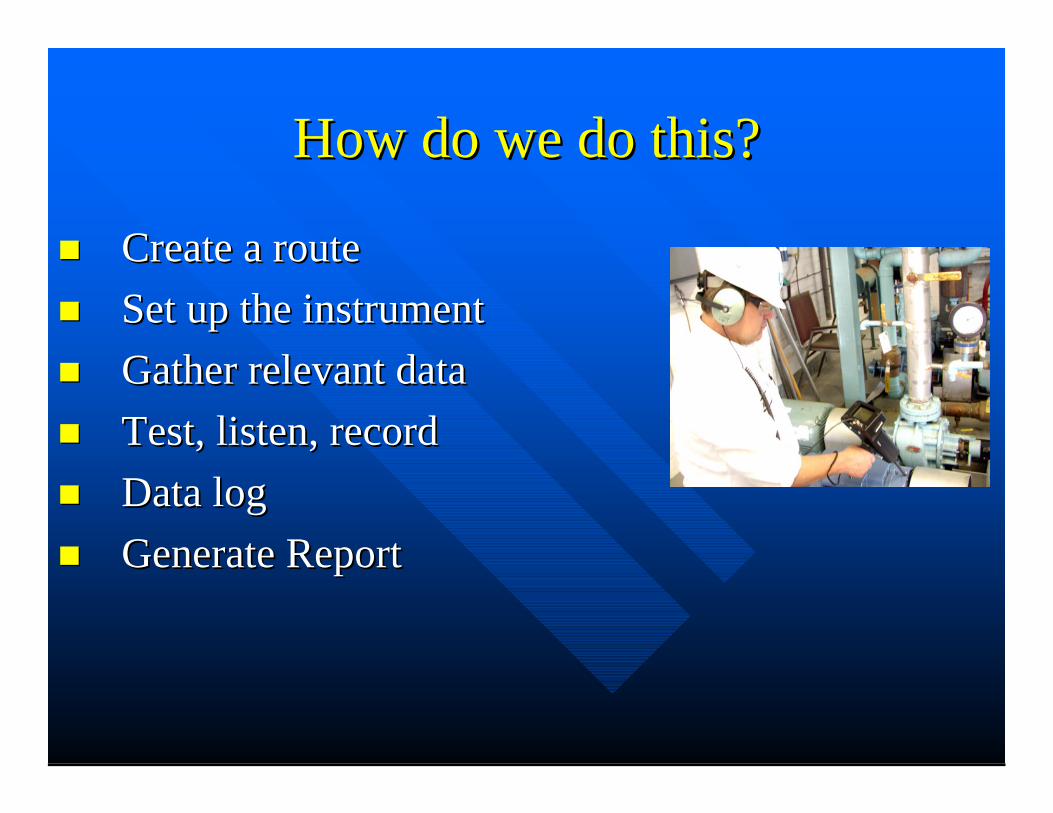
How do we do this?How do we do this?
Create a routeCreate a routeSet up the instrumentSet up the instrumentGather relevant dataGather relevant dataTest, listen, recordTest, listen, recordData logData logGenerate ReportGenerate Report
Create A RouteCreate A Route
Plan carefullyPlan carefullyWith plant personnel, determine the optimal With plant personnel, determine the optimal route for inspection and ease of follow up route for inspection and ease of follow up for repair.for repair.Create a method of equipment identification Create a method of equipment identification (if none exists)(if none exists)
Set Up InstrumentSet Up Instrument
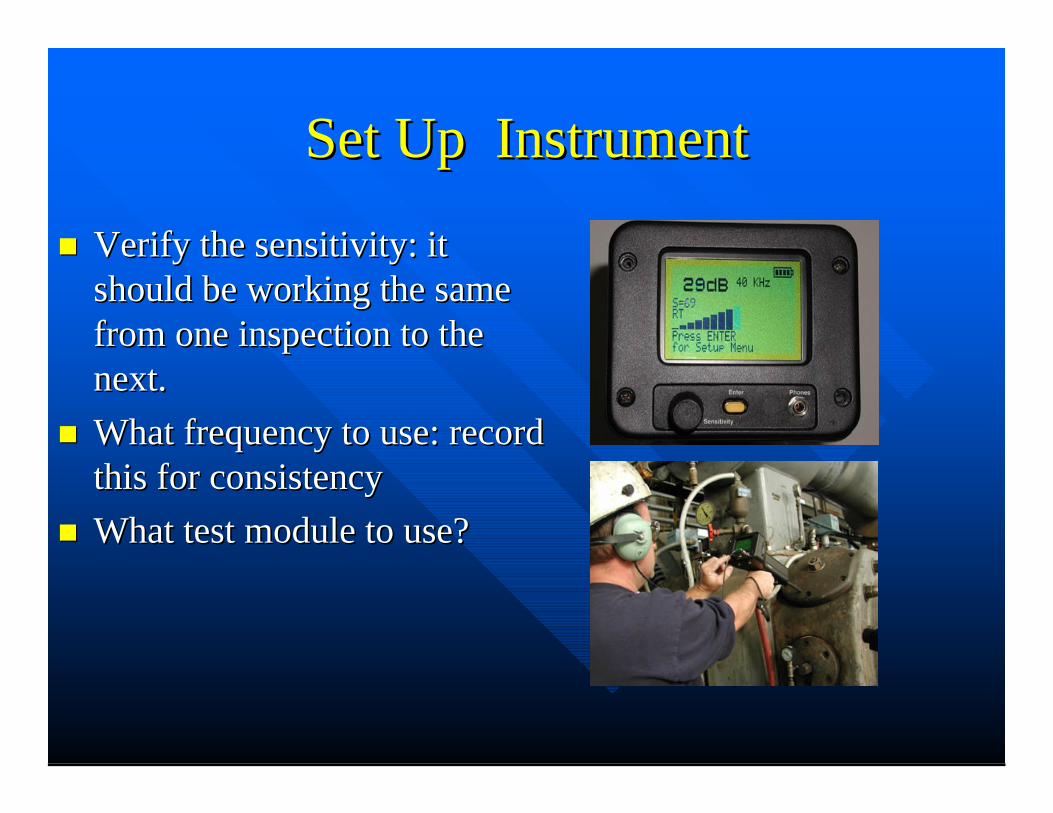
Verify the sensitivity: it Verify the sensitivity: it should be working the same should be working the same from one inspection to the from one inspection to the next.next.What frequency to use: record What frequency to use: record this for consistencythis for consistencyWhat test module to use?What test module to use?
Gather Relevant DataGather Relevant Data
Date and TimeDate and TimeCompressor DataCompressor DataOperating PressuresOperating PressuresHours OperationHours OperationAny Special or Hazardous ConditionsAny Special or Hazardous Conditions
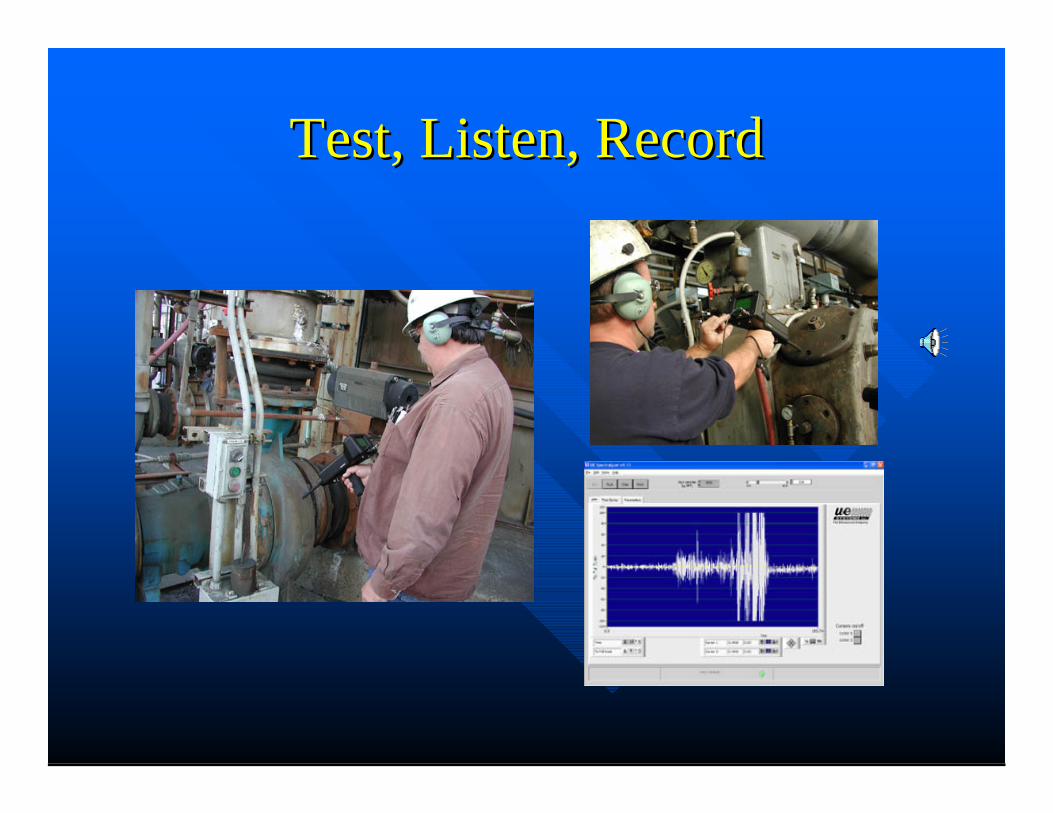
Test, Listen, RecordTest, Listen, Record
Data LogData Log
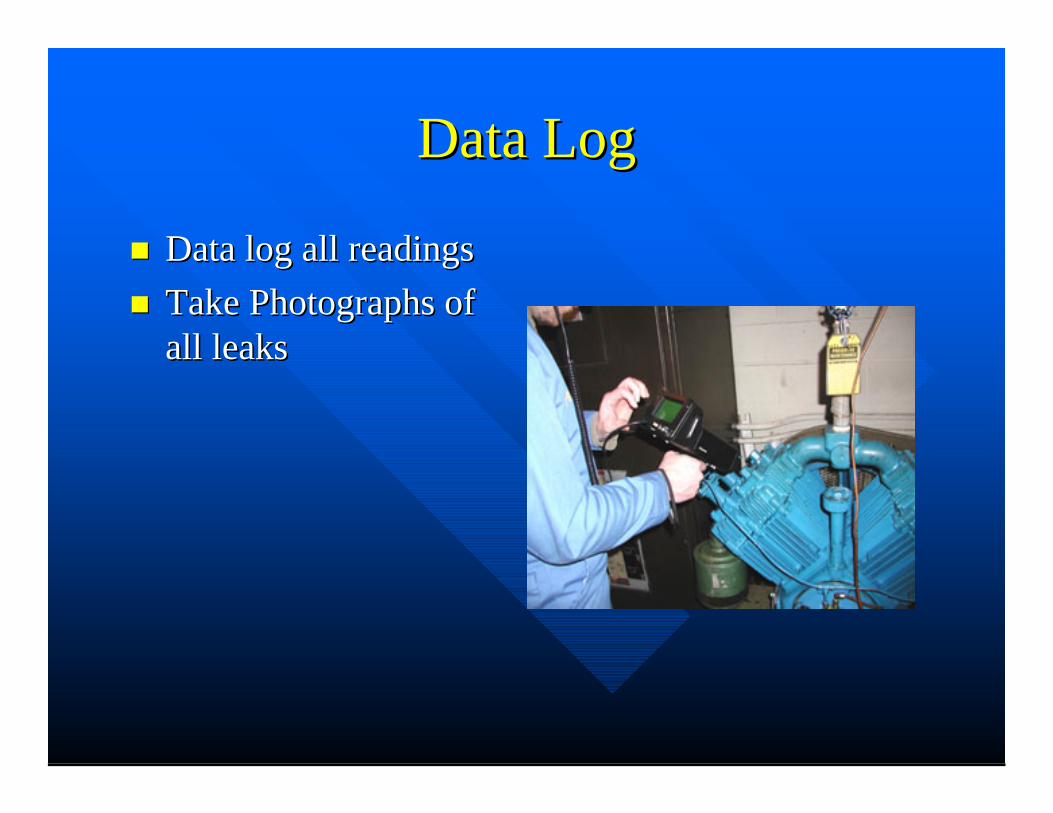
Data log all readingsData log all readingsTake Photographs of Take Photographs of all leaksall leaks
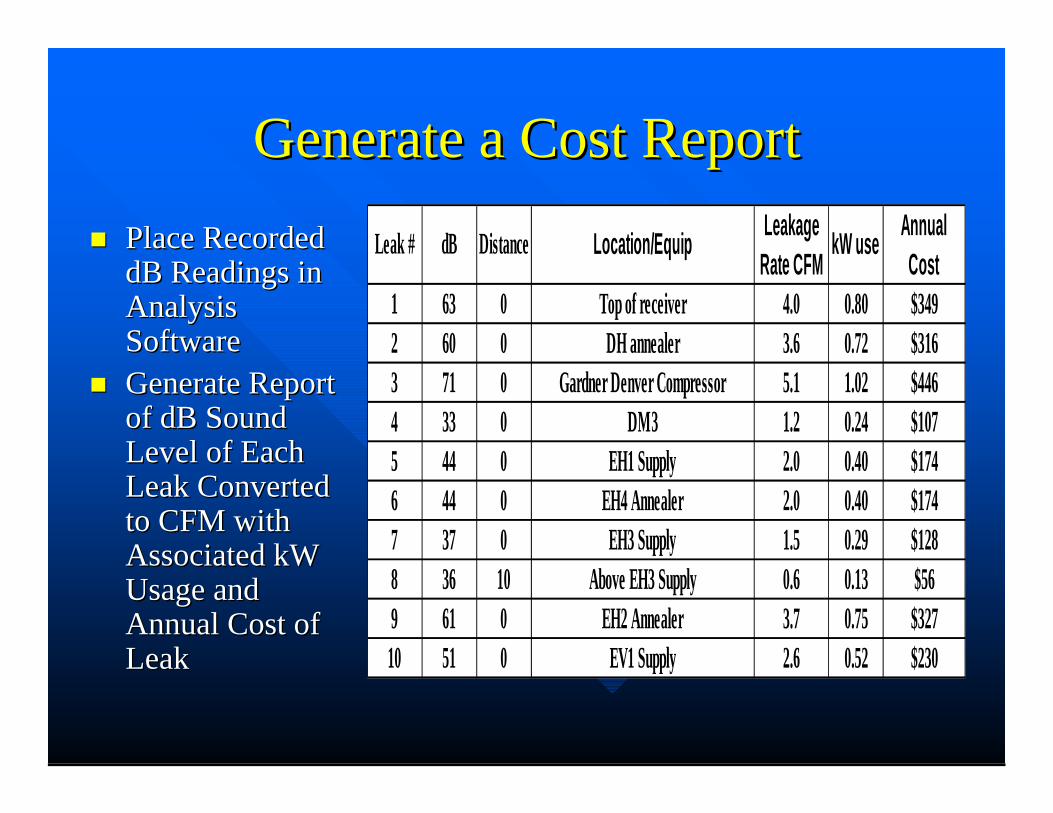
Generate a Cost ReportGenerate a Cost ReportPlace Recorded Place Recorded dB Readings in dB Readings in Analysis Analysis SoftwareSoftwareGenerate Report Generate Report of dB Sound of dB Sound Level of Each Level of Each Leak Converted Leak Converted to CFM with to CFM with Associated kW Associated kW Usage and Usage and Annual Cost of Annual Cost of LeakLeak
Leak # dB Distance Location/Equip Leakage Rate CFM kW use Annual
Cost1 63 0 Top of receiver 4.0 0.80 $3492 60 0 DH annealer 3.6 0.72 $3163 71 0 Gardner Denver Compressor 5.1 1.02 $4464 33 0 DM3 1.2 0.24 $1075 44 0 EH1 Supply 2.0 0.40 $1746 44 0 EH4 Annealer 2.0 0.40 $1747 37 0 EH3 Supply 1.5 0.29 $1288 36 10 Above EH3 Supply 0.6 0.13 $569 61 0 EH2 Annealer 3.7 0.75 $327
10 51 0 EV1 Supply 2.6 0.52 $230
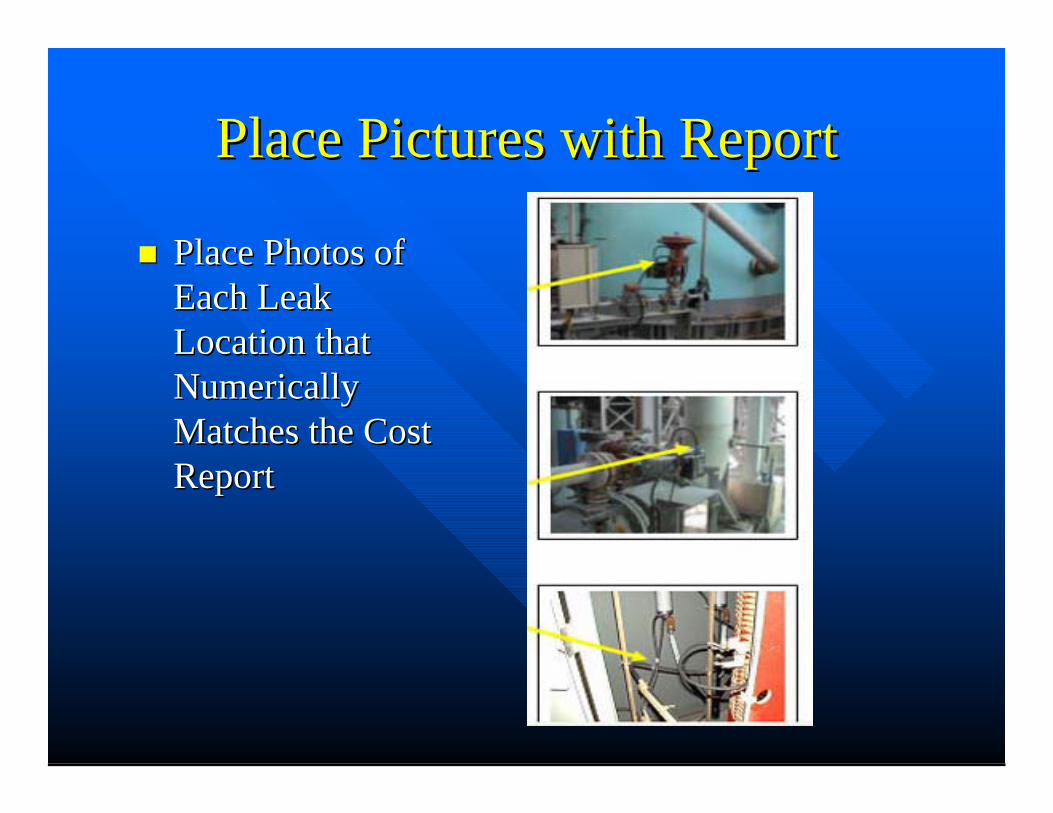
Place Pictures with ReportPlace Pictures with Report
Place Photos of Place Photos of Each Leak Each Leak Location that Location that Numerically Numerically Matches the Cost Matches the Cost ReportReport
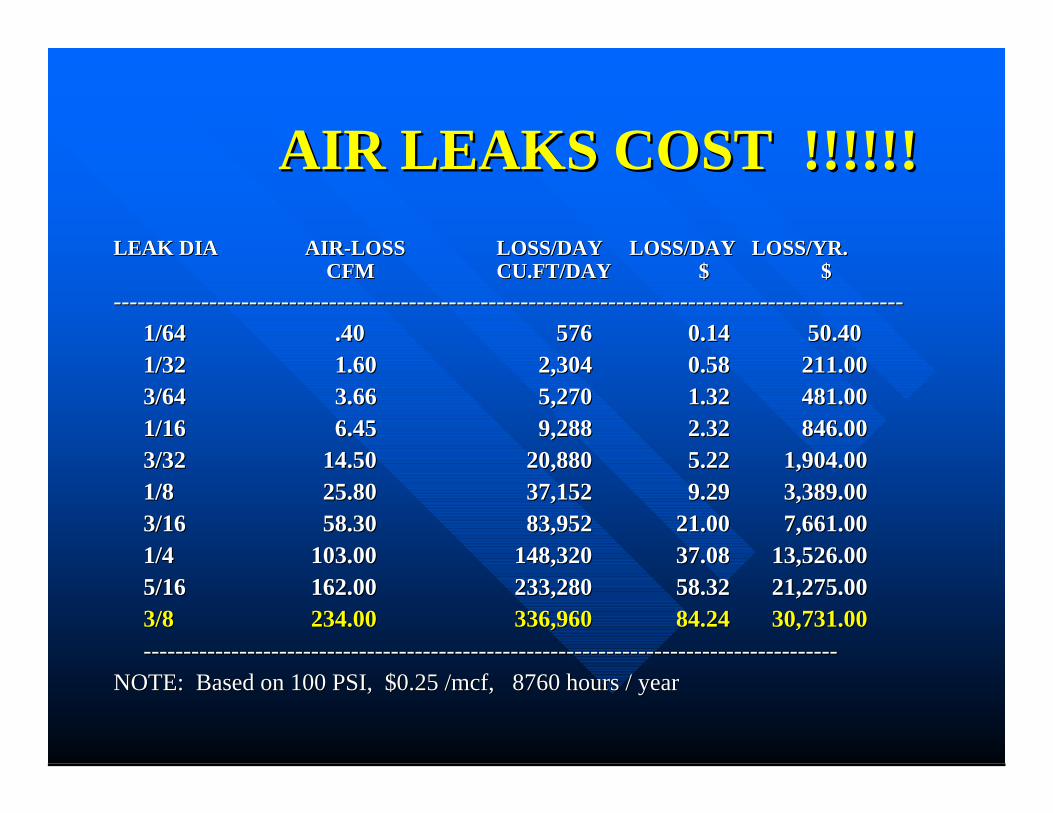
AIR LEAKS COST !!!!!!AIR LEAKS COST !!!!!!LEAK DIALEAK DIA AIRAIR--LOSSLOSS LOSS/DAY LOSS/DAY LOSS/YR.LOSS/DAY LOSS/DAY LOSS/YR.
CFMCFM CU.FT/DAYCU.FT/DAY $$ $$------------------------------------------------------------------------------------------------------------------------------------------------------------------------------------------------------
1/641/64 .40.40 576576 0.140.14 50.4050.401/321/32 1.601.60 2,3042,304 0.580.58 211.00211.003/643/64 3.663.66 5,2705,270 1.321.32 481.00481.001/161/16 6.456.45 9,2889,288 2.322.32 846.00846.003/323/32 14.5014.50 20,88020,880 5.225.22 1,904.001,904.001/81/8 25.8025.80 37,15237,152 9.299.29 3,389.003,389.003/163/16 58.3058.30 83,952 21.0083,952 21.00 7,661.007,661.001/41/4 103.00103.00 148,320 37.08 148,320 37.08 13,526.0013,526.005/165/16 162.00162.00 233,280 58.32 21,275.00233,280 58.32 21,275.003/83/8 234.00234.00 336,960 84.24 30,731.00336,960 84.24 30,731.00------------------------------------------------------------------------------------------------------------------------------------------------------------------------------
NOTE: Based on 100 PSI, $0.25 /NOTE: Based on 100 PSI, $0.25 /mcfmcf, 8760 hours / year , 8760 hours / year
Questions on Leak Detection?Questions on Leak Detection?
Other Uses for Ultrasonic Other Uses for Ultrasonic InspectionInspection
ElectricalElectrical–– CoronaCorona–– Tracking Tracking –– ArcingArcing
Detecting InterferenceDetecting InterferenceLubricationLubricationMotor TestingMotor TestingComplements InfraredComplements Infrared
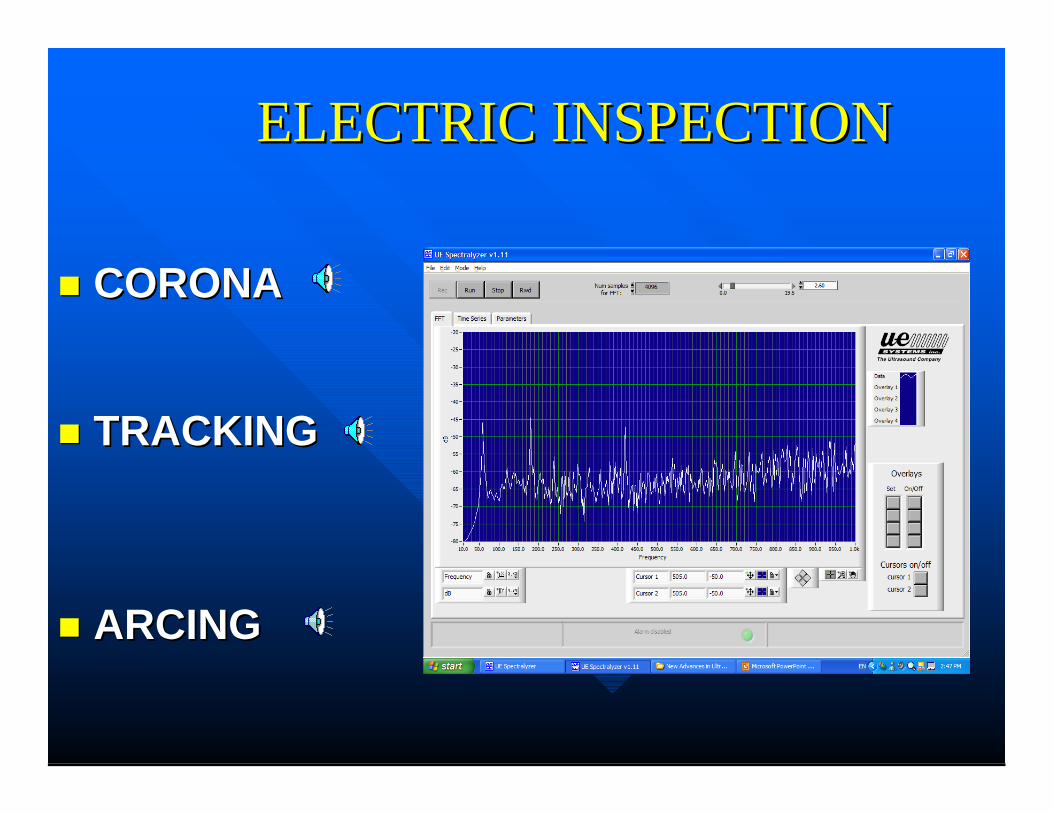
ELECTRIC INSPECTIONELECTRIC INSPECTION
CORONACORONA
TRACKINGTRACKING
ARCINGARCING
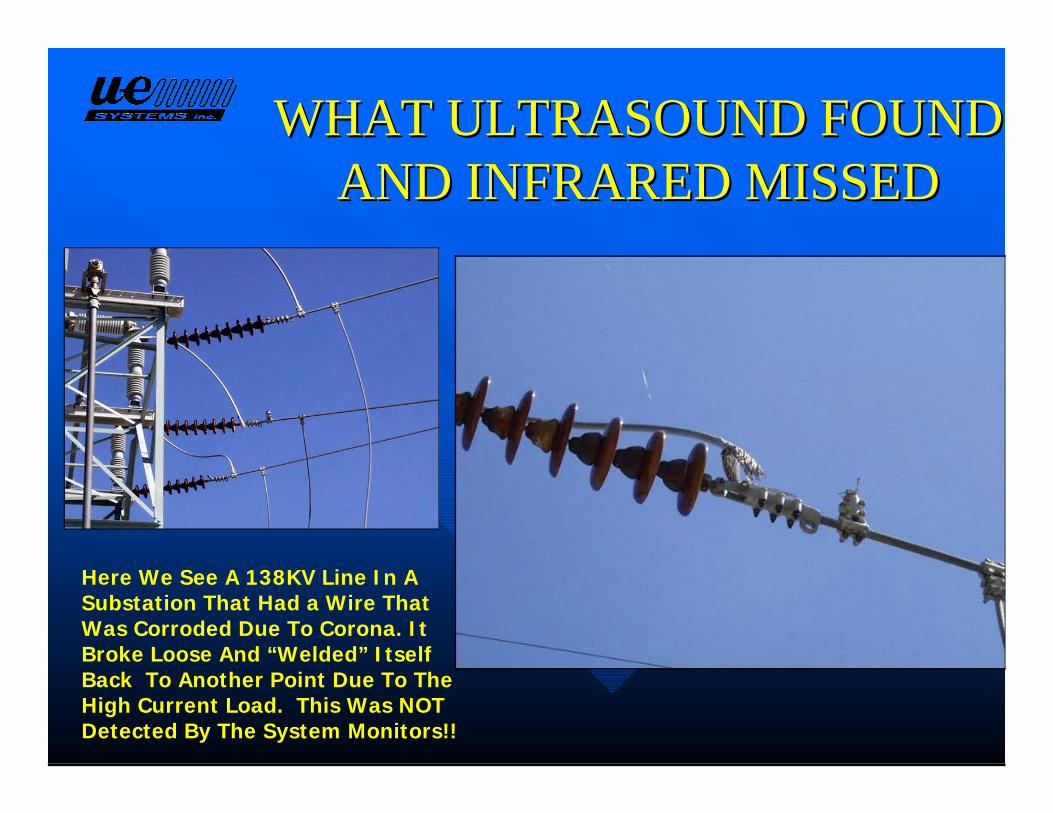
WHAT ULTRASOUND FOUND WHAT ULTRASOUND FOUND AND INFRARED MISSEDAND INFRARED MISSED
Here We See A 138KV Line In A Substation That Had a Wire That Was Corroded Due To Corona. It Broke Loose And “Welded” Itself Back To Another Point Due To The High Current Load. This Was NOT Detected By The System Monitors!!
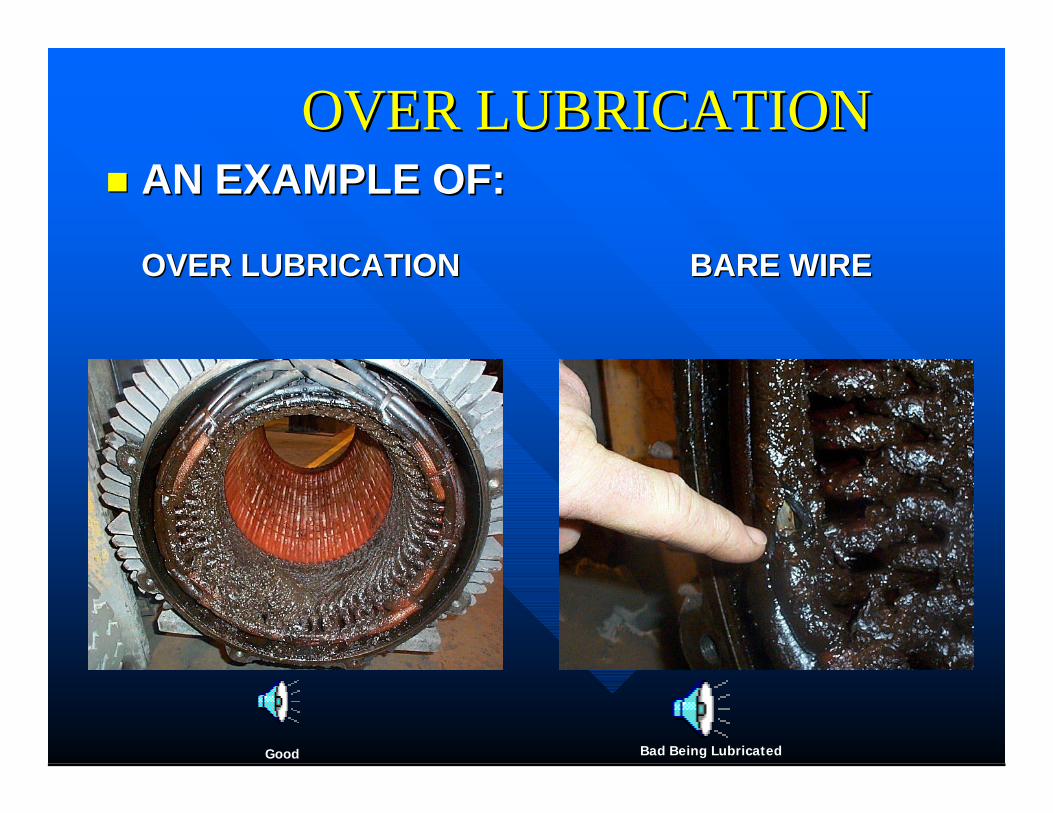
OVER LUBRICATIONOVER LUBRICATIONAN EXAMPLE OF:AN EXAMPLE OF:
OVER LUBRICATION BARE WIREOVER LUBRICATION BARE WIRE
Good Bad Being Lubricated
ConclusionConclusionULTRASOUND:ULTRASOUND:–– VersatileVersatile–– Simple to use Simple to use –– Provides definitive data of air leaksProvides definitive data of air leaks–– Supports other technologiesSupports other technologies
QUESTIONS??? THANK YOUQUESTIONS??? THANK YOU


![Pressure switches and Thermostats, type KP€¦ · Type Range [psig] Differential [psi] Reset Pressure connection Max. operat-ing pressure [psig] Min. burst pressure [psig] Code nos](https://img.dokumen.tips/doc/110x75/5e286d5dcd347d7fa07fa52f/pressure-switches-and-thermostats-type-kp-type-range-psig-differential-psi.jpg)