Embed Size (px)
Citation preview

Buenos Aires – 5 to 9 September, 2016 Acoustics for the 21st Century…
PROCEEDINGS of the 22nd International Congress on Acoustics
Ultrasound: Paper ICA2016-296
Ultrasonic fatigue test and Comsol finite element modelling
Juan Carricondo(a), (b), Martín Iofrida(a), (b), Guido Ferrari(c), Martín Gómez(b), (c) (a) UNTREF, Caseros, Argentina. (b) CNEA, San Martín, Argentina.
(c) UTN-Regional Delta, Campana, Argentina. [email protected]
Abstract
This work on ultrasonic fatigue in carbon steels is framed in the Plan Argentina Innovadora 2020 national science policy. Theoretical foundations of ultrasonic fatigue test were studied, linking the operation principles of a commercial equipment and using the finite element modelling as a comparison method. A carbon steel alloy was tested, defining an appropriate geometry for the test sample based on the ultrasonic equipment requirements and turning process. An offset high voltage divider was designed and fabricated to characterize the equipment used, allowing to measure the signal at the output of the power amplification stage. In turn, finite element modelling of the transducer and the fatigue specimen were performed by Comsol 5.0 software. The resonance frequency for the system (transducer and fatigue specimen) was calculated obtaining a value of 19592 Hz, close to the 19633 Hz measured with the high voltage divider. Two carbon steel ultrasonic fatigue specimens of the same geometry were tested. The first trial lasted approximately two hours, interrupted when leaving resonance condition as indicated by an equipment built-in led. Non-destructive testing of dye penetrant was performed to locate the crack. However, it was determined that the first specimen did not present any crack. Therefore, a second ultrasonic fatigue test of about eight hours with a new specimen was performed. After the test, the second specimen was fractured when applying a slightly force. Finally, crack was located by SEM microscopy determining an internal crack nucleation at specimen notch, in agreement with studies on the subject.
Keywords: ultrasonic fatigue, finite elements, Comsol, carbon steel, dye penetrant.

22nd International Congress on Acoustics, ICA 2016 Buenos Aires – 5 to 9 September, 2016
Acoustics for the 21st Century…
2
Ultrasonic fatigue test and Comsol finite element modelling
1 Introduction In many applications metal components under cyclic or repetitive mechanical stress fail
under lower values than those for static tests. This process is called fatigue failure, originated at a point of stress concentration such as a sharp end, a notch or an inclusion. Once nucleated, the crack propagates through the component due to cyclic stresses until it fractures. It has been estimated that fatigue contributes to about 90% of mechanical failures in service [1].
Fatigue data is plotted as S-N curves (Stress-Number of cycles), in which stress S applied to a test specimen is presented against number of cycles N until failure. In this graphs, fatigue life represents the number of cycles required for a material to failure at a specified stress, while the fatigue resistance or fatigue resistance limit represents the stress below which a fault will not occur.
Currently many mechanical components require higher service lives, overcoming 10! cycles. For example, in components of internal combustion engines for vehicle use (10! cycles) and aeronautical turbine blades or power generation (10!" cycles), among others [2]. However, the time required to perform a high cycle measurement with a conventional fatigue equipment makes it necessary to develop a more efficient method. A 10!" cycles measurement with a conventional hydraulic machine operating at 20 Hz would require 17 years, while using an ultrasonic fatigue machine operating at 20 kHz would take less than a week [3].
1.1 Ultrasonic fatigue test Ultrasonic fatigue test is based on the propagation of a longitudinal wave along a specimen
of a given material, producing an effect of cyclical stress-compression on the element tested. After a certain time, different for each type of material, a crack would nucleate in the centre of the specimen, spreading until it produces fatigue failure [4].
The longitudinal mechanical wave is produced by an electromechanical transducer filled with a sinusoidal electrical signal, generated at an electronic stage of the equipment. Electrical signal is generated, amplified and finally sent to the ultrasonic transducer, consisting of piezoelectric rings, to convert electrical voltage and current into longitudinal mechanical displacement. Fig. 1. 1 presents an ultrasonic transducer and the amplification of the mechanical wave generated.

22nd International Congress on Acoustics, ICA 2016 Buenos Aires – 5 to 9 September, 2016
Acoustics for the 21st Century…
3
Figure 1. 1: Ultrasonic transducer [5].
The principle of operation for ultrasonic fatigue test is to work at the resonant frequency of
the entire system, consisting of the transducer and the fatigue specimen tested. Thus maximizing displacement in resonance reduces the electrical power supplied.
The specimen geometry is fundamental to obtain stress and strain amplitude values required for ultrasonic fatigue test. Amplification of stress and strain in the centre of the specimen is obtained performing a notch, reducing the electrical power necessary to achieve the desired amplitude. In addition, the length of the specimen must be calculated so as to allow the formation of a standing wave with a maximum longitudinal stress-strain on the notch, and maximum displacement at the ends [6, 7].
2 Materials and Methods
Two carbon steel specimens were tested by the method of ultrasonic fatigue, studying the process of high cycle fatigue and the operation of the equipment used. Ultrasonic fatigue tests were performed with a commercial equipment of VJO Instruments. In addition, a high voltage divider was designed and assembled for measuring the electrical signal sent to the piezoelectric transducer. The proper determination of the geometry of the specimen was defined based on specimens tested in previous works and finite element modelling by Comsol 5.0 software [8].
2.1 Ultrasonic fatigue equipment The equipment used consists of two main units: electrical amplification and transduction.
The electrical amplification unit is responsible for generating a sinusoidal electric signal of 20 kHz using a Voltage Controlled Oscillator (VCO). In turn, it has a frequency range control allowing precise adjustment of the working frequency. Then the signal is amplified until values

22nd International Congress on Acoustics, ICA 2016 Buenos Aires – 5 to 9 September, 2016
Acoustics for the 21st Century…
4
of 80 V and 1.5 A. Finally, the voltage is raised by a transformer to achieve approximately 1.2 kV and 100 mA, appropriate values to supply the transducer.
Transduction unit is responsible for transforming energy from the electrical amplification unit in longitudinal mechanical waves of 20 kHz. It consists of two piezoelectric rings in Langevin configuration, attached to a mechanical amplifier by a pre-stressed bolt. Fig. 2. 1 presents the ultrasonic fatigue equipment, with the electrical amplification unit and the transducer.
Figure 2. 1: Ultrasonic fatigue equipment.
2.2 Specimen geometry
In the present work the alloy tested was a steel with high carbon content (carbon steel), similar to a SAE 1045. An X-ray fluorescence (XRF) analysis determined the minority components present in the alloy: 0.25% silicon (Si) and 0.56% manganese (Mn) [9].
Fatigue specimens are cylindrical pieces of steel, machined to achieve a progressive reduction of its section in the central part, called notch. This turning process allows the area of maximum stress-strain mechanical to be located at the centre. A gradual decrease in the section of the specimen prevents unwanted stress concentration points, as in samples with abrupt changes of section. Fig. 2. 2 present a finite element modelling of a profile with a notched profile for a SAE 1045 steel, by Comsol 5.0 software.

22nd International Congress on Acoustics, ICA 2016 Buenos Aires – 5 to 9 September, 2016
Acoustics for the 21st Century…
5
(a) (b)
Figure 2. 2: Ultrasonic fatigue specimens profiles, (a)
An eigenfrequency test was simulated, observing mechanical stress distribution in [N/m2] along the specimen. A single displacement direction along the Y axis was set, limiting the analysis to longitudinal modes according to the ultrasonic fatigue test. Resonance frequency analysis does not require an initial force or displacement value, so the colours represent a relative scale between areas with high and low mechanical stress.
The first profile presents a relatively low value of mechanical stress at the notch, raised on the abrupt changing section, which is not appropriate for a fatigue test. The second profile serves as a gradual mechanical amplifier, obtaining a maximum mechanical stress at the centre of the notch as was intended. Note that in both cases the final section of the notch is equivalent.
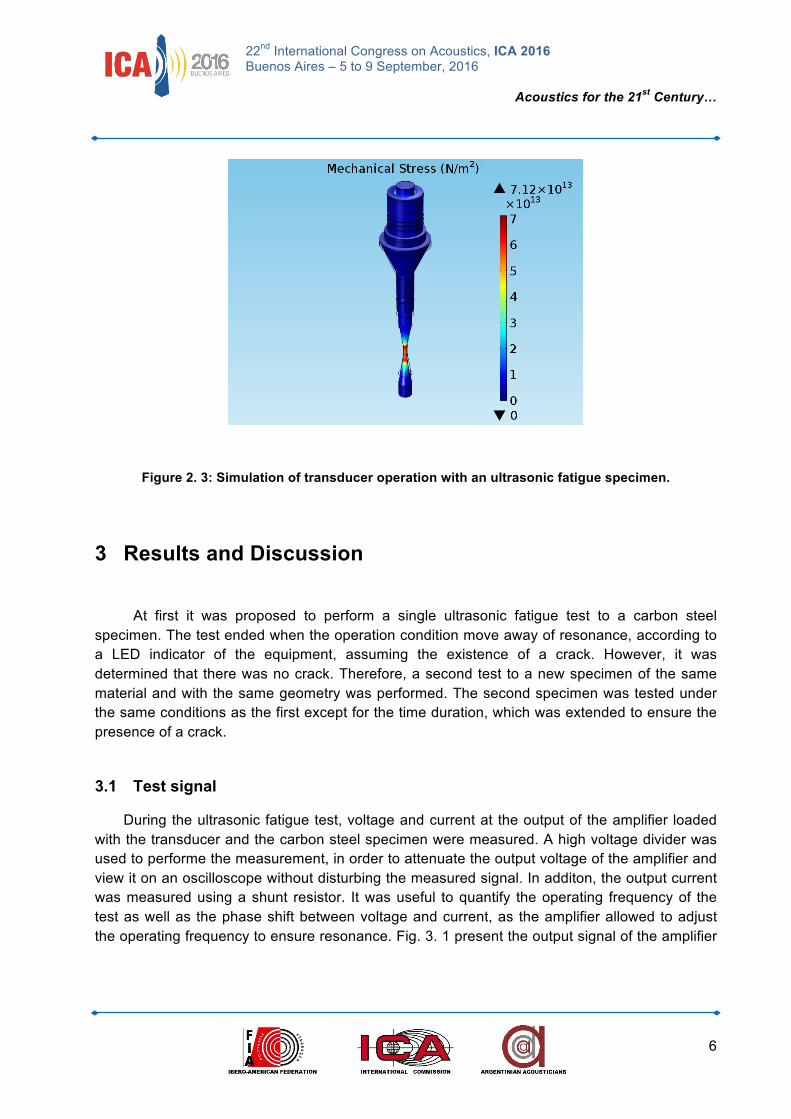
In addition, analysing fatigue specimens resonance frequencies resulted more appropriate to evaluate them together with the transducer, since it is considered the resonance of the whole system during the test. Therefore, all the component parts of the transducer and a 1045 steel fatigue were simulated. An eigenfrequency test of the whole system was performed, analysing the distribution of mechanical stress to define the fatigue specimen dimensions. Fig. 2. 3 present a finite element modelling of the transducer with the specimen, simulating the condition of an ultrasonic fatigue test.
22nd International Congress on Acoustics, ICA 2016 Buenos Aires – 5 to 9 September, 2016
Acoustics for the 21st Century…
6
Figure 2. 3: Simulation of transducer operation with an ultrasonic fatigue specimen.
3 Results and Discussion
At first it was proposed to perform a single ultrasonic fatigue test to a carbon steel specimen. The test ended when the operation condition move away of resonance, according to a LED indicator of the equipment, assuming the existence of a crack. However, it was determined that there was no crack. Therefore, a second test to a new specimen of the same material and with the same geometry was performed. The second specimen was tested under the same conditions as the first except for the time duration, which was extended to ensure the presence of a crack.
3.1 Test signal
During the ultrasonic fatigue test, voltage and current at the output of the amplifier loaded with the transducer and the carbon steel specimen were measured. A high voltage divider was used to performe the measurement, in order to attenuate the output voltage of the amplifier and view it on an oscilloscope without disturbing the measured signal. In additon, the output current was measured using a shunt resistor. It was useful to quantify the operating frequency of the test as well as the phase shift between voltage and current, as the amplifier allowed to adjust the operating frequency to ensure resonance. Fig. 3. 1 present the output signal of the amplifier

22nd International Congress on Acoustics, ICA 2016 Buenos Aires – 5 to 9 September, 2016
Acoustics for the 21st Century…
7
loaded with the transducer and the fatigue specimen, representative of the ultrasonic fatigue resonance condition.
Figure 3. 1: Frequency response of the ultrasonic fatigue signal.
At the frequency spectrum it can be observed the presence of both fundamental and second harmonic. However, the fundamental level is more than 20 dB above the second harmonic, so it is not taken into account the harmonic contribution for the ultrasonic fatigue analysis.
3.2 Ultrasonic fatigue tests
Two ultrasonic fatigue tests were performed for specimens with the same geometry, ending by interrupting the operation of the equipment because it had moved away from the resonance condition. A cooling system used to maintain the temperature at the notch area ensured less than 200 ° C during the tests. Table 3. 1 presents the two ultrasonic fatigue tests operation conditions.
Table 3. 1: Ultrasonic fatigue tests operation conditions.
Ultrasonic Fatigue Test
Time [hs] Time [s] Accumulated cycles
Magnitude order
First 2:02:09:36 7329,36 146587200 10!
Second 8:03:27:15 29007,15 580143000 5 x 10!

22nd International Congress on Acoustics, ICA 2016 Buenos Aires – 5 to 9 September, 2016
Acoustics for the 21st Century…
8
3.3 Crack detection
Cracks in ultrasonic fatigue tests nucleates at the notch section of the specimen, generally originated on the surface due to imperfections or defects. Indirect crack detection was made with a LED indicator of the equipment, ending the fatigue tests when the system had left the resonance condition. However, in both cases cracks could not be seen at naked eye, requiring other inspection techniques as microscopy or non-destructive testing (NDT).
Optical microscopy did not result an appropriate technique due to the surface termination of the specimens. In turn, the first fatigue sample was inspected by dye penetrant NDT for accurate detection of the crack. However, dye penetrant revealed that there was no crack in the first specimen.
After the second ultrasonic fatigue test, the new specimen was slightly forced and a brittle fracture occurred (without plastic deformation). Fig. 3. 2(a) present an image obtained from the dye penetrant test of the first fatigue specimen, where no fluorescent material is detected by applying the contrast, indicating the absence of a crack. Fig. 3.2 (b) present the second fatigue specimen after the test, observing the brittle fracture at the notch.
(a) (b)
Figure 3. 2: (a) Dye penetrant test of the first fatigue specimen; (b) brittle fracture of the second fatigue specimen.

22nd International Congress on Acoustics, ICA 2016 Buenos Aires – 5 to 9 September, 2016
Acoustics for the 21st Century…
9
Finally, for second fatigue sample a SEM (Scanning Electron Microscope) microscopy was performed at the inner area of the notch. The crack was detected and it was determined that nucleation ocurred inside the specimen. Fig. 3. 3(a) present a SEM micrograph of the area with the internal crack, located at the left core. Fig. 3. 3(b) present an internal crack nucleated from an ultrasonic fatigue test performed by Marines-García et al., for a similar alloy (SAE 8620).
(a) (b)
Figure 3. 3: SEM micrograph of an inner nucleated crack, (a) obtained from the second fatigue specimen tested; (b) obtained from Marines-García for a SAE 8620 [10].
4 Conclusions
Two ultrasonic fatigue tests on carbon steel specimens were performed, measuring the equipment used and simulating its operation.
1. Ultrasonic fatigue tests: the first fatigue specimen did not present a crack, ensured by dye penetrant non-destructive testing. In the second test, about eight hours, a crack nucleated at the specimen, completing an ultrasonic fatigue test.
2. Finite element modelling: fatigue specimens and transducer were simulated, considering ultrasonic fatigue test operation conditions. Different specimen profiles were compared, defining an appropriate geometry. Resonance frequency operation of the transducer with the fatigue specimen was simulated, presenting a concentration of mechanical stress at

22nd International Congress on Acoustics, ICA 2016 Buenos Aires – 5 to 9 September, 2016
Acoustics for the 21st Century…
10
the centre of the specimen. The resonance frequency obtained for simulating operation was 19592 Hz, close to the 19633 Hz, measured with a high voltage divider.
3. Crack detection: a LED indicator of the ultrasonic fatigue equipment was used to indirectly determine the presence of a crack at the fatigue specimen under test. Then, dye penetrant non-destructive testing (NDT) was performed to visualize and locate the crack. No crack was observed for the first fatigue specimen by dye penetrant. However, the second specimen presented a crack generated by the ultrasonic fatigue test, observed by SEM and nucleated inside the notch, which made possible to fracture it with a slightly force.
Acknowledgments To Universidad Nacional de Tres de Febrero (UNTREF), UTN-Regional Delta (Laboratorio de Emisión Acústica) and Comisión Nacional de Energía Atómica (CNEA), Centro Atómico Constituyentes.
References [1] ASM International, Elements of Metallurgy and Engineering Alloys, Chapter 14: Fatigue, Materials Park, USA. [2] Cavalieri, F., Luengo, C. y Cardona, A., Análisis de fatiga en muy alto número de ciclos, Revista Iberoamericana de Ingeniería Mecánica, 15 (1), 03-12 (2011).
[3] Stanzl-Tschegg, S., Very high cycle fatigue measuring techniques, International Journal of Fatigue, Elsevier, 60, 2-17, (2014). [4] Stanzl-Tschegg, S., Ultrasonic fatigue, Encyclopedia of materials: science and technology, 9444-50 (2001). [5] Hassan Dakhil, Al-Budairi, Design and analysis of ultrasonic horns operating in longitudinal and torsional vibration, University of Glasgow, PhD Thesis (2012). [6] Green, C. H., Stress amplitude analysis in a generalized ultrasonic fatigue dumbbell specimen, J. Phys. D: Appl. Phys., 24, 469 (1991). [7] Green, C. H. y Guiu, F., The ultrasonic fatigue testing of specimens much shorter than the testing frequency half- wavelength of the material, J. Phys. D: Appl. Phys., 9, 1071 (1976). [8] Gómez, M., García, C., Vallejos, E. y Ruzzante, J., Desarrollo y primeros resultados obtenidos con un equipo de fatiga ultrasónica, Congreso SAM/CONAMET (2009). [9] Custo, G. y Cerchietti, L., Informe de Resultados, Laboratorio de Fluorescencia de Rayos X, Centro Atómico Constituyentes, Comisión Nacional de Energía Atómica. [10] Marines-García, et al., Fatigue crack growth from small to long cracks in very-high-cycle fatigue with surface and internal “fish-eye” failures for ferrite-perlitic low carbon steel SAE 8620, Materials Science and Engineering, Elsevier, 120-128 (2007).