Embed Size (px)
Citation preview
1
_____________________________________________________________________CREDIT Research Paper
No. 98/12_____________________________________________________________________
UGANDAN TRADE POLICY AND EXPORT PERFORMANCE IN THE
1990s
by
Oliver Morrissey and Nicodemus Rudaheranwa
DFID-TERP: CREDIT DISCUSSION PAPER 6 (CDP006)This is Discussion Paper No. 6 in the CREDIT Project on ‘Infrastructural and InstitutionalConstraints to Export Promotion’, as part of the DFID Trade and Enterprise ResearchProgramme (TERP). The TERP involves research projects by teams in CREDIT, CREEM(SMF, Nottingham), CSAE (Oxford) and IDS.
_____________________________________________________________________Centre for Research in Economic Development and International Trade,University of Nottingham
2
The Centre for Research in Economic Development and International Trade is based in theSchool of Economics at the University of Nottingham. It aims to promote research in all aspectsof economic development and international trade on both a long term and a short term basis. Tothis end, CREDIT organises seminar series on Development Economics, acts as a point forcollaborative research with other UK and overseas institutions and publishes research papers ontopics central to its interests. A list of CREDIT Research Papers is given on the final page of thispublication.
Authors who wish to submit a paper for publication should send their manuscript to the Editor ofthe CREDIT Research Papers, Professor M F Bleaney, at:
Centre for Research in Economic Development and International Trade,School of Economics,University of Nottingham,University Park,Nottingham, NG7 2RD,UNITED KINGDOM
Telephone (0115) 951 5620Fax: (0115) 951 4159
CREDIT Research Papers are distributed free of charge to members of the Centre. Enquiriesconcerning copies of individual Research Papers or CREDIT membership should be addressedto the CREDIT Secretary at the above address. Papers may also be downloaded from the Schoolof Economics web site at: www.nottingham.ac.uk/economics/research/credit
3
_____________________________________________________________________CREDIT Research Paper
No. 98/12
UGANDAN TRADE POLICY AND EXPORT PERFORMANCE IN THE
1990s
by
Oliver Morrissey and Nicodemus Rudaheranwa
_____________________________________________________________________
Centre for Research in Economic Development and International Trade, University of Nottingham
4
The AuthorsOliver Morrissey is Director of CREDIT and Senior Lecturer in the School of Economics,
University of Nottingham. Nicodemus Rudaheranwa is a Research Student in the School of
Economics, University of Nottingham..
AcknowledgementsThis is Discussion Paper CDP006 in the CREDIT Project on ‘Infrastructural andInstitutional Constraints to Export Promotion’, as part of the DFID Trade and EnterpriseResearch Programme (Research Grant CNTR 96 0494A). Nicodemus Rudaheranwa isgrateful to DFID for funding his position as a Research Student on this project.
____________________________________________________________NB: Full tables are in the Appendix at the back of the paper. Table numbers in the
Appendix may not correspond to referred table numbers in the text.
5
UGANDAN TRADE POLICY AND EXPORT PERFORMANCE IN THE
1990s
by
Oliver Morrissey and Nicodemus Rudaheranwa
Abstract
The Ugandan economy has been transformed since 1987. We ask how effective have the reforms
been in increasing the incentives to exporters. Uganda has made significant progress in reducing
the anti-export bias in its trade policy. Taxes on exports have been abolished, the foreign
exchange market is liberalised and exporters are allowed to retain their export earnings. Import
protection has also been reduced considerably. However, while the relative incentives to
exporting have improved, export earnings have not. The real problem facing Uganda is the
severe lack of export diversification and the fact that it is a price taker on world markets. Uganda
can take measures to encourage export diversification, both in terms of quality and niche
markets for traditional commodities and in terms of encouraging non-traditional exports. Trade
policy reforms are only part of such a strategy. Improved infrastructure and institutional support
are an important component of export support, to reduce the adverse effects of natural barriers.
We conclude that the principal trade policy reforms have been implemented, and the policy
environment is right now for export support, through investment in infrastructure and
institutional support.
Outline
1. Introduction
2. Trade Policy Since 1987
3. Composition of Trade and Export Performance
4. Export Promotion
5. Conclusions
6
1 INTRODUCTION
The Ugandan economy has been transformed over the past decade. Since 1987 there has
been dramatic progress in ‘market-oriented’ policy reforms, especially liberalising the
foreign exchange market and attaining macroeconomic stabilisation, notably tight fiscal
and monetary policies which help maintain low inflation. The macroeconomic stability
of recent years has contributed to business confidence and a favourable trade
environment. Initiatives to revive the private sector by encouraging both domestic and
foreign investors have also been undertaken through provision of various incentives to
investors, in particular the enactment of the Investment Code in 1991, and provision of
fiscal incentives. The return of confiscated properties to Asians in the early 1990s, under
the Custodian Board, was important in encouraging investors to have confidence that
property rights would be secure.
While the success of these reforms can be evaluated against various criteria, we confine
attention to one. How effective have the reforms been in increasing the incentives to
exporters, and has Uganda witnessed an improved export performance? A survey
conducted by the Export Policy Analysis Unit (EPAU, 1995b) reveals that exporters and
investors in Uganda appreciate the extent of macroeconomic policy reforms but regard
institutional and infrastructural support as being inadequate. Exporters identify a number
of problems that increase trade costs: paperwork and slow clearing procedures for
exporting, the high cost and lack of credit, and high freight charges. These high
transaction costs make exporters less competitive in export markets. Exporters also
perceive tariff reforms and incentives provided by the government to reduce anti-export
bias as being inadequate. It appears that although much has been achieved, more needs
to be done.
This paper reviews Ugandan trade policy reforms since 1987, concentrating on the effect
on incentives to exporters. Section 2 considers the principal trade liberalisation reforms
that have been implemented, while Section 3 examines trends in external trade, paying
particular attention to trends in the level and composition of exports. Section 4 looks at
explicit export promotion measures and reviews evidence on how exporters perceive the
trade environment. Our conclusions are offered in Section 5. First, we briefly consider
the principal macroeconomic trends.
7
Macroeconomic Performance in Uganda
Uganda is a landlocked country dominated by agriculture and associated activities. In
1990, agriculture accounted for more than 50 per cent of GDP, was the mainstay of the
majority of Ugandans in terms of food, employed over 80 per cent of the labour force
and generated more than 90 per cent of export earnings (World Bank, 1991). By 1997,
agriculture accounted directly for 42 per cent of GDP (half of this was estimated non-
monetary GDP) and about 75 per cent of export earnings (Background to the Budget
1998/99). Historically the contribution of manufacturing to the economy has been
marginal, but it has grown recently, from just over five per cent in the late 1980s to
almost 10 per cent by 1997 (Background to the Budget 1998/99). Agriculture is a major
source of inputs into manufacturing, mainly processing of agricultural produce. Policies
directed to develop the agriculture sector, given its importance and linkages with other
sectors in the economy especially in income generation, can make a major contribution
to economic growth in Uganda.
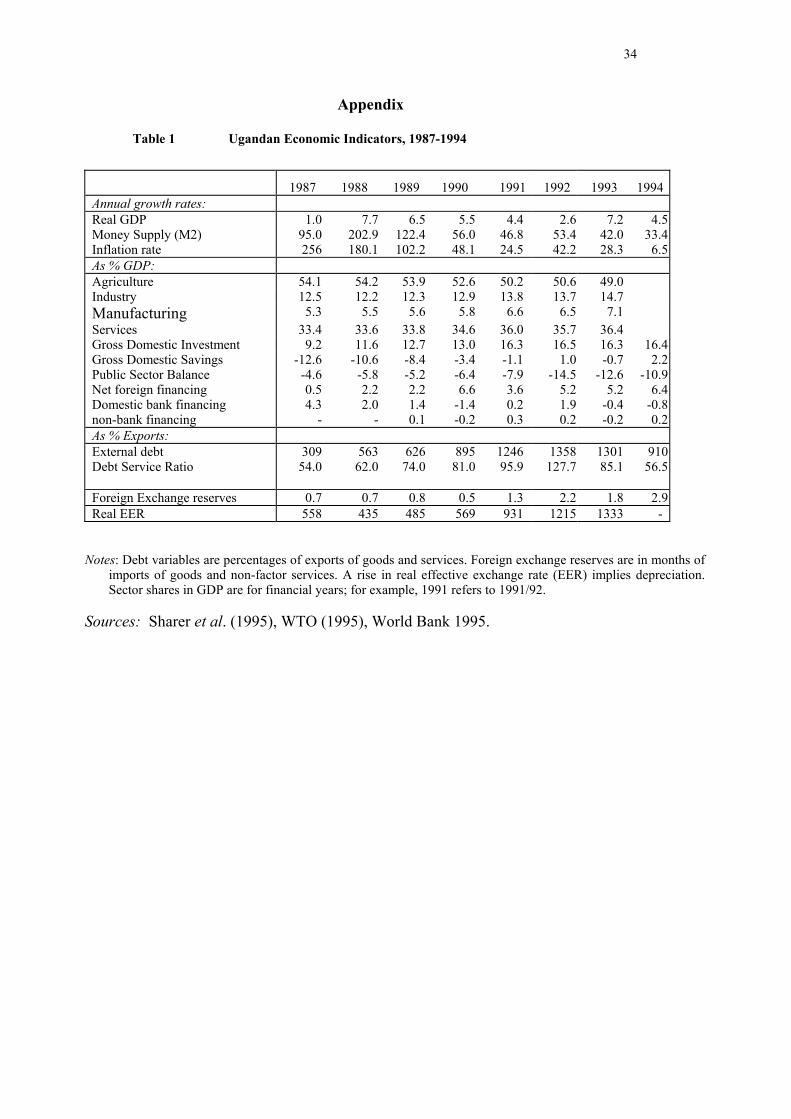
Real annual growth rates fluctuated but averaged around five per cent during the
recovery period since 1987, with what appears to be a sustained increase to over seven
per cent per annum over 1995-97 (Table 1). Inflation was reduced substantially from in
excess of 100 per cent in the late 1980s, to double figures in the early 1990s, and down
to single figures since 1994. Fluctuations in the inflation rate are to be expected, either
because of slippage in budgetary targets or external factors, such as the drought in 1992
or Kenyan border closures. The principal means of bringing inflation under control was
tight fiscal policy. Prior to 1986, fiscal deficits were mainly financed from the banking
sector, through printing money, but since the Economic Recovery Programme (ERP) in
1987 financing has been from foreign sources. This, coupled with increased effort in tax
revenue collection, through the creation of the Uganda Revenue Authority in 1991,
resulted in slower monetary growth, from 203 per cent in 1988 to 33 per cent in 1994
and 16 per cent in 1997 (Table 1).
8
TABLE 1
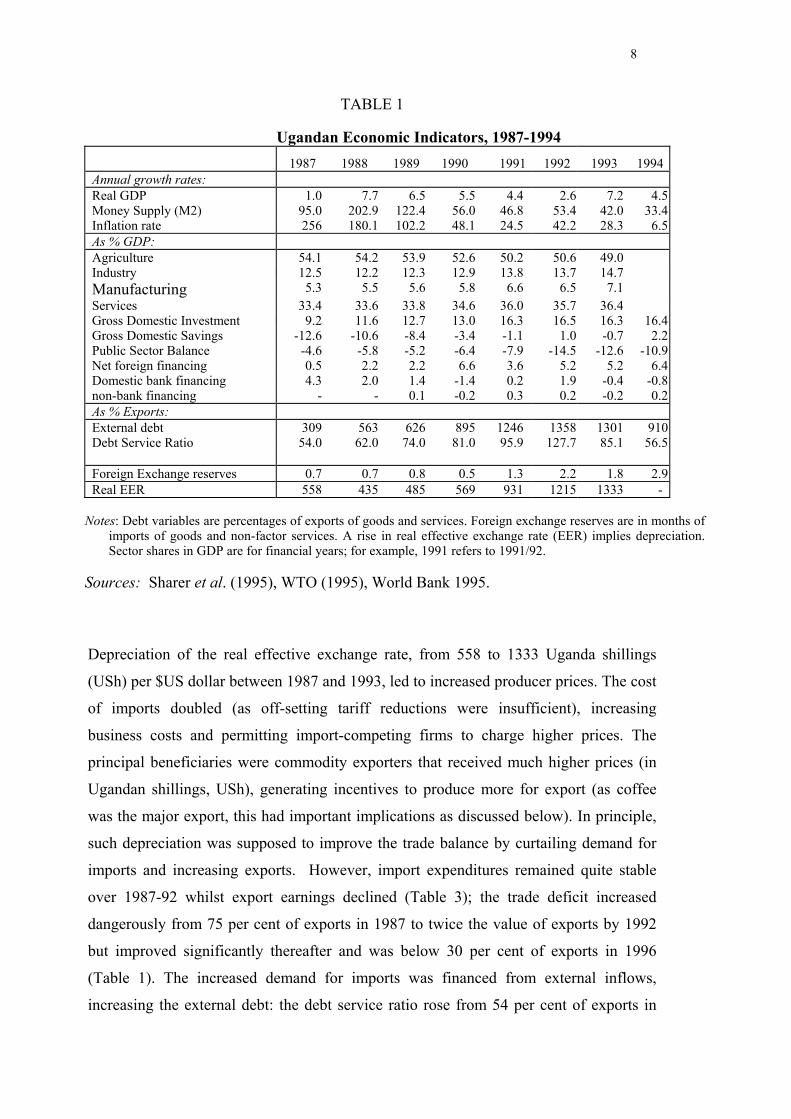
Ugandan Economic Indicators, 1987-19941987 1988 1989 1990 1991 1992 1993 1994
Annual growth rates:Real GDP 1.0 7.7 6.5 5.5 4.4 2.6 7.2 4.5Money Supply (M2) 95.0 202.9 122.4 56.0 46.8 53.4 42.0 33.4Inflation rate 256 180.1 102.2 48.1 24.5 42.2 28.3 6.5As % GDP:Agriculture 54.1 54.2 53.9 52.6 50.2 50.6 49.0Industry 12.5 12.2 12.3 12.9 13.8 13.7 14.7Manufacturing 5.3 5.5 5.6 5.8 6.6 6.5 7.1Services 33.4 33.6 33.8 34.6 36.0 35.7 36.4Gross Domestic Investment 9.2 11.6 12.7 13.0 16.3 16.5 16.3 16.4Gross Domestic Savings -12.6 -10.6 -8.4 -3.4 -1.1 1.0 -0.7 2.2Public Sector Balance -4.6 -5.8 -5.2 -6.4 -7.9 -14.5 -12.6 -10.9Net foreign financing 0.5 2.2 2.2 6.6 3.6 5.2 5.2 6.4Domestic bank financing 4.3 2.0 1.4 -1.4 0.2 1.9 -0.4 -0.8non-bank financing - - 0.1 -0.2 0.3 0.2 -0.2 0.2As % Exports:External debt 309 563 626 895 1246 1358 1301 910Debt Service Ratio 54.0 62.0 74.0 81.0 95.9 127.7 85.1 56.5
Foreign Exchange reserves 0.7 0.7 0.8 0.5 1.3 2.2 1.8 2.9Real EER 558 435 485 569 931 1215 1333 -
Notes: Debt variables are percentages of exports of goods and services. Foreign exchange reserves are in months ofimports of goods and non-factor services. A rise in real effective exchange rate (EER) implies depreciation.Sector shares in GDP are for financial years; for example, 1991 refers to 1991/92.
Sources: Sharer et al. (1995), WTO (1995), World Bank 1995.
Depreciation of the real effective exchange rate, from 558 to 1333 Uganda shillings
(USh) per $US dollar between 1987 and 1993, led to increased producer prices. The cost
of imports doubled (as off-setting tariff reductions were insufficient), increasing
business costs and permitting import-competing firms to charge higher prices. The
principal beneficiaries were commodity exporters that received much higher prices (in
Ugandan shillings, USh), generating incentives to produce more for export (as coffee
was the major export, this had important implications as discussed below). In principle,
such depreciation was supposed to improve the trade balance by curtailing demand for
imports and increasing exports. However, import expenditures remained quite stable
over 1987-92 whilst export earnings declined (Table 3); the trade deficit increased
dangerously from 75 per cent of exports in 1987 to twice the value of exports by 1992
but improved significantly thereafter and was below 30 per cent of exports in 1996
(Table 1). The increased demand for imports was financed from external inflows,
increasing the external debt: the debt service ratio rose from 54 per cent of exports in
9
1987 to a peak of 128 per cent in 1992, declining to 57 per cent in 1994 (Table 1). By
1997, however, Uganda’s debt was becoming manageable.
The standby capacity to import was less than one month of imports up to 1990 but has
increased since then. Evidence on trends in external debt given in Table 1 underscore
the need to improve the export sector so that required imports are financed from the
country’s export earnings. Uganda is a small exporter, unable to influence world prices,
but increasing efficiency (by cutting costs) in production and distribution would increase
the profit margin to producers and exporters thus encouraging them to increase the
volume of exports. Trade policy reforms are central to export growth.
2 TRADE POLICY SINCE 1987
A stabilisation programme was adopted by Uganda in 1981 but, given severe political
instability, was abandoned in 1984. Trade policies in the 1970s and early 1980s were
influenced by conditions in the world coffee market. In turn coffee export earnings
influenced the exchange rate and the administered coffee producer prices. The
dominance of coffee in terms of export earnings and revenue to the government helps to
explain the persistent overvaluation of the exchange rate, which was at a fixed rate until
the mid-80s. The implications of the boom in coffee prices in the mid-90s, believed to
have caused exchange rate appreciation, are discussed below. The economic situation in
Uganda before 1986, or more accurately prior to the reforms initiated under the
Museveni government, is succinctly described by WTO (1995: 4):
Erratic and inconsistent policy management discouraged formal economic activities, in
particular production for exports: administered producer prices for cash crops were
rarely raised in line with inflation and resulted in a sharp fall in real farm returns. State-
owned trade and processing monopolies further stifled farmers’ initiatives and, coupled
with a narrow export base, increased the government’s dependence on export taxes,
particularly on coffee; and tight foreign exchange allocation procedures discouraged any
alternative international activities. The anti-export bias was compounded by a
requirement on major cash crop exporters to surrender export proceeds at the over-
valued official rate.
10
Since 1987 there has been progress in policy reforms towards market and price
deregulation. Significant steps have been taken in liberalising the foreign exchange
market, attaining macroeconomic stabilisation and attracting investors. As noted above,
these have contributed to business confidence.
The government launched a comprehensive Economic Recovery Programme (ERP) in
1987 with support from the International Monetary Fund (IMF), the World Bank and
other donors. One of the objectives of the ERP was to create an environment enabling
increased volume and diversity of exports, through policies geared towards establishing
market-determined exchange rates and producer prices, and the privatisation of
inefficient state-owned enterprises, such as Marketing Boards. In an attempt to
encourage more production for export markets a drawback scheme was introduced in
1991 under which the custom duties initially paid are refunded once the export has taken
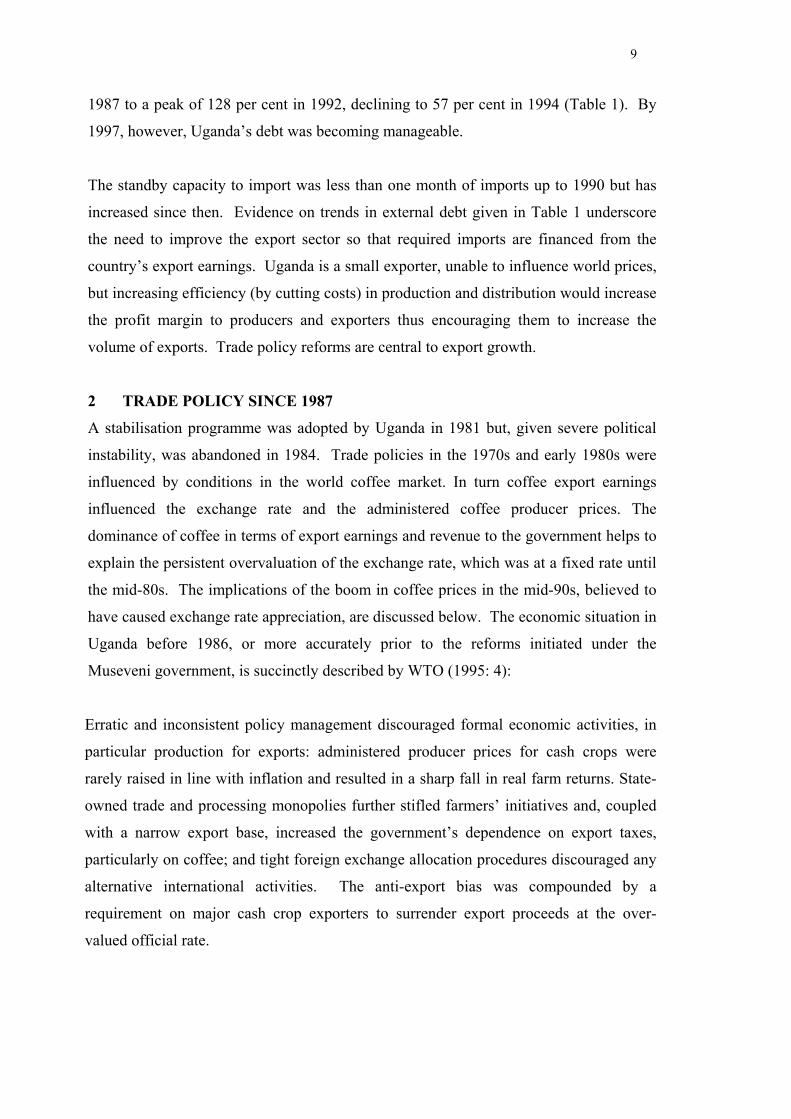
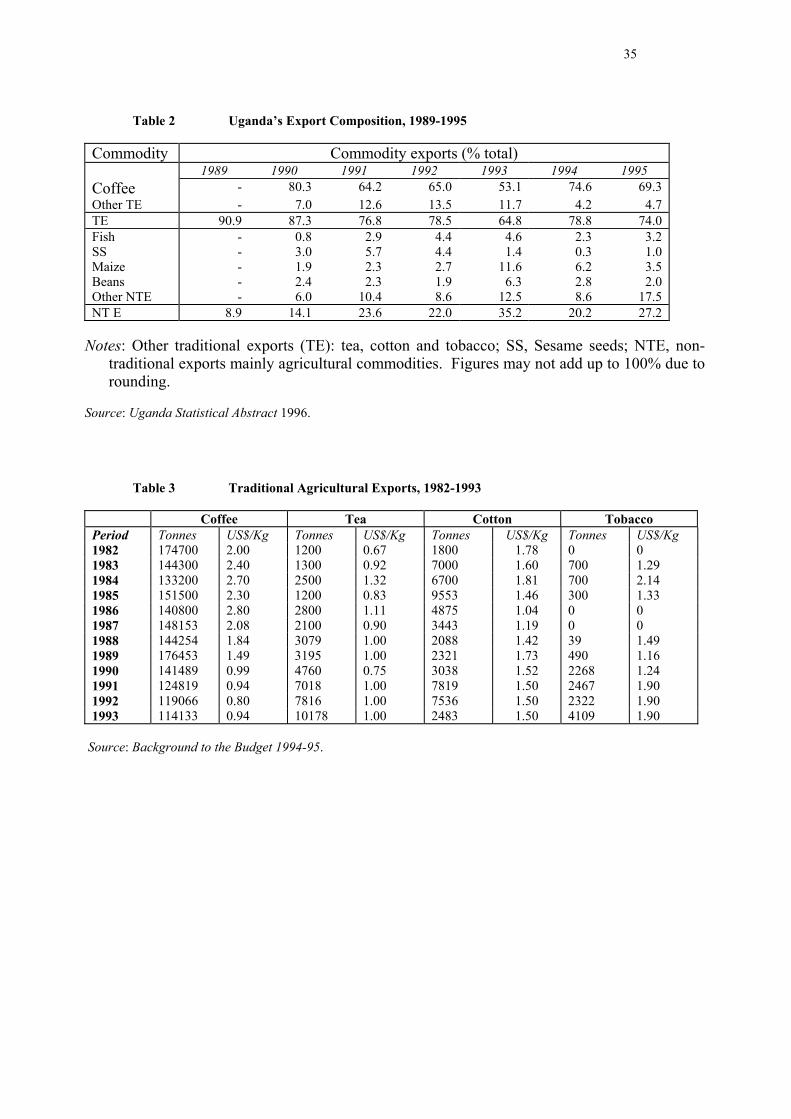
place. Table 2 summarises the policy reforms since the launching of the ERP in 1987.
TABLE 2
Uganda’s Export Composition, 1989-1995
Commodity Commodity exports (% total)1989 1990 1991 1992 1993 1994 1995
Coffee - 80.3 64.2 65.0 53.1 74.6 69.3Other TE - 7.0 12.6 13.5 11.7 4.2 4.7TE 90.9 87.3 76.8 78.5 64.8 78.8 74.0Fish - 0.8 2.9 4.4 4.6 2.3 3.2SS - 3.0 5.7 4.4 1.4 0.3 1.0Maize - 1.9 2.3 2.7 11.6 6.2 3.5Beans - 2.4 2.3 1.9 6.3 2.8 2.0Other NTE - 6.0 10.4 8.6 12.5 8.6 17.5NT E 8.9 14.1 23.6 22.0 35.2 20.2 27.2
Notes: Other traditional exports (TE): tea, cotton and tobacco; SS, Sesame seeds; NTE, non-traditional exports mainly agricultural commodities. Figures may not add up to 100% due torounding.
Source: Uganda Statistical Abstract 1996.
There has been rapid progress in deregulating the foreign exchange market. Initially the
exchange rate policy involved repeated devaluation and rationing of the available
foreign exchange under various schemes, the Open General License (OGL) in 1988 and
Special Import Programme (SIP) in 1989. Private Forex Bureaux were introduced in
1990 and by 1993 the exchange rate was completely market-determined and exporters
11
were allowed to retain 100 per cent of their export receipts (all surrender requirements
had been abolished). Most export taxes in Uganda are implicit rather than explicit, with
the exception of coffee export taxes, which used to be the main source of government
revenue. Tax on coffee exports was abolished in 1992 but reintroduced in 1994 to limit
the appreciation of the exchange rate as a result of the coffee price boom. This coffee tax
(the Stabilisation tax) was abolished in 1996 (see below).
The implicit taxes, such as tariffs on imported inputs, have been eroded over time as
import liberalisation proceeded, with successive measures since 1992 to replace
quantitative restrictions with tariffs, rationalise and reduce tariffs, and reduce the
number of goods on the negative list. The first bout of tariff rationalisation in 1992
established a range of 10-60 per cent, reduced to 10-50 per cent in 1994; by 1996 the
highest tariff rate was 30 per cent, and in 1997 the range of rates was further reduced to
0, 5, 10 and 20 per cent. The range of rates on imports from COMESA countries,
notably Kenya and Tanzania, was 0, 2, 4 and 8 per cent. This understates actual
protection. When tariffs were reduced in 1996 an Excise Duty of 12 per cent (of the
tariff inclusive price) was imposed on certain imports. The Duty was reduced to 10 per
cent in 1997, but its coverage extended to apply to almost all finished and consumption
goods (including, especially, those from COMESA). Furthermore, VAT at 17 per cent
was introduced in 1997; while this applies to imports and domestically produced goods
equally, it is applied to the import price inclusive of tariffs and Excises. Thus, for
example, the tax on a domestic manufactured product would add 17 per cent to the price,
but if a competing manufacture was imported from outside COMESA (hence 20 per cent
tariff) it would attract a cumulative tax of about 55 per cent.
A number of products attract very high tax rates. Excises are 215 per cent on petrol
(Super), 160 per cent on diesel, 105 per cent on kerosene, 122 per cent on finished
tobacco products (in addition to 30 per cent import duty, 12 per cent COMESA), 130 per
cent on spirits (20 per cent import duty), 20 per cent on larger cars and 4WDs, plus
higher rates on some other products. Beers, mineral waters, car batteries and vehicle
retreads were removed from the negative list on 1 April 1998, but any imports will
attract high Excises. Cigarettes are to stay on the negative list until 1999. The Excises
on petroleum products are motivated by revenue needs, whereas the others are motivated
by protection.
12
Total import duty revenues in 1996/97 were approximately $100m on assessed imports
exceeding $600m, implying an average nominal tariff of 16 per cent. Exempted
imports, however, were worth some $100m. Two sources of exemptions are
unalterable: 47 per cent are due to exemptions for Diplomats, and 21 per cent to
International Agreements. Exemptions for investors were only three per cent of the total
(down from 16 per cent the previous year) but discretionary exemptions accounted for
29 per cent, representing a potential revenue loss of some $2.5m (International
Development Consultants, 1997). From 1997/98, the total value of discretionary
exemptions is limited to USh1bn, which should lead to some revenue increases.
A number of marketing boards have either been privatised or lost their monopoly
powers by being exposed to competition from the private sector. A prominent example
is the former Uganda Coffee Marketing Board, which since 1992 has increasingly lost
most of its coffee export shares to other private exporters (especially multinationals).
The monopoly power of Uganda Railway Corporation in shipping coffee exports was
reduced recently when coffee shipments were opened to competition, allowing the
participation of truck transport as well. Other policies under the programme include
replacement of the trade license needed each time an export transaction is made with a
trade certificate that lasts at least six months.
To insulate the economy from adverse terms of trade and instability in export earnings
associated with commodity concentration, there has been a policy shift since 1987 to
diversify the country’s exports to include non-traditional (mainly agricultural) exports.
To some extent there has been a significant rise in export revenue from non-traditional
exports, from $3 million in 1986 to $71 million in 1993, representing 35 per cent of total
export earnings, and to $151 million in 1995, representing 27 per cent of total export
earnings (Sharer et al, 1995). Traditional exports, especially from coffee, still constitute
the major share of foreign exchange earnings (and will remain so for the foreseeable
future).
Under the third Structural Adjustment Credit agreed with the World Bank (SAC3),
Uganda is to further rationalise tariffs to two rates, 7 and 15 per cent, and is expected to
abolish the special Excise Duties on imports (the latter is at present a principal sticking
13
point). It is likely that duties currently at rates of 0 and 5 per cent will go up to 7 per
cent, while those at 20 per cent will go down to 15 per cent. It is unclear what duty will
apply to goods currently subject to the 10 per cent tariff (revenue and protection motives
suggests that most if not all commodities at this rate will attract a higher rate).
Future trade policy reforms will be influenced by progress in establishing a regional
integration agreement with Kenya and Tanzania, the East Africa Cooperation (EAC).
The EAC Development Strategy approved at a summit on 28 April 1996 stated the aim
of a common trade and investment area. Discussions have mentioned a common
external tariff and zero internal tariffs. One sticking point in negotiations is how the
external tariff would be shared, especially as that due to Uganda would be collected
either at Mombassa or Dar-es-Salaam. As neither country is an important export market
for Uganda, progress on the EAC will not have a significant effect on exporters
(although they will benefit if investment in infrastructure improves).
3 THE COMPOSITION OF TRADE AND EXPORT PERFORMANCE
Trade liberalisation was designed, amongst other things, to reverse and even eliminate
the trade deficit through increasing export earnings and curtailing the demand for
imports. Incentives geared towards the export-oriented trade and market-determined
exchange rate policies are expected to encourage both traditional and non-traditional
exports. Nevertheless, merchandise exports continued to decline whilst imports
remained steady throughout the liberalisation period from 1987 to 1992; thereafter, the
value of exports improved markedly (Table 3). The persistent trade deficit simply
reflects the composition of Uganda’s export basket (primarily coffee and other cash
crops) and import basket (manufactures, equipment and machinery) and the impact of
deteriorating terms of trade. This explains why the goal of eliminating the trade deficit
has not been achieved.
14
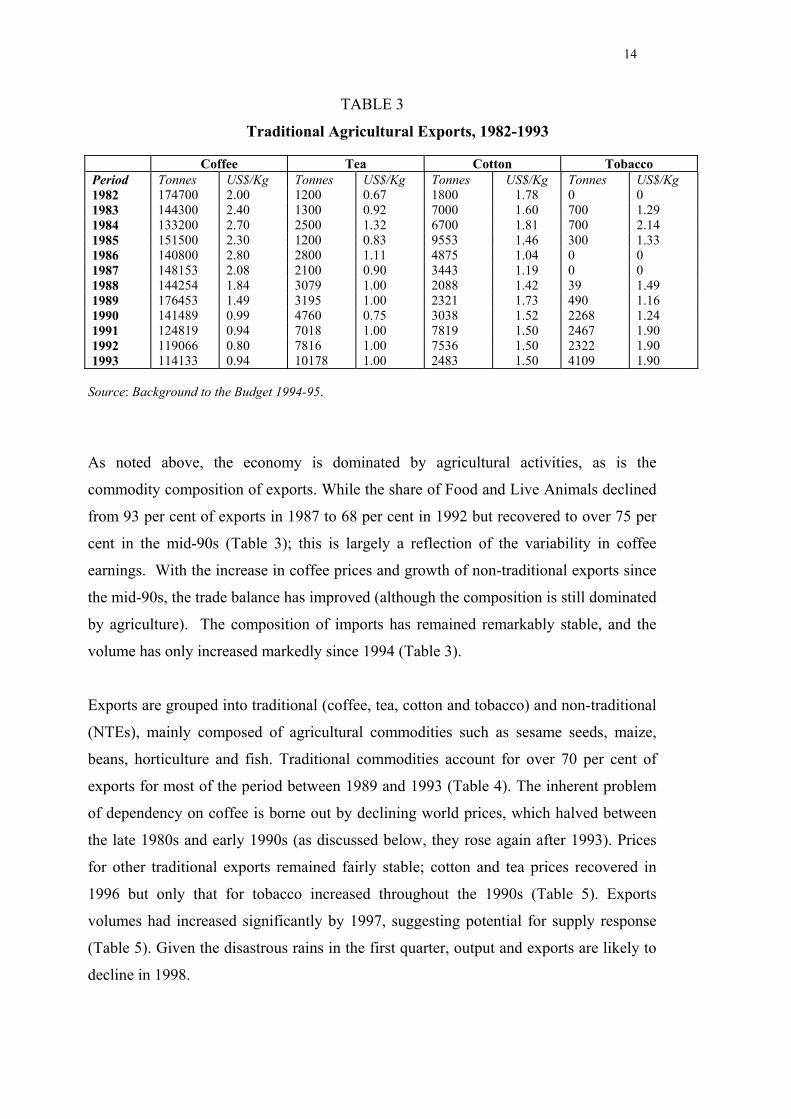
TABLE 3
Traditional Agricultural Exports, 1982-1993
Coffee Tea Cotton TobaccoPeriod Tonnes US$/Kg Tonnes US$/Kg Tonnes US$/Kg Tonnes US$/Kg1982 174700 2.00 1200 0.67 1800 1.78 0 01983 144300 2.40 1300 0.92 7000 1.60 700 1.291984 133200 2.70 2500 1.32 6700 1.81 700 2.141985 151500 2.30 1200 0.83 9553 1.46 300 1.331986 140800 2.80 2800 1.11 4875 1.04 0 01987 148153 2.08 2100 0.90 3443 1.19 0 01988 144254 1.84 3079 1.00 2088 1.42 39 1.491989 176453 1.49 3195 1.00 2321 1.73 490 1.161990 141489 0.99 4760 0.75 3038 1.52 2268 1.241991 124819 0.94 7018 1.00 7819 1.50 2467 1.901992 119066 0.80 7816 1.00 7536 1.50 2322 1.901993 114133 0.94 10178 1.00 2483 1.50 4109 1.90
Source: Background to the Budget 1994-95.
As noted above, the economy is dominated by agricultural activities, as is the
commodity composition of exports. While the share of Food and Live Animals declined
from 93 per cent of exports in 1987 to 68 per cent in 1992 but recovered to over 75 per
cent in the mid-90s (Table 3); this is largely a reflection of the variability in coffee
earnings. With the increase in coffee prices and growth of non-traditional exports since
the mid-90s, the trade balance has improved (although the composition is still dominated
by agriculture). The composition of imports has remained remarkably stable, and the
volume has only increased markedly since 1994 (Table 3).
Exports are grouped into traditional (coffee, tea, cotton and tobacco) and non-traditional
(NTEs), mainly composed of agricultural commodities such as sesame seeds, maize,
beans, horticulture and fish. Traditional commodities account for over 70 per cent of
exports for most of the period between 1989 and 1993 (Table 4). The inherent problem
of dependency on coffee is borne out by declining world prices, which halved between
the late 1980s and early 1990s (as discussed below, they rose again after 1993). Prices
for other traditional exports remained fairly stable; cotton and tea prices recovered in
1996 but only that for tobacco increased throughout the 1990s (Table 5). Exports
volumes had increased significantly by 1997, suggesting potential for supply response
(Table 5). Given the disastrous rains in the first quarter, output and exports are likely to
decline in 1998.
15
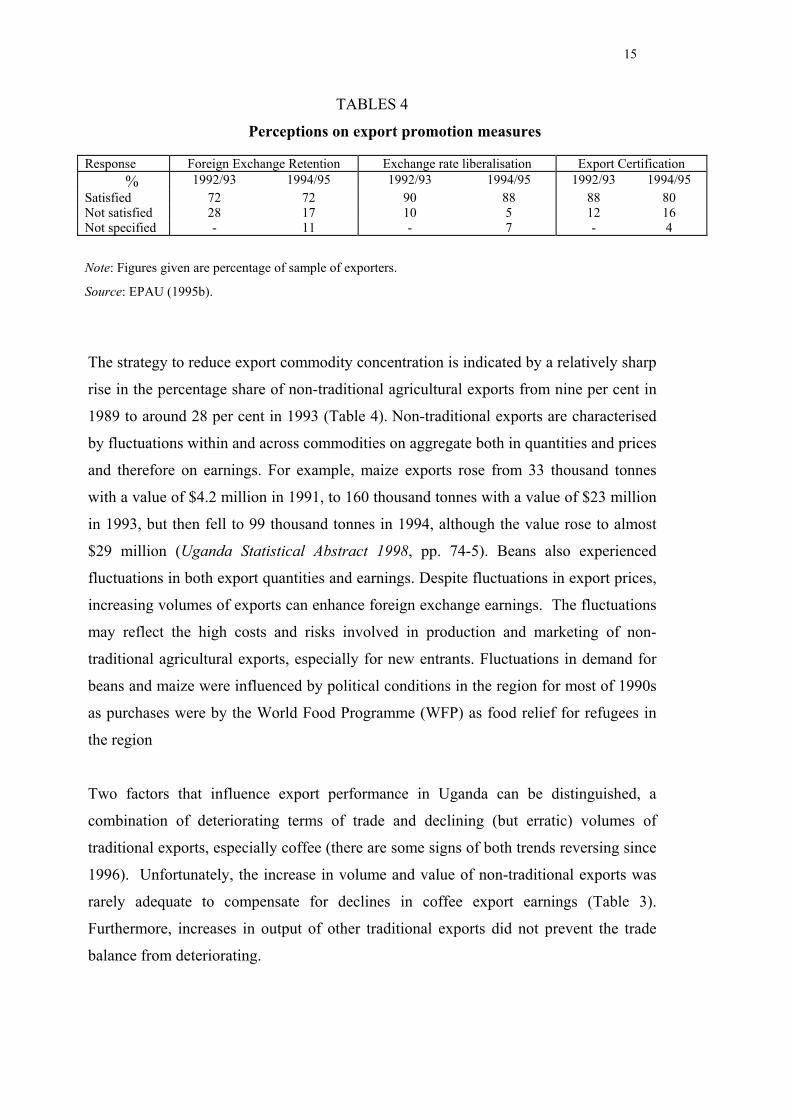
TABLES 4
Perceptions on export promotion measures
Response Foreign Exchange Retention Exchange rate liberalisation Export Certification% 1992/93 1994/95 1992/93 1994/95 1992/93 1994/95
Satisfied 72 72 90 88 88 80Not satisfied 28 17 10 5 12 16Not specified - 11 - 7 - 4
Note: Figures given are percentage of sample of exporters.
Source: EPAU (1995b).
The strategy to reduce export commodity concentration is indicated by a relatively sharp
rise in the percentage share of non-traditional agricultural exports from nine per cent in
1989 to around 28 per cent in 1993 (Table 4). Non-traditional exports are characterised
by fluctuations within and across commodities on aggregate both in quantities and prices
and therefore on earnings. For example, maize exports rose from 33 thousand tonnes
with a value of $4.2 million in 1991, to 160 thousand tonnes with a value of $23 million
in 1993, but then fell to 99 thousand tonnes in 1994, although the value rose to almost
$29 million (Uganda Statistical Abstract 1998, pp. 74-5). Beans also experienced
fluctuations in both export quantities and earnings. Despite fluctuations in export prices,
increasing volumes of exports can enhance foreign exchange earnings. The fluctuations
may reflect the high costs and risks involved in production and marketing of non-
traditional agricultural exports, especially for new entrants. Fluctuations in demand for
beans and maize were influenced by political conditions in the region for most of 1990s
as purchases were by the World Food Programme (WFP) as food relief for refugees in
the region
Two factors that influence export performance in Uganda can be distinguished, a
combination of deteriorating terms of trade and declining (but erratic) volumes of
traditional exports, especially coffee (there are some signs of both trends reversing since
1996). Unfortunately, the increase in volume and value of non-traditional exports was
rarely adequate to compensate for declines in coffee export earnings (Table 3).
Furthermore, increases in output of other traditional exports did not prevent the trade
balance from deteriorating.
16
Exports from Uganda are not only composed of a few commodities but also are destined
to a small number of export markets, mainly the European Union and North America.
The share of exports to the EU increased over time while that to North America declined
(Background to the Budget, various years). Traditional exports are destined for
industrial markets while most NTEs (excepting horticulture and sesame) are destined for
regional markets. Given the negligible share of manufacturing exports, it follows that
most exports are unprocessed. There is very little trade between Uganda and its
neighbours, with the exception of imports from Kenya. In reality, there is more trade
(both imports and exports) between Uganda and industrial countries than with other
developing countries. Such a trade structure may be explained by several factors. Most
developing countries are heavily protected by both tariff and non-tariff trade barriers,
which reduces the level of trade. Furthermore, regional trade is constrained by poor
transport and communication systems, and long border and customs clearance delays
(Folke at al, 1993). A more obvious factor for Uganda is that it produces primary
commodities, generally the same as those produced by neighbours, which are only likely
to be demanded (in large volumes) by industrial countries. With the exception of
Kenya, which has a larger and more established manufacturing sector, Uganda produces
the same goods as its neighbours, with obvious implications for any regional trading
arrangements (such as the EAC).
A more serious impediment to trade among developing countries is lack of finance both
for individual exporters1 and at the national level. The main financial constraint facing
developing country exporters is that of foreign exchange, which puts severe limitations
on their import capacity. This problem is often overcome through counter-trade (a form
of barter trade) or regional clearing arrangements. Uganda adopted barter trade in 1986-
87 but abandoned it because of the complexity and high transaction costs involved in the
scheme, while the clearing arrangement system is operational within the PTA
(COMESA) region. An alternative solution to the financial constraint is seeking aid
from industrial countries. One of the consequences of aid (especially tied aid) is that it
may influence the trade structure (both imports and exports) of the recipient country. 1 Developed countries are in a better position to offer generous credit terms to their exporters thandeveloping countries (Folke, at el., 1993). Individual exporters both in industrial and developingcountries may receive support from their governments through various schemes including export creditguarantee scheme, but the terms offered (e.g. duration of the payment, interest rate, etc.) by developingcountries may not compete those offered by industrial countries.
17
This may partly explain the high concentration of trade between Uganda and the
European Union, especially with the United Kingdom.
Since 1984 Uganda’s export revenue declined persistently in the face of deteriorating
terms of trade. At the same time, imports continued to rise as domestic production
stagnated and imported inputs and capital goods were required to rehabilitate the
economy after 1987 (a large proportion of imports comprise machinery and capital
equipment for which there are no domestic substitutes). One objective of ERP was to
improve the trade balance by increasing both the diversity and volume of exports; much
of the decline in export earnings since 1987 can be attributed to a declining or stagnant
price and volume of traditional exports, especially coffee (Table 5). Furthermore, the
inflexibility of administered relative to world coffee prices prior to 1989 resulted in
illegal coffee shipments, further reducing export earnings (Henstridge, 1995). Similar
problems applied to other exports (World Bank, 1991: 14):
The output of cotton in 1988/89 was 10,000 bales, which led to US$2.4 million in
exports. However, this output was down from around 470,000 bales in 1970s. As a crude
calculation, if production had remained at 470,000 bales in 1988/89 and if we assume the
same average price per bale as was actually realised with the 10,000 bales, then cotton
export earnings in 1988/89 would have been about US$83 million instead of the US$2.4
million actually earned. Similarly, if exports of tea in 1988/89 had been 21 thousand tons
as achieved in 1972 instead of 2.5 thousand tons, the export earnings would have been
US$36 million instead of US$4.3 million.
This combination of declining volume and world prices of primary commodity exports
reinforced the implicit anti-export bias created by protective policies. Degradation of the
infrastructure and lack of institutional support may have added to the anti-export bias by
implicitly taxing exporters. However, the real problem facing Ugandan attempts to
increase export earnings is the severe lack of export diversification and the fact that it is
a price taker on world markets. Uganda can do nothing to influence world prices for
primary commodities and for the foreseeable future its export performance will depend
on the world price for coffee (in recent year gold has been a significant source of export
earnings, but this is due to instability in Congo, hence unreliable). Uganda can take
measures to encourage export diversification, both in terms of quality and niche markets
18
for traditional commodities (such as organic coffee) and in terms of encouraging NTEs.
Trade policy reforms are only part of such a strategy, and Uganda has gone far down
that road. Improved infrastructure and institutional support are an important component
of export support, to reduce the adverse effects of natural barriers (Milner and
Morrissey, 1997). Some of these issues are addressed in the next section, and in more
detail in Milner, Morrissey and Rudaheranwa (1998).
As coffee is such a dominant export, and as a temporary tax on coffee exports was
introduced in the face of high world coffee prices in the mid-90s, it is worth considering
this episode in some detail. Such a consideration serves to highlight important aspects of
Ugandan export performance. The Stabilisation Tax (on coffee exports) was introduced
in the Budget speech of June 1994, the stated reason being to reduce pressures on
(appreciation of) the exchange rate. The source of this pressure, presumably, was the
increased $US revenue of coffee exporters. As the Ugandan Shilling (Ush) was
effectively a floating exchange rate at that time, the increased availability of $US pushed
up the price of USh (Background to the Budget, various years). From a low of USh 1255
to the dollar in April 1993, during a period of steadily rising world coffee prices, the
currency appreciated to USh 973 in June 1994 (when the coffee tax was introduced at
32% of the price in excess of a threshold of USh 1100/Kg). The exchange rate reached a
maximum of USh 925 per $US in November 1994 (which was also roughly when the
world price for coffee peaked). The currency then depreciated gradually to stabilise
around USh 1030 in early 1996 (in July 1995 the coffee tax was revised to 32% beyond a
threshold of USh 1500/Kg). On this basis, the tax may have contributed to stabilising the
exchange rate. The Compulsory Floor Price was abolished on 1 March 1995, but replaced
by an indicative price.
An economic evaluation of the effect of the tax requires identifying both the incidence of
the tax and the propensity to save of those who received the windfall gain. A standard
argument is that an export tax should not be levied because producers will always utilise
the windfall gain better than the Government. The a priori case for this is strong. First,
coffee farmers had low yields and a strong need for increased revenue to be used for
investment and purchase of inputs. Second, the inability of the Government of Uganda to
meet counterpart funds requirements of the development budget, an issue of contention
with the World Bank, suggests that it was diverting funds. A windfall increase in
19
government revenue may also be diverted, or used as counterpart funds, rather than being
used to finance investment. There are counter-arguments:
1. Price transmission was imperfect, i.e. part of the coffee price increase accrued to
exporters rather than to producers. Available evidence suggests that producer prices
increased significantly in real terms, but not by as much as world prices. World
prices began rising from mid 1993, and increased 232% by end 1994; farm prices
did not increase until mid 1994 (when the tax was introduced) and rose 166% by the
end of the year (UCDA, 1995). This suggests that incidence of the tax fell largely
on the exporters (traders).
2. Revenue from the Stabilisation Tax only accounted for 2-3% of tax revenue in
1994/95 and 1995/96, suggesting that it is unlikely to have had a significant impact
on the budget or government behaviour. Collection efficiency was remarkably low.
3. It has been suggested that while farmers did increase investment, notably by
planting new cuttings, as their revenues increased there was also a significant
increase in conspicuous consumption, notably on houses and cars. While this may
have benefited the local economy, it undermines the argument that the government
would have used the revenue any less constructively.
The principal concern regarding the coffee tax, as stated by the Uganda Coffee Trade
Federation was that it encouraged smuggling. Coffee exports had been rising steadily in
the 1990s, reflecting increased yield due to new plantings, peaking at over 3m bags in
1993/94 (the season is October to September, so this was when world prices were rising
fastest). Exports then fell to some 2.8m bags in 1994/95, when world prices were high
but the tax was in place, but jumped to over 4m bags in 1995/96 coinciding with the
period when the tax became redundant and was abolished. It is certainly reasonable to
claim that (recorded) exports should have been much higher in 1994/95. Neighbouring
countries levied no coffee taxes during this period. Given the high prices, and especially
the squeezed trader margins (as tax was largely incident on traders), incentives for
smuggling were high. Unfortunately, Customs provided no data on exports recorded as
transhipments from Rwanda or Zaire (trucks bringing relief goods to these countries were
claimed to have returned empty but with papers for coffee from these countries, then
20
loaded with coffee in Uganda). Another problem is that the tax was introduced quickly,
without full consideration of how it would be administered, generating a number of
problems. The mechanisms to monitor which traders exported coffee and at what price
were poor, hence evasion was rife.
In the early 1990s farmers began to replant and improved their agronomic practices.
Hence yields rose. When the world price increased, competition for coffee purchases
was intense and farm-gate prices rose considerably. Yields increased most in those areas
where good extension services were provided, especially in maintenance and husbandry
(not usually something in which farmers themselves invested). Quality control remains a
problem. This highlights the fact that increasing exports of agricultural crops is not
simply a trade policy issue, although that is important to establish relative price
incentives. It is also an issue of agricultural policy, and the details of providing
education and extension services to small, dispersed farmers, and encouraging adoption
of the most appropriate technology to ensure high quality output. Trade policy
contributes to improving price incentives, but other policy interventions are necessary to
relax constraints and ensure supply response (McKay et al, 1997). Some of these will be
agricultural policy, others will be export promotion, to which we now turn.
4 EXPORT PROMOTION
The foregoing discussion demonstrates that economic policies adopted to increase both
the volume and diversity of exports have proved inadequate, although largely for reasons
beyond Uganda’s control. Notwithstanding the external constraints, there was minimal
supply response of exporters to improved incentives. To get some understanding on this
issue we can consider how investors and exporters perceive the export promotion
policies that accompanied the economic reforms.
The macroeconomic policy environment in Uganda in recent years has been regarded as
favourable for exporting business, by 72 per cent and 78 per cent of exporters in 1992/93
and 1994/95 respectively (EPAU, 1995b). This favourable export climate stems from
sweeping economic reforms under the ERP, notably some direct export subsidies and
100 per cent retention of foreign exchange by exporters, coupled by a duty drawback
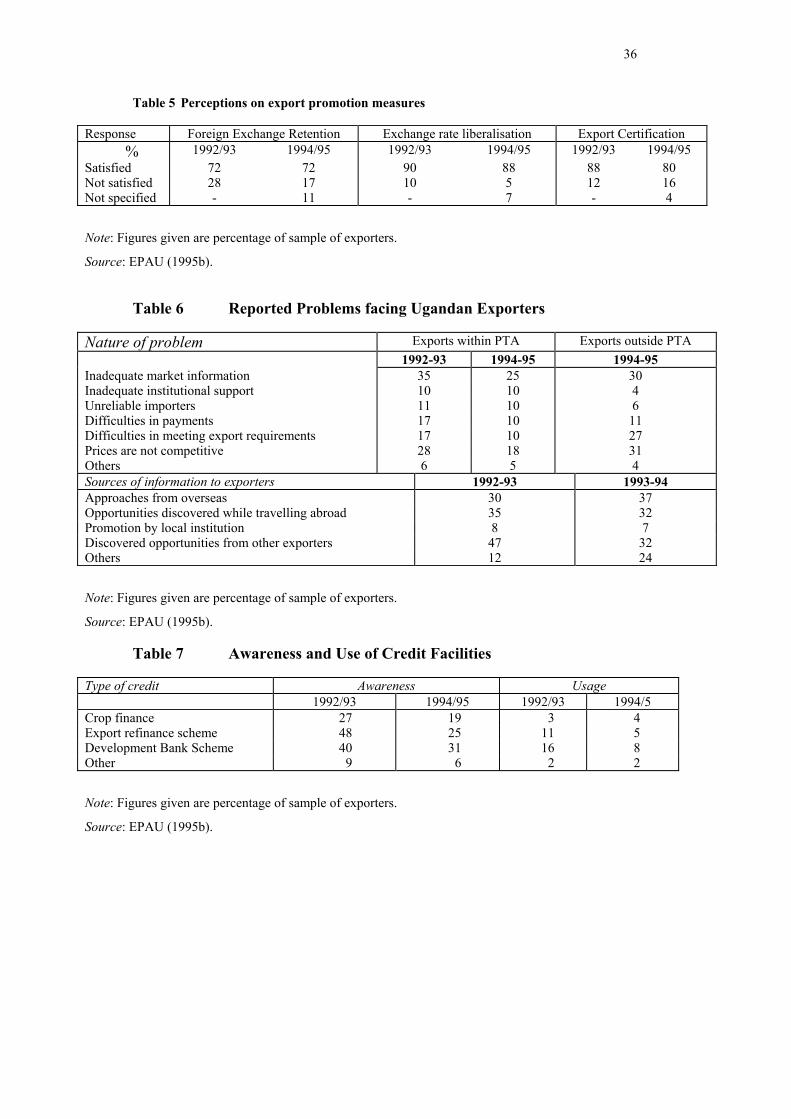
scheme. Table 6 summarises the views on export policy of exporters. Some 72 per cent
were satisfied with the export retention scheme (in both years), about 90 per cent in each
21
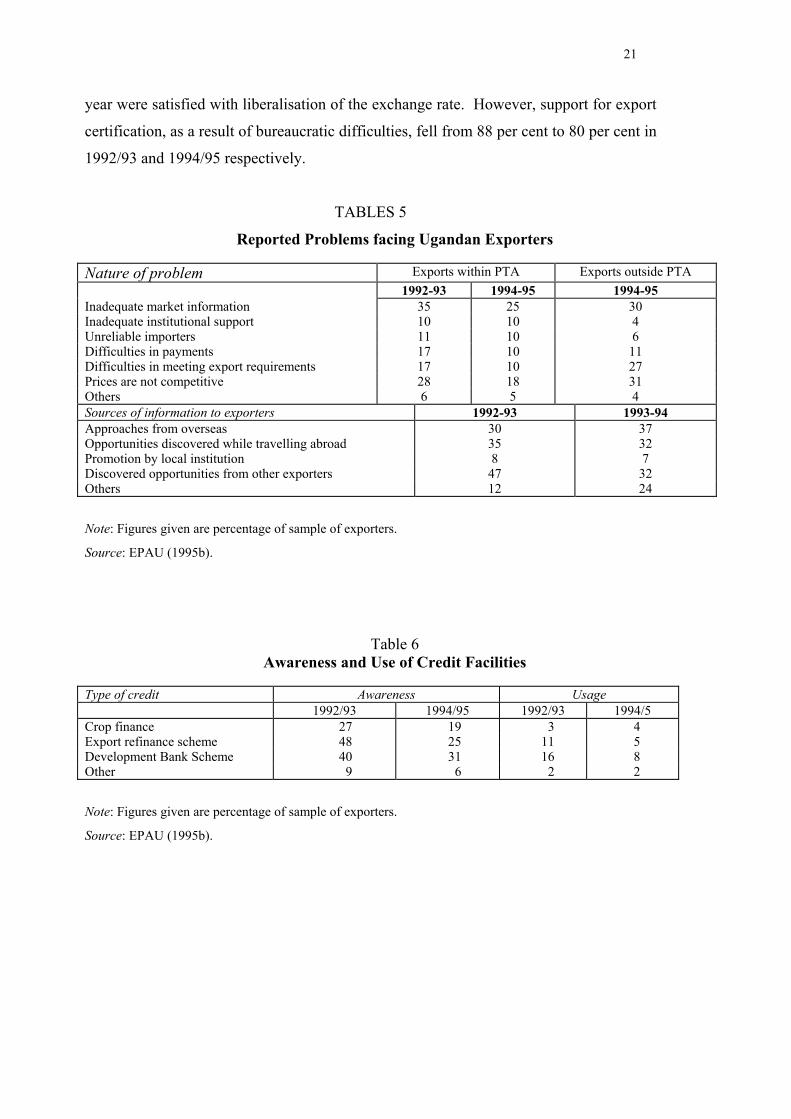
year were satisfied with liberalisation of the exchange rate. However, support for export
certification, as a result of bureaucratic difficulties, fell from 88 per cent to 80 per cent in
1992/93 and 1994/95 respectively.
TABLES 5
Reported Problems facing Ugandan Exporters
Nature of problem Exports within PTA Exports outside PTA1992-93 1994-95 1994-95
Inadequate market information 35 25 30Inadequate institutional support 10 10 4Unreliable importers 11 10 6Difficulties in payments 17 10 11Difficulties in meeting export requirements 17 10 27Prices are not competitive 28 18 31Others 6 5 4Sources of information to exporters 1992-93 1993-94Approaches from overseas 30 37Opportunities discovered while travelling abroad 35 32Promotion by local institution 8 7Discovered opportunities from other exporters 47 32Others 12 24
Note: Figures given are percentage of sample of exporters.
Source: EPAU (1995b).
Table 6Awareness and Use of Credit Facilities
Type of credit Awareness Usage1992/93 1994/95 1992/93 1994/5
Crop finance 27 19 3 4Export refinance scheme 48 25 11 5Development Bank Scheme 40 31 16 8Other 9 6 2 2
Note: Figures given are percentage of sample of exporters.
Source: EPAU (1995b).
22
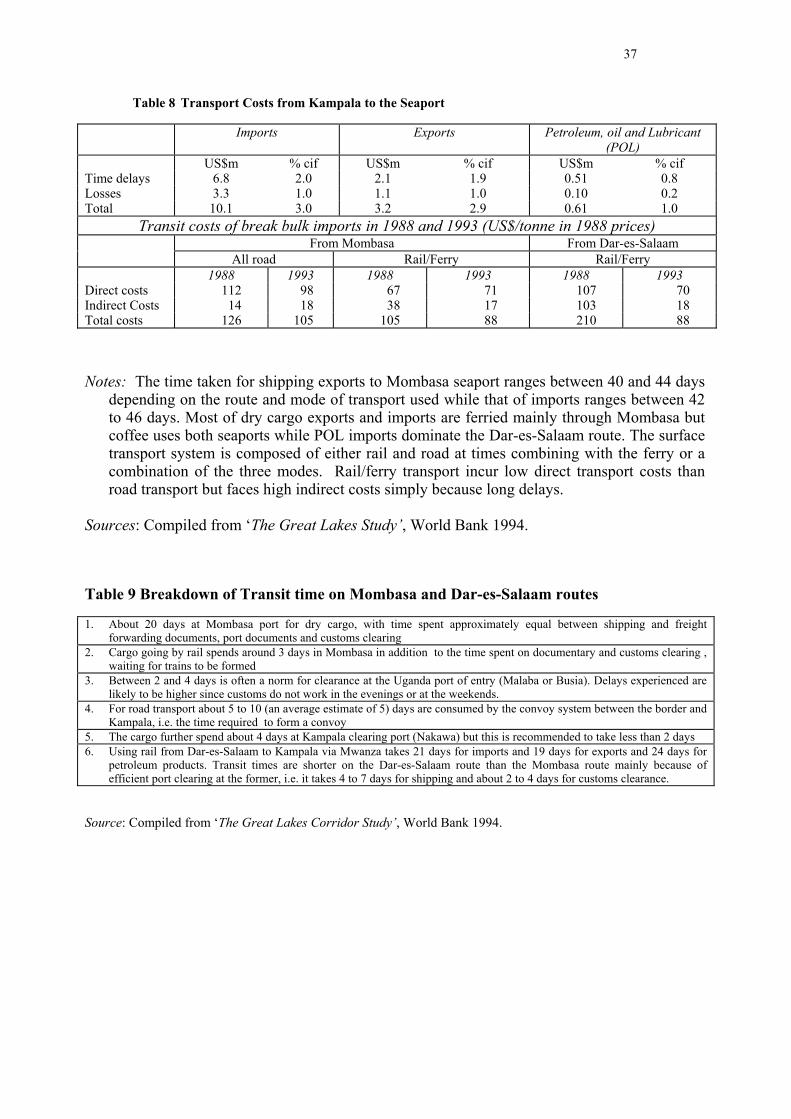
Table 7Transport Costs from Kampala to the Seaport
Imports Exports Petroleum, oil and Lubricant(POL)
US$m % cif US$m % cif US$m % cifTime delays 6.8 2.0 2.1 1.9 0.51 0.8Losses 3.3 1.0 1.1 1.0 0.10 0.2Total 10.1 3.0 3.2 2.9 0.61 1.0
Transit costs of break bulk imports in 1988 and 1993 (US$/tonne in 1988 prices)From Mombasa From Dar-es-Salaam
All road Rail/Ferry Rail/Ferry1988 1993 1988 1993 1988 1993
Direct costs 112 98 67 71 107 70Indirect Costs 14 18 38 17 103 18Total costs 126 105 105 88 210 88
Notes: The time taken for shipping exports to Mombasa seaport ranges between 40 and 44 daysdepending on the route and mode of transport used while that of imports ranges between 42to 46 days. Most of dry cargo exports and imports are ferried mainly through Mombasa butcoffee uses both seaports while POL imports dominate the Dar-es-Salaam route. The surfacetransport system is composed of either rail and road at times combining with the ferry or acombination of the three modes. Rail/ferry transport incur low direct transport costs thanroad transport but faces high indirect costs simply because long delays.
Sources: Compiled from ‘The Great Lakes Study’, World Bank 1994.
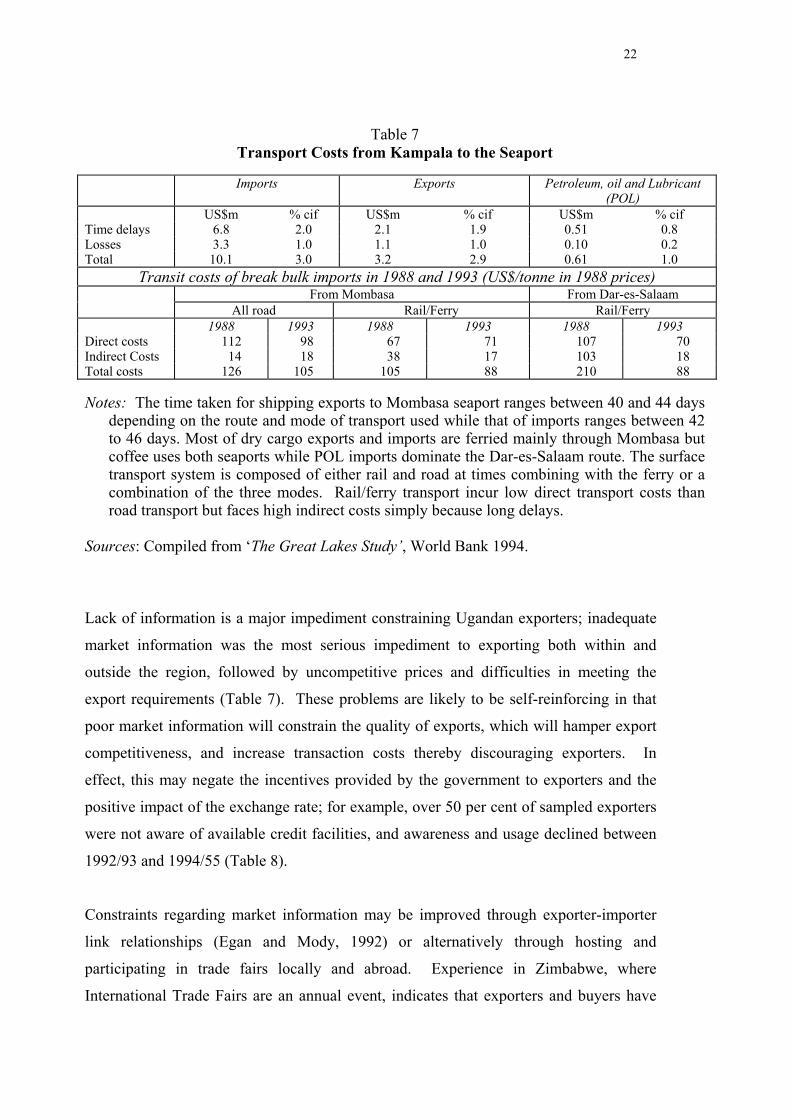
Lack of information is a major impediment constraining Ugandan exporters; inadequate
market information was the most serious impediment to exporting both within and
outside the region, followed by uncompetitive prices and difficulties in meeting the
export requirements (Table 7). These problems are likely to be self-reinforcing in that
poor market information will constrain the quality of exports, which will hamper export
competitiveness, and increase transaction costs thereby discouraging exporters. In
effect, this may negate the incentives provided by the government to exporters and the
positive impact of the exchange rate; for example, over 50 per cent of sampled exporters
were not aware of available credit facilities, and awareness and usage declined between
1992/93 and 1994/55 (Table 8).
Constraints regarding market information may be improved through exporter-importer
link relationships (Egan and Mody, 1992) or alternatively through hosting and
participating in trade fairs locally and abroad. Experience in Zimbabwe, where
International Trade Fairs are an annual event, indicates that exporters and buyers have
23
gained much through personal interaction in such events (Financial Gazette April 24,
1997). There are salient benefits of participating in trade fairs: the customer or buyer has
the opportunity to examine the product on sale and compare it with others on exhibit.
Trade fairs may be seen as venues suitable for information searches that give vital
feedback on products and opportunities. Promotion of non-traditional exports in
Colombia involved augmenting the exchange rate and other fiscal incentives, not only
with simpler administrative procedures, improved port and other infrastructural facilities,
but also by providing exporters with information (Teigeiro and Elson, 1973).
A separate institution (PROEXPO) was created to provide exporters with information on
foreign markets and technical assistance regarding transport, parking, advertising, etc.
PROEXPO was also responsible for organising trade fairs within Colombia and abroad,
and administering the export insurance scheme providing exporters with protection
against political and other non-commercial risk (Teigeiro and Elson, 1973). This form of
acquiring information is limited in the case of Uganda. The Uganda Export Promotion
Council is an institution assigned to link exporters to market opportunities but its
function is limited by insufficient financing; exporters largely make their own initiatives
in acquiring market information mainly through other exporters, approaches from
overseas or while travelling abroad (Table 7).
Finance for exporting can be analysed in terms of availability, accessibility and
affordability both of short term and long term credit. Tight fiscal policy since 1987
eased pressures on monetary expansion and reduced inflation, reducing real rates of
interest. In Uganda, exporters have limited access to credit facilities, mainly because the
borrowing rate of interest is too high (relative to the deposit rate) for profitable exporting
business. The high cost of credit is attributed to inefficiency in the financial sector
(Harvey, 1993), reflected in a wide spread between lending and deposit rates of interest
(World Bank, 1991; EPAU, 1995a). Furthermore, commercial banks are reported as
being more reluctant to become involved in long-term lending to exporters, especially
for non-traditional exports that are perceived to be more risky.
Liberalisation of internal pricing and the foreign exchange market increased competition
and led to higher producer prices and prompt payment to farmers. The increased
producer prices provided an incentive for farmers to increase production of export crops.
24
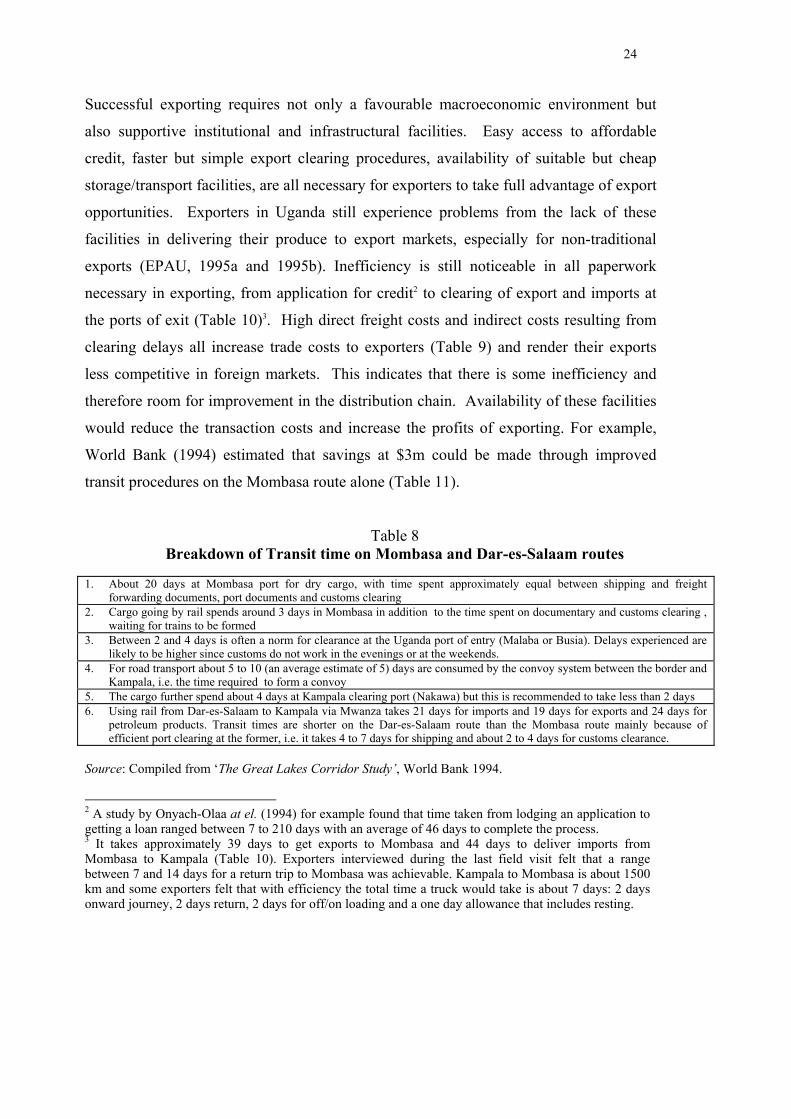
Successful exporting requires not only a favourable macroeconomic environment but
also supportive institutional and infrastructural facilities. Easy access to affordable
credit, faster but simple export clearing procedures, availability of suitable but cheap
storage/transport facilities, are all necessary for exporters to take full advantage of export
opportunities. Exporters in Uganda still experience problems from the lack of these
facilities in delivering their produce to export markets, especially for non-traditional
exports (EPAU, 1995a and 1995b). Inefficiency is still noticeable in all paperwork
necessary in exporting, from application for credit2 to clearing of export and imports at
the ports of exit (Table 10)3. High direct freight costs and indirect costs resulting from
clearing delays all increase trade costs to exporters (Table 9) and render their exports
less competitive in foreign markets. This indicates that there is some inefficiency and
therefore room for improvement in the distribution chain. Availability of these facilities
would reduce the transaction costs and increase the profits of exporting. For example,
World Bank (1994) estimated that savings at $3m could be made through improved
transit procedures on the Mombasa route alone (Table 11).
Table 8Breakdown of Transit time on Mombasa and Dar-es-Salaam routes
1. About 20 days at Mombasa port for dry cargo, with time spent approximately equal between shipping and freightforwarding documents, port documents and customs clearing
2. Cargo going by rail spends around 3 days in Mombasa in addition to the time spent on documentary and customs clearing ,waiting for trains to be formed
3. Between 2 and 4 days is often a norm for clearance at the Uganda port of entry (Malaba or Busia). Delays experienced arelikely to be higher since customs do not work in the evenings or at the weekends.
4. For road transport about 5 to 10 (an average estimate of 5) days are consumed by the convoy system between the border andKampala, i.e. the time required to form a convoy
5. The cargo further spend about 4 days at Kampala clearing port (Nakawa) but this is recommended to take less than 2 days6. Using rail from Dar-es-Salaam to Kampala via Mwanza takes 21 days for imports and 19 days for exports and 24 days for
petroleum products. Transit times are shorter on the Dar-es-Salaam route than the Mombasa route mainly because ofefficient port clearing at the former, i.e. it takes 4 to 7 days for shipping and about 2 to 4 days for customs clearance.
Source: Compiled from ‘The Great Lakes Corridor Study’, World Bank 1994.
2 A study by Onyach-Olaa at el. (1994) for example found that time taken from lodging an application togetting a loan ranged between 7 to 210 days with an average of 46 days to complete the process.3 It takes approximately 39 days to get exports to Mombasa and 44 days to deliver imports fromMombasa to Kampala (Table 10). Exporters interviewed during the last field visit felt that a rangebetween 7 and 14 days for a return trip to Mombasa was achievable. Kampala to Mombasa is about 1500km and some exporters felt that with efficiency the total time a truck would take is about 7 days: 2 daysonward journey, 2 days return, 2 days for off/on loading and a one day allowance that includes resting.
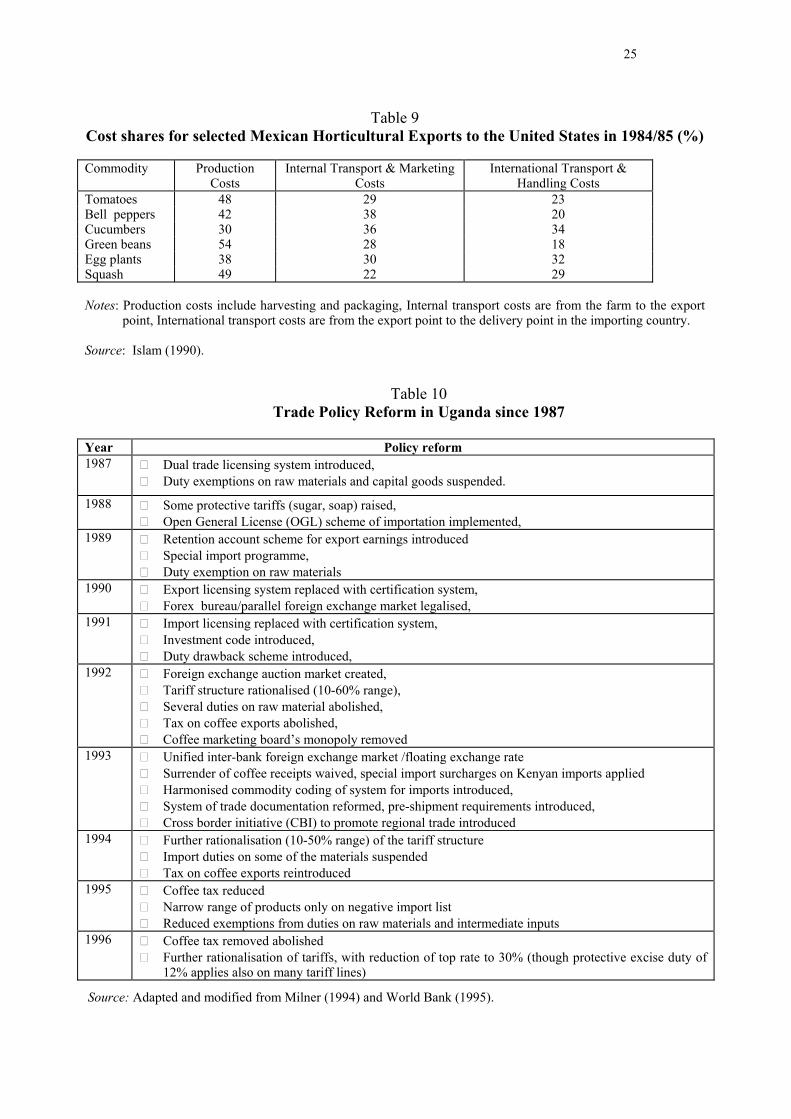
25
Table 9Cost shares for selected Mexican Horticultural Exports to the United States in 1984/85 (%)
Commodity ProductionCosts
Internal Transport & MarketingCosts
International Transport &Handling Costs
Tomatoes 48 29 23Bell peppers 42 38 20Cucumbers 30 36 34Green beans 54 28 18Egg plants 38 30 32Squash 49 22 29
Notes: Production costs include harvesting and packaging, Internal transport costs are from the farm to the exportpoint, International transport costs are from the export point to the delivery point in the importing country.
Source: Islam (1990).
Table 10Trade Policy Reform in Uganda since 1987
Year Policy reform1987 Dual trade licensing system introduced,
Duty exemptions on raw materials and capital goods suspended.
1988 Some protective tariffs (sugar, soap) raised,Open General License (OGL) scheme of importation implemented,
1989 Retention account scheme for export earnings introducedSpecial import programme,Duty exemption on raw materials
1990 Export licensing system replaced with certification system,Forex bureau/parallel foreign exchange market legalised,
1991 Import licensing replaced with certification system,Investment code introduced,Duty drawback scheme introduced,
1992 Foreign exchange auction market created,Tariff structure rationalised (10-60% range),Several duties on raw material abolished,Tax on coffee exports abolished,Coffee marketing board’s monopoly removed
1993 Unified inter-bank foreign exchange market /floating exchange rateSurrender of coffee receipts waived, special import surcharges on Kenyan imports appliedHarmonised commodity coding of system for imports introduced,System of trade documentation reformed, pre-shipment requirements introduced,Cross border initiative (CBI) to promote regional trade introduced
1994 Further rationalisation (10-50% range) of the tariff structure Import duties on some of the materials suspendedTax on coffee exports reintroduced
1995 Coffee tax reducedNarrow range of products only on negative import listReduced exemptions from duties on raw materials and intermediate inputs
1996 Coffee tax removed abolished Further rationalisation of tariffs, with reduction of top rate to 30% (though protective excise duty of12% applies also on many tariff lines)
Source: Adapted and modified from Milner (1994) and World Bank (1995).
26
Agricultural exports (both traditional and non-traditional) face special problems
(weather, etc.) in production and marketing processes. A high proportion of non-
traditional agricultural exports comprises perishable commodities, such as fruits and
vegetables, that are associated with high post-harvest transaction costs. These perishable
commodities must be refrigerated within a few hours of harvest and need refrigerated
storage facilities and trucks for transportation, through from producers to market centres,
to prevent any spoilage of the produce (Table 12). This illustrates the importance of
efficient infrastructure and market information. In order to market the export produce on
profitable terms, exporters must find a foreign buyer, where the process may involve
negotiating terms of exchange, transferring goods, monitoring and reinforcing, all of
which may be complex to exporters (Collins, 1995). Evidence from Uganda in this
regard suggests that refrigeration and processing is only undertaken in the fish industry
(EPAU, 1995b). Other exporting firms are constrained by a lack of cleaning and
refrigerated truck and storage facilities for perishable commodities and even for non-
perishable exports storage facilities are not adequate (Onyach-Olaa et al, 1994). This
lack of proper and adequate transport/storage facilities reduces quality and
competitiveness in the export market, and also generates losses of produce that reduce
the profit margin.
Transport infrastructure, internal and international, is an important factor in the chain
linking the exporter and the buyer. Once production is complete, export produce should
reach the market on time and in the right condition. To produce and deliver exports to
the market on schedule requires an efficient transport system. The reliability and speed
of transport is critical for a range of goods and becomes more important as one moves
from basic, bulk commodities to products which may be perishable, have a short shelf-
life or restricted market windows. Examples may include tropical fruits, vegetables and
horticulture, that all take windows of opportunity during the off-peak season in Europe.
To some extent, the impact of international transport (ocean freight costs) on trade has
been analysed, but inland transport costs are often ignored. The Mexican experience,
however, shows that internal transport costs are higher and constrain exports more than
international transport (Islam, 1990). For exporters in Uganda, the transport chain may
be divided into three phases. Produce has to be procured from the farm for the collecting
centres and then to the export point in Kampala. Then, produce has to be transported to
27
the seaport at Mombasa or Dar-es-Salaam (or Entebbe airport); and finally to overseas
export markets. Initially, Uganda used to export on fob Mombasa or Dar-es-Salaam
basis, but there has been a shift to exporting fot (free on truck or rail) from Kampala
recently. This has improved prompt payment to exporters and minimised the difficulties
and losses exporters would face in transporting produce to the seaport. Milner,
Morrissey and Rudaheranwa (1998) estimate the implicit ‘tax’ on exporters due to
transport inefficiencies.
Exporters pay transport costs when goods are sold on a cif basis while the importers pay
when prices are fob or fot. Who bears the burden of transport costs, however, depends on
relative elasticities of demand and supply for the export commodity being transported
(Laing, 1977; Amjadi and Yeats, 1995). When demand is inelastic relative to supply, the
burden of freight costs is born by an importer. Exports from Uganda face inelastic supply
relative to demand and therefore exporters can be expected to have to absorb a high
fraction of freight charges. It should be noted that Uganda is likely to face a relatively
elastic supply and inelastic demand for imports, and therefore will bear transport costs of
these, increasing costs of imported inputs.
In Uganda, poor transport infrastructure is perceived as a major constraint to exporters.
Results from the EPAU (1995b) survey of exporters show that high fuel costs and poor
roads, especially in the rainy season, were major concerns with regard to internal
transportation while international transport attracted high freight charges and losses due
to delays in transit (Table 9)4. Being a landlocked country, Uganda is naturally
disadvantaged and her exports are either ferried by surface transport through Kenya or
Tanzania and then by sea (some goods may be transported by air; while this relates only
to a small quantity of NTE exports at present, it may become increasingly important).
High freight costs reduce the local value added and a part of the export earnings that
could otherwise be spent on productive capacity-building is spent on (international)
transport. Uganda exports mainly unprocessed (low value added) commodities and
therefore freight cost are a relatively high proportion of export value. As processed
goods are generally lighter and less bulky than raw materials, one would expect that
exporting processed (higher value added) goods would save on transportation costs, 4 For example it takes about 40 and 37 days to transport export output by rail and road respectively fromKampala to Mombasa port (World Bank, 1994).
28
although evidence suggests this is not always the case.5 While there are probable benefits
to the Ugandan economy from moving up the processing chain and aiming to export
higher value added processed goods, this is unlikely to yield any gains in lowering unit
transport costs (relative to unit value). In fact, the desire to diversify exports, either into
NTEs or more processed products, is likely to increase the transport, infrastructural and
institutional needs of exporters. It is in this direction that export promotion policies in
Uganda should move.
5 CONCLUSIONS
The Ugandan economy has been transformed since 1987. A credible degree of
macroeconomic stability has been established and the trade and exchange rate regimes
have been significantly liberalised. This has contributed to business confidence and a
favourable trade environment. How effective have the reforms been in increasing the
incentives to exporters? The policy environment (Morrissey, 1997) for exporting has
greatly improved. Political stability and commitment to trade policy reform and
macroeconomic stability are in place, although administrative capacity (especially to
provide institutional support to exporters) is weak in many areas.
Uganda has made significant progress in reducing the anti-export bias in its trade policy.
Taxes on exports have been abolished (the stabilisation tax on coffee exports was a
temporary measure rescinded once world coffee prices fell from their 1995 peak), the
foreign exchange market is liberalised and exporters are allowed to retain their export
earnings. Import protection has also been reduced considerably; the maximum tariff has
been reduced from 50 per cent in 1992 to 20 per cent in 1997, and the unweighted
average tariff was only nine per cent in 1996. Furthermore, almost all non-tariff barriers
have been removed. These reforms have improved the incentive to export by increasing
the price of exportables relative to importables. As the reforms have been at a time of
considerable depreciation of the Ugandan Shilling, the cost of imported inputs has not 5 Empirical studies (Waters, 1970; Yeats, 1977; Clark, 1981; Amjadi & Yeats, 1995) show that asdeveloping countries move into processing their ad valorem shipping costs increase. This is attributed tothe institutional structure of the shipping industry (Hecht, 1997). Marine shipping is mainly carried byliners or tramps. Tramps handle bulk and are affordable to exporters that can fill the shipping capacity. Incontrast, liners transport small quantities and handle fragile or perishable processed goods. Developingcountry exporters of processed goods often rely on the liners because of the nature and size of theirshipment. To the extent that liners handle small and non-containerised cargo and are organised in cartels,they charge higher freight rates. As a result shipping costs facing developing countries often rise whenthey move into exporting processed goods.
29
fallen in line with tariff reductions. In terms of trade policy, progress has been
commendable and the likelihood is for further slight reductions in protection of imports.
However, while the relative incentives to exporting have improved, export earnings have
not risen in line with the cost of imports. The real problem facing Ugandan attempts to
increase export earnings is its dependency on a few primary commodities and the fact
that it is a price taker on world markets. Uganda can do nothing to influence world
prices for primary commodities and for the foreseeable future its export performance
will depend on the world price for coffee. Uganda can take measures to encourage
export diversification, both in terms of quality and niche markets for traditional
commodities and in terms of encouraging non-traditional exports. Trade policy reforms
are only part of such a strategy. Improved infrastructure and institutional support are an
important component of export support, to reduce the adverse effects of natural barriers.
Uganda can do more to encourage exports, but now needs to turn to more direct export
promotion (or support) measures. This does not mean subsidies. Rather it means
investment in improving the efficiency, and reducing the costs, of transport, distribution
and storage. This is especially important if there is to be an increase in non-traditional
exports of perishable commodities such as cut flowers or beans. When exporters are
asked to state the principal constraint to exporting, they commonly respond that
information and institutional support are inadequate. These are linked and the
government can help. Many Ugandan exporters are small-scale enterprises that are not
themselves equipped to get information on marketing opportunities in, for example,
different European countries, the legal and quality requirements to export, the
distribution networks overseas, etc. An export promotion agency would be most helpful
if it could provide such information, advice and technical support. Another area where
government can help is in providing export credit guarantees and insurance, and through
general investment in improving infrastructure.
The central theme of this paper has been that the Ugandan government has implemented
most of the trade policy reforms required to eliminate the bias against exports, but this
alone is insufficient to improve export performance. Export diversification is the key to
the long-term improvement in export earnings, but is a slow process. Uganda is a land-
locked country and transport costs play an important role in exporting. Its geographical
30
location is a ‘natural’ barrier to exporting, but the cost can be alleviated by improving
transport efficiency. For internal transport, from producer to point of export, Uganda
can itself invest in infrastructure. This includes storage and, for some products,
exporting can be by air from Entebbe. For many products, notably traditional exports,
transport will be through Kenya or Tanzania. This is somewhat beyond Uganda’s
control, although progress on the EAC should help. In a companion paper (Milner,
Morrissey and Rudaheranwa, 1998) we estimate the implicit tax on exporters associated
with transport inefficiencies and demonstrate that it is indeed a high cost. We can
conclude this paper by reiterating that the principal trade policy reforms have been
implemented, and the policy environment is now right for export support, through
investment in infrastructure and institutional support.
31
References
Amjadi, A. and A. Yeats (1995), ‘Have transport costs contributed to the relative decline
of sub-Saharan African exports? Some preliminary empirical evidence’, Washington
DC: The World Bank, Policy Research Working Paper 1559.
Background to the Budget (various years), Kampala: Ministry of Finance, Planning and
Economic Development.
Clark, D. P. (1981), ‘Protection by International Transport Charges; Analysis by Stages
of Fabrication’, Journal of Development Economics, 8, 339-345.
Collins, J. L., (1995), ‘Farm size and non-traditional exports: Determinants of
Participation in World Markets’, World Development, 23: 7, 1103-1114.
Egan, M. and A. Mody (1992), ‘Buyer-Seller Links in Export Development’, World
Development, 20: 3, 321-334.
EPAU (1995a), ‘A review of credit facilities for agriculture and export finance: with
special focus on non-traditional agricultural exports’, Kampala: Ministry of Finance
and Economic Planning, EPAU Policy Paper No. 4.
EPAU (1995b), Exporters’ Survey 1995: Impact of government policy on exports with a
focus on NTAEs, Kampala: Export Policy Analysis Unit, Ministry of Finance and
Economic Planning.
Folke, S., N. Fold and T. Enevoldsen (1993), South-South Trade Development;
Manufactures in the new international Division of labour, London: Macmillan Press.
Harvey, C. (1993), ‘The Role of Commercial Banking in Recovery from Economic
Disaster in Ghana, Tanzania, Uganda and Zambia’, Brighton: Institute of
Development Studies, IDS Discussion Paper 325.
Hecht, J. E. (1997), ‘Impacts of Tariff Escalation on the Environment: Literature Review
and Synthesis’, World Development, 25: 10, 1701-1716.
Henstridge, N. M. (1995) Coffee and Money in Uganda: An Econometric analysis,
unpublished PhD Thesis, Exeter College Oxford.
IMF (1998), Uganda Policy Framework Paper 1997/98 – 1999/2000, Washington, DC:
International Monetary Fund.
International Development Consultants (1997), Draft Final Report: East African Tariff
Harmonisation Study, Kampala: IDC (mimeo).
Islam, N. (1990), ‘Horticultural exports of developing countries: Past performances,
future prospects, and policy issues’, Washington DC: International Food Policy
Research Institute, IFPRI Research Report 80.
32
Jones D. R. (1992), Uganda: Study on the Development of Selected Non-traditional
Horticultural Exports, Draft Final Report Prepared by Export Development
Consultants (David Jones and Associates) May/June 1992.
Kreinin, M. (1967), ‘Devaluation and the Income Terms of Trade’, Kyklos, 20, 487-491.
Kyamuhangire, W. (1992), ‘Postharvest Handling, Transport and Storage of Thirteen
Crops’, in Exporters Handbook 1992, Kampala: Ministry of Finance and Economic
Planning, EPADU.
Laing, E. (1977), ‘Shipping Freight Rates for Developing Countries; Who Ultimately
Pays?’, Journal of Transport Economics and Policy (September), 262-275.
McKay, A., O. Morrissey and C. Vaillant (1997), ‘Trade Liberalisation and Agricultural
Supply Response: Issues and Some Lessons’, European Journal of Development
Research, 9:2, 129-147.
Milner, C. (1994), ‘Trade Policy, Investment and Export Incentives in Uganda: A
Background Report for Uganda Country Economic Memorandum, 1994’, CREDIT,
University of Nottingham (mimeo).
Milner, C. and O. Morrissey (1997), ‘Measuring Trade Liberalisation in Africa’,
CREDIT Research Paper 97/3 (CDP01), University of Nottingham.
Milner, C., O. Morrissey and N. Rudaheranwa (1998), ‘Protection, Trade Policy and
Transport Costs: Effective Taxation of Ugandan Exporters’, CREDIT Research
Paper 98/13 (CDP07), University of Nottingham.
Morrissey, O. (1997), ‘Identifying the Policy Environment for Economic Policy
Reform’, CREDIT Research Paper 97/8 (CDP03), University of Nottingham.
Onyach-Olaa, M. and W. Parmena (1994), ‘Investment Incentives and Export
Promotion: A Comparative Analysis Between Uganda and Kenya’, Kampala:
EPADU (mimeo).
Sharer, R., R. De Zoysa and H. McDonald (1995), ‘Uganda: Adjustment with Growth,
1987-94’, Washington DC: International Monetary Fund, Occasional Paper 121.
Statistical Abstract (various years), Entebbe: Ministry of Finance, Planning and
Economic Development.
Teigeiro, J. and R. Elson (1979), ‘The export promotion system and the growth of minor
exports in Columbia’, IMF Staff Papers, 20, 419-470.
The Financial Gazette (Zimbabwe) 1997, “Trade Fair Effective Form of Promotion,”
ZITF Supplement to The Financial Gazette, April 24, 1997.
33
UCDA (1995), Quarterly Report: Third Quarter (March-June 1995) 1994/95 Coffee
Season, Kampala: Uganda Coffee Development Authotity.
Waters II, W. (1970), ‘Transport Costs, Tariffs, and the Pattern of Industrial Protection’,
American Economic Review, 60,1013-1020.
World Bank (1991), Uganda: Export Diversification Strategy, Washington DC: Eastern
Africa Department, The World Bank,.
World Bank (1994), Africa; the Great Lakes Corridor study, Washington DC: Energy
and Infrastructure Operations Division, Eastern Africa Department, The World Bank.
World Bank (1995), Uganda: The Challenge of Growth and Poverty Reduction,
Washington DC: Eastern Africa Department, The World Bank.
WTO (1995), Trade Policy Review: Uganda 1995, Volumes I and II, Geneva: World
Trade Organisation.
Yeats, A. J. (1977), ‘A Comparative Analysis of the Incidence of Tariffs and
Transportation Costs on India’s Exports’, Journal of Development Studies, 14: 14,
97-107.
34
Appendix
Table 1 Ugandan Economic Indicators, 1987-1994
1987 1988 1989 1990 1991 1992 1993 1994Annual growth rates:Real GDP 1.0 7.7 6.5 5.5 4.4 2.6 7.2 4.5Money Supply (M2) 95.0 202.9 122.4 56.0 46.8 53.4 42.0 33.4Inflation rate 256 180.1 102.2 48.1 24.5 42.2 28.3 6.5As % GDP:Agriculture 54.1 54.2 53.9 52.6 50.2 50.6 49.0Industry 12.5 12.2 12.3 12.9 13.8 13.7 14.7Manufacturing 5.3 5.5 5.6 5.8 6.6 6.5 7.1Services 33.4 33.6 33.8 34.6 36.0 35.7 36.4Gross Domestic Investment 9.2 11.6 12.7 13.0 16.3 16.5 16.3 16.4Gross Domestic Savings -12.6 -10.6 -8.4 -3.4 -1.1 1.0 -0.7 2.2Public Sector Balance -4.6 -5.8 -5.2 -6.4 -7.9 -14.5 -12.6 -10.9Net foreign financing 0.5 2.2 2.2 6.6 3.6 5.2 5.2 6.4Domestic bank financing 4.3 2.0 1.4 -1.4 0.2 1.9 -0.4 -0.8non-bank financing - - 0.1 -0.2 0.3 0.2 -0.2 0.2As % Exports:External debt 309 563 626 895 1246 1358 1301 910Debt Service Ratio 54.0 62.0 74.0 81.0 95.9 127.7 85.1 56.5
Foreign Exchange reserves 0.7 0.7 0.8 0.5 1.3 2.2 1.8 2.9Real EER 558 435 485 569 931 1215 1333 -
Notes: Debt variables are percentages of exports of goods and services. Foreign exchange reserves are in months ofimports of goods and non-factor services. A rise in real effective exchange rate (EER) implies depreciation.Sector shares in GDP are for financial years; for example, 1991 refers to 1991/92.
Sources: Sharer et al. (1995), WTO (1995), World Bank 1995.
35
Table 2 Uganda’s Export Composition, 1989-1995
Commodity Commodity exports (% total)1989 1990 1991 1992 1993 1994 1995
Coffee - 80.3 64.2 65.0 53.1 74.6 69.3Other TE - 7.0 12.6 13.5 11.7 4.2 4.7TE 90.9 87.3 76.8 78.5 64.8 78.8 74.0Fish - 0.8 2.9 4.4 4.6 2.3 3.2SS - 3.0 5.7 4.4 1.4 0.3 1.0Maize - 1.9 2.3 2.7 11.6 6.2 3.5Beans - 2.4 2.3 1.9 6.3 2.8 2.0Other NTE - 6.0 10.4 8.6 12.5 8.6 17.5NT E 8.9 14.1 23.6 22.0 35.2 20.2 27.2
Notes: Other traditional exports (TE): tea, cotton and tobacco; SS, Sesame seeds; NTE, non-traditional exports mainly agricultural commodities. Figures may not add up to 100% due torounding.
Source: Uganda Statistical Abstract 1996.
Table 3 Traditional Agricultural Exports, 1982-1993
Coffee Tea Cotton TobaccoPeriod Tonnes US$/Kg Tonnes US$/Kg Tonnes US$/Kg Tonnes US$/Kg1982 174700 2.00 1200 0.67 1800 1.78 0 01983 144300 2.40 1300 0.92 7000 1.60 700 1.291984 133200 2.70 2500 1.32 6700 1.81 700 2.141985 151500 2.30 1200 0.83 9553 1.46 300 1.331986 140800 2.80 2800 1.11 4875 1.04 0 01987 148153 2.08 2100 0.90 3443 1.19 0 01988 144254 1.84 3079 1.00 2088 1.42 39 1.491989 176453 1.49 3195 1.00 2321 1.73 490 1.161990 141489 0.99 4760 0.75 3038 1.52 2268 1.241991 124819 0.94 7018 1.00 7819 1.50 2467 1.901992 119066 0.80 7816 1.00 7536 1.50 2322 1.901993 114133 0.94 10178 1.00 2483 1.50 4109 1.90
Source: Background to the Budget 1994-95.
36
Table 5 Perceptions on export promotion measures
Response Foreign Exchange Retention Exchange rate liberalisation Export Certification% 1992/93 1994/95 1992/93 1994/95 1992/93 1994/95
Satisfied 72 72 90 88 88 80Not satisfied 28 17 10 5 12 16Not specified - 11 - 7 - 4
Note: Figures given are percentage of sample of exporters.
Source: EPAU (1995b).
Table 6 Reported Problems facing Ugandan Exporters
Nature of problem Exports within PTA Exports outside PTA1992-93 1994-95 1994-95
Inadequate market information 35 25 30Inadequate institutional support 10 10 4Unreliable importers 11 10 6Difficulties in payments 17 10 11Difficulties in meeting export requirements 17 10 27Prices are not competitive 28 18 31Others 6 5 4Sources of information to exporters 1992-93 1993-94Approaches from overseas 30 37Opportunities discovered while travelling abroad 35 32Promotion by local institution 8 7Discovered opportunities from other exporters 47 32Others 12 24
Note: Figures given are percentage of sample of exporters.
Source: EPAU (1995b).
Table 7 Awareness and Use of Credit Facilities
Type of credit Awareness Usage1992/93 1994/95 1992/93 1994/5
Crop finance 27 19 3 4Export refinance scheme 48 25 11 5Development Bank Scheme 40 31 16 8Other 9 6 2 2
Note: Figures given are percentage of sample of exporters.
Source: EPAU (1995b).
37
Table 8 Transport Costs from Kampala to the Seaport
Imports Exports Petroleum, oil and Lubricant(POL)
US$m % cif US$m % cif US$m % cifTime delays 6.8 2.0 2.1 1.9 0.51 0.8Losses 3.3 1.0 1.1 1.0 0.10 0.2Total 10.1 3.0 3.2 2.9 0.61 1.0
Transit costs of break bulk imports in 1988 and 1993 (US$/tonne in 1988 prices)From Mombasa From Dar-es-Salaam
All road Rail/Ferry Rail/Ferry1988 1993 1988 1993 1988 1993
Direct costs 112 98 67 71 107 70Indirect Costs 14 18 38 17 103 18Total costs 126 105 105 88 210 88
Notes: The time taken for shipping exports to Mombasa seaport ranges between 40 and 44 daysdepending on the route and mode of transport used while that of imports ranges between 42to 46 days. Most of dry cargo exports and imports are ferried mainly through Mombasa butcoffee uses both seaports while POL imports dominate the Dar-es-Salaam route. The surfacetransport system is composed of either rail and road at times combining with the ferry or acombination of the three modes. Rail/ferry transport incur low direct transport costs thanroad transport but faces high indirect costs simply because long delays.
Sources: Compiled from ‘The Great Lakes Study’, World Bank 1994.
Table 9 Breakdown of Transit time on Mombasa and Dar-es-Salaam routes
1. About 20 days at Mombasa port for dry cargo, with time spent approximately equal between shipping and freightforwarding documents, port documents and customs clearing
2. Cargo going by rail spends around 3 days in Mombasa in addition to the time spent on documentary and customs clearing ,waiting for trains to be formed
3. Between 2 and 4 days is often a norm for clearance at the Uganda port of entry (Malaba or Busia). Delays experienced arelikely to be higher since customs do not work in the evenings or at the weekends.
4. For road transport about 5 to 10 (an average estimate of 5) days are consumed by the convoy system between the border andKampala, i.e. the time required to form a convoy
5. The cargo further spend about 4 days at Kampala clearing port (Nakawa) but this is recommended to take less than 2 days6. Using rail from Dar-es-Salaam to Kampala via Mwanza takes 21 days for imports and 19 days for exports and 24 days for
petroleum products. Transit times are shorter on the Dar-es-Salaam route than the Mombasa route mainly because ofefficient port clearing at the former, i.e. it takes 4 to 7 days for shipping and about 2 to 4 days for customs clearance.
Source: Compiled from ‘The Great Lakes Corridor Study’, World Bank 1994.
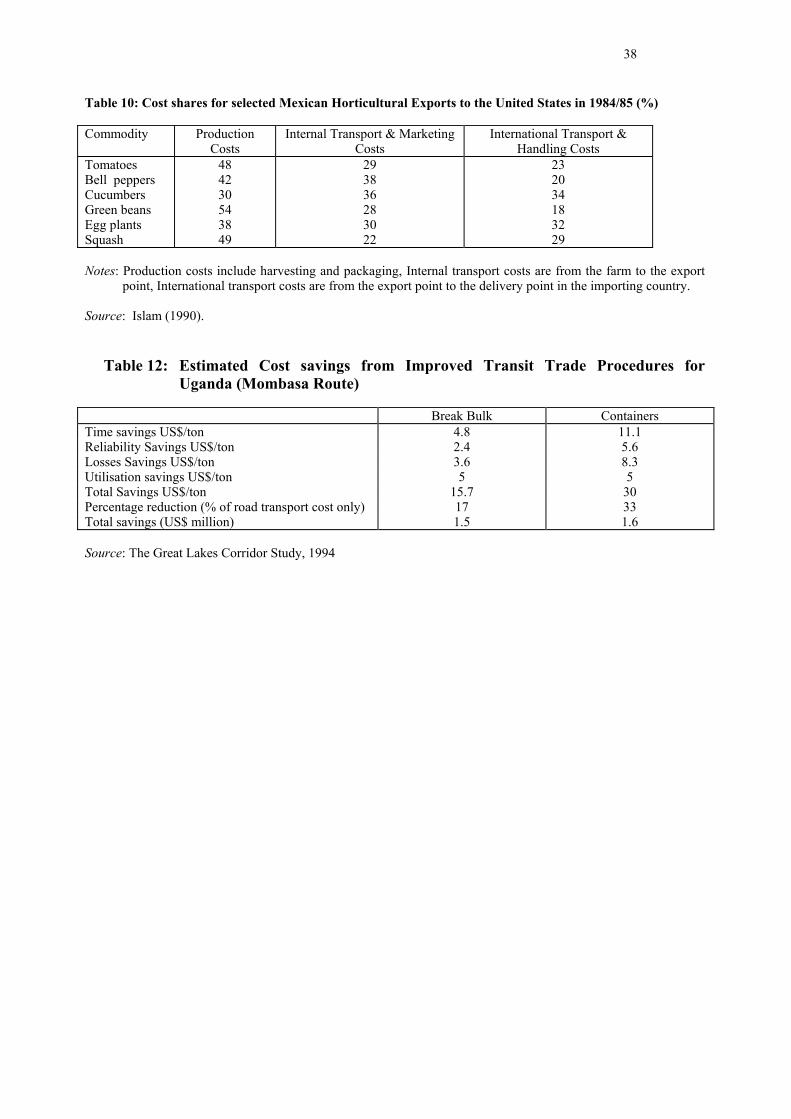
38
Table 10: Cost shares for selected Mexican Horticultural Exports to the United States in 1984/85 (%)
Commodity ProductionCosts
Internal Transport & MarketingCosts
International Transport &Handling Costs
Tomatoes 48 29 23Bell peppers 42 38 20Cucumbers 30 36 34Green beans 54 28 18Egg plants 38 30 32Squash 49 22 29
Notes: Production costs include harvesting and packaging, Internal transport costs are from the farm to the exportpoint, International transport costs are from the export point to the delivery point in the importing country.
Source: Islam (1990).
Table 12: Estimated Cost savings from Improved Transit Trade Procedures forUganda (Mombasa Route)
Break Bulk ContainersTime savings US$/ton 4.8 11.1Reliability Savings US$/ton 2.4 5.6Losses Savings US$/ton 3.6 8.3Utilisation savings US$/ton 5 5Total Savings US$/ton 15.7 30Percentage reduction (% of road transport cost only) 17 33Total savings (US$ million) 1.5 1.6
Source: The Great Lakes Corridor Study, 1994
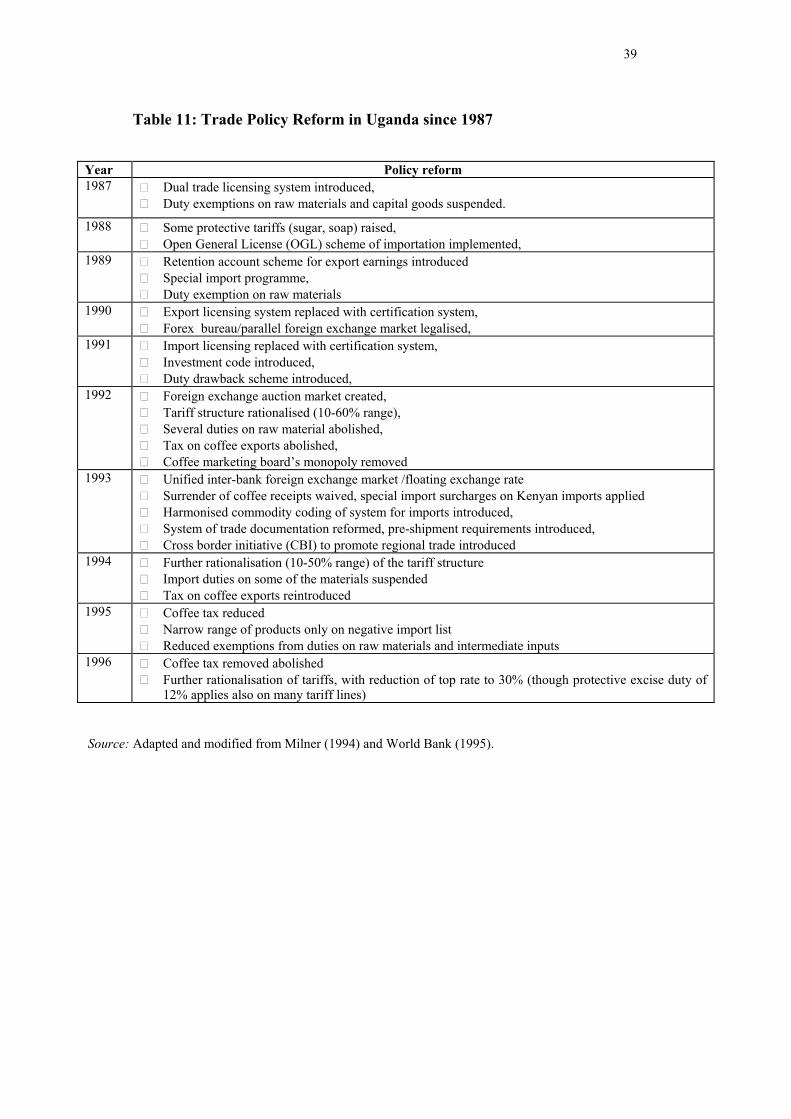
39
Table 11: Trade Policy Reform in Uganda since 1987
Year Policy reform1987 Dual trade licensing system introduced,
Duty exemptions on raw materials and capital goods suspended.
1988 Some protective tariffs (sugar, soap) raised,Open General License (OGL) scheme of importation implemented,
1989 Retention account scheme for export earnings introducedSpecial import programme,Duty exemption on raw materials
1990 Export licensing system replaced with certification system,Forex bureau/parallel foreign exchange market legalised,
1991 Import licensing replaced with certification system,Investment code introduced,Duty drawback scheme introduced,
1992 Foreign exchange auction market created,Tariff structure rationalised (10-60% range),Several duties on raw material abolished,Tax on coffee exports abolished,Coffee marketing board’s monopoly removed
1993 Unified inter-bank foreign exchange market /floating exchange rateSurrender of coffee receipts waived, special import surcharges on Kenyan imports appliedHarmonised commodity coding of system for imports introduced,System of trade documentation reformed, pre-shipment requirements introduced,Cross border initiative (CBI) to promote regional trade introduced
1994 Further rationalisation (10-50% range) of the tariff structure Import duties on some of the materials suspendedTax on coffee exports reintroduced
1995 Coffee tax reducedNarrow range of products only on negative import listReduced exemptions from duties on raw materials and intermediate inputs
1996 Coffee tax removed abolished Further rationalisation of tariffs, with reduction of top rate to 30% (though protective excise duty of12% applies also on many tariff lines)
Source: Adapted and modified from Milner (1994) and World Bank (1995).
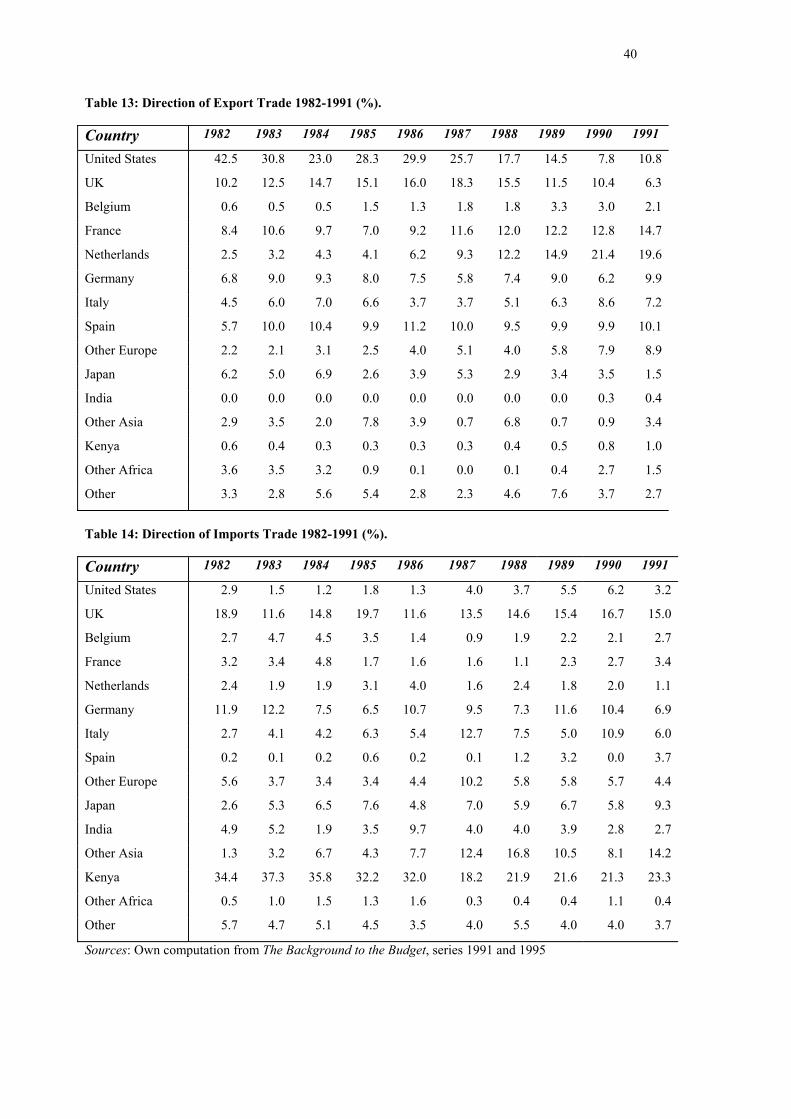
40
Table 13: Direction of Export Trade 1982-1991 (%).
Country 1982 1983 1984 1985 1986 1987 1988 1989 1990 1991
United States 42.5 30.8 23.0 28.3 29.9 25.7 17.7 14.5 7.8 10.8
UK 10.2 12.5 14.7 15.1 16.0 18.3 15.5 11.5 10.4 6.3
Belgium 0.6 0.5 0.5 1.5 1.3 1.8 1.8 3.3 3.0 2.1
France 8.4 10.6 9.7 7.0 9.2 11.6 12.0 12.2 12.8 14.7
Netherlands 2.5 3.2 4.3 4.1 6.2 9.3 12.2 14.9 21.4 19.6
Germany 6.8 9.0 9.3 8.0 7.5 5.8 7.4 9.0 6.2 9.9
Italy 4.5 6.0 7.0 6.6 3.7 3.7 5.1 6.3 8.6 7.2
Spain 5.7 10.0 10.4 9.9 11.2 10.0 9.5 9.9 9.9 10.1
Other Europe 2.2 2.1 3.1 2.5 4.0 5.1 4.0 5.8 7.9 8.9
Japan 6.2 5.0 6.9 2.6 3.9 5.3 2.9 3.4 3.5 1.5
India 0.0 0.0 0.0 0.0 0.0 0.0 0.0 0.0 0.3 0.4
Other Asia 2.9 3.5 2.0 7.8 3.9 0.7 6.8 0.7 0.9 3.4
Kenya 0.6 0.4 0.3 0.3 0.3 0.3 0.4 0.5 0.8 1.0
Other Africa 3.6 3.5 3.2 0.9 0.1 0.0 0.1 0.4 2.7 1.5
Other 3.3 2.8 5.6 5.4 2.8 2.3 4.6 7.6 3.7 2.7
Table 14: Direction of Imports Trade 1982-1991 (%).
Country 1982 1983 1984 1985 1986 1987 1988 1989 1990 1991
United States 2.9 1.5 1.2 1.8 1.3 4.0 3.7 5.5 6.2 3.2
UK 18.9 11.6 14.8 19.7 11.6 13.5 14.6 15.4 16.7 15.0
Belgium 2.7 4.7 4.5 3.5 1.4 0.9 1.9 2.2 2.1 2.7
France 3.2 3.4 4.8 1.7 1.6 1.6 1.1 2.3 2.7 3.4
Netherlands 2.4 1.9 1.9 3.1 4.0 1.6 2.4 1.8 2.0 1.1
Germany 11.9 12.2 7.5 6.5 10.7 9.5 7.3 11.6 10.4 6.9
Italy 2.7 4.1 4.2 6.3 5.4 12.7 7.5 5.0 10.9 6.0
Spain 0.2 0.1 0.2 0.6 0.2 0.1 1.2 3.2 0.0 3.7
Other Europe 5.6 3.7 3.4 3.4 4.4 10.2 5.8 5.8 5.7 4.4
Japan 2.6 5.3 6.5 7.6 4.8 7.0 5.9 6.7 5.8 9.3
India 4.9 5.2 1.9 3.5 9.7 4.0 4.0 3.9 2.8 2.7
Other Asia 1.3 3.2 6.7 4.3 7.7 12.4 16.8 10.5 8.1 14.2
Kenya 34.4 37.3 35.8 32.2 32.0 18.2 21.9 21.6 21.3 23.3
Other Africa 0.5 1.0 1.5 1.3 1.6 0.3 0.4 0.4 1.1 0.4
Other 5.7 4.7 5.1 4.5 3.5 4.0 5.5 4.0 4.0 3.7
Sources: Own computation from The Background to the Budget, series 1991 and 1995
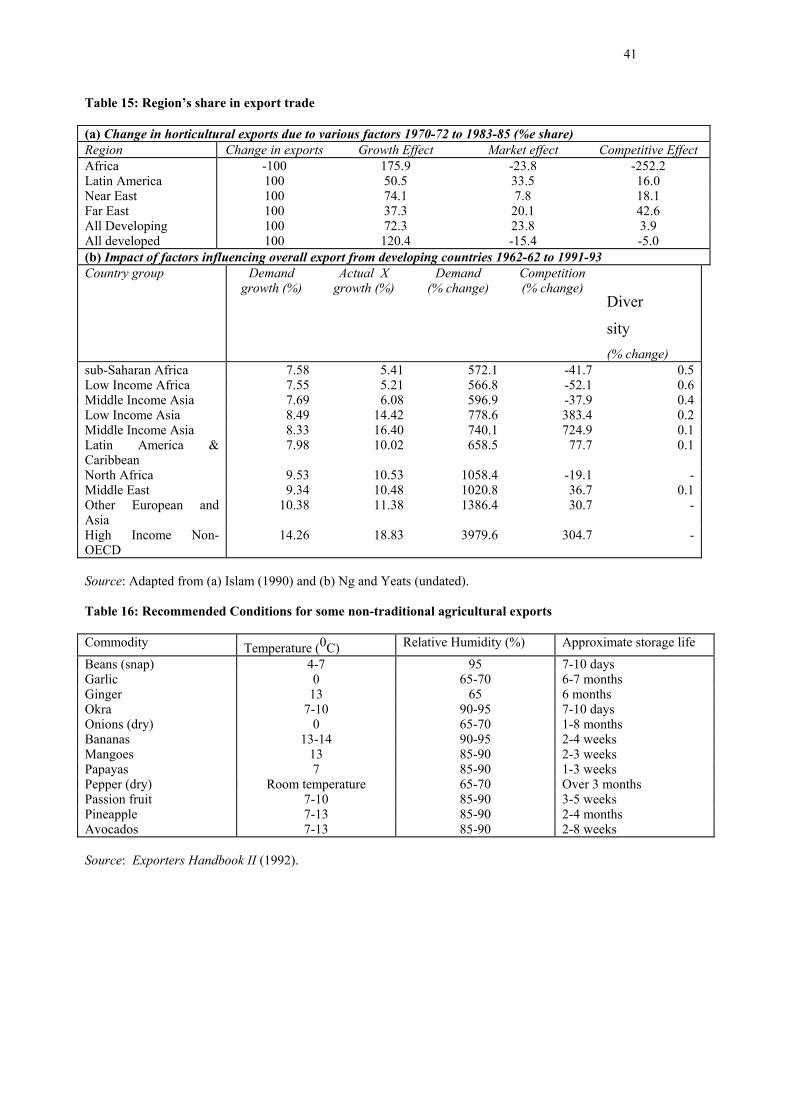
41
Table 15: Region’s share in export trade
(a) Change in horticultural exports due to various factors 1970-72 to 1983-85 (%e share) Region Change in exports Growth Effect Market effect Competitive EffectAfrica -100 175.9 -23.8 -252.2Latin America 100 50.5 33.5 16.0Near East 100 74.1 7.8 18.1Far East 100 37.3 20.1 42.6All Developing 100 72.3 23.8 3.9All developed 100 120.4 -15.4 -5.0(b) Impact of factors influencing overall export from developing countries 1962-62 to 1991-93 Country group Demand
growth (%)Actual X
growth (%)Demand
(% change)Competition(% change)
Diver
sity(% change)
sub-Saharan Africa 7.58 5.41 572.1 -41.7 0.5Low Income Africa 7.55 5.21 566.8 -52.1 0.6Middle Income Asia 7.69 6.08 596.9 -37.9 0.4Low Income Asia 8.49 14.42 778.6 383.4 0.2Middle Income Asia 8.33 16.40 740.1 724.9 0.1Latin America &Caribbean
7.98 10.02 658.5 77.7 0.1
North Africa 9.53 10.53 1058.4 -19.1 -Middle East 9.34 10.48 1020.8 36.7 0.1Other European andAsia
10.38 11.38 1386.4 30.7 -
High Income Non-OECD
14.26 18.83 3979.6 304.7 -
Source: Adapted from (a) Islam (1990) and (b) Ng and Yeats (undated).
Table 16: Recommended Conditions for some non-traditional agricultural exports
Commodity Temperature (0C) Relative Humidity (%) Approximate storage life
Beans (snap) 4-7 95 7-10 daysGarlic 0 65-70 6-7 monthsGinger 13 65 6 monthsOkra 7-10 90-95 7-10 daysOnions (dry) 0 65-70 1-8 monthsBananas 13-14 90-95 2-4 weeksMangoes 13 85-90 2-3 weeksPapayas 7 85-90 1-3 weeksPepper (dry) Room temperature 65-70 Over 3 monthsPassion fruit 7-10 85-90 3-5 weeksPineapple 7-13 85-90 2-4 monthsAvocados 7-13 85-90 2-8 weeks Source: Exporters Handbook II (1992).