Embed Size (px)
Citation preview

Canagliflozin:Background and Evidence Update
Inass Shaltout
Cairo University

Diabetes is a huge and growing problem, and the costs to society are high and escalating
Diabetes is a neglected development issue, affecting all countries
There are cost-effective solutions to reverse the global diabetes epidemic
Diabetes is not only a health issue, its causes are multi-sectoral and it requires a multi-sectoral response

2014
Diabetes is a huge and growing problem…
2035
… and the costs to society are high and escalating
Diabetes is a human and economic burden
4.9 million deaths per year
50% of deaths under 60 years of age
Intersects with all dimensions of development
US$612 billion
11% of worldwide healthcare expenditure


For Egypt the IDF updates Egypt ranking to be the 9th in the the number of people with diabetes (20-79 years), with 7.5 Millions 2014 (Vs. 4.78 Million in 2010) and to be at the 6th position with 13.1 Million in 2030

Is there a need for a new antidiabetic ?

Two thirds of individuals do not achieve target A1c
despite dedicated efforts to achieve glycemic control
1. Liebl A, et al. Diabetologia. 2002;45(7):S23-S28.
EuropeCODE-2 study - HbA1c goal 6.5%

Pathophysiology of Diabetes:
The Ominous Octet

The Triumvirate
Liver hepatic glucose
production
Muscle and
adipose tissue Insulin-dependent
glucose uptake by
adipose tissue and
muscle
PancreasImpaired insulin
secretion by
pancreatic -cells
Ralph DeFronzo: Banting Lecture ADA June 2008.

The Septet
Liver hepatic glucose
production
Muscle and
adipose tissue Insulin-dependent
glucose uptake by
adipose tissue and
muscle
PancreasImpaired insulin
secretion by
pancreatic -cells
Ralph DeFronzo: Banting Lecture ADA June 2008.
Increased
Lipolysis
Decreased
Incretin
EffectPancreatic
alpha cells
KidneyIncreased glucose
reabsorption

The Role of the Kidney in Diabetes

The Kidney and Glucose
•The kidney
–Plays a significant role in glucose homeostasis under both physiological and pathological conditions
–Contributes to, and regulates blood glucose levels via three mechanisms:
• Glucose utilization
• Gluconeogenesis
• Glucose reabsorption following glomerular filtration
Marsenic, O. (2009) Am J Kidney Dis. 53(5):875-83Gerich, J.E. (2010) Diabet Med. 27(2):136-42

Glomerular Filtration and Glucose Reabsorption
Marsenic, O. (2009) Am J Kidney Dis. 53(5):875-83Gerich, J.E. (2010) Diabet Med. 27(2):136-42
SGLT2• Primarily expressed in kidney• Responsible for majority of renal
glucose reabsorption
SGLT1• Responsible for small portion of
renal glucose reabsorption• Prominent role in intestinal glucose
absorption

Major SGLT Glucose Transporters
Modified from Lee YJ. et al. Kidney Int Suppl. 2007;72:S27-S35.
Characteristic SGLT1 SGLT2
Major sites of expression Intestine & kidney Kidney
Sugar specificity Glucose or galactose Glucose
Main role
Dietary absorption of glucose and galactose
Renal glucose reabsorption
Renal glucose reabsorption
Renal locationLate proximal straight tubule
(distal S2/3 segment)Early proximal convoluted tubule
(S1/S2 segment)
Affinity for glucose (Km) High (0.4 μM) Low (2 μM)
Capacity for glucose transport
Low High
% Renal glucose reabsorption
10% 90%

Glucose Transport in Tubular Epithelial Cells
G Glucose
Na+ Sodium
K Potassium
BloodLumen
S1 Proximal Tubule
G
Na+
KGLUT2
ATPase
SGLT2High
CapacityLow
Affinity
BloodLumen
S3 Proximal Tubule
G
2Na+
2KGLUT1
ATPase
SGLT1Low
CapacityHigh
Affinity
Adapted from Bakris GL et al. Kidney Int 2009;75:1272-7Marsenic O. Am J Kidney Dis. 2009;53:875-83

Glucose Reabsorption in a Nondiabetic Person (Plasma Glucose <10 mmol/L )
Glomerulus Proximal Convoluted Tubule
Glucose reabsorption into tissue
Early Distal
Glucose SGLT1SGLT2
Urine
Adapted with permission from Rothenberg PL et al. SGLT = sodium-glucose linked co-transporter.Rothenberg PL et al. Poster presented at EASD 2010; Stockholm, Sweden

Glucose Reabsorption in a Person With T2DM (Plasma Glucose >10 and <13.3 mmol/L)
Glomerulus Proximal Convoluted Tubule
Increased glucose reabsorption into tissue compared to normal
Early Distal
Urine
Adapted with permission from Rothenberg PL et al. SGLT = sodium-glucose linked co-transporter.Rothenberg PL et al. Poster presented at EASD 2010; Stockholm, Sweden
Glucose SGLT1SGLT2

Urin
ary G
luco
se
Excreti
on
(g/d
)
0
100
50
25
0
Plasma Glucose (mmol/L)
150
75
125
1412108642
Below RTG
Minimal Glucosuria OccursAbove RTG
Glucosuria Occurs
Healthy RTG
~10 mmol/L
The Renal Glucose Threshold (RTG) Concept• Maximum plasma glucose concentration at which kidneys reabsorb
glucose back into the blood
• When glucose levels exceed the RTG, excess glucose is eliminated from the body through urinary glucose excretion
• Usual RTG in healthy subjects reported to be up to 10-11 mmol/L
Polidori D et al.. Poster presented at EASD 2010; Stockholm, Sweden

Urin
ary G
luco
se E
xcreti
on
(g/d
ay)
0
75
100
50
150
Plasma Glucose (mmol/L)
125
25
4 6 8 1610 14
Below RTG minimal glucosuria occurs
12
Healthy RTG
T2DMRTG
Above RTG glucosuria occurs
~13.8 mmol/L~10 mmol/L
The Renal Glucose Threshold (RTG) is Increased in Subjects with Type 2 Diabetes
Polidori D et al. Poster presented at ADA 2010; Orlando, Florida.Polidori D et al. Poster presented at EASD 2010; Stockholm, Sweden.
• Renal glucose reabsorption is increased in diabetes, which could contribute to further increasing plasma glucose levels

SGLT2 and Familial Renal Glucosuria
• Familial renal glucosuria (FRG) characterised by
– Persistent glucosuria
• No hyperglycaemia or renal tubular dysfunction
– Absence of clinical manifestations (aka benign glucosuria)
– Autosomal recessive or dominant inheritance (variable penetrance)
– Wide range of SLC5A2 (SGLT2) mutations identified
– Historically, divided into:
• Type A FRG
– Low renal threshold for glucose, low maximum tubular glucose reabsorption
• Type B FRG– Low renal threshold for glucose, can reach normal maximum glucose reabsorption
• Type O FRG (most severe form)
– Absence of renal glucose reabsorption
Santer, R. et al. (2010). Clin J Am Soc Nephrol 5: 133-41.

Introduction to Canagliflozin

Introducing SGLTs inhibitors — From a Natural Product to an Investigational Drug
• Origin from apple tree bark (also skin and fruit of apples); naturally found in human diet
• In 1886, reported to cause glucosuria
• In 1930s, phlorizin used as a tool to investigate renal physiology
• In 1987, phlorizin used to show that insulin deficiency leads to insulin resistance ‘Phlorizin diabetes’
• Limitations of Phlorizin as a Drug
• Non-specific inhibitor of SLGT1 as well as SGLT2
• Metabolite, phloretin also inhibits GLUT2
• Poor oral bioavailability
27
HO
OH
OH
O
OH
O
O
HO
HO
HO
Phlorizin Structure
Ehrenkranz JR, et al. Diabetes Metab Res Rev 2005;21:31–38.

Introduction to CanagliflozinMechanism of Action
Nomura S, et al. J Med Chem. 2010;53(17):6355-6360. Rosenstock J, et al. Diabetes Care. 2012;35(6):1232-1238.
Sha S, et al. Diabetes Obes Metab. 2011;13(7):669-672. Liang Y, et al. PLoS One. 2012;7(2):e30555.
Devineni D, et al. Diabetes Obes Metab. 2012;14(6):539-545. Polidori D et al. Diabetes Care. 2013 Feb 14. [Epub ahead of print]
Sha S et al. 2010. Presented at ADA 2010; Orlando, Florida
SGLT2 Inhibitor

Introduction to CanagliflozinMechanism of Action
• SGLT2 is responsible for the majority of the reabsorption of filtered glucose from the tubular lumen
• Patients with diabetes have elevated renal glucose reabsorption which contributes to persistent elevated blood glucose concentrations
• Canagliflozin is an orally-active inhibitor of SGLT2
• By inhibiting SGLT2, Canagliflozin
– Reduces reabsorption of filtered glucose and lowers the RTG
– Increases urinary glucose excretion (UGE), lowering elevated plasma glucose concentrations
Invokana SmPC (Nov 2013) Available at: http://www.medicines.org.uk/emc/medicine/28400/SPC/Invokana+100+mg+film-coated+tablets/#PRODUCTINFO

Introduction to CanagliflozinMechanism of Action
• The increased UGE
– Translates to an osmotic diuresis, leading to a reduction in systolic blood pressure
– Results in a loss of calories and therefore a reduction in body weight
• Canagliflozin acts to increase UGE independent of insulin
• Improvement in homeostasis model assessment for β-cell function (HOMA β-cell) and improved β-cell insulin secretion response to a mixed-meal challenge has been observed in clinical studies with Canagliflozin
Invokana SmPC (Nov 2013) Available at: http://www.medicines.org.uk/emc/medicine/28400/SPC/Invokana+100+mg+film-coated+tablets/#PRODUCTINFO

Canagliflozin Elimination
Plasma Canagliflozin
41% Canagliflozin (unchanged)
3,2% O-glucuronide
7% Hydroxylatedmetabolite
<1% Canagliflozin (unchanged)
30,5 %O-glucuronidemetabolite
LIVER
KIDNEY
Faeces
Urine
Invokana SmPC (Nov 2013) Available at: http://www.medicines.org.uk/emc/medicine/28400/SPC/Invokana+100+mg+film-coated+tablets/#PRODUCTINFO
The major metabolic elimination
pathway for Canagliflozin is O-
glucuronidation.
CYP3A4-mediated metabolism is
minimal (∼7%)

Canagliflozin Treatment Lowers Plasma Glucose Concentrations Throughout the Entire Day
Example: CANA 100 mg treatment in subjects with T2DM
Data shown are mean values from NAP1002
CANA: Canagliflozin
120
140
160
180
200
220
240
260
280
300
Pla
sm
a g
luco
se (
mg
/d
L)
0 4 8 12 16 20 24
Time (Hours)
Placebo (N=19)
CANA 100 mg (N=16)
Day 16
Sha S et al. 2010. Presented at: American Diabetes Association. June 25-29, 2010; Orlando, FloridaJanssen Core Slides for the January 10, 2013 Meeting of the Endocrinologic and Metabolic Drugs Advisory Committee: http://www.fda.gov/downloads/AdvisoryCommittees/CommitteesMeetingMaterials/Drugs/EndocrinologicandMetabolicDrugsAdvisoryCommittee/UCM336236.pdf

Overview of Canagliflozin Clinical Development

Phase 3 Clinical Development Programme: 9 Studies Conducted

Canagliflozin Head to Head StudiesAdd-on to MET Study: Canagliflozin vs Glimepiride (DIA3009)

Add on to Metformin vs Glimepiride(DIA3009): Study Design
R, randomisation; AHA, antihyperglycaemic agent.*Protocol-specified = ≥2,000 mg (or ≥1,500 mg, if unable to tolerate higher dose).†To be discontinued before titrating MET.
Pretreatment PeriodCore Double-blind Treatment Period
Screening visit
Week –2Run-in start
Day 1Baseline
AHA adjustment period start
• On protocol-specified doses* of MET• HbA1c ≥7.0% and ≤9.5%
Week 104
Continue stable protocol-specified* dose of MET
CANA 300 mg
CANA 100 mg
GLIM (titrated)
Not on protocol-specified doses* of MET
- Low-dose MET: A1C ≥7.5 and ≤10%
- MET + another AHA†: HbA1c ≥6.5 and ≤9%
1. Titrate MET(up to 2 weeks)
2. Stable MET dose (10 weeks)
A1C≥7.0% and ≤9.5%
2-week, single-blind
placebo run-in
R
Extension Double-blind Treatment
Period
Week 52Primary endpoint
Cefalu WT et al. Lancet. 2013; 382(9896):941-50. Cefalu WT et al. Poster presented ADA 2013 Chicago, Illinois, (65-LB).
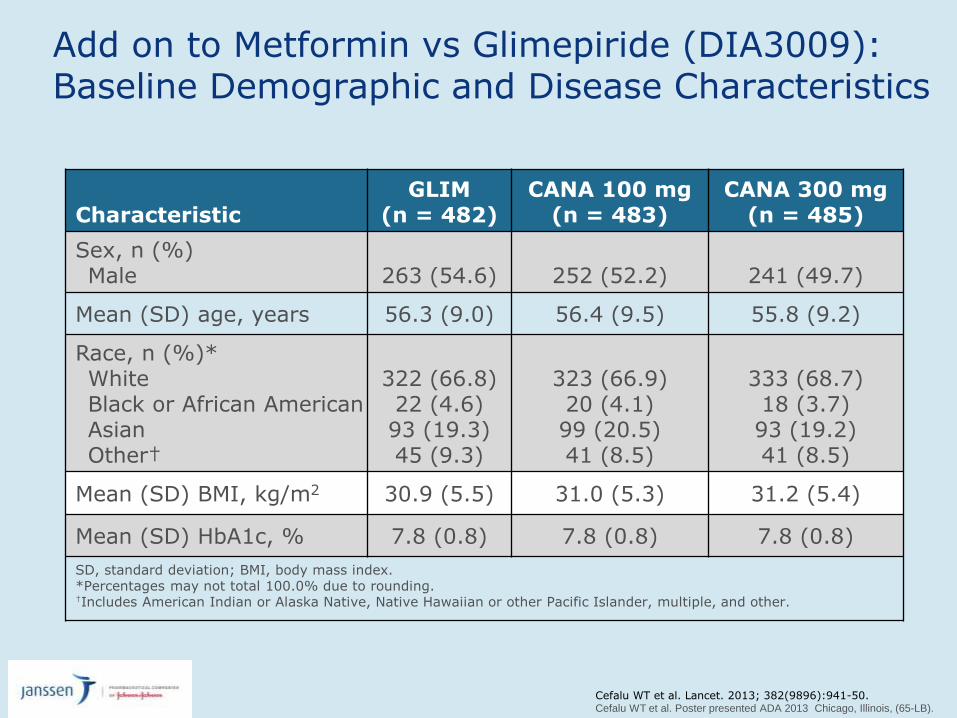
Add on to Metformin vs Glimepiride (DIA3009): Baseline Demographic and Disease Characteristics
CharacteristicGLIM
(n = 482) CANA 100 mg
(n = 483) CANA 300 mg
(n = 485)
Sex, n (%)Male 263 (54.6) 252 (52.2) 241 (49.7)
Mean (SD) age, years 56.3 (9.0) 56.4 (9.5) 55.8 (9.2)
Race, n (%)*WhiteBlack or African American AsianOther†
322 (66.8) 22 (4.6) 93 (19.3) 45 (9.3)
323 (66.9) 20 (4.1) 99 (20.5) 41 (8.5)
333 (68.7)18 (3.7)93 (19.2)41 (8.5)
Mean (SD) BMI, kg/m2 30.9 (5.5) 31.0 (5.3) 31.2 (5.4)
Mean (SD) HbA1c, % 7.8 (0.8) 7.8 (0.8) 7.8 (0.8)
SD, standard deviation; BMI, body mass index.*Percentages may not total 100.0% due to rounding.†Includes American Indian or Alaska Native, Native Hawaiian or other Pacific Islander, multiple, and other.
Cefalu WT et al. Lancet. 2013; 382(9896):941-50. Cefalu WT et al. Poster presented ADA 2013 Chicago, Illinois, (65-LB).

Add on to Metformin vs Glimepiride (DIA3009): Change in HbA1c (MMRM)*
74
GLIM CANA 100 mg CANA 300 mg
0 8 12 18 26 36 44 52
Time point (wk)
Baseline (%)
64 78 88 104
LS meanchange
–0.68%
–0.58%
–0.38%–0.20%(95% CI: –0.34, –0.06)
–0.30%(95% CI: –0.44, –0.16)
7.8 7.8 7.8
*Mixed-Effect Model Repeated Measure Model
–1.2
–1.0
–0.8
–0.6
–0.4
–0.2
0
LS m
ean c
hange (±
SE)
from
baseline (
%)
104 week data
Cefalu WT et al. Poster presented ADA 2013 Chicago, Illinois, (65-LB).
• Both CANA doses showed a reduction in HbA1c vs GLIM at 104 weeks when
assessed using MMRM

Add on to Metformin vs Glimepiride (DIA3009): Proportion of Subjects With Documented HypoglycaemiaEpisodes Through Weeks 52 and 104
76
40.9
6.8 8.2
0
20
40
60
80
100
Perc
enta
ge o
f subje
cts
104 week data
Cefalu WT et al. Lancet. 2013; 382(9896):941-50. Cefalu WT et al. Poster presented ADA 2013 Chicago, Illinois.
34
6 5
0
20
40
60
80
100
GLIM
CANA 100 mg
CANA 300 mg
Perc
enta
ge o
f subje
cts
52 week data

Add on to Metformin vs Glimepiride (DIA3009): Percent Change in Body Weight (LOCF)*
77
LS m
ean %
change (
±SE)
from
baseline
GLIM CANA 100 mg CANA 300 mg
0 8 12 18 26 36 44 52
Time point (wk)
Baseline (kg)
64 78 88 104
LS mean% change
–4.2%(–3.6 kg)
–4.1%(–3.6 kg)
0.9%(0.8 kg)
–5.1% (95% CI: –5.6, –4.5)(–4.3 kg)([95% CI: –4.8, –3.8])
–5.2% (95% CI: –5.7, –4.6)(–4.4 kg)([95% CI: –4.9, –3.9])
86.6 86.8 86.6
4
*N = 1,450 (Baseline); N = 1,425 (Week 4); N = 1,436 (Week 8); N = 1,438 (Weeks 12, 18, 26, 36, 44, 52, 64, 78, 88, and 104).
–6
–5
–4
–3
–2
–1
0
1
2
104 week data
Cefalu WT et al. Poster presented ADA 2013 Chicago, Illinois, (65-LB).

Add on to Metformin vs Glimepiride(DIA3009): Change in Systolic BP (LOCF)*
78
LS m
ean c
hange (
±SE)
from
baseline (
mm
Hg)
GLIM CANA 100 mg CANA 300 mg
0 8 12 18 26 36 44 52
Time point (wk)
Baseline (mmHg)
64 78 88 104
LS meanchange
–3.1 mmHg
–2.0 mmHg
1.7 mmHg
–3.7 mmHg(95% CI: –5.2, –2.3)
–4.8 mmHg(95% CI: –6.2, –3.4)
129.5 130.0 130.0
4
Reductions in diastolic BP with CANA 100 and 300 mg and GLIM were –1.3, –2.2, and –0.02 mmHg, respectively, with no notable changes in pulse rate.
*N = 1,450 (Baseline); N = 1,429 (Week 4); N = 1,438 (Week 8); N = 1,440 (Weeks 12, 18, 26, 36, 44, 52, 64, 78, 88, and 104).
–6
–5
–4
–3
–2
–1
0
1
2
3
104 week data
Cefalu WT et al. Poster presented ADA 2013 Chicago, Illinois, (65-LB).

Add on to Metformin vs Glimepiride (DIA3009): Summary of Overall Safety and Selected AEs Over 104 Weeks*
80Cefalu WT et al. Poster presented ADA 2013 Chicago, Illinois, (65-LB).
GLIM (n = 482)
CANA 100 mg (n = 483)
CANA 300 mg (n = 485)
Any AE 378 (78.4) 354 (73.3) 378 (77.9)
AEs leading to discontinuation 35 (7.3) 30 (6.2) 46 (9.5)
AEs related to study drug† 134 (27.8) 138 (28.6) 159 (32.8)
Serious AEs 69 (14.3) 47 (9.7) 47 (9.7)
Deaths 2 (0.4) 3 (0.6) 3 (0.6)
Genital mycotic infectionMale‡,§
Female|,¶
5 (1.9) 6 (2.7)
24 (9.5) 32 (13.9)
22 (9.1)38 (15.6)
Urinary Tract Infection (UTI) 33 (6.8) 51 (10.6) 42 (8.7)
Osmotic diuresis-related AEs# 10 (2.1) 28 (5.8) 32 (6.6)
Volume-related AEs** 11 (2.3) 8 (1.7) 12 (2.5)
*All AEs are reported for regardless of rescue medication.†Possibly, probably, or very likely related to study drug, as assessed by investigators.‡GLIM, n = 263; CANA 100 mg, n = 252; CANA 300 mg, n = 241.§Including balanitis, balanitis candida, balanoposthitis, genital candidiasis, genital infection fungal, and posthitis.|GLIM, n = 219; CANA 100 mg, n = 231; CANA 300 mg, n = 244.¶Including genital infection fungal, vaginal infection, vulvitis, vulvovaginal candidiasis, vulvovaginal mycotic infection, and vulvovaginitis.#Including dry mouth, micturition urgency, nocturia, pollakiuria, polydipsia, polyuria, thirst, and urine output increased.**Including BP decreased, dehydration, dizziness postural, hypotension, orthostatic hypotension, presyncope, and syncope.

Canagliflozin Head to Head StudiesAdd-on to MET Study: Canagliflozin vs Sitagliptin (DIA3006)
82

Screening Visit
Week–2
Day 1Baseline
AHA Adjustment Period Start
• On protocol-specified doses of MET• A1C ≥7% and ≤10.5%
Week52
CANA 300 mg
SITA 100 mg
PBO
A1C≥7% and ≤10.5%
R
SITA 100 mg
SITA 100 mg
CANA 300 mg
Week26
CANA 100 mg CANA 100 mg
• On below protocol-specified doses of MET• A1C ≥7.5% and ≤11%
1. Titrate MET (up to 2 weeks)
2. Stable MET dose (8 weeks)
• On MET/SU• A1C ≥6.5% and ≤9.5%
Add-on to MET vs Sitagliptin (DIA3006): Study Design
Pretreatment PeriodPBO/Active-
controlled, Double-blind Treatment Period
Active-controlled, Double-blind
Treatment Period
PBO
Continue stable protocol-specified dose of MET
2-week, single-blind PBO
run-in
Discontinue SU
83
Lavalle González, et al. Poster presented at ADA 2013 Chicago, Illinois,
Lavalle-González FJ et al. Diabetologia. 2013 Sep 13. [Epub ahead of print]

Add-on to MET vs Sitagliptin (DIA3006): Baseline Characteristics
Lavalle González, et al. Poster presented at ADA 2013 Chicago, Illinois,
Lavalle-González FJ et al. Diabetologia. 2013 Sep 13. [Epub ahead of print]
Characteristic PBO/SITA(n=183)
SITA 100 mg(n=366)
CANA 100 mg (n=368)
CANA 300 mg
(n=367)
Sex, n (%)MaleFemale
94 (51.4)89 (48.6)
172 (47.0)194 (53.0)
174 *47.3)194 (52.7)
165 (45.0)202 (55.0)
Age (years) 55.3 ± 9.8 55.5 ± 9.6 55.5 ± 9.4 55.3 ± 9.2
Race, n (%) †WhiteBlack or African
AmericanAsianOther ‡
129 (70.5)3 (1.6)
30 (16.4)21 (11.5)
264 (72.1)13 (3.6)41 (11.2)48 (13.1)
252 (68.5)16 (4.3)51 (13.9)49 (13.3)
256 (69.8)13 (3.5)60 (16.3)38 (10.4)
HbA1c (%) 8.0 (0.9) 7.9 (0.9) 7.9 (0.9) 7.9 (0.9)
FPG (mmol/L) 9.1 (2.1) 9.4 (2.3) 9.3 (2.3) 9.6 (2.5)
Body weight (kg) 86.6 (22.4) 87.7 (21.6) 88.8 (22.2) 85.4 (20.9)
BMI (kg/m2) 31.1 (6.1) 32.0 (6.1) 32.4 (6.4) 31.4 (6.3)
Duration of diabetes (years)
6.8 (5.3) 6.8 (5.2) 6.7 (5.4) 7.1 (5.4)
BMI, body mass index; CANA, Canagliflozin; SITA, sitagliptin; FPG, fasting plasma glucose; HbA1c, haemoglobin A1c; PBO, placebo; s.d., standard deviation.∗Data are mean (s.d.) unless otherwise indicated..
‡Including American Indian or Alaska Native, other, unknown and not reported for the main stud

Add-on to MET vs Sitagliptin (DIA3006):
Change in HbA1c
SITA 100 mg CANA 100 mg CANA 300 mg
Time point (wk)
LS m
ean c
hange (±
SE)
from
baseline (
%)
Baseline (%) 7.9 7.9 8.0
LS meanchange
0%(95% Cl: –0.12, 0.12)
–0.73%
–0.73%
–0.88%–0.15%(95% Cl: –0.27, –0.03)
0 6 12 18 26 34 42 52
0.2
0
–0.2
–0.4
–0.6
–0.8
–1.0
–1.2mITT, LOCF
Lavalle González FJ et al. Data presented ADA 2013; Chicago, Illinois.Lavalle-González FJ et al. Diabetologia. 2013 Sep 13. [Epub ahead of print]
• CANA 100 and CANA 300 mg demonstrated non-inferiority to SITA 100 mg in HbA1c-lowering;
• CANA 300 mg showed statistical superiority to SITA 100 mg in HbA1c-lowering

Add-on to MET vs Sitagliptin (DIA3006):
Change in FPG
SITA 100 mg CANA 100 mg CANA 300 mg
LS m
ean c
hange (±
SE)
from
baseline (
mm
ol/
L)
Baseline (mmol.L) 168.9 168.6 172.7
LS mean change
–0.5 mmol/LP <0.001
–1.0 mmol/LP <0.001
–1.0 mmol/L
–1.5 mmol/L
–2.0 mmol/L
Time point (wk)
0 6 12 18 26 34 42 52
0
–0.5
–1.0
–1.5
–2.0
–2.5
mITT, LOCF
Lavalle González FJ et al. Data presented ADA 2013; Chicago, Illinois.Lavalle-González FJ et al. Diabetologia. 2013 Sep 13. [Epub ahead of print]

Add-on to MET vs Sitagliptin (DIA3006):
Percent Change in Body WeightLS m
ean %
change (±
SE)
from
baseline
Baseline (kg) 87.6 88.7 85.4
LS mean % change
–2.4% (–2.1 kg)P <0.001
–2.9% (–2.5 kg)P <0.001
–1.3%(–1.2 kg)
–3.8%(–3.3 kg)
–4.2%(–3.7 kg)
Time point (wk)
-5
-4
-3
-2
-1
0
SITA 100 mg CANA 100 mg CANA 300 mg
0 6 12 18 26 34 42 52
–4
–5
–3
–2
–1
mITT, LOCF
Lavalle González FJ et al. Data presented ADA 2013; Chicago, Illinois.Lavalle-González FJ et al. Diabetologia. 2013 Sep 13. [Epub ahead of print]

Add-on to MET vs Sitagliptin (DIA3006):
Change in Systolic BP
• With CANA 100 and 300 mg and SITA 100 mg, LS mean changes from baseline in diastolic BP were −1.8, –1.8, and –0.3 mmHg, respectively
• No notable changes in pulse rate were observed across groups
LS m
ean c
hange (±
SE)
from
baseline (
mm
Hg)
SITA 100 mg CANA 100 mg CANA 300 mg
–2
–4
–6
2
0
–8
Baseline (mmHg) 128.0 128.0 128.7
LS mean change
–2.9 mmHgP <0.001
–4.0 mmHgP <0.001
–0.7 mmHg
–3.5 mmHg
–4.7 mmHg
Time point (wk)
0 6 12 18 26 34 42 52
mITT, LOCF
Lavalle González FJ et al. Data presented ADA 2013; Chicago, Illinois.Lavalle-González FJ et al. Diabetologia. 2013 Sep 13. [Epub ahead of print]

Add-on to MET vs Sitagliptin (DIA3006): Summary of Overall Safety at 26 Weeks
Januszewicz A et al. Poster presented at DDG Congress; 2013; Leipzig, Germany.
Subjects, n (%)
PBO (n = 183)
CANA 100 mg(n = 368)
CANA 300 mg(n = 367)
SITA 100 mg(n = 366)
Any AE 107 (58.5) 225 (61.1) 204 (55.6) 202 (55.2)
AEs leading to discontinuation 7 (3.8) 18 (4.9) 12 (3.3) 7 (1.9)
Serious AEs 4 (2.2) 12 (3.3) 10 (2.7) 8 (2.2)
Genital mycotic infectionMale*.†
Female‡,§
1 (1.1)0
7 (4.0)17 (8.8)
4 (2.4)19 (9.4)
2 (1.2)2 (1.0)
Urinary tract infection 4 (2.2) 20 (5.4) 13 (3.5) 13 (3.6)
Osmotic diuresis-related AEsPollakiuria (increased frequency)Polyuria (increased volume)
1 (0.5)0
21 (5.7)2 (0.5)
10 (2.7)2 (0.5)
2 (0.5)0
Volume-related AEsPostural dizzinessOrthostatic hypotension
1 (0.5)0
1 (0.3)0
01 (0.3)
00
Hypoglycaemia episodesǀ 3 (1.6) 16 (4.3) 17 (4.6) 5 (1.4)
*PBO, n = 94; CANA 100 mg, n = 174; CANA 300 mg, n = 165; SITA 100 mg, n = 172.†Including balanitis, balanitis candida, balanoposthitis, and genital infection fungal (based on a pre-specified list of terms).‡PBO, n = 89; CANA 100 mg, n = 194; CANA 300 mg, n = 202; SITA 100 mg, n = 194.§Including vaginal infection, vulvitis, vulvovaginal candidiasis, vulvovaginal mycotic infection, and vulvovaginitis (based on a pre-specified list of terms).ǀIncludes episodes that were either biochemically documented (≤3.9 mmol/L) or reported as severe by the investigator.

Management of Hyperglycemia in
Type 2 Diabetes - 2015
A Patient-Centered Approach
Update to a Position Statement of the American Diabetes
Association (ADA) and the European Association for the Study of
Diabetes (EASD)
Diabetes Care 2015;38:140–149
Diabetologia 2015;10.1077/s00125-014-3460-0
Inzucchi SE, Bergenstal RB, Buse JB, Diamant M, Ferrannini E,
Nauck M, Peters AL, Tsapas A, Wender R, Matthews DR

Healthy eating, weight control, increased physical activity & diabetes education
Metformin high low risk
neutral/loss
GI / lactic acidosis
low
If HbA1c target not achieved after ~3 months of monotherapy, proceed to 2-drug combination (order not meant to denote any specific preference - choice dependent on a variety of patient- & disease-specific factors):
Metformin +
Metformin +
Metformin +
Metformin +
Metformin +
high low risk
gain
edema, HF, fxs
low
Thiazolidine- dione
intermediate low risk
neutral
rare
high
DPP-4 inhibitor
highest high risk
gain
hypoglycemia
variable
Insulin (basal)
Metformin +
Metformin +
Metformin +
Metformin +
Metformin +
Basal Insulin +
Sulfonylurea
+
TZD
DPP-4-i
GLP-1-RA
Insulin§
or
or
or
or
Thiazolidine-dione
+ SU
DPP-4-i
GLP-1-RA
Insulin§
TZD
DPP-4-i
or
or
or
GLP-1-RA
high low risk
loss
GI
high
GLP-1 receptor agonist
Sulfonylurea
high moderate risk
gain
hypoglycemia
low
SGLT2 inhibitor
intermediate low risk
loss
GU, dehydration
high
SU
TZD
Insulin§
GLP-1 receptor agonist
+
SGLT-2 Inhibitor +
SU
TZD
Insulin§
Metformin +
Metformin +
or
or
or
or
SGLT2-i
or
or
or
SGLT2-i
Mono- therapy
Efficacy* Hypo risk
Weight
Side effects
Costs
Dual therapy†
Efficacy* Hypo risk
Weight
Side effects
Costs
Triple therapy
or
or
DPP-4 Inhibitor
+ SU
TZD
Insulin§
SGLT2-i
or
or
or
SGLT2-i
or
DPP-4-i
If HbA1c target not achieved after ~3 months of dual therapy, proceed to 3-drug combination (order not meant to denote any specific preference - choice dependent on a variety of patient- & disease-specific factors):
If HbA1c target not achieved after ~3 months of triple therapy and patient (1) on oral combination, move to injectables, (2) on GLP-1 RA, add basal insulin, or (3) on optimally titrated basal insulin, add GLP-1-RA or mealtime insulin. In refractory patients consider adding TZD or SGL T2-i:
Metformin +
Combination injectable therapy‡
GLP-1-RA Mealtime Insulin
Insulin (basal)
+
Figure 2. Anti-hyperglycemic therapy in T2DM: General recommendations
Diabetes Care 2015;38:140-149; Diabetologia 2015;10.1077/s00125-014-3460-0

Healthy eating, weight control, increased physical activity & diabetes education
Metformin high low risk
neutral/loss
GI / lactic acidosis
low
If HbA1c target not achieved after ~3 months of monotherapy, proceed to 2-drug combination (order not meant to denote any specific preference - choice dependent on a variety of patient- & disease-specific factors):
Metformin +
Metformin +
Metformin +
Metformin +
Metformin +
high low risk
gain
edema, HF, fxs
low
Thiazolidine- dione
intermediate low risk
neutral
rare
high
DPP-4 inhibitor
highest high risk
gain
hypoglycemia
variable
Insulin (basal)
Metformin +
Metformin +
Metformin +
Metformin +
Metformin +
Basal Insulin +
Sulfonylurea
+
TZD
DPP-4-i
GLP-1-RA
Insulin§
or
or
or
or
Thiazolidine-dione
+ SU
DPP-4-i
GLP-1-RA
Insulin§
TZD
DPP-4-i
or
or
or
GLP-1-RA
high low risk
loss
GI
high
GLP-1 receptor agonist
Sulfonylurea
high moderate risk
gain
hypoglycemia
low
SGLT2 inhibitor
intermediate low risk
loss
GU, dehydration
high
SU
TZD
Insulin§
GLP-1 receptor agonist
+
SGLT-2 Inhibitor +
SU
TZD
Insulin§
Metformin +
Metformin +
or
or
or
or
SGLT2-i
or
or
or
SGLT2-i
Mono- therapy
Efficacy* Hypo risk
Weight
Side effects
Costs
Dual therapy†
Efficacy* Hypo risk
Weight
Side effects
Costs
Triple therapy
or
or
DPP-4 Inhibitor
+ SU
TZD
Insulin§
SGLT2-i
or
or
or
SGLT2-i
or
DPP-4-i
If HbA1c target not achieved after ~3 months of dual therapy, proceed to 3-drug combination (order not meant to denote any specific preference - choice dependent on a variety of patient- & disease-specific factors):
If HbA1c target not achieved after ~3 months of triple therapy and patient (1) on oral combination, move to injectables, (2) on GLP-1 RA, add basal insulin, or (3) on optimally titrated basal insulin, add GLP-1-RA or mealtime insulin. In refractory patients consider adding TZD or SGL T2-i:
Metformin +
Combination injectable therapy‡
GLP-1-RA Mealtime Insulin
Insulin (basal)
+
Diabetes Care 2015;38:140-149; Diabetologia 2015;10.1077/s00125-014-3460-0

Healthy eating, weight control, increased physical activity & diabetes education
Metformin high low risk
neutral/loss
GI / lactic acidosis
low
If HbA1c target not achieved after ~3 months of monotherapy, proceed to 2-drug combination (order not meant to denote any specific preference - choice dependent on a variety of patient- & disease-specific factors):
Metformin +
Metformin +
Metformin +
Metformin +
Metformin +
high low risk
gain
edema, HF, fxs
low
Thiazolidine- dione
intermediate low risk
neutral
rare
high
DPP-4 inhibitor
highest high risk
gain
hypoglycemia
variable
Insulin (basal)
Metformin +
Metformin +
Metformin +
Metformin +
Metformin +
Basal Insulin +
Sulfonylurea
+
TZD
DPP-4-i
GLP-1-RA
Insulin§
or
or
or
or
Thiazolidine-dione
+ SU
DPP-4-i
GLP-1-RA
Insulin§
TZD
DPP-4-i
GLP-1-RA
high low risk
loss
GI
high
GLP-1 receptor agonist
Sulfonylurea
high moderate risk
gain
hypoglycemia
low
SGLT2 inhibitor
intermediate low risk
loss
GU, dehydration
high
SU
TZD
Insulin§
GLP-1 receptor agonist
+
SGLT-2 Inhibitor +
SU
TZD
Insulin§
Metformin +
Metformin +
or
or
or
or
SGLT2-i
or
or
or
SGLT2-i
Mono- therapy
Efficacy* Hypo risk
Weight
Side effects
Costs
Dual therapy†
Efficacy* Hypo risk
Weight
Side effects
Costs
Triple therapy
or
or
DPP-4 Inhibitor
+ SU
TZD
Insulin§
SGLT2-i
or
or
or
SGLT2-i
or
DPP-4-i
If HbA1c target not achieved after ~3 months of dual therapy, proceed to 3-drug combination (order not meant to denote any specific preference - choice dependent on a variety of patient- & disease-specific factors):
If HbA1c target not achieved after ~3 months of triple therapy and patient (1) on oral combination, move to injectables, (2) on GLP-1 RA, add basal insulin, or (3) on optimally titrated basal insulin, add GLP-1-RA or mealtime insulin. In refractory patients consider adding TZD or SGL T2-i:
Metformin +
Combination injectable therapy‡
GLP-1-RA Mealtime Insulin
HbA1c≥9%
Me orminintoleranceorcontraindica on
Uncontrolledhyperglycemia
(catabolicfeatures,BG≥300-350mg/dl,HbA1c≥10-12%)
Insulin (basal)
+
or
or
or
Diabetes Care 2015;38:140-149; Diabetologia 2015;10.1077/s00125-014-3460-0


103

•BACK UP on Safety and Tolerability
105

Summary of Safety and Tolerability
• Large Phase 3 program with >10,000 subjects randomized
– Substantial proportion of vulnerable individuals studied
• Overall well tolerated at both doses of canagliflozin
– Low rate of discontinuations due to adverse events (AEs)
– Incidence of serious AEs and deaths comparable to control
– Safety and tolerability profile similar across range of eGFR
(>30 mL/min/1.73 m2)
• Genital mycotic infections
• Urinary tract infections
• Other Adverse events of interest

Summary of Adverse Drug Reactions≥2% and >Placebo in the Placebo-controlled Studies Dataset
PlaceboN=646n (%)
CANA 100 mgN=833n (%)
CANA 300 mgN=834n (%)
Gastrointestinal Disorders
Constipation 6 (0.9) 15 (1.8) 19 (2.3)
Thirst 1 (0.2) 23 (2.8) 19 (2.3)
Renal and Urinary Disorders
Polyuria or pollakiuria 5 (0.8) 44 (5.3) 38 (4.6)
Urinary tract infection 26 (4.0) 48 (5.8) 36 (4.3)
Reproductive System and Breast Disorders
Balanitis or balanoposthitis 2 (0.6) 17 (4.2) 15 (3.7)
Vulvovaginal candidiasis 10 (3.2) 44 (10.4) 49 (11.4)
Other ADR’s: Hypotension, Impaired renal function, Hypoglycemia with concomitant insulin or insulin secretatgoues, Hypersensitivty reactions, Increased LDL-C, Pancreatitis, Bone fractures Increases in: Potassium, Magnesium, Phosphate, and Hemoglobin