Embed Size (px)
Citation preview
www.udghealthcare.com 1 : UDG Healthcare plc
UDG Healthcare plc An International Healthcare Services Organisation
Jefferies Global Healthcare Conference Grand Hyatt, New York City 3 June 2015
www.udghealthcare.com : UDG Healthcare plc 2
FORWARD LOOKING STATEMENTS Some statements in this presentation are forward-looking.
They represent expectations for the Group’s business and involve risks and uncertainties.
UDG Healthcare plc has based these forward-looking statements on current expectations and projections about future events. The Group believes that expectations and assumptions with respect to these forward-looking statements are reasonable.
However, because they involve known and unknown risks, uncertainties and other factors, which are in some cases beyond the Group’s control, actual results or performance may differ materially from those expressed or implied by such forward-looking statements
www.udghealthcare.com : UDG Healthcare plc 3
UDG Healthcare plc
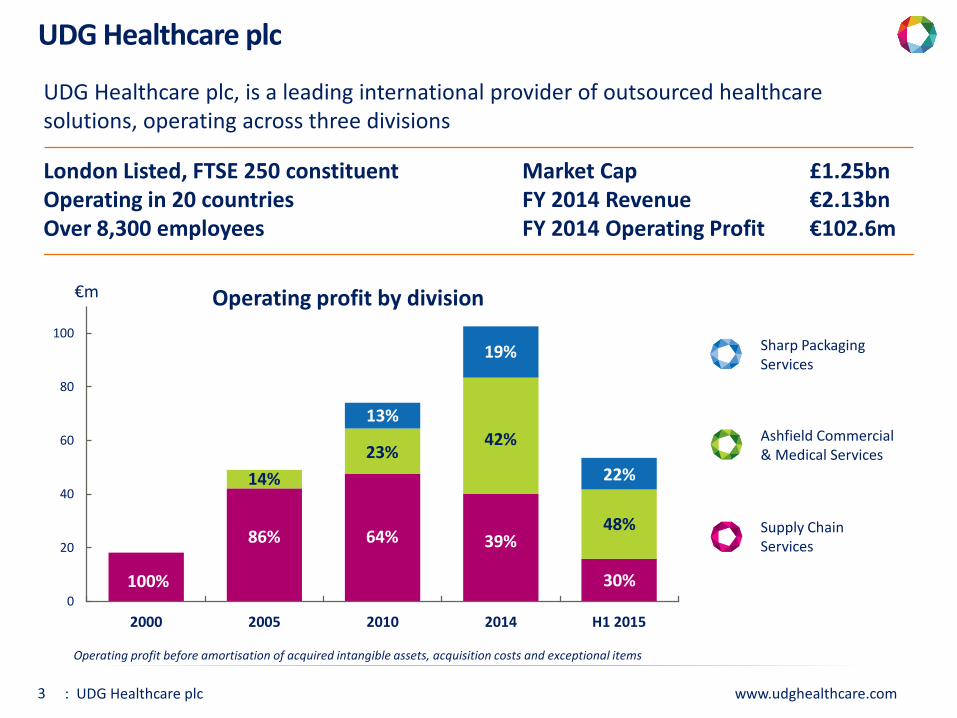
UDG Healthcare plc, is a leading international provider of outsourced healthcare solutions, operating across three divisions
London Listed, FTSE 250 constituent Market Cap £1.25bn Operating in 20 countries FY 2014 Revenue €2.13bn Over 8,300 employees FY 2014 Operating Profit €102.6m
0
20
40
60
80
100
2000 2005 2010 2014 H1 2015
Supply Chain Services
Ashfield Commercial & Medical Services
Sharp Packaging Services
€m
100%
86%
14%
64%
23%
39%
42%
19%
13%
Operating profit by division
Operating profit before amortisation of acquired intangible assets, acquisition costs and exceptional items
30%
48%
22%
www.udghealthcare.com : UDG Healthcare plc 4
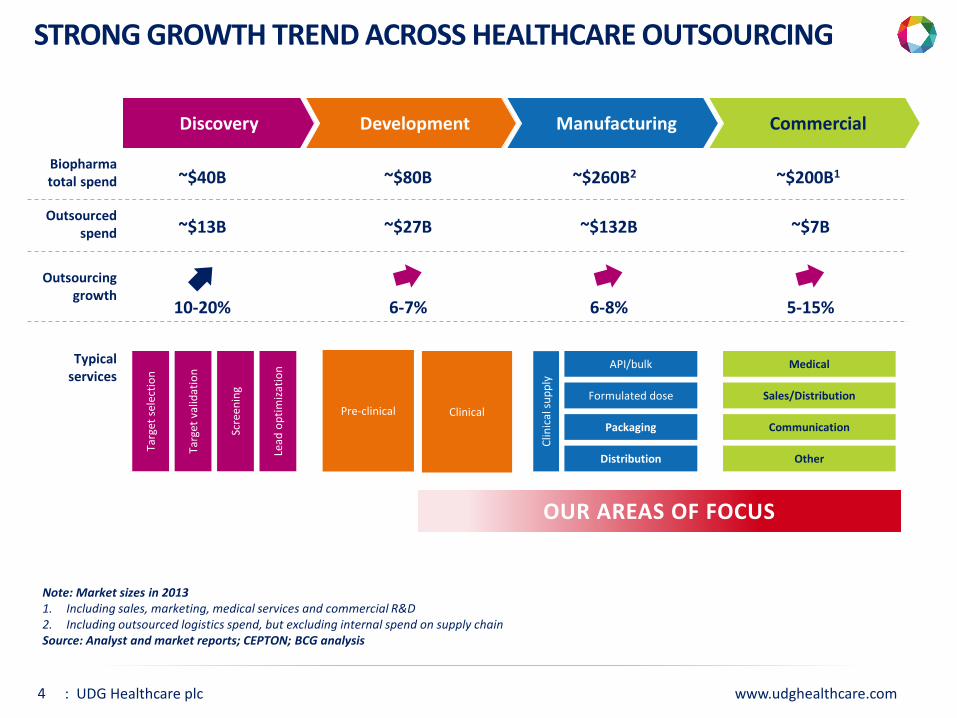
Note: Market sizes in 2013 1. Including sales, marketing, medical services and commercial R&D 2. Including outsourced logistics spend, but excluding internal spend on supply chain Source: Analyst and market reports; CEPTON; BCG analysis
STRONG GROWTH TREND ACROSS HEALTHCARE OUTSOURCING
Discovery Development Manufacturing Commercial
Outsourced spend ~$13B ~$27B ~$132B ~$7B
Outsourcing growth
10-20% 6-7% 6-8% 5-15%
Sales/Distribution
Communication
Medical
Lead
opt
imiza
tion
Scre
enin
g
Targ
et v
alid
atio
n
Typical services
API/bulk
Distribution
Formulated dose
Packaging
Clin
ical
supp
ly
Pre-clinical Clinical
Other
Targ
et se
lect
ion
Biopharma total spend ~$40B ~$80B ~$260B2 ~$200B1
OUR AREAS OF FOCUS
www.udghealthcare.com : UDG Healthcare plc 5
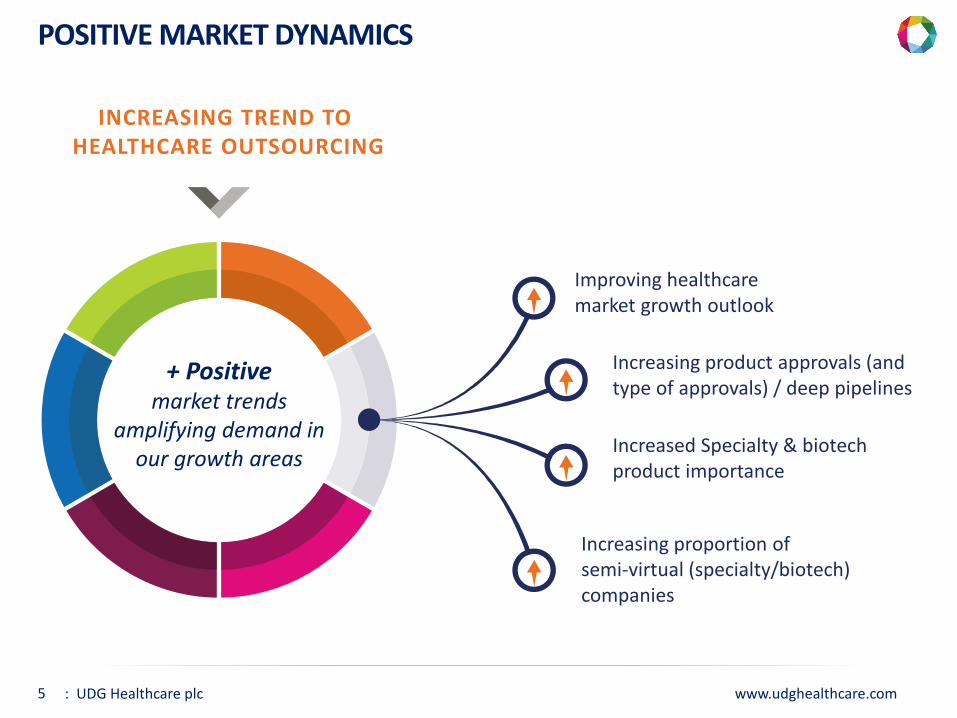
POSITIVE MARKET DYNAMICS
INCREASING TREND TO HEALTHCARE OUTSOURCING
+ Positive market trends
amplifying demand in our growth areas
Increasing product approvals (and type of approvals) / deep pipelines
Increased Specialty & biotech product importance
Increasing proportion of semi-virtual (specialty/biotech) companies
Improving healthcare market growth outlook

www.udghealthcare.com : UDG Healthcare plc 6
BUSINESS OVERVIEW
GLOBAL COMMERCIAL & MEDICAL SERVICES:
˃ Sales & marketing (CSO & multi-channel)
˃ Healthcare communications
˃ Market access, PV & regulatory
No.1 UK & Europe Emerging in US / Japan Leading global position Emerging in US
48% of Group profits 8.9% Operating Margin
GLOBAL PACKAGING SERVICES:
˃ Commercial packaging
˃ Clinical trials packaging & logistics
˃ Serialisation services
No.2 CPO globally Emerging in clinical trials area
22% of Group profits 10.6% Operating Margin
SUPPLY CHAIN SERVICES:
˃ Pharma wholesale
˃ Pre-wholesale - bulk distribution
˃ Medical device sales & distribution
No.1 RoI and N Ireland No.1 RoI Leading in UK & Ireland
30% of Group profits 2.2% Operating Margin
www.udghealthcare.com : UDG Healthcare plc 7
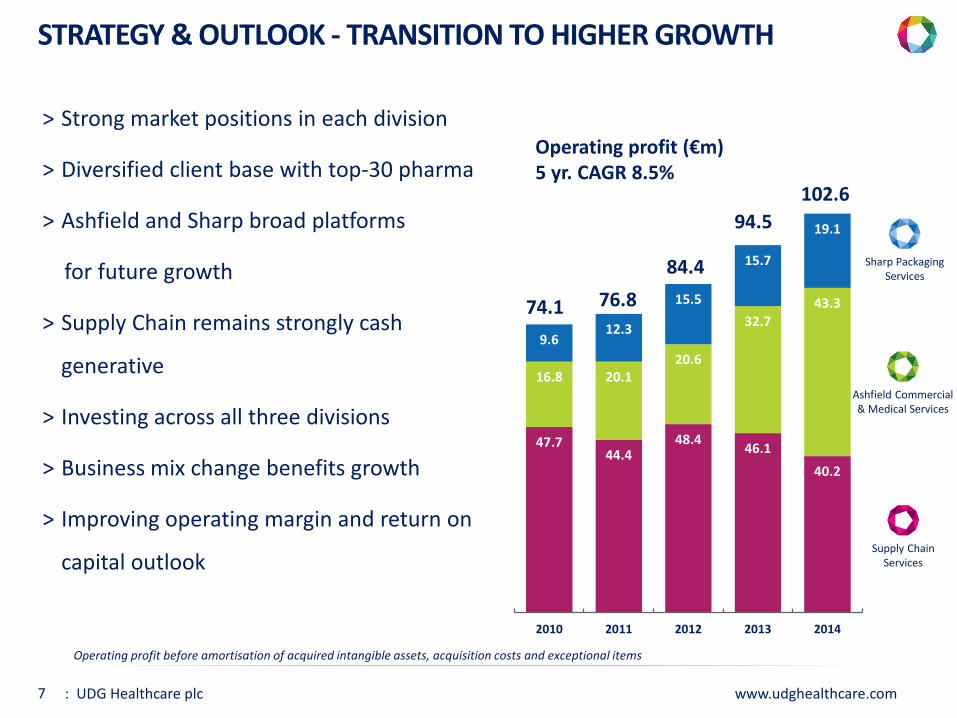
47.7 44.4
48.4 46.1 40.2
16.8 20.1 20.6
32.7 43.3
9.6 12.3
15.5
15.7
19.1
2010 2011 2012 2013 2014
STRATEGY & OUTLOOK - TRANSITION TO HIGHER GROWTH
102.6
74.1
84.4
94.5
76.8
˃ Strong market positions in each division
˃ Diversified client base with top-30 pharma
˃ Ashfield and Sharp broad platforms
for future growth
˃ Supply Chain remains strongly cash
generative
˃ Investing across all three divisions
˃ Business mix change benefits growth
˃ Improving operating margin and return on
capital outlook
Operating profit (€m) 5 yr. CAGR 8.5%
Supply Chain Services
Ashfield Commercial & Medical Services
Sharp Packaging Services
Operating profit before amortisation of acquired intangible assets, acquisition costs and exceptional items
www.udghealthcare.com : UDG Healthcare plc 8
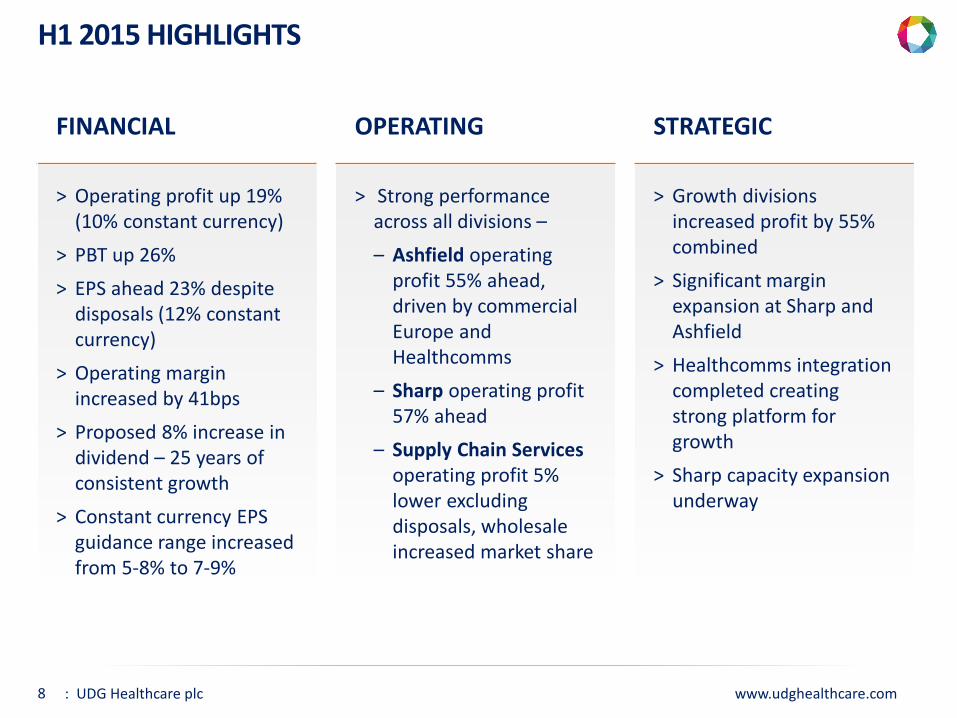
H1 2015 HIGHLIGHTS
FINANCIAL OPERATING STRATEGIC
˃ Operating profit up 19% (10% constant currency)
˃ PBT up 26% ˃ EPS ahead 23% despite
disposals (12% constant currency)
˃ Operating margin increased by 41bps
˃ Proposed 8% increase in dividend – 25 years of consistent growth
˃ Constant currency EPS guidance range increased from 5-8% to 7-9%
˃ Strong performance across all divisions – – Ashfield operating
profit 55% ahead, driven by commercial Europe and Healthcomms
– Sharp operating profit 57% ahead
– Supply Chain Services operating profit 5% lower excluding disposals, wholesale increased market share
˃ Growth divisions increased profit by 55% combined
˃ Significant margin expansion at Sharp and Ashfield
˃ Healthcomms integration completed creating strong platform for growth
˃ Sharp capacity expansion underway
www.udghealthcare.com : UDG Healthcare plc 9
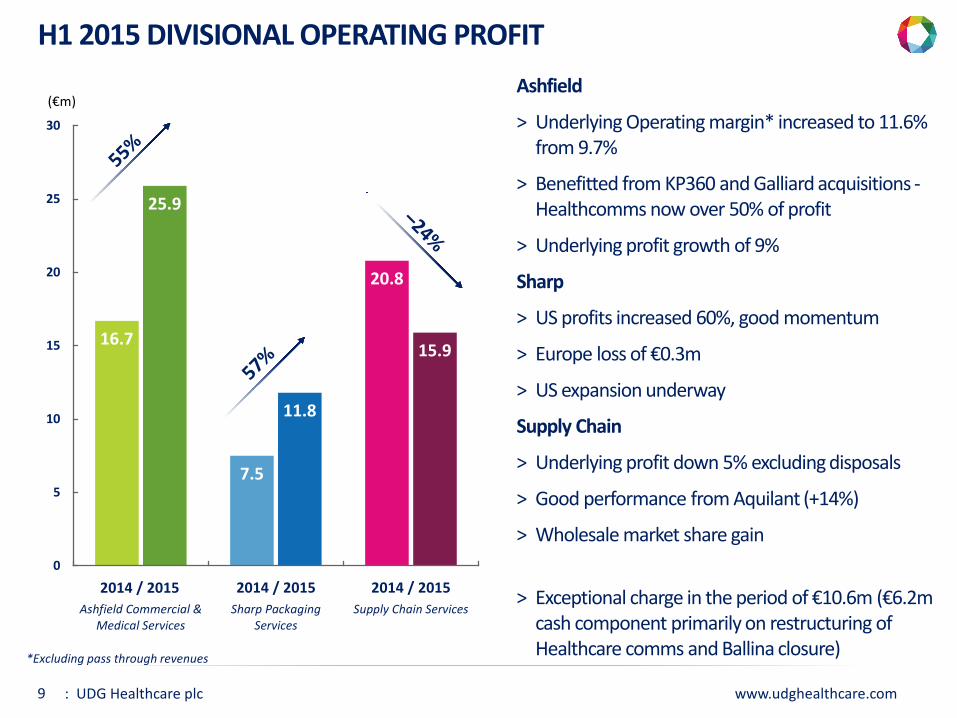
H1 2015 DIVISIONAL OPERATING PROFIT Ashfield
˃ Underlying Operating margin* increased to 11.6% from 9.7%
˃ Benefitted from KP360 and Galliard acquisitions - Healthcomms now over 50% of profit
˃ Underlying profit growth of 9%
Sharp
˃ US profits increased 60%, good momentum
˃ Europe loss of €0.3m
˃ US expansion underway
Supply Chain
˃ Underlying profit down 5% excluding disposals
˃ Good performance from Aquilant (+14%)
˃ Wholesale market share gain
˃ Exceptional charge in the period of €10.6m (€6.2m cash component primarily on restructuring of Healthcare comms and Ballina closure)
16.7
7.5
20.8
25.9
11.8
15.9
0
5
10
15
20
25
30
Ashfield Commercial &Medical Services
Sharp PackagingServices
Supply Chain Services
(€m)
2014 / 2015 2014 / 2015 2014 / 2015
*Excluding pass through revenues
www.udghealthcare.com : UDG Healthcare plc 10
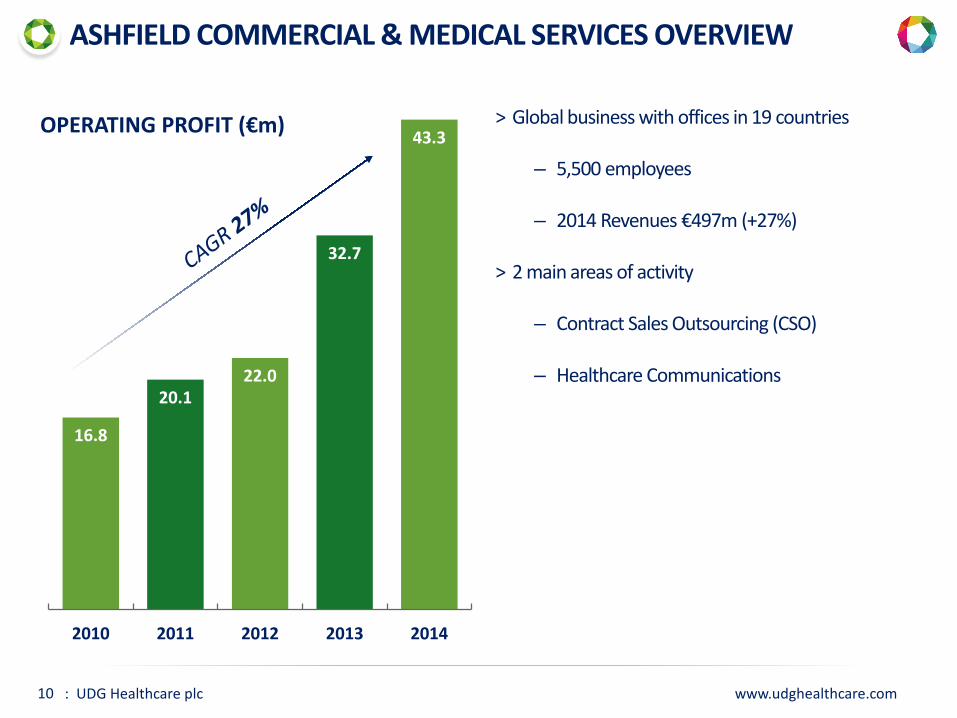
˃ Global business with offices in 19 countries
– 5,500 employees
– 2014 Revenues €497m (+27%)
˃ 2 main areas of activity
– Contract Sales Outsourcing (CSO)
– Healthcare Communications
16.8
20.1 22.0
32.7
43.3
2010 2011 2012 2013 2014
OPERATING PROFIT (€m)
ASHFIELD COMMERCIAL & MEDICAL SERVICES OVERVIEW
www.udghealthcare.com : UDG Healthcare plc 11
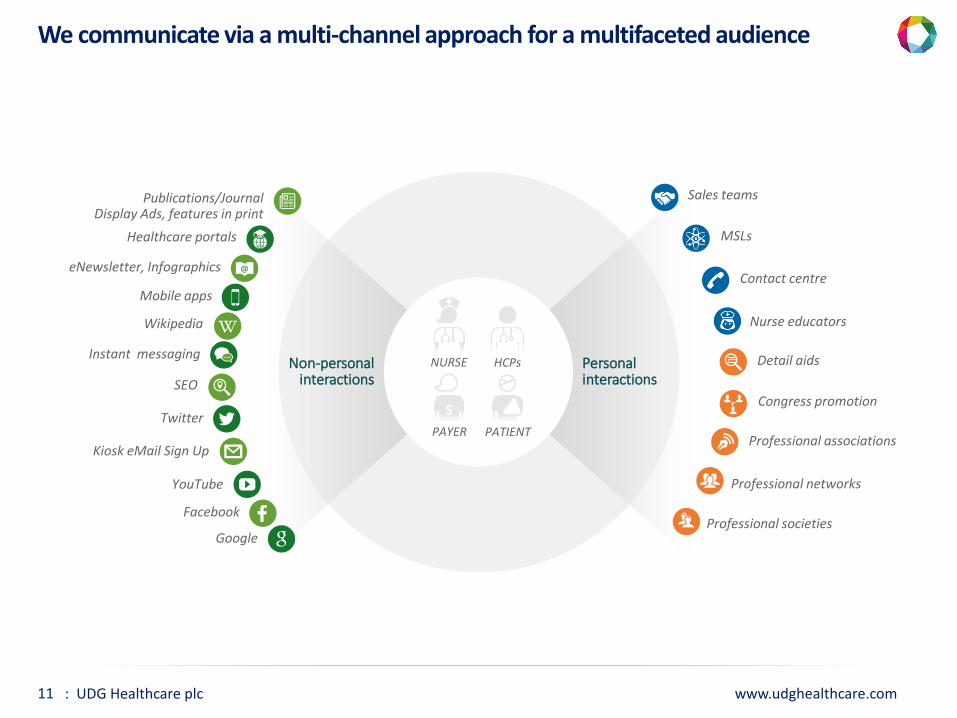
We communicate via a multi-channel approach for a multifaceted audience
$
NURSE HCPs
PAYER PATIENT
Personal interactions
Non-personal interactions
Wikipedia
Mobile apps
SEO
@ eNewsletter, Infographics
Instant messaging
Healthcare portals
Kiosk eMail Sign Up
YouTube
Publications/Journal Display Ads, features in print
Detail aids
Sales teams
Professional associations
Professional networks
Professional societies
Congress promotion
MSLs
Contact centre
Nurse educators
www.udghealthcare.com : UDG Healthcare plc 12
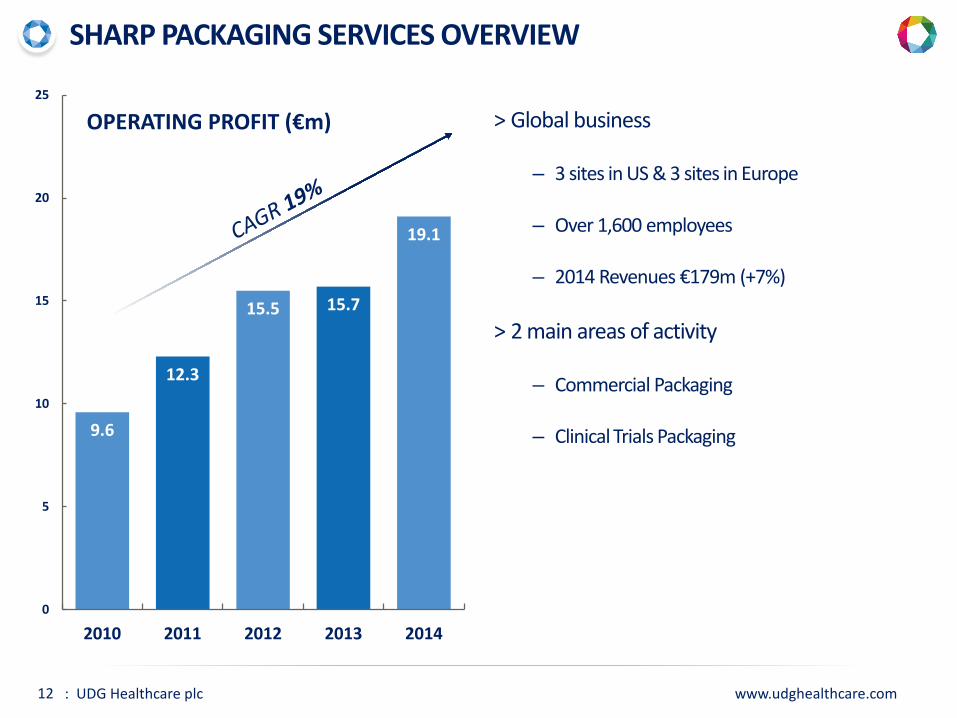
SHARP PACKAGING SERVICES OVERVIEW
9.6
12.3
15.5 15.7
19.1
0
5
10
15
20
25
2010 2011 2012 2013 2014
OPERATING PROFIT (€m) ˃ Global business
– 3 sites in US & 3 sites in Europe
– Over 1,600 employees
– 2014 Revenues €179m (+7%)
˃ 2 main areas of activity
– Commercial Packaging
– Clinical Trials Packaging
www.udghealthcare.com : UDG Healthcare plc 13
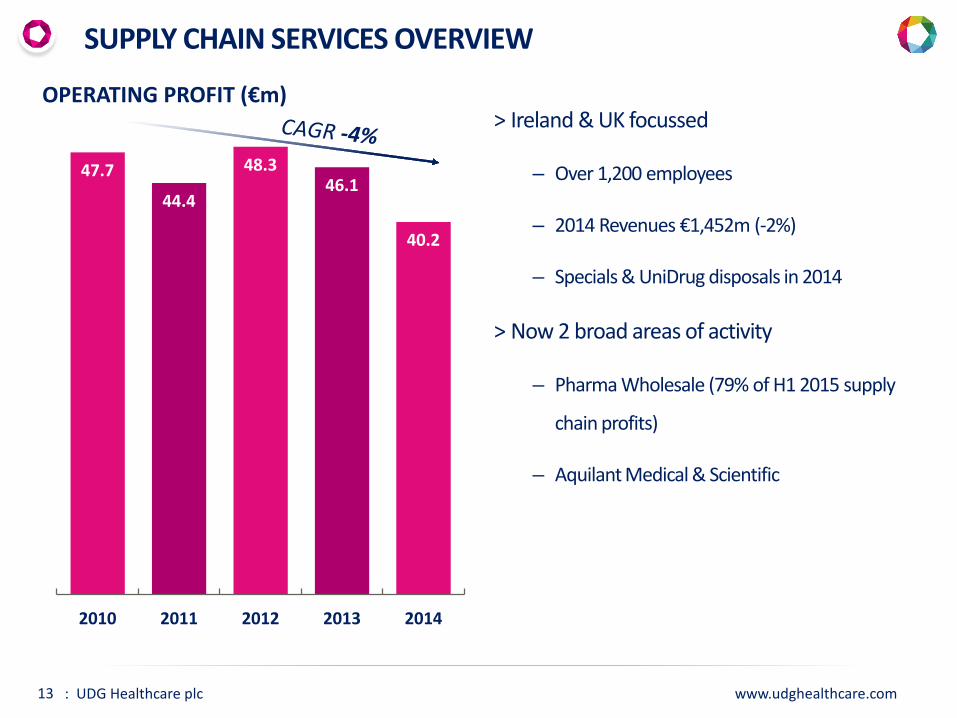
˃ Ireland & UK focussed
– Over 1,200 employees
– 2014 Revenues €1,452m (-2%)
– Specials & UniDrug disposals in 2014
˃ Now 2 broad areas of activity
– Pharma Wholesale (79% of H1 2015 supply
chain profits)
– Aquilant Medical & Scientific
47.7
44.4
48.3 46.1
40.2
2010 2011 2012 2013 2014
OPERATING PROFIT (€m)
SUPPLY CHAIN SERVICES OVERVIEW
www.udghealthcare.com : UDG Healthcare plc 14
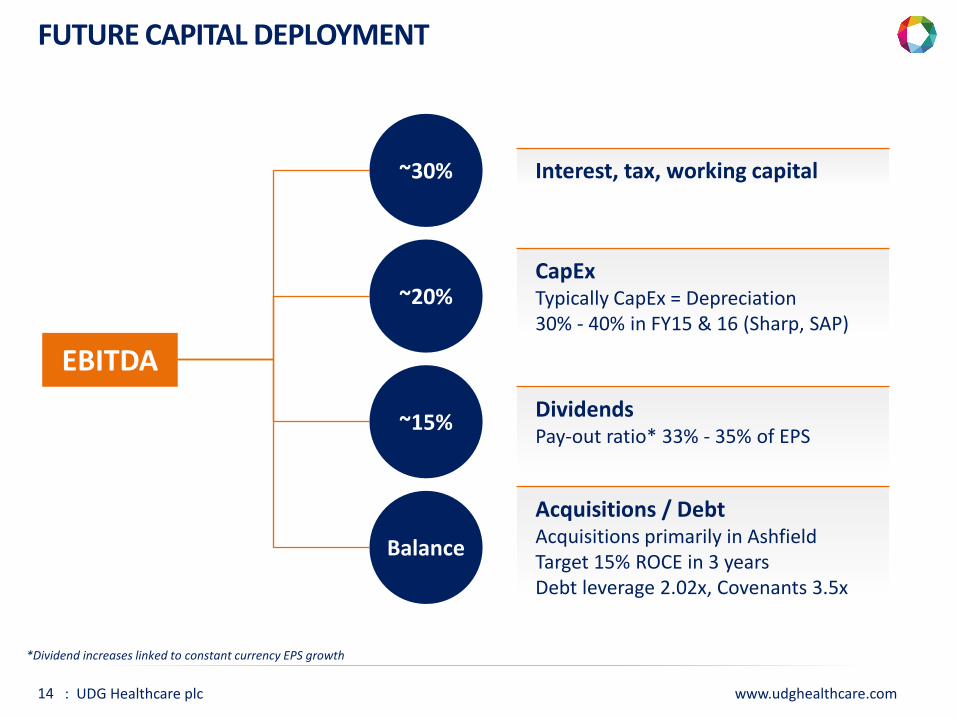
FUTURE CAPITAL DEPLOYMENT
EBITDA
~30%
~20%
~15%
Balance
Interest, tax, working capital
CapEx Typically CapEx = Depreciation 30% - 40% in FY15 & 16 (Sharp, SAP)
Dividends Pay-out ratio* 33% - 35% of EPS
Acquisitions / Debt Acquisitions primarily in Ashfield Target 15% ROCE in 3 years Debt leverage 2.02x, Covenants 3.5x
*Dividend increases linked to constant currency EPS growth
www.udghealthcare.com : UDG Healthcare plc 15
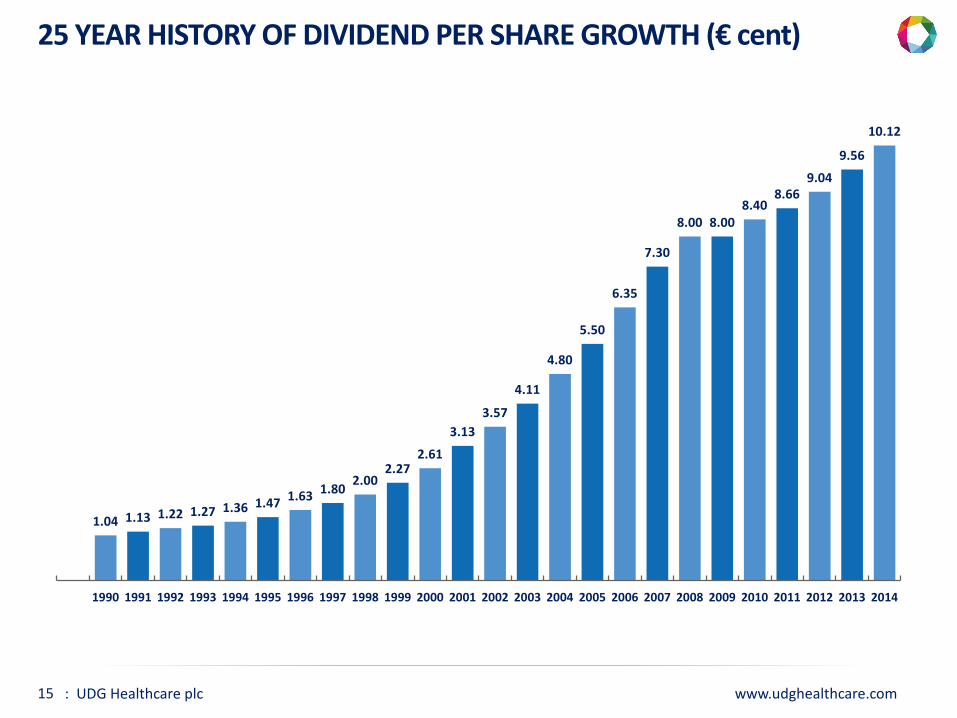
25 YEAR HISTORY OF DIVIDEND PER SHARE GROWTH (€ cent)
1.04 1.13 1.22 1.27 1.36 1.47 1.63 1.80 2.00 2.27
2.61
3.13 3.57
4.11
4.80
5.50
6.35
7.30
8.00 8.00 8.40
8.66 9.04
9.56
10.12
1990 1991 1992 1993 1994 1995 1996 1997 1998 1999 2000 2001 2002 2003 2004 2005 2006 2007 2008 2009 2010 2011 2012 2013 2014
www.udghealthcare.com : UDG Healthcare plc 16
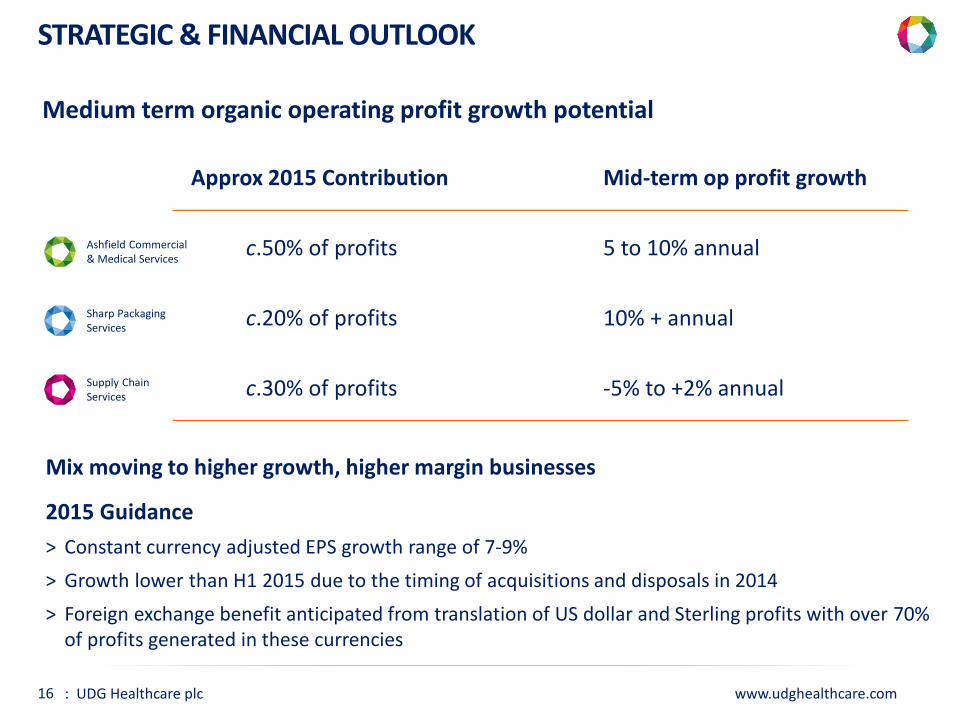
STRATEGIC & FINANCIAL OUTLOOK
Approx 2015 Contribution Mid-term op profit growth
c.50% of profits 5 to 10% annual
c.20% of profits 10% + annual
c.30% of profits -5% to +2% annual
Ashfield Commercial & Medical Services
Supply Chain Services
Sharp Packaging Services
Medium term organic operating profit growth potential
Mix moving to higher growth, higher margin businesses
2015 Guidance ˃ Constant currency adjusted EPS growth range of 7-9% ˃ Growth lower than H1 2015 due to the timing of acquisitions and disposals in 2014 ˃ Foreign exchange benefit anticipated from translation of US dollar and Sterling profits with over 70%
of profits generated in these currencies
www.udghealthcare.com 17 : UDG Healthcare plc
Q & A