Embed Size (px)
Citation preview

www.udghealthcare.com
UDG Healthcare plcFY20 Interim Results Presentation & Group Overview
19th May 2020
www.udghealthcare.com
6 months to 31st March 2020

www.udghealthcare.com2
This Presentation has been prepared by UDG Healthcare plc and contains certain forward-looking statements, beliefs or opinions, including statements with respect to the Group's business, financial condition and operational results.
Forward looking statements
Some statements in this announcement are or may be forward lookingstatements. In particular, any statements that express forecasts,expectations and projections with respect to future matters, includingtrends in results of operations, margins, growth rates, overall market trends,the impact of interest or exchange rates, the availability of financing,anticipated cost savings and synergies and the execution of the Group’sstrategy, are forward looking statements. They represent expectations forthe Group’s business, including statements that relate to the Group’s futureprospects, developments and strategies, and involve risks and uncertaintiesboth general and specific, because they relate to events and depend uponcircumstances that will occur in the future. The Group has based theseforward looking statements on assumptions regarding present and futurestrategies of the Group and the environment in which it will operate in thefuture. However, because they involve known and unknown risks,uncertainties and other factors including but not limited to generaleconomic, political, financial, health, security and business factors, as well as
international, national and local conditions which are beyond the Group’scontrol, actual results, performance, operations or achievements expressedor implied by such forward looking statements may differ materially fromthose expressed or implied by such forward looking statements andaccordingly you should not rely on these forward looking statements inmaking investment decisions. Any forward looking statements speak only asof the date they are made and, except as required by applicable law orregulation, neither the Group nor any other party intends to update orrevise these forward-looking statements after the date these statementsare published, whether as a result of new information, future events orotherwise. Nothing in this document should be construed as a profitforecast. UDG Healthcare plc and its directors accept no liability to thirdparties.

www.udghealthcare.com3
Presentation agenda
Introduction & H1 FY20 overviewBrendan McAtamney, CEO
H1 FY20 financial overviewNigel Clerkin, CFO
Divisional & strategic reviewBrendan McAtamney, CEO
Summary
COVID-19 updateBrendan McAtamney, CEO
www.udghealthcare.com4
Brendan McAtamney Chief Executive Officer, UDG Healthcare plc

www.udghealthcare.com5
UDG Healthcare is a FTSE 250 global leader in the healthcare advisory, communications, commercial, clinical and packaging services industries.
Operating across two divisions, Ashfield and Sharp, UDG provides outsourced services which enable over 300 healthcare companies from large pharmaceutical to small biotech to bring their products to market, supporting patients to access and adhere to their medications and educating and communicating effectively with healthcare professionals and patients on these products.
UDG Healthcare overview
5 year operating profit
CAGR
9,000employees
MSCI ESG Rating
ListedCountries29
pharma companies as
clients
Underpinned by positive market dynamics
Growth of global pharma market and R&D spend
Increase in number of FDA drug approvals
Growing proportion of specialty medicines
Healthcare companies outsourcing to global partners

www.udghealthcare.com6
.*Operating profit and EPS are before the amortisation of acquired intangible assets, transaction costs and exceptional items.
+24%Operating Profit*
+24% constant currency
ROCEIncreased from
12.2% in H1 FY19
EPS*+16% constant
currency
Net Revenue+10% constant
currency
Net Operating Margin
Increased from12.0% in H1 FY19
97% FCF Conversion
Strong H1 FY20 financial performance

www.udghealthcare.com7
The diversified shape of UDG Healthcare
Business Unit Net Revenue Split
Ashfield Communications & AdvisoryAshfield Commercial & ClinicalSharp
Geographic Revenue Split Customer Concentration (Revenue)
66%
18%
16%8%
34%58%
North AmericaUKRest of World / Other
# 1 Customer# 2 -10 CustomersOther Customers
34%
35%
31% 51%
21%
28%
Business Unit Operating Profit Split
www.udghealthcare.com8
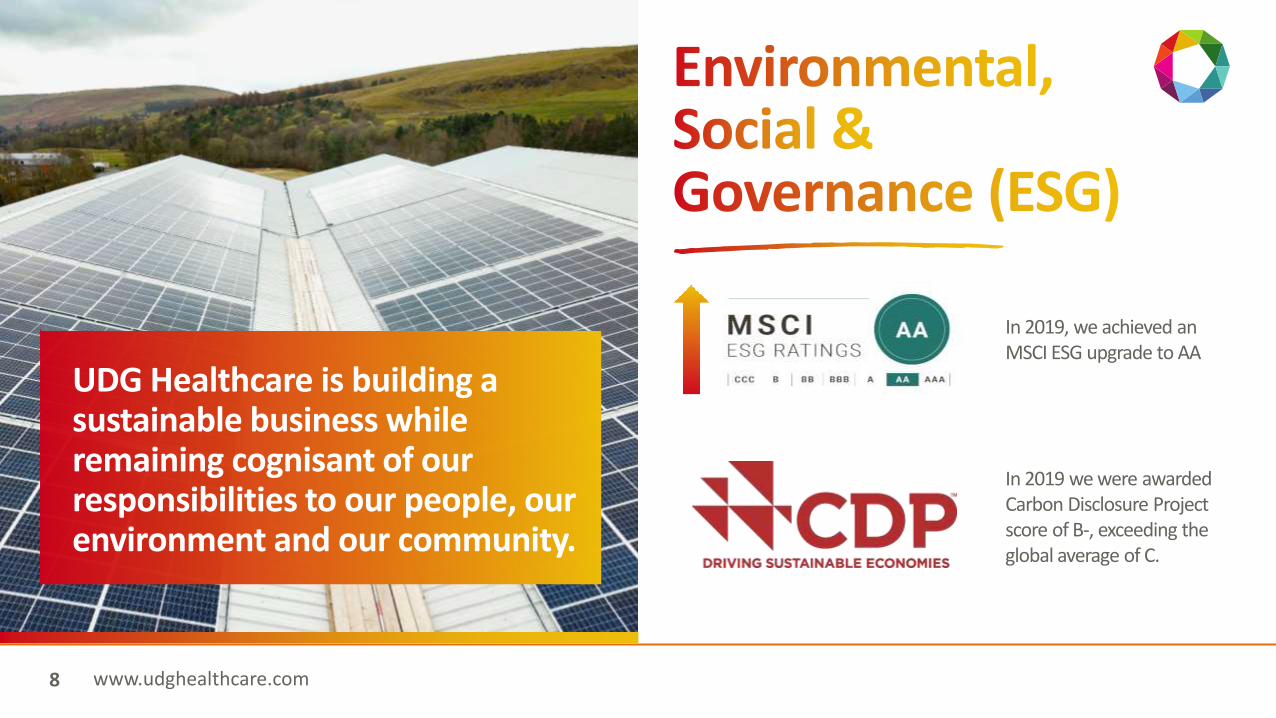
UDG Healthcare is building a sustainable business while remaining cognisant of our responsibilities to our people, our environment and our community.
In 2019, we achieved an MSCI ESG upgrade to AA
In 2019 we were awarded Carbon Disclosure Project score of B-, exceeding the global average of C.

www.udghealthcare.com9

www.udghealthcare.com10
COVID-19 Response
Protecting the wellbeing of our people
Delivering for our clients
Supporting local
communities
Business impact
assessment
CSR
Cost management
& liquidity

www.udghealthcare.com11
COVID-19 Response – Protecting the wellbeing of our people
CSRProtecting the wellbeing of our people
Delivering for our clients
CSRSupporting
local communities
CSRBusiness impact
assessment
CSRCost
management & liquidity
Since the start of the COVID-19 outbreak, our priority has been the health and wellbeing of our people and their families:
Global Response Team
Additional health and safety measures
Seamlessly working from home
Wellbeing initiatives
www.udghealthcare.com12
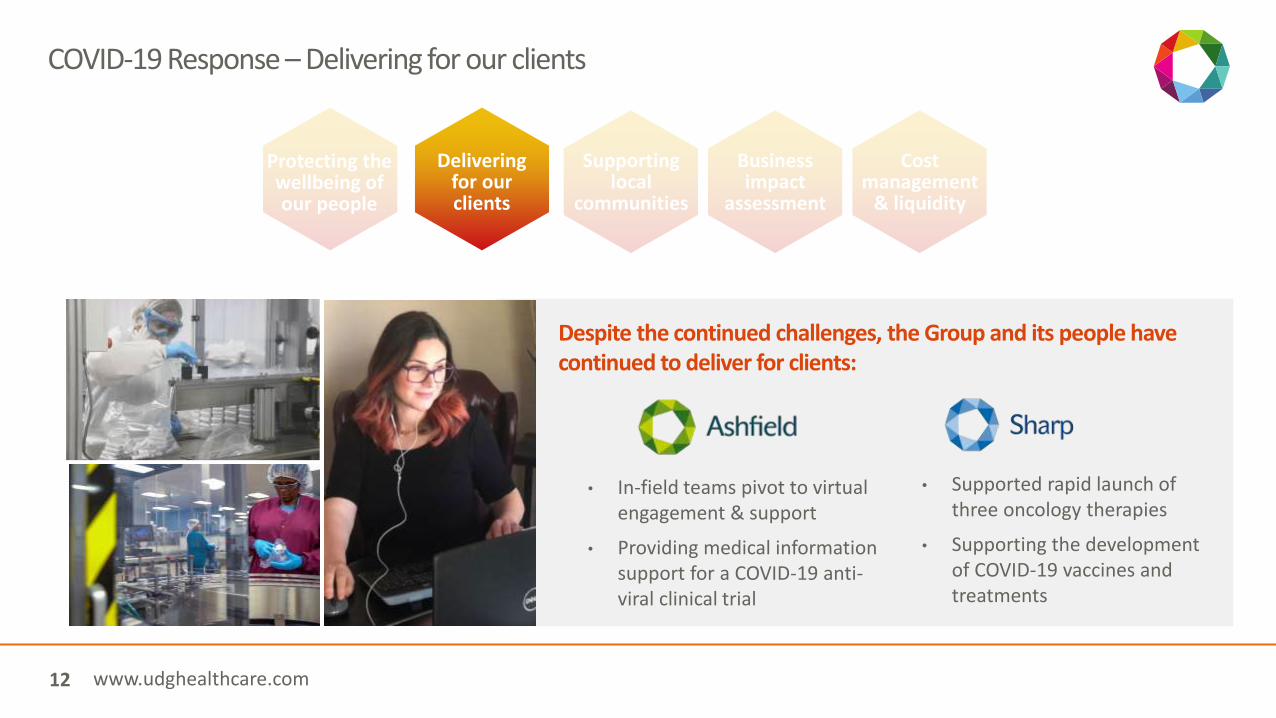
COVID-19 Response – Delivering for our clients
Despite the continued challenges, the Group and its people have continued to deliver for clients:
CSRProtecting the wellbeing of our people
Delivering for our clients
CSRSupporting
local communities
CSRBusiness impact
assessment
CSRCost
management & liquidity
• Supported rapid launch of three oncology therapies
• Supporting the development of COVID-19 vaccines and treatments
• In-field teams pivot to virtual engagement & support
• Providing medical information support for a COVID-19 anti-viral clinical trial

www.udghealthcare.com13
COVID-19 Response – Supporting local communities
CSRProtecting the wellbeing of our people
Delivering for our clients
CSRSupporting
local communities
CSRBusiness impact
assessment
CSRCost
management & liquidity
Donating personal protective equipment to hospitals and surplus raw materials for face shields
Donating to local foodbanks and hospitals to support our communities
Supporting #fuellingthefrontline and #FeedTheHeroes
Greg Flynn, President of Ashfield Commercial & Clinical, delivering food parcels to the elderly in Philadelphia
#MarkforHeroes
www.udghealthcare.com14
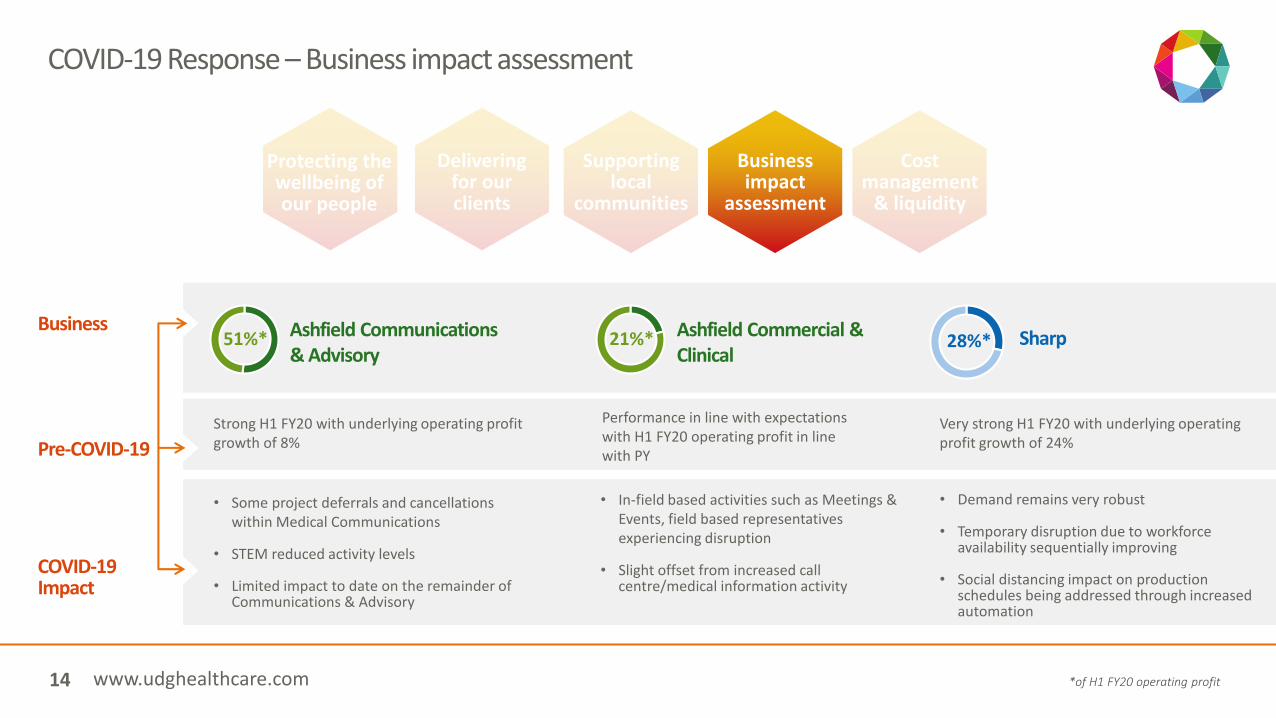
COVID-19 Response – Business impact assessment
CSRProtecting the wellbeing of our people
Delivering for our clients
CSRSupporting
local communities
CSRBusiness impact
assessment
CSRCost
management & liquidity
51%* Ashfield Communications & Advisory
Business
Pre-COVID-19
COVID-19 Impact
Strong H1 FY20 with underlying operating profit growth of 8%
• Some project deferrals and cancellations within Medical Communications
• STEM reduced activity levels
• Limited impact to date on the remainder of Communications & Advisory
Ashfield Commercial & Clinical
Performance in line with expectations with H1 FY20 operating profit in line with PY
• In-field based activities such as Meetings & Events, field based representatives experiencing disruption
• Slight offset from increased call centre/medical information activity
21%*
Very strong H1 FY20 with underlying operating profit growth of 24%
• Demand remains very robust
• Temporary disruption due to workforce availability sequentially improving
• Social distancing impact on production schedules being addressed through increased automation
28%* Sharp
*of H1 FY20 operating profit

www.udghealthcare.com15
COVID-19 Response – Cost management & liquidity
Suspended interim dividend for H1 FY20
CSRProtecting the wellbeing of our people
Delivering for our clients
CSRSupporting
local communities
CSRBusiness impact
assessment
CSRCost
management & liquidity
Implementing cost control measures to mitigate the potential negative impacts from COVID-19
Board and Senior Executive Team fee and base salary cut
Group’s financial position remains robust with net debt / EBITDA of 0.3x

www.udghealthcare.com16
UDG Healthcare is well positioned beyond the near-term challenges of COVID-19
Excellent market fundamentals
Very talentedand dedicated people
Strong and diversified
business
Robust financial position

www.udghealthcare.com17
Nigel ClerkinChief Financial Officer, UDG Healthcare plc

18 UDG Healthcare plcwww.udghealthcare.com18
H1 FY20 Financial Summary
H1 FY19 H1 FY20 % CC Increase^ % Underlying Increase~
Net Revenue $546.2m $596.2m ↑10% ↑4%
Operating profit* $65.6m $81.3m ↑24% ↑10%
EPS (C)* 20.32 23.64 ↑16% ↑5%
ROCE
12.2%H1 FY19
14.1%H1 FY20
Net Operating Margin
12.0%H1 FY19
13.6%H1 FY20
^ The average H1 FY20 exchange rates were $1:€0.9051 and $1:£0.7797 (H1 FY19 $1:€0.8783 and $1:£0.7725)
~ Throughout this presentation, references to underlying growth are financial metrics adjusted for the impact of currency translation movements and any acquisition or disposal activity
*Before amortisation of acquired intangible assets, transaction costs and exceptional items.
.

19 UDG Healthcare plcwww.udghealthcare.com19
H1 FY20 Divisional Overview - Continued strong performance across both divisionsOperating profit ($m)
47.4
18.2
58.6
22.7
Ashfield Sharp
+24% CC ↗
+24% CC ↗
^ Throughout this presentation, references to underlying growth are financial metrics adjusted for the impact of currency translation movements and any acquisition or disposal activity.* Net operating margin adjusts for pass-through revenues upon which no margin is earned
• Underlying ̂net revenue flat
• Underlying ̂operating profit increased by +5%
• Net operating margin increased to 14.3%
• Underlying ̂net revenue increased by +13%
• Underlying ̂operating profit growth of +24%
• Net operating margin increased to 12.2%
NET OPERATING MARGIN*
12.5% 14.3% 11.0% 12.2%
UNDERLYING^ NET REVENUE GROWTH RATE
- +13%
UNDERLYING^ OPERATING PROFIT GROWTH RATE
+5% +24%

20 UDG Healthcare plcwww.udghealthcare.com20
Strong H1 FY20 EPS growth from both underlying growth and acquisitions
GROUP EPS ($c) +16%
Constant Currency EPS Growth +16%23.6c
20.3c
+5% +11%
Underlying operating profit: +10% Tax: (3%)
Interest: (2%)

21 UDG Healthcare plcwww.udghealthcare.com21
Continued strong free cashflow conversion in H1 FY20
H1 FY20 Net Debt: $58m
Opening Net Debt
EBITDA Working Capital
Capex DividendsTax, Interest, & Capital Lease Repayments
Acquisitions & Disposals
ClosingNet Debt*
Net Debt/EBITDA: 0.3x
FCF Conversion: 97%
*Net debt excludes lease liabilities associated with the adoption of IFRS 16
(20)
Medium-term FCF % target raised to 65%-70%

22 UDG Healthcare plcwww.udghealthcare.com22
Strong balance sheet and liquidity position
*The unsecured loan notes and senior bank facilities are subject to compliance with certain covenants including a leverage covenant (net debt to annualised EBITDA) not to exceed 3.5:1. Leverage covenants exclude the impact of IFRS 16.
H1 FY20 Net Debt/EBITDA
Leverage covenant of 3.5x*
$151m
cash
at H1 FY20
$230m
Leverage covenant of 3.5x*
Undrawn fully committed RCF
Low leverage Robust liquidity Access to funding
0.3x
Strong cash position

23 UDG Healthcare plcwww.udghealthcare.com23
Strong balance sheet to support continued investment priorities
• Medium-term guidance of approx. $50m per annum
• Investments in infrastructure, talent, and systems
• Proud 30 year+ history of consistent dividend growth –however, FY20 interim dividend currently suspended due to COVID-19 uncertainty
• Completed 23 acquisitions (c. $880m) and 5 disposals (c. $635m) since 2012
• Net debt to EBITDA 0.3x at 31st
March 2020Reinvestment
to support continued
sustainable growth
Progressive shareholder
returns policy
Acquisitions in line with
strategic priorities
All investments are subject to a 3-year 15% ROCE hurdle

www.udghealthcare.com24

www.udghealthcare.com25
Ashfield Communications & Advisory – H1 FY20 financial overview
51%
% of H1 FY20 Group Operating Profit
^ Throughout this presentation, references to underlying growth are financial metrics adjusted for the impact of currency translation movements and any acquisition or disposal activity. * Net operating margin adjusts for pass-through revenues upon which no margin is earned.
• Strong performance in H1 FY20 with net revenue growth of +30% and operating profit growth of +37% , driven by good underlying growth and the benefit of acquisitions
• On an underlying^ basis, net revenue growth of +7% and operating profit growth of +8%
• Net operating margins* increased to 20.4%
6m to 31st March 2020$m H1 FY19 H1 FY20
% Change
% ConstantCurrency
% Underlying^ Growth
Net Revenue 154.5 201.0 +30% +31% +7%
Operating Profit 30.0 41.1 +37% +37% +8%
Net Operating Margin* 19.4% 20.4% +100bps - -

www.udghealthcare.com26
Ashfield Commercial & Clinical – H1 FY20 financial overview
^ Throughout this presentation, references to underlying growth are financial metrics adjusted for the impact of currency translation movements and any acquisition or disposal activity. *Net operating margin adjusts for pass-through revenues upon which no margin is earned.
21%
% of H1 FY20 Group Operating Profit
• Performance in line with previously communicated expectations
• Net revenue declined on a reported basis, including the disposal of Ashfield’s pharmacovigilance business
• On a reported basis, operating profit growth of +1%, reflecting the benefit of 2019 restructuring
• Net operating margins increased to 8.3%
6m to 31st March 2020$m H1 FY19 H1 FY20
% Change
% ConstantCurrency
% Underlying^ Growth
Net Revenue 226.1 209.4 (7%) (6%) (5%)
Operating Profit 17.4 17.5 +1% - -
Net Operating Margin* 7.7% 8.3% +60bps - -

www.udghealthcare.com27
Payor
Patient
HealthcareProfessional
Data/Analytics
Digital
Face to face
Ashfield Commercial and
Clinical
Ashfield Communications
Ashfield Advisory
Call CentreNurse/PSPSales RepsMeetings
Digital ContentCreative ContentScientific Content
ResearchAudit
Management Consulting
1997 2010 2016 2020
Successful strategic execution and evolution within Ashfield

www.udghealthcare.com28
Continued strategy execution in Ashfield
Communications & Advisory accounts for 70% of Ashfield’s operating profits
Increasing examples of cross collaboration
Disposal of Ashfield Pharmacovigilance
70%

www.udghealthcare.com29
Collaboration and cross selling - An integrated client solution from Ashfield
Nurse led, patient support programme secured by
Ashfield Commercial & Clinical and MicroMass in Q1 FY20
3 year contract to design the overall patient experience strategy and execute an omnichannel patient support programme
Programme to launch in H2 FY20, delivered by nurse clinical educators
from Ashfield’s contact centre in Fort Washington supported by
MicroMass’ behavioural science programmes and insights
New solution for the client who has not previously delivered a patient support programme, delivered to patients with high levels of treatment failure and adherence issues

www.udghealthcare.com30

www.udghealthcare.com31
Sharp – H1 FY20 financial overview
% of H1 FY20 Group Operating Profit
^ Throughout this presentation, references to underlying growth are financial metrics adjusted for the impact of currency translation movements and any acquisition or disposal activity.
.
• Strong underlying^ growth with revenue increasing by +13% and operating profit increasing by +24%
• Strong growth driven by continued increased demand for the packaging of serialised biotech and specialty products
• Well positioned to serve this continued increase in demand following investments made during 2019 and recent capacity expansion / acquisition
6m to 31st March 2020$m H1 FY19 H1 FY20
% Change
% ConstantCurrency
% Underlying^ Growth
Revenue 165.6 185.8 +12% +13% +13%
Operating Profit 18.2 22.7 +25% +24% +24%
Operating Margin 11.0% 12.2% +120bps - -
28%

www.udghealthcare.com32
Continued strategic progress in Sharp
Completion of Sharp US commercial capacity expansion
Acquisition of a packaging facility near Allentown, Pennsylvania for approximately $5 million
Sharp Europe site consolidation on track

www.udghealthcare.com33

www.udghealthcare.com34
Completed 23 acquisitions since 2012, complementing good underlying growth
Bethlehem site
Acquisitions 2012 2013 2014 2016 2017 2018
DisposedDisposed Disposed
2019 2020
Disposed
Macungie site

www.udghealthcare.com35
Continuous record of strong operating profit growth
Ashfield and Sharp combined operating profit CAGR of +14%
since FY14
*Excludes Aquilant*Based on IAS 18 historical operating profit performance
Ashfield Sharp
Operating Profit Growth: Ashfield and Sharp ($m)*
57.5 68.3 70.681.6
98.4 108.4
25.9
34.0 38.241.3
45.850.0
83.4
102.3108.8
122.9
144.2158.4
FY14 FY15 FY16 FY17 FY18 FY19

www.udghealthcare.com36
Summary & outlook
Medium Term Outlook
Strong H1 FY20 financial
performance
Robust balance sheet and
liquidity profile
Managing the impact of COVID-19
Strong long-term market
fundamentals
Ashfield medium term underlying operating
profit growth
5-10%
Sharp medium term underlying operating
profit growth
>10%
Medium term Free Cash Flow
conversion rate
65 -70%
Capex per annum (Inc. $35m maintenance
capex)
$50m15%
3-year ROCE hurdle rate for all
investments
FY20 financial guidance
withdrawn

www.udghealthcare.comwww.udghealthcare.com
UDG Healthcare plcGroup Overview
6 months to 31st March 2020

www.udghealthcare.com38
Our strategy is to grow and improve our organisation by providing market-leading outsourced services to our clients, outstanding development opportunities for our people, and long term sustainable value for our shareholders.
Executing our strategy
Strategic pillarsOur roadmap to achieving our strategy is built around three
strategic pillars2.
Transforming through people
3.
Continuous improvement
Geographic and service
growth
Client focus and
commercial excellence
Talent and people
Quality and compliance
Improve productivity
In turn our strategic objectives provide clarity and direction on how we deliver our strategy and enable
us to evaluate our progress
Strategic objectives
1.
Developing and growing market
leading positions

www.udghealthcare.com39
UDG Healthcare overview
Supplemented with inorganic growth
BusinessMarket
FundamentalsDivisional Growth
DriversUnderlying
Medium-Term Outlook
of H1 FY20 Operating Profit72%
of H1 FY20 Operating Profit28%
• $6bn market size• 5% Growth CAGR• 15% Outsourcing
• $10bn market size• 3-8% Growth CAGR• 40-50% Outsourcing
• $6bn market size• 6-8% Growth CAGR• 25% Outsourcing
• $7bn market size• 6-8% Growth CAGR• 50% Outsourcing
Commercial & Clinical:
Comms & Advisory:
Commercial Packaging:
Clinical Services:
Commercial & Clinical• Market growth supported by new drug launches• Growth in outsourcing levels• Demand for innovative, multi-channel offerings
Communications & Advisory• Specialty products increasing demand for
multichannel and digital communications• Fragmented market, benefits for scale players • Cross-selling opportunities
Sharp• Increasing outsourcing penetration • Demand for secondary packaging of
injectable products• Client demand for strategic
relationships from clinical services through to commercial services
>
5-10% Underlyingoperating
profit growth
10% +Underlying operating
profit growth
M&A

www.udghealthcare.com40
Business overview
A global leader in contract clinical, manufacturing, packaging and technology services
28%of H1 FY20Operating Profit
Medium term operating profit growth outlook*
*Underlying growth
A global leader in healthcare advisory, communications, commercial and clinical services for the pharmaceutical and healthcare industries
5-10%72%of H1 FY20Operating Profit
Medium term operating profit growth outlook*
Phase 1-3 Prelaunch Launch In Market
Advisory
Healthcare Communications
Commercial & Clinical
Commercial
Clinical
>10%

www.udghealthcare.com41
Investment proposition
1. Positive market dynamics with growing FDA approvals
and trend towards increased outsourcing
2. Global presence and strong market positions,
diversified by geography, services and customers
3. Not directly linked to drug pricing, fee for
service model
4. Clear medium term underlying operating profit growth guidance
5. Strong balance sheet to support M&A
6. Investments to support sustainable growth

www.udghealthcare.com42

www.udghealthcare.com43
Ashfield Overview
72%
57.5
68.3 70.6
81.6
98.4108.4
FY14 FY15 FY16 FY17 FY18 FY19
*Adjusted for amortisation of acquired intangible assets, transaction costs, and exceptional items
Operating profit* ($m)
A global leader in healthcare advisory, communications, commercial and clinical services
7,200People across 28 countries
Delivering services in
more than 50 COUNTRIES
Partnering with the top
30 GLOBAL PHARMA COMPANIES
TRANSFORMEDCommunications & Advisory accounts for approximately 70% of operating profits of Ashfield
*Based on IAS 18 historical operating profit performance
www.udghealthcare.com44
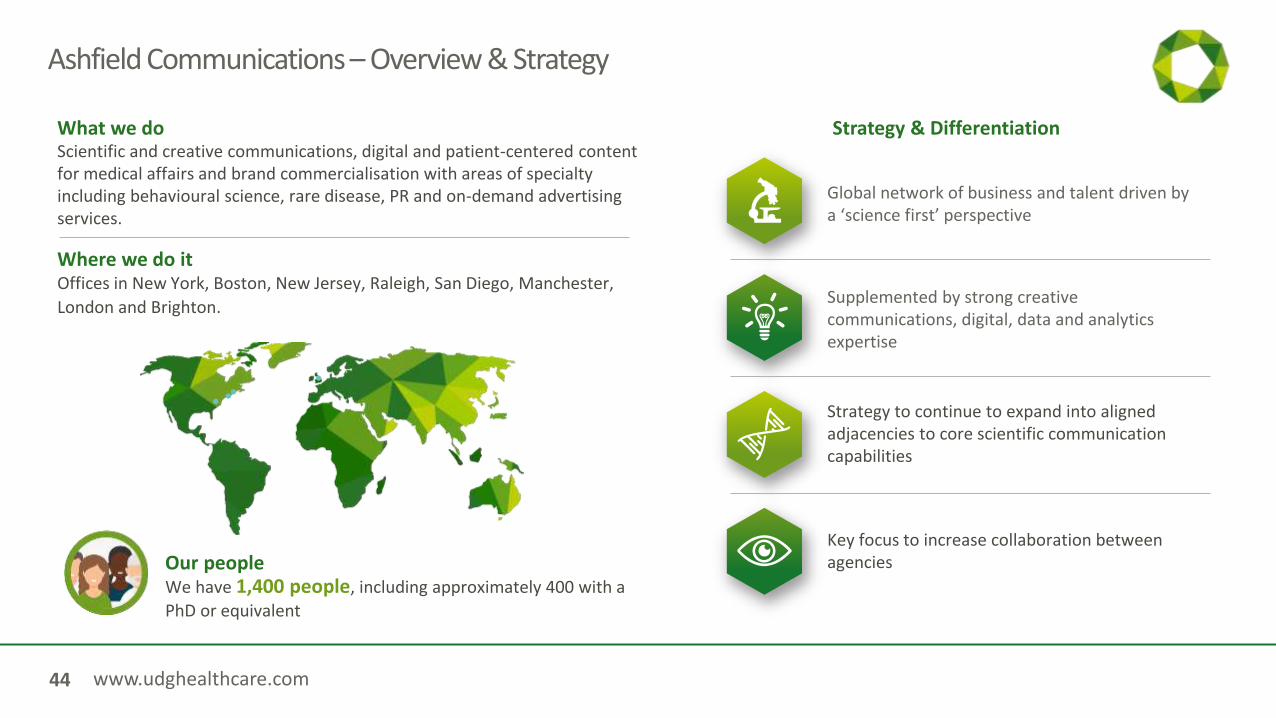
Supplemented by strong creative communications, digital, data and analytics expertise
Ashfield Communications – Overview & Strategy
What we doScientific and creative communications, digital and patient-centered content for medical affairs and brand commercialisation with areas of specialty including behavioural science, rare disease, PR and on-demand advertising services.
Where we do itOffices in New York, Boston, New Jersey, Raleigh, San Diego, Manchester,
London and Brighton.
Strategy & Differentiation
Key focus to increase collaboration between agencies
Strategy to continue to expand into aligned adjacencies to core scientific communication capabilities
Global network of business and talent driven by a ‘science first’ perspective
Our peopleWe have 1,400 people, including approximately 400 with a
PhD or equivalent

www.udghealthcare.com45
Ashfield Communications – Market Overview
Competitive landscape
Broad range of peers including:
• Pureplay healthcare communications businesses (Huntsworth, Precision Health, Intouch Group, Syneos)
• Fragmented market of smaller independent agencies
• Advertising agencies (WPP, IPG, Havas, Omnicom)
Key Growth Drivers
• Increasing outsourcing penetration
• Growth of specialty products leading to increased demand for multi-channel and digital comms
• Increasing number of molecules being developed and approved
• Migration to direct patient engagement
• Growth in orphan drug and rare diseases
Estimated Ashfield market
share <5%
Outsourced Market size $7.3bn
Estimated market growth
rate 3-8%
Estimated outsourcing rate 40-45%
Margin profile 15%-25%
www.udghealthcare.com46
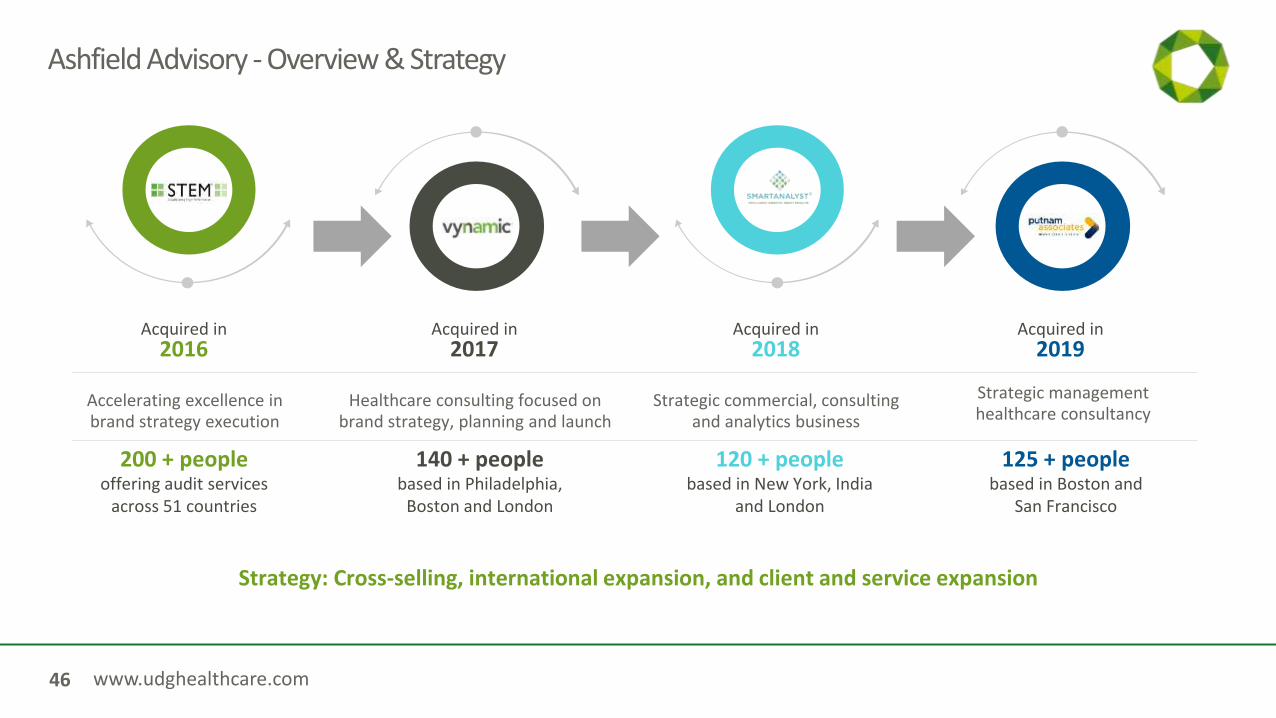
Ashfield Advisory - Overview & Strategy
Healthcare consulting focused on brand strategy, planning and launch
140 + peoplebased in Philadelphia,
Boston and London
Acquired in 2017
Strategy: Cross-selling, international expansion, and client and service expansion
Acquired in 2018
Strategic commercial, consulting and analytics business
120 + peoplebased in New York, India
and London
200 + peopleoffering audit services
across 51 countries
Acquired in 2016
Accelerating excellence in brand strategy execution
125 + peoplebased in Boston and
San Francisco
Acquired in 2019
Strategic management healthcare consultancy
www.udghealthcare.com47
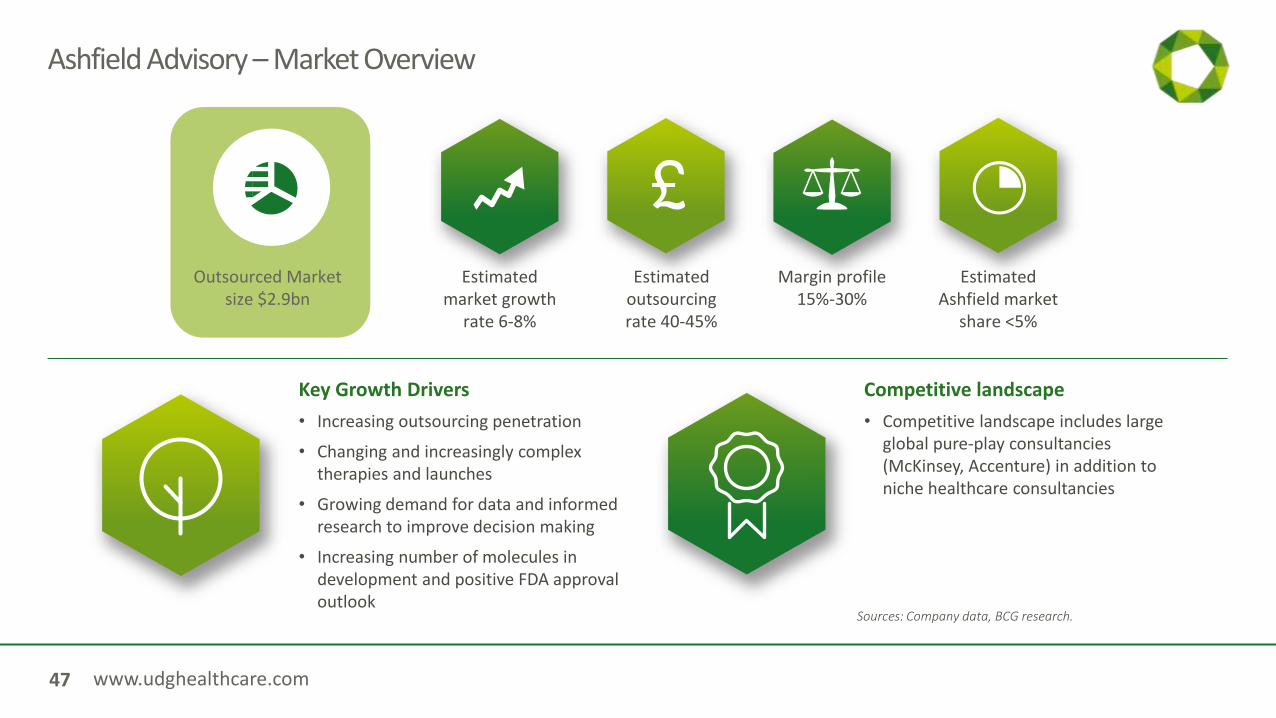
Ashfield Advisory – Market Overview
Competitive landscape
• Competitive landscape includes large global pure-play consultancies (McKinsey, Accenture) in addition to niche healthcare consultancies
Key Growth Drivers
• Increasing outsourcing penetration
• Changing and increasingly complex therapies and launches
• Growing demand for data and informed research to improve decision making
• Increasing number of molecules in development and positive FDA approval outlook
Estimated Ashfield market
share <5%
Outsourced Market size $2.9bn
Estimated market growth
rate 6-8%
Estimated outsourcing rate 40-45%
Margin profile 15%-30%
Sources: Company data, BCG research.

www.udghealthcare.com48
Ashfield Commercial and Clinical - Overview & Strategy
Ashfield continues to invest to expand and differentiate its offering.
Recent activity includes:
50%
50%
of operating profit generated from commercial/CSO related activities
of operating profit from clinical, patient support, medical information, pharmacovigilance, meetings and events and market access services
Where we do itAshfield Commercial and Clinical provides services
across
22 countries
5,100 people
50/50

www.udghealthcare.com49
Ashfield Commercial & Clinical – Market Overview
Competitive landscape
• Competitive landscape includes large players Syneos, IQVIA and TouchPoint
• In-country competitors varies by geographic market
Key Growth Drivers
• Significant potential for increased outsourcing, offsetting a decline in the total number of sales reps
• Increasing demand for innovative models,multi-channel offerings
• Growth of specialty products leading to increased complexity and support requirements
• Increasing importance of patient adherence
Ashfield market share varies by
geography
Outsourced Market size $6.1bn
Estimated market growth
rate 5%
Estimated outsourcing
rate 15%
Margin profile 7%-15%
Sources: Company data, BCG research.

www.udghealthcare.com50
Ashfield - Acquisitions In Line With Strategy
Strategic Fit / Capabilities
People & Cultural Fit
ROCE 15%+ within 3 years
M&A REMAINS A KEY PRIORITY FOR THE GROUP:
Ashfield Advisory
• Strategic consulting
• Brand consulting & advisory
• Market Access, Health Economics and Outcomes Research
• Patient, commercial & marketing audits
Ashfield Communications
• Extension of communications capabilities incorporating:
– Scientific health comms– Commercial / Creative comms– Patient engagement & behaviour – Public relations– Digital, data & analytics solutions
Ashfield Commercial & Clinical
• Strengthen contract sales capabilities
• Extend clinical / nurse services
• Expand medical information and commercial call centres
ASHFIELD KEY FOCUS AREAS INCLUDE:

www.udghealthcare.com51
Sharp Overview
*Adjusted for amortisation of acquired intangible assets, transaction costs, and exceptional items
25.9
34.038.2
41.345.8
50.0
FY14 FY15 FY16 FY17 FY18 FY19
Operating profit* ($m)
Sharp US
Sharp EU
Sharp Clinical
A global leader in contract packaging and clinical trial supply services
1,800Employees
Operations in
4 COUNTRIESBelgium, Netherlands
USA, UK
8 GMP & FDAApproved facilities
28%
*Based on IAS 18 historical operating profit performance

www.udghealthcare.com52
Addressable Outsourced Market
size $12-$14bn
Sharp – Market Overview
Competitive landscape
• Commercial competitors include large pure play Contract Packaging Organisations (CPO) such as PCI, Contract Manufacturing Organisations (CMO) and smaller scale CPO’s
• Clinical competitors include ThermoFisher, Catalent and Almac
Key Growth Drivers
• Increasing outsourcing penetration
• Demand for secondary packaging of injectable products
• Increasing requirement to access specialist technology solutions and capabilities
• Client demand for strategic relationships from clinical services through to commercial services
Estimated market growth
rate 6-8%
Estimated outsourcing rate: Commercial c. 25%-30%
Clinical c. 50%
Market share:Commercial c. 5-10%
Clinical < 5%
Sources: Company data, Deloitte research.

www.udghealthcare.com53
Sharp – Acquisitions & Investments In Line With Strategy
Strategic Fit / Capabilities
People & Cultural Fit
ROCE 15%+ within 3 years
M&A REMAINS A KEY PRIORITY FOR THE GROUP:
Sharp Commercial
• Continued investment in facilities and equipment to provide additional capacity
• Bolt on acquisitions of other commercial packaging businesses and facilities
• Expand niche manufacturing capabilities, focused on biotech / injectables / finished dose formulation
Sharp Clinical
• Expand clinical services offering to provide an integrated offering
• Focus on formulation development, analytical testing and manufacturing
• Expand geographical reach
SHARP KEY FOCUS AREAS INCLUDE:
www.udghealthcare.com54

www.udghealthcare.com55
Segmental Overview
6 months to 31 March 2020 H1 FY20 Change
Net^ Revenue $m Op Profit* $m Net^ Margin Net^ RevenueNet^ Revenue
UnderlyingOp Profit*reported
Op Profit*Underlying
Net^ Margin
Ashfield $410.4 $58.6 14.3% 8% - 24% 5% +180bp
Sharp $185.8 $22.7 12.2% 12% 13% 25% 24% +120bp
Total $596.2 $81.3 13.6% 9% 4% 24% 10% +160bp
^ Adjusted for pass-through revenues. Pass through revenues of $97.4m in H1 FY20 and $110.4m in H1 FY19. *Operating profit before amortisation of acquired intangible assets, acquisition costs and exceptional items

www.udghealthcare.com56
Ashfield Segmental Summary
6 months to 31 March 2020 H1 FY19 H1 FY19 H1 FY19 H1 FY20 H1 FY20 H1 FY20
% Change
% Change
% Change
% Change
Net^ Revenue $m Op Profit* $m Net^ MarginNet^ Revenue
$mOp Profit* $m
Net^ Margin
Net^ RevenueNet^ Revenue
Underlying Op Profit*
Op Profit* Underlying
Communications & Advisory
$154.5 $30.0 19.4% $201.0 $41.1 20.4% 30% 7% 37% 8%
Commercial & Clinical
$226.1 $17.4 7.7% $209.4 $17.5 8.3% (7%) (5%) 1% -
Total $380.6 $47.4 12.5% $410.4 $58.6 14.3% 8% - 24% 5%
^ Adjusted for pass-through revenues. Pass through revenues of $97.4m in H1 FY20 and $110.4m in H1 FY19. *Operating profit before amortisation of acquired intangible assets, acquisition costs and exceptional items

www.udghealthcare.com57
Sharp Segmental Summary
6 months to 31 March 2020 H1 FY19 H1 FY19 H1 FY19 H1 FY20 H1 FY20 H1 FY20
% Change
% Change
% Change
% Change
Revenue $m Op Profit* $m Margin Revenue $mOp Profit*
$mMargin Revenue
RevenueUnderlying
Op Profit*Op Profit* Underlying
Total $165.6 $18.2 11.0% $185.8 $22.7 12.2% 12% 13% 25% 24%
*Operating profit before amortisation of acquired intangible assets, acquisition costs and exceptional items

www.udghealthcare.com58
Key performance indicators and non-IFRS performance measures
The Group reports certain financial measurements that are not required under International Financial Reporting Standards (IFRS) which represent the generally accepted accounting principles (GAAP) under which the Group reports. The Group believes that the presentation of these non-IFRS measurements provides useful supplemental information which, when viewed in conjunction with IFRS financial information, provides stakeholders with a more meaningful understanding of the underlying financial and operating performance of the Group and its divisions.
These measurements are also used internally to evaluate the historical and planned future performance of the Group’s operations and to measure executive management’s performance based remuneration. None of the non-IFRS measurements should be considered as an alternative to financial measures derived in accordance with IFRS. The non-IFRS measurements can have limitations as analytical tools and should not be considered in isolation or as a substitute for an analysis of results as reported under IFRS.

www.udghealthcare.com59
Return on Capital Employed (ROCE) Calculation
Calculation As per Interim Statement
As at 31 March
2020$’000
As at 31 March
2019$’000
Net assets Balance Sheet 945,303 892,675
Net debt Note 13 58,239 56,780
Assets before net debtCumulative intangible amortisationCumulative restructuring costs
1,003,542226,527
20,632
949,455197,173
25,714
Total Capital Employed 1,250,701 1,172,342
Average total capital employedRolling 12 month adjusted operating profit
1,211,522170,536
1,194, 822145,753
Return on Capital Employed 14.1% 12.2%
ROCE is the adjusted operating profit expressed as a percentage of the Group’s net assets employed. Net assets employed is the average of the opening and closing net assets in the period excluding net debt adjusted for the historical amortisation of acquired intangible assets and restructuring charges.

www.udghealthcare.com60
Adjusted EBITDA Calculation
Calculation As per Interim Statement
6 monthsEnded
31 March2020
$’000
6 monthsEnded
31 March2019
$’000
12 monthsEnded
31 March2020
$’000
12 monthsEnded
31 March2019
$’000
Adjusted operating profit
Share-based payment expense
Depreciation
Depreciation of right of use assets
Amortisation of computer software
Joint venture profit share
(Profit)/loss on disposal of PP&E
Income Statement
Cash Flow Statement
Cash Flow Statement
Cash Flow Statement
Note 10
Note 4
Cash Flow Statement
81,298
2,628
11,331
8,128
4,694
(954)
(26)
65,602
2,521
11,764
-
3,657
418
(678)
170,536
4,827
22,697
8,128
9,064
(1,422)
80
145, 753
5,027
24,213
-
7,078
(403)
(744)
Adjusted EBITDA 107,099 83,284 213,910 180,924
Adjusted EBITDA is adjusted operating profit (operating profit before amortisation of acquired intangible assets, transaction costs and exceptional items) before depreciation, share-based payment expense, amortisation of computer software, the share of joint venture profits/(loss) and profit/(loss) on disposal of property, plant and equipment

www.udghealthcare.com61
UDG HEALTHCARE PLC20 RiverwalkCitywest Business CampusCitywestDublin 24 Ireland
Keith Byrne, Head of Investor Relations, Strategy & Corporate Communications
[email protected]+353 1 468 9000